1. Introduction
Autism Spectrum Disorder (ASD) affects how individuals communicate, process information, and interact with their environment. Many children with ASD face challenges maintaining attention in classroom settings and often struggle with tasks that require multi-step reasoning, interpretation of social cues, or problem-solving [
1,
2,
3]. Even with structured support, educators and caregivers frequently find it difficult to determine the most effective learning environment for each child [
2,
3,
4]. Executive functioning encompasses a range of cognitive abilities, including working memory, the capacity to shift attention in response to environmental changes, the ability to sustain focus on the task at hand, and the capacity to inhibit responses to irrelevant stimuli. While a meta-analysis of research shows the benefits of the direct instruction of math skills to students with ASD [
5], there is a need for research on executive functioning to improve math performance.
Cognitive challenges in ASD vary significantly from one student to another, making personalized education both critical and complex. In recent years, electroencephalography (EEG) has emerged as a valuable tool for investigating brain function in individuals with ASD [
6,
7,
8]. EEG captures real-time electrical activity from the brain and is particularly well-suited for children due to its non-invasive and portable nature. Several studies have utilized resting-state EEG to differentiate children with ASD from their typically developing (TD) peers [
9,
10], recording brain activity while the child remains still and unengaged in a specific task.
In contrast, task-based EEG provides insight into how brain activity shifts during specific types of engagement. For instance, Ghee et al. [
4] investigated EEG synchrostates in children viewing emotional facial expressions, achieving over 94% classification accuracy between ASD and TD groups using machine learning. Peck et al. [
11] studied infants at high risk for autism by recording EEG responses to different speech sounds, identifying patterns that predicted later ASD diagnoses. Bosl et al. [
12] asked children with autism to watch videos eliciting happy, boring, or sad emotions, then used machine learning to infer the emotional responses.
Studies on EEG markers of attention in autism show that children with ASD often display atypical frontal alpha and beta asymmetry, both during rest and task situations, which has been linked to differences in attentional control [
13,
14]. In task-based measures, autistic children also show a higher theta/beta ratio, pointing to reduced sustained attention compared to typically developing peers [
15]. At the same time, research in high-risk infants has identified early asymmetry differences, but these patterns do not fully match those found in diagnosed ASD, emphasizing the need to separate developmental risk indicators from findings in confirmed cases [
10].
These studies suggest that the task-based EEG may provide insights into functional brain differences between ASD and TD children during active engagement. While task-evoked EEG may offer neural markers associated with the cognitive processes relevant to learning, its use in personalized educational strategies would require integration with intermediate behavioral and educational outcomes, supported by evidence that links neural activity to observable learning gains.
However, there remains a significant gap in research analyzing dynamic brain activity in children with ASD during real-world classroom tasks. In everyday learning settings, children engage in a continuous stream of visual, motor, and cognitive processes solving problems, responding to stimuli, making decisions, and interpreting instructions. Capturing brain activity during these active learning moments can yield more accurate insights into how learning unfolds in children with ASD, beyond what resting-state studies reveal.
Our study aims to fill this gap by investigating how children with ASD respond to structured learning tasks that closely resemble classroom activities. We recorded EEG data as children completed three cognitive tasks, Shape Matching, Shape Sorting, and Number Matching, each designed to engage specific cognitive domains such as visuospatial reasoning, categorization, and numerical recognition. Using the MUSE 2 (InteraXon Inc., Toronto, ON, Canada) EEG headband and analyzing the data through MNE-Python [
16], we will examine patterns of brain engagement across these tasks based on the methods in our prior work [
17].
The hypothesis of this study is that EEG signals can provide a reliable index for monitoring behavior in children with ASD, with responses that differ distinctly from typically developing (TD) peers, allowing for the development of highly accurate machine learning models. Specifically, children with ASD are expected to exhibit dominant delta waves, pronounced frontal asymmetry, and unusually high Theta/Alpha Ratio (TAR) and Theta/Beta Ratio (TBR). These features are predicted to become more prominent as the learning tasks increase in difficulty. Additionally, inconsistent attention is anticipated to appear in the time–frequency dynamics of the EEG signals.
Studies highlight the potential of low-cost consumer EEG devices like MUSE 2 for neuroscience research. A study showed that MUSE 2 could reliably capture broad brainwave activity (alpha, beta, theta) and frontal asymmetry patterns despite having only four electrodes [
18], while another demonstrated that the MUSE 2 successfully detected event-related potentials such as the N400, with timing and amplitude comparable to research-grade systems [
19].
To interpret the EEG signals, we employed both traditional machine learning models and deep neural networks. This dual approach enabled us to identify which tasks elicited greater cognitive load and which brain regions were most involved. Unlike diagnostic studies, our goal is to generate practical insights that can inform personalized educational strategies tailored to each child’s cognitive strengths and difficulties.
Understanding how the ASD brain responds to real learning activities can empower educators, therapists, and curriculum designers to create inclusive classroom environments that support effective learning, not just clinical assessment. We expect that our findings contribute to bridging the gap between neuroscience research and everyday educational practice.
Recent studies show how educational technology can be applied in real learning settings. A study used EEG-based attention classification to track students’ focus and adapt learning materials in real time, improving the learning experience [
20]. Another study applied machine learning to classroom EEG data to identify cognitive patterns, helping to tailor teaching strategies to students’ needs [
21]. These examples support the applied aspect of our work and show practical ways to enhance learning with technology.
4. Conclusions
This study investigated task-based EEG patterns in children during three structured cognitive tasks such as Shape Matching, Shape Sorting, and Number Matching to explore neural indicators of learning engagement. The cognitive states of children with Autism Spectrum Disorder (ASD) were analyzed using power across five frequency bands, power ratios, and dynamic attentional behavior. Machine learning classifiers were developed to accurately distinguish ASD from typically developing (TD) based on EEG data. Key features used in the classification models were identified, and an ASD map was constructed to support interpretation and visualization. The key findings of this study are summarized below.
Children with ASD exhibited elevated delta activity across all tasks, suggesting delayed neural maturation and atypical developmental trajectories. In addition, they showed frontal alpha-to-beta asymmetry and significantly higher theta/beta ratios, particularly during more complex tasks, indicating difficulties in attention regulation and increased cognitive load.
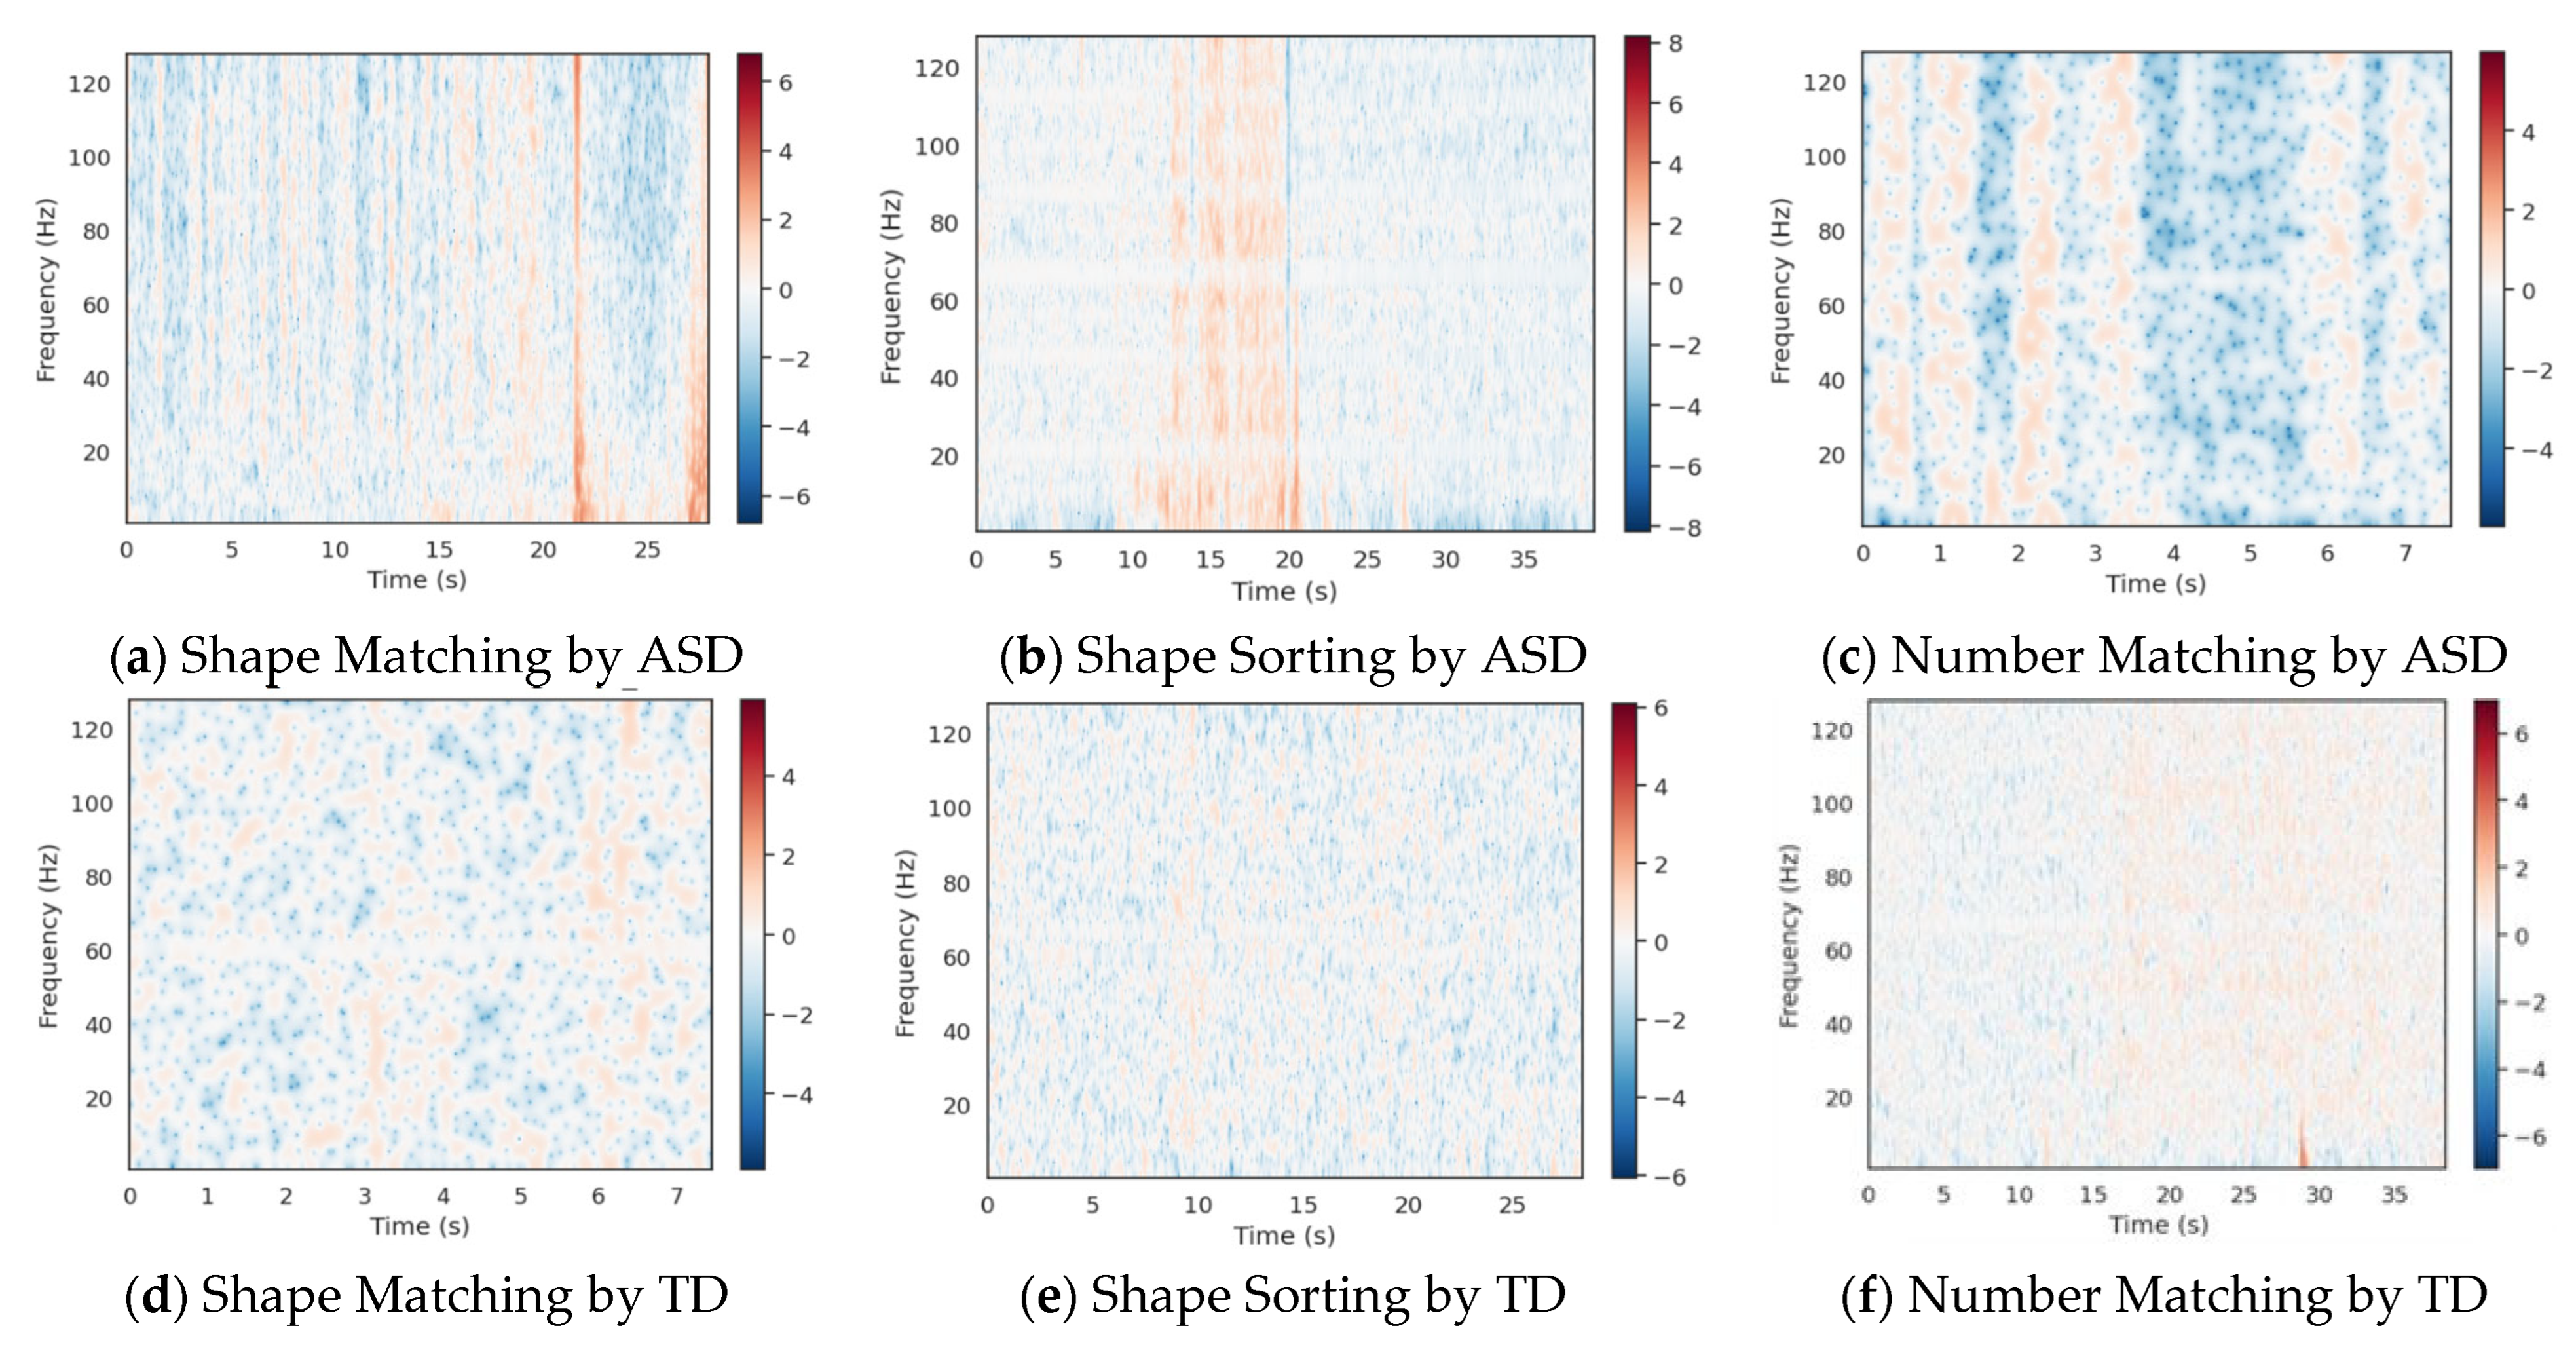
Dynamic changes in cognitive states were also examined. In the ASD group, attention levels fluctuated over time rather than remaining sustained, whereas the TD group demonstrated more consistent and stable attention throughout the tasks. Furthermore, attention patterns in the TD group remained relatively consistent across the three tasks, while those in the ASD group varied depending on the task. These results suggest that task type significantly affects attention in individuals with ASD, offering important insights for designing task-specific instructional materials or curricula aimed at improving attention in this population.
To classify ASD versus TD using EEG data, models were built using traditional machine learning algorithms (Support Vector Machine, K-Nearest Neighbors, Random Forest, and an Ensemble method), as well as a neural network. The Ensemble model achieved the highest accuracy (0.90), while the neural network provided slightly lower performance, with 0.79 for accuracy and 0.72 for F1-score.
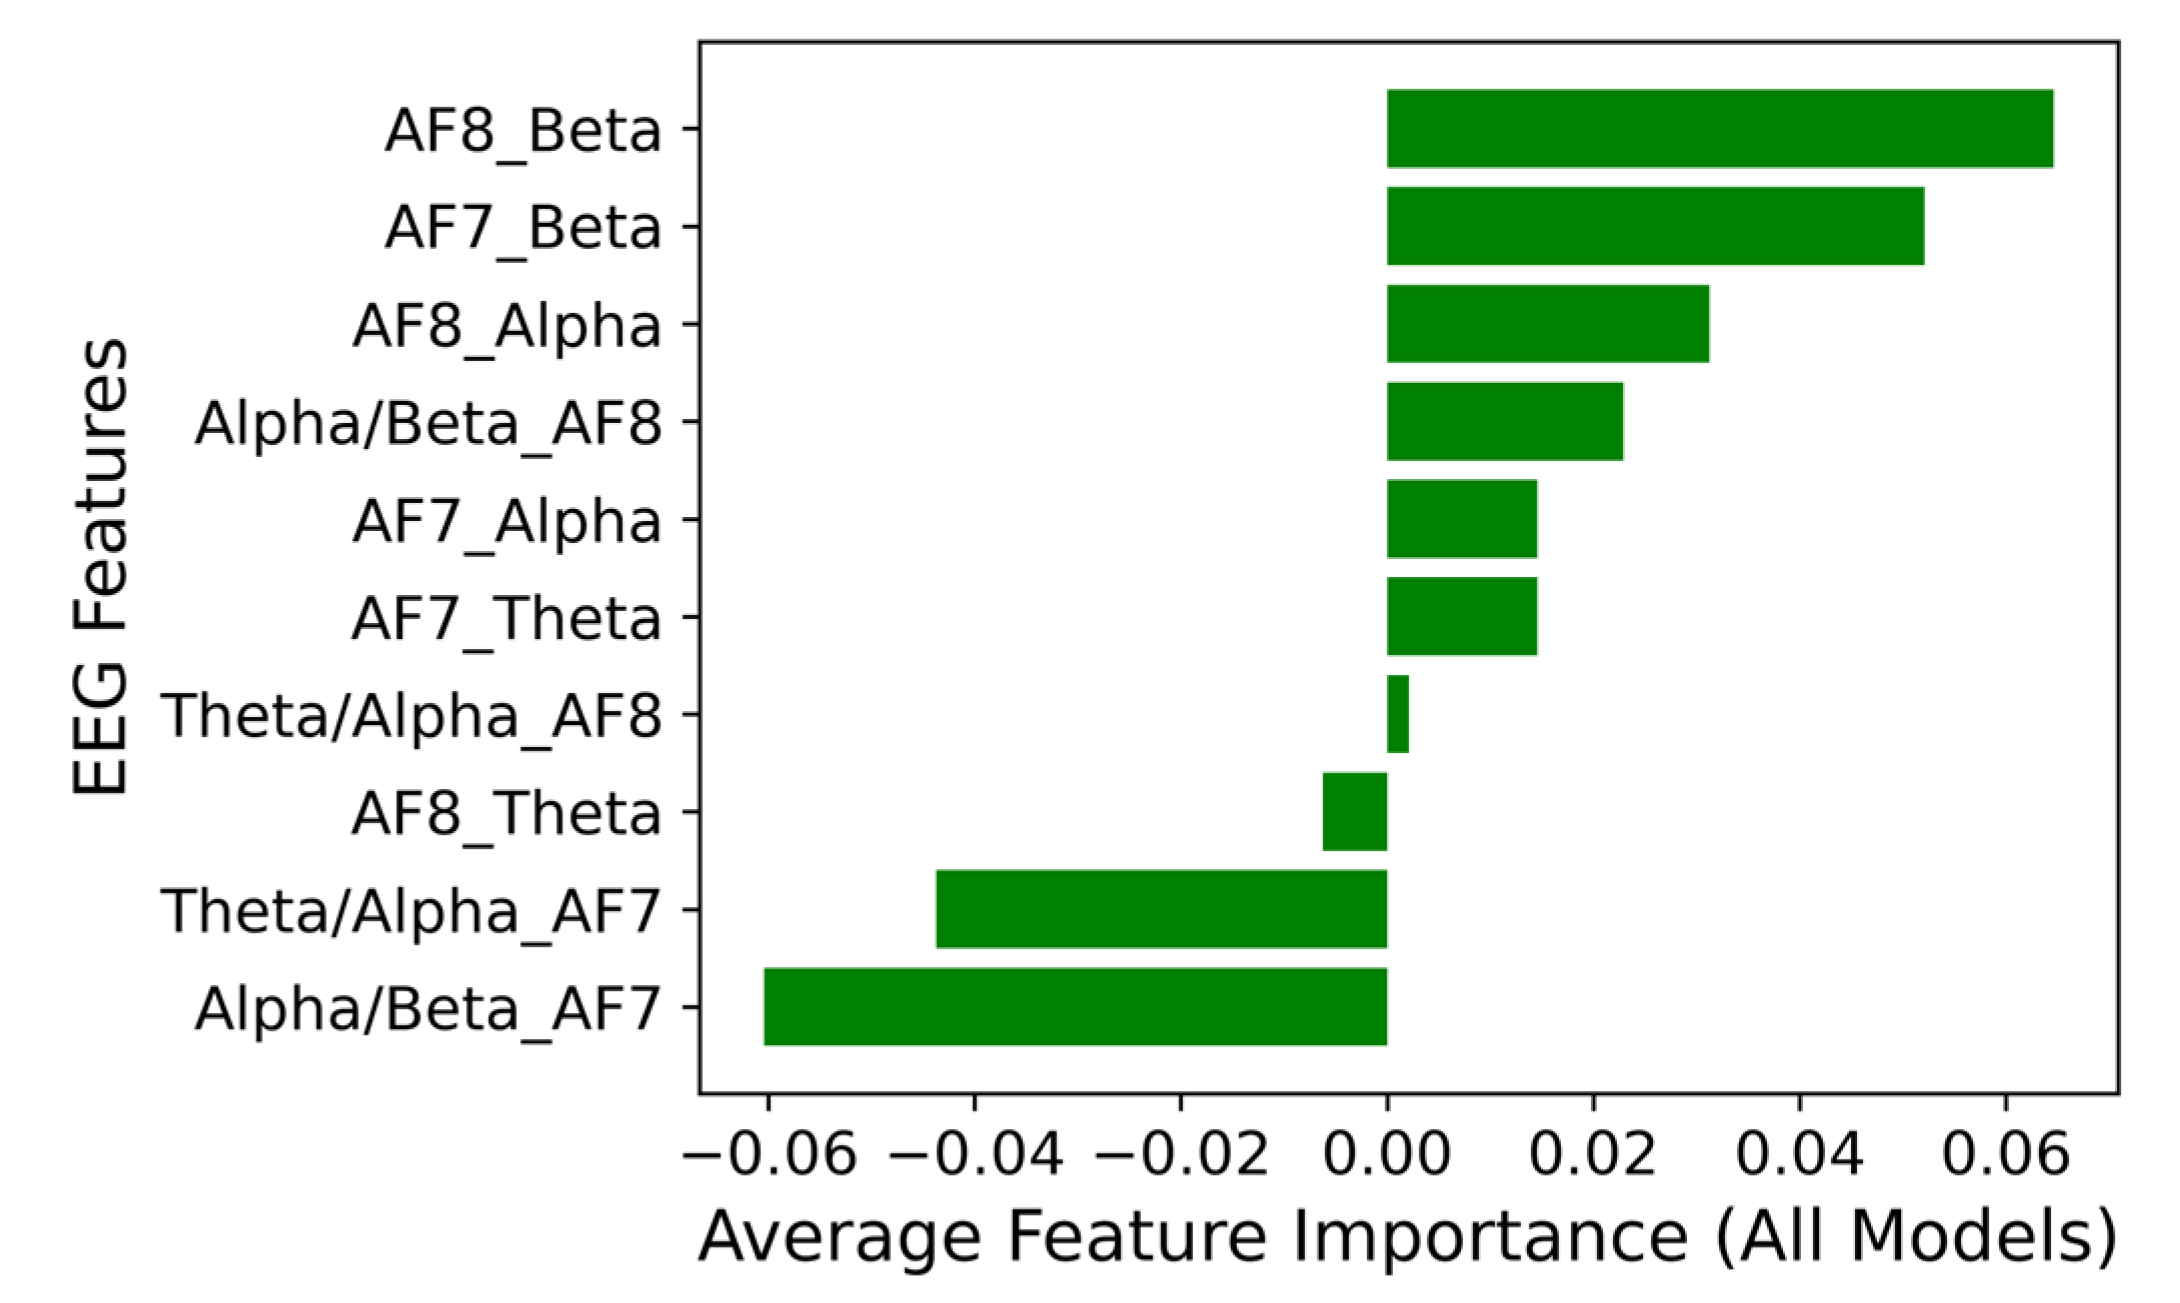
Feature importance analysis identified beta activity at electrodes AF7 and AF8 as the most discriminative EEG markers. These features were used to construct an ASD decision map, offering a clear and interpretable framework for ASD prediction and a visual means to distinguish between the two groups.
This study found that EEG signals can serve as useful indicators for monitoring the brain activity of children with ASD, whose responses differed from their TD peers, thereby supporting the study’s hypothesis. Characteristics such as dominant delta waves, pronounced frontal asymmetry, elevated theta/alpha and theta/beta ratios, and inconsistent attention patterns became more pronounced as learning tasks increased in difficulty for children with ASD. These features may hold potential as markers to guide more personalized and effective instructional approaches for individual learners with ASD; however, further research is needed before practical applications can be established.
Although the present study was carefully designed and conducted, several limitations are noted. Using only 4 EEG channels for ICA may reduce the accuracy of artifact removal. Notch filtering and EMG controls were not applied, so some residual noise may remain. The wide age range and inclusion of minimally verbal children could contribute to variability in the EEG features. Importantly, our ML pipeline was designed to avoid subject leakage by keeping each participant’s data fully within a single fold. Despite these factors, the ensemble model achieved high accuracy, and the key EEG features were consistently identified across folds and models, demonstrating robustness of the results.
Future directions for this research involve conducting studies with larger, age-matched cohorts to enhance statistical power and reduce developmental variability. Preregistration will be adopted to improve transparency and reproducibility, while participant-level nested cross-validation will be employed to strengthen the rigor of model evaluation. Longitudinal replication in classroom settings will also be pursued to evaluate ecological validity and scalability. In the present study, learning ability and attention were assessed solely through EEG data; however, incorporating additional biometric measures—such as eye movements, heart rate variability, and skin conductance—would enable a more comprehensive characterization of participants’ physiological and neurological states in children with ASD. Finally, within-subject manipulations of task difficulty will be examined to further investigate how neural and behavioral responses adapt across varying levels of cognitive challenge.
Author Contributions
Conceptualization, J.H., J.C. and K.T.C.; methodology, H.P., R.A., N.Y., J.H. and K.T.C.; software, H.P., J.H. and K.T.C.; validation, H.P. and K.T.C.; formal analysis, H.P. and K.T.C.; investigation, H.P., R.A. and N.Y.; resources, K.W., J.H., J.C. and K.T.C.; data curation, H.P., R.A., N.Y., J.H. and K.T.C.; writing—original draft preparation, H.P.; writing—review and editing, K.W., J.H., J.C. and K.T.C.; visualization, H.P., J.H. and K.T.C.; supervision, K.W., J.H., J.C. and K.T.C.; project administration, J.H., J.C. and K.T.C.; funding acquisition, J.H., J.C. and K.T.C. All authors have read and agreed to the published version of the manuscript.
Funding
This research was funded by T-rise grant at Northern Illinois University.
Institutional Review Board Statement
The study was conducted in accordance with the Declaration of Helsinki, and approved by the Institutional Review Board of NORTHERN ILLINOIS UNIVERSITY (HS25-0128; 27 November 2024) for studies involving humans.
Informed Consent Statement
Informed consent was obtained from all subjects involved in the study.
Data Availability Statement
Acknowledgments
Authors, H. Penmetsa, R. Abbasi, N. Yellamilli, K. Winkelman, J. Chan, J. Hwang, and K. Cho, acknowledge the support from Westside Children’s Therapy to conduct the tests.
Conflicts of Interest
Author Kimberly Winkelman was employed by the company Westside Children’s Therapy. The remaining authors declare that the research was conducted in the absence of any commercial or financial relationships that could be construed as a potential conflict of interest.
References
- Gabard-Durnam, L.J.; Wilkinson, C.; Kapur, K.; Tager-Flusberg, H.; Levin, A.R.; Nelson, C.A. Longitudinal EEG power in the first postnatal year differentiates autism outcomes. Nat. Commun. 2019, 10, 4188. [Google Scholar] [CrossRef]
- Da, F.; Ma, Y.; Ma, M.; Mao, J.; Weng, Z.; Yang, C.; Wang, T. Effects of STEM learning on students with autism spectrum disorder and students with intellectual disability: A systematic review and meta-analysis. Humanit. Soc. Sci. Commun. 2025, 12, 1009. [Google Scholar] [CrossRef]
- Matthews, N.L.; Honda, H.; Mitchell, M.M.; Johns, A.; Kiefer, S.L.; Mann, M.; Schimmel, K.; Boglio, A.; Hallur, S.; Koke, J.; et al. Building capacity for inclusive informal STEM learning opportunities for autistic learners. Int. J. STEM Educ. 2024, 11, 53. [Google Scholar] [CrossRef]
- Ghee Hou, S.; Ahmad, M.R.b. Emotion Classification System for ASD Group by Using Wireless EEG Monitoring Device. Elektr. J. Electr. Eng. 2024, 23, 1–9. [Google Scholar] [CrossRef]
- May, T.; Rinehart, N.J.; Wilding, J.; Cornish, K. Attention and basic literacy and numeracy in children with Autism Spectrum Disorder: A one-year follow-up study. Res. Autism Spectr. Disord. 2015, 9, 193–201. [Google Scholar] [CrossRef]
- Sanei, S.; Chambers, J.A. EEG Signal Processing and Machine Learning, 2nd ed.; Wiley: Hoboken, NJ, USA, 2022; ISBN 978-1-119-38694-0. [Google Scholar]
- Hankus, M.; Ochman-Pasierbek, P.; Brzozowska, M.; Striano, P.; Paprocka, J. Electroencephalography in Autism Spectrum Disorder. J. Clin. Med. 2025, 14, 1882. [Google Scholar] [CrossRef] [PubMed]
- Ruffini, R.; Brinciotti, M.; Giovannone, F.; Pisani, F.; Tofani, M.; Sogos, C. Correlations between EEG abnormalities and clinical phenotypes in a population of children with autism spectrum disorder. Res. Autism 2025, 123, 202536. [Google Scholar] [CrossRef]
- Wang, J.; Barstein, J.; Ethridge, L.E.; Mosconi, M.W.; Takarae, Y.; Sweeney, J.A. Resting state EEG abnormalities in autism spectrum disorders. J. Neurodev. Disord. 2013, 5, 24. [Google Scholar] [CrossRef]
- Edmunds, S.R.; Fogler, J.; Braverman, Y.; Gilbert, R.; Faja, S. Resting frontal alpha asymmetry as a predictor of executive and affective functioning in children with neurodevelopmental differences. Front. Psychol. 2023, 13, 1065598. [Google Scholar] [CrossRef]
- Peck, F.C.; Gabard-Durnam, L.J.; Wilkinson, C.L.; Bosl, W.; Tager-Flusberg, H.; Nelson, C.A. Prediction of autism spectrum disorder diagnosis using nonlinear measures of language-related EEG at 6 and 12 months. J. Neurodev. Disord. 2021, 13, 57. [Google Scholar] [CrossRef]
- Bosl, W.; Tierney, A.; Tager-Flusberg, H.; Nelson, C. EEG complexity as a biomarker for autism spectrum disorder risk. BMC Med. 2011, 9, 18. [Google Scholar] [CrossRef]
- Wang, T.-S.; Wang, S.-S.; Wang, C.-L.; Wong, S.-B. Theta/beta ratio in EEG correlated with attentional capacity assessed by Conners Continuous Performance Test in children with ADHD. Front. Psychiatry 2024, 14, 1305397. [Google Scholar] [CrossRef]
- Neuhaus, E.; Santhosh, M.; Kresse, A.; Aylward, E.; Bernier, R.; Bookheimer, S.; Jeste, S.; Jack, A.; McPartland, J.C.; Naples, A.; et al. Frontal EEG alpha asymmetry in youth with autism: Sex differences and social–emotional correlates. Autism Res. 2023, 16, 2364–2377. [Google Scholar] [CrossRef] [PubMed]
- Dastgheib, S.S.; Kaufmann, J.M.; Kowallik, A.E.; Schweinberger, S.R. Attention to Social and Non-Social Stimuli in a Continuous Performance Test in Autistic and Typically Developed Participants: An ERP Study. J. Autism Dev. Disord. 2025; ahead of print. [Google Scholar] [CrossRef]
- MNE—MNE 1.10.1 Documentation. Available online: https://mne.tools/stable/index.html (accessed on 20 September 2025).
- Cho, R.; Zaman, M.; Cho, K.T.; Hwang, J. Investigating brain activity patterns during learning tasks through EEG and machine learning analysis. Int. J. Inf. Technol. 2024, 16, 2737–2744. [Google Scholar] [CrossRef]
- Krigolson, O.E.; Hammerstrom, M.R.; Abimbola, W.; Trska, R.; Wright, B.W.; Hecker, K.G.; Binsted, G. Using Muse: Rapid Mobile Assessment of Brain Performance. Front. Neurosci. 2021, 15, 634147. [Google Scholar] [CrossRef]
- Hayes, H.B.; Magne, C. Exploring the Utility of the Muse Headset for Capturing the N400: Dependability and Single-Trial Analysis. Sensors 2024, 24, 7961. [Google Scholar] [CrossRef]
- Syed, M.K.; Wang, H.; Siddiqi, A.A.; Qureshi, S.; Gouda, M.A. EEG-Based Attention Classification for Enhanced Learning Experience. Appl. Sci. 2025, 15, 8668. [Google Scholar] [CrossRef]
- Yuvaraj, R.; Chadha, S.; Prince, A.A.; Murugappan, M.; Islam, M.S.B.; Sumon, M.S.I.; Chowdhury, M.E.H. A Machine Learning Framework for Classroom EEG Recording Classification: Unveiling Learning-Style Patterns. Algorithms 2024, 17, 503. [Google Scholar] [CrossRef]
- Krigolson, O.E.; Williams, C.C.; Norton, A.; Hassall, C.D.; Colino, F.L. Choosing MUSE: Validation of a Low-Cost, Portable EEG System for ERP Research. Front. Neurosci. 2017, 11, 109. [Google Scholar] [CrossRef] [PubMed]
- Balathay, D.; Narasimhan, U.; Belo, D.; Anandan, K. Quantitative assessment of cognitive profile and brain asymmetry in the characterization of autism spectrum in children: A task-based EEG study. Proc. Inst. Mech. Eng. 2023, 237, 653–665. [Google Scholar] [CrossRef]
- Cohen, M.X. Analyzing Neural Time Series Data: Theory and Practice; Issues in clinical and cognitive neuropsychology; The MIT Press: Cambridge, MA, USA, 2014; ISBN 978-0-262-01987-3. [Google Scholar]
- Bishop, C.M.; Bishop, H. Deep Learning: Foundations and Concepts; Springer: Cham, Switzerland, 2024; ISBN 978-3-031-45467-7. [Google Scholar]
- Géron, A. Hands-On Machine Learning with Scikit-Learn, Keras, and TensorFlow: Concepts, Tools, and Techniques to Build Intelligent Systems, 3rd ed.; O’Reilly Media: Beijing, China, 2022; ISBN 978-1-09-812597-4. [Google Scholar]
- Pedregosa, F.; Varoquaux, G.; Gramfort, A.; Michel, V.; Thirion, B.; Grisel, O.; Blondel, M.; Müller, A.; Nothman, J.; Louppe, G.; et al. Scikit-learn: Machine Learning in Python. arXiv 2018, arXiv:1201.0490. [Google Scholar] [CrossRef]
- Dickinson, A.; DiStefano, C.; Senturk, D.; Jeste, S.S. Peak Alpha Frequency is a Neural Marker of Cognitive Function Across the Autism Spectrum. Eur. J. Neurosci. 2017, 47, 643–651. [Google Scholar]
- Van der Molen, M.J.W.; Van der Molen, M.W.; Ridderinkhof, K.R.; Hamel, B.C.J.; Curfs, L.M.G.; Ramakers, G.J.A. Auditory and visual cortical activity during selective attention in fragile X syndrome: A cascade of processing deficiencies. Clin. Neurophysiol. 2012, 123, 720–729. [Google Scholar] [CrossRef] [PubMed]
Figure 1.
Three learning tasks: (a) Shape Matching task where the test subjects drag each object in box to its matching object, (b) Shape Sorting task where the subjects recreate structure in box using the objects, and (c) Number Matching task where the subjects drag each number to its matching number.
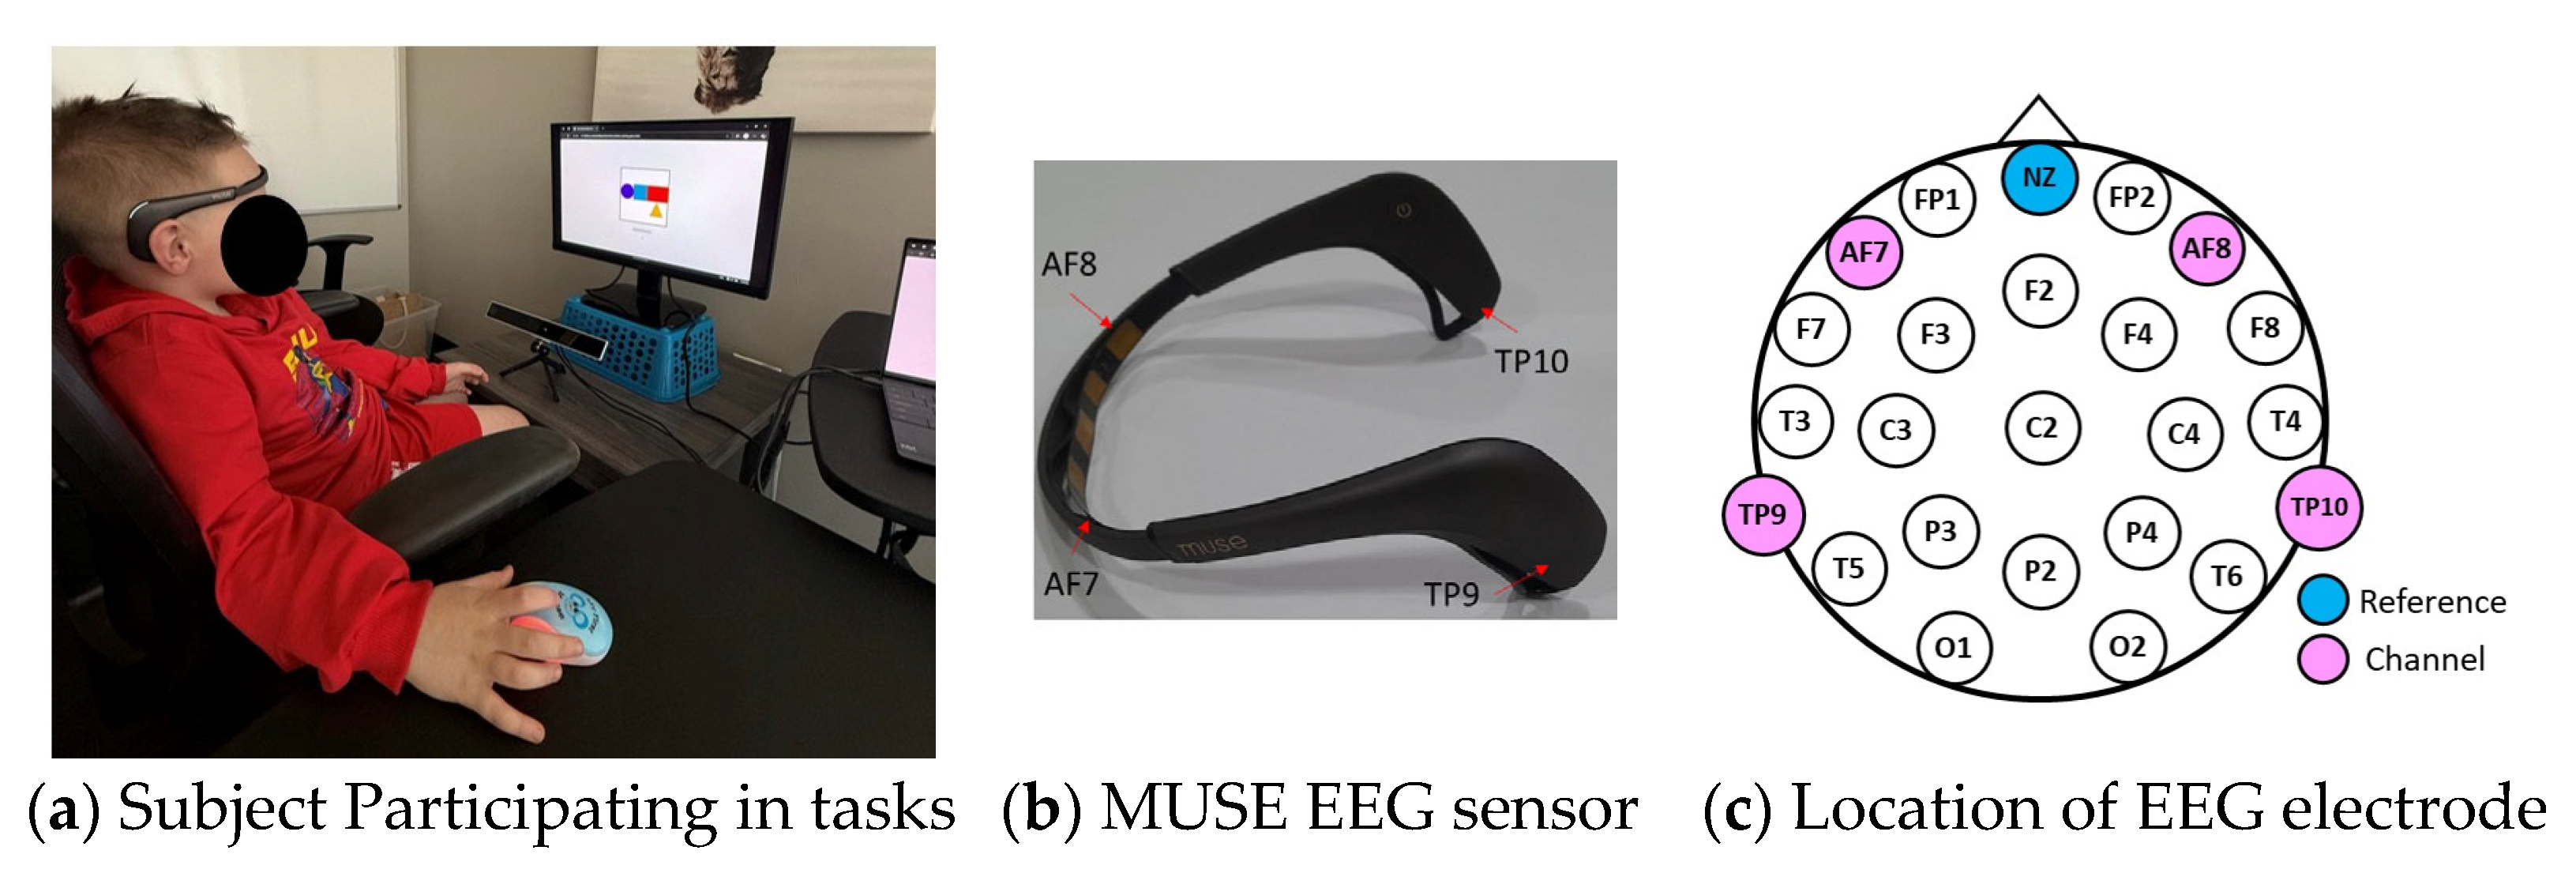
Figure 2.
Data collection: (a) Subject participating in tasks, (b) MUSE EEG sensor, and (c) Location of EEG electrode.
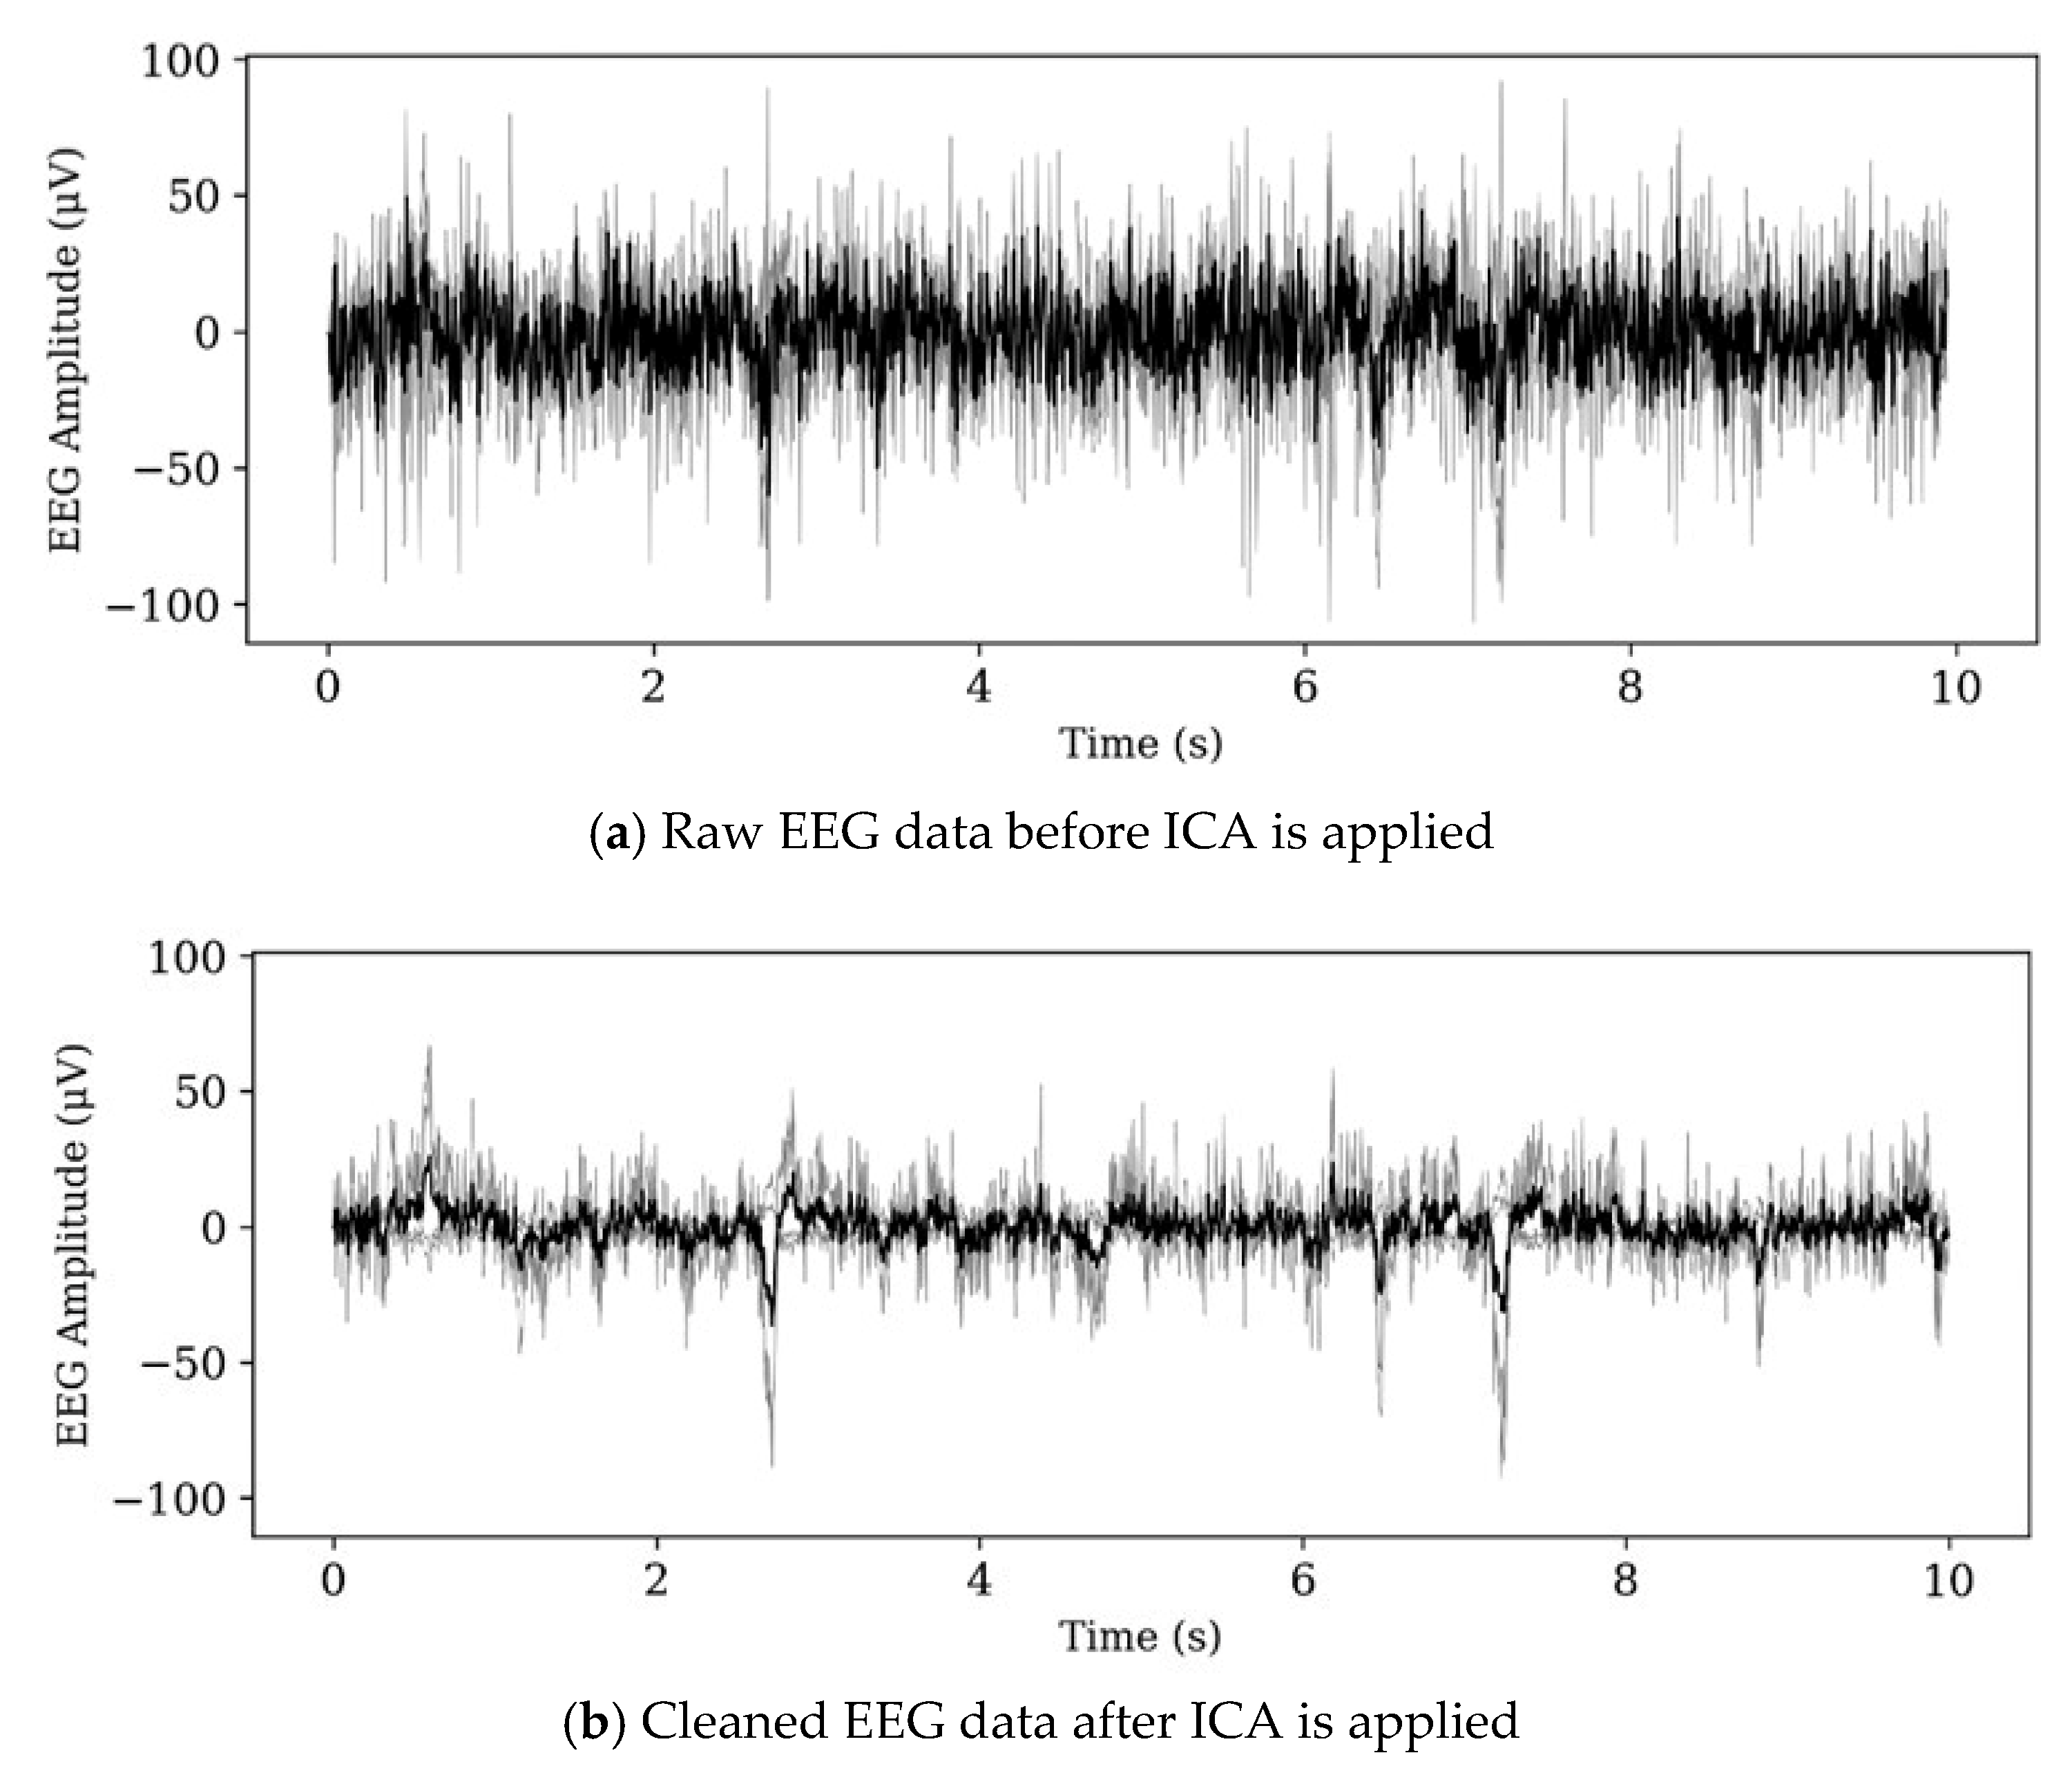
Figure 3.
Noise removal from EEG by ICA.
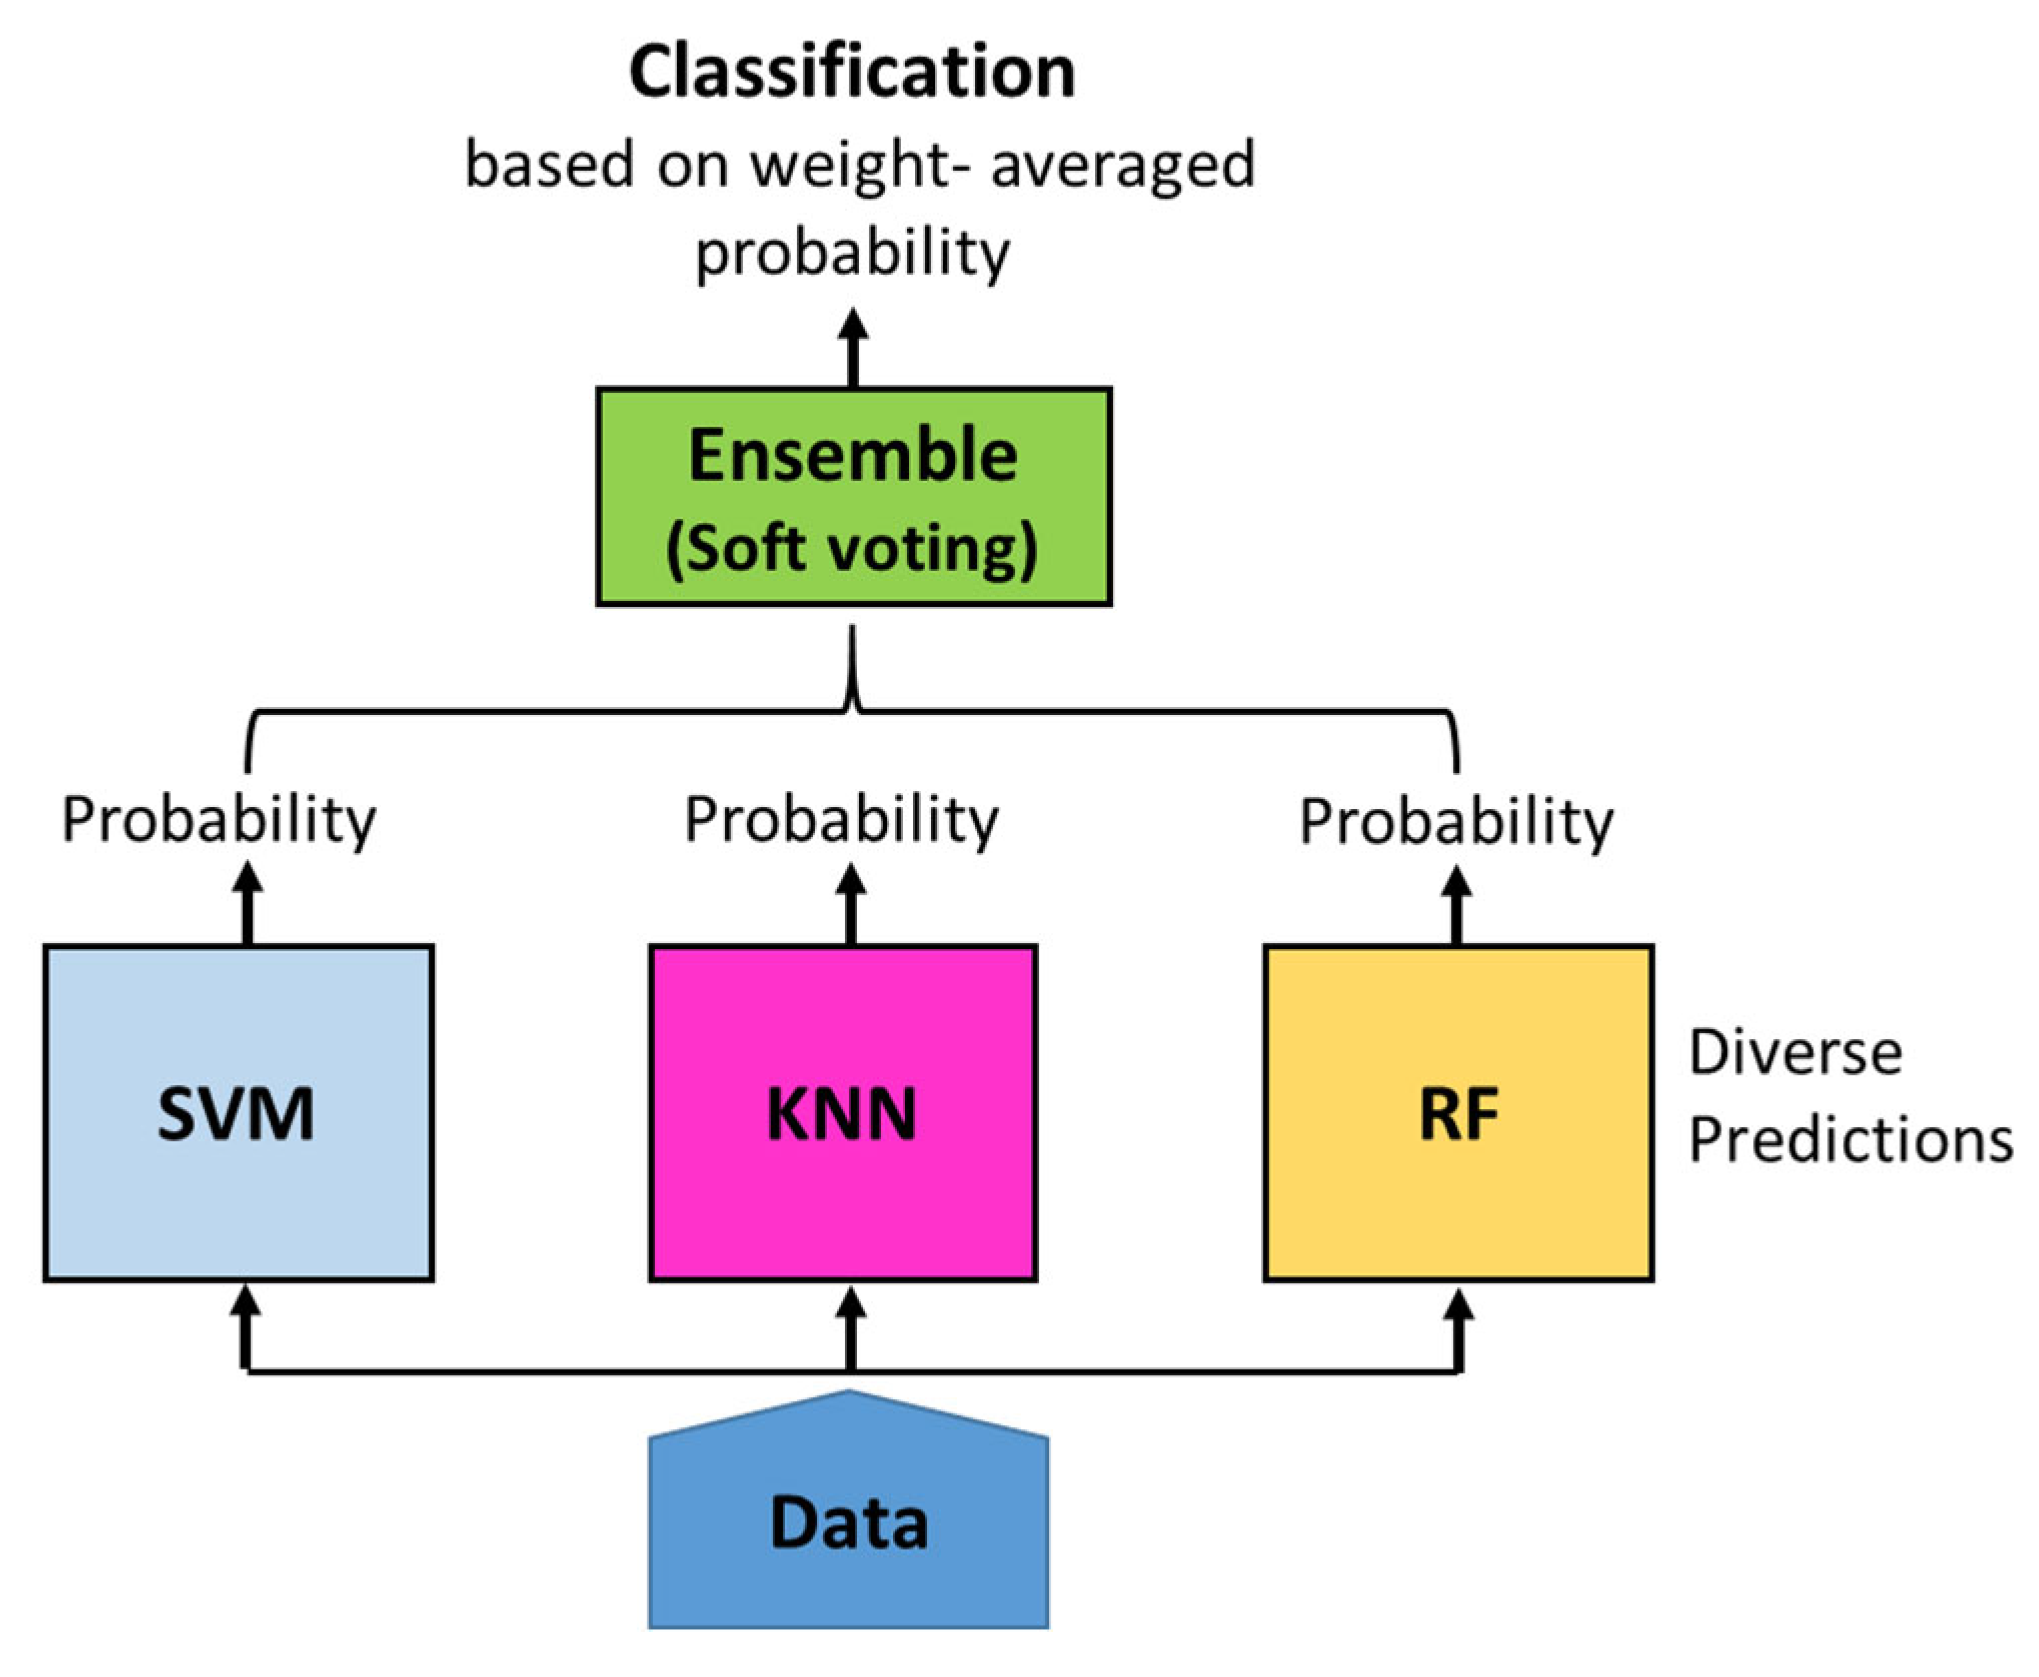
Figure 4.
Diagram of Ensemble Model Algorithm.
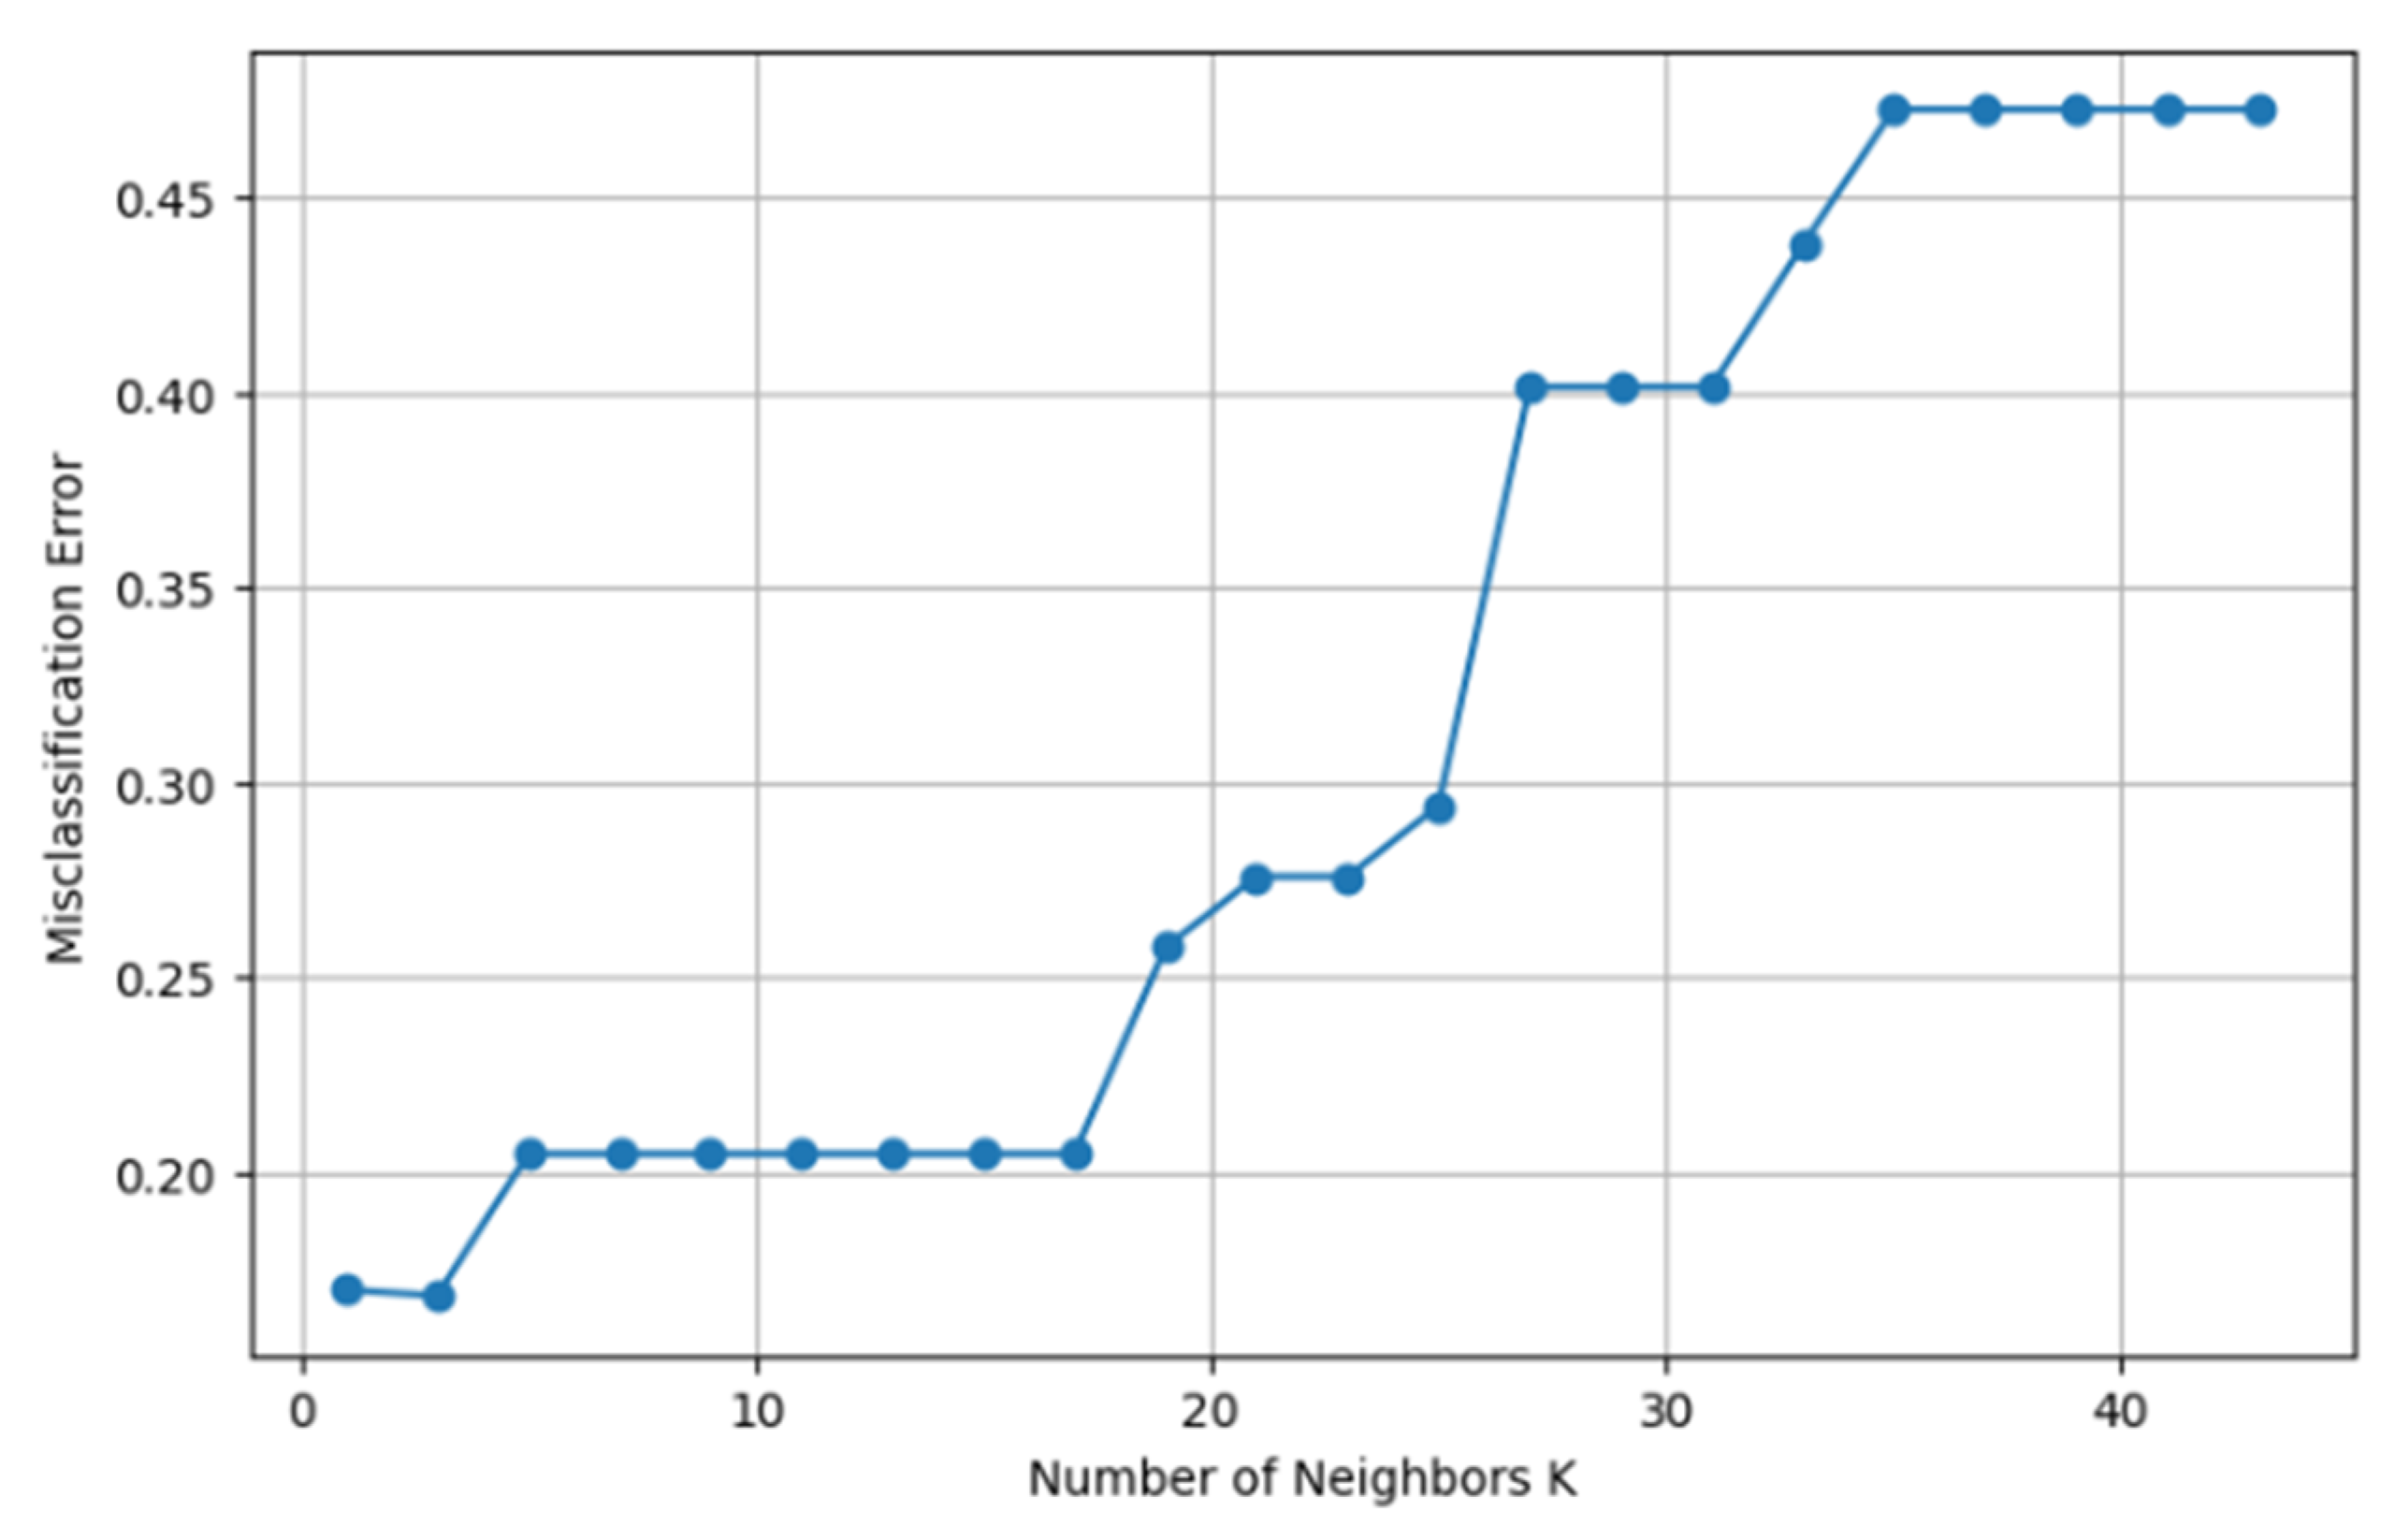
Figure 5.
The effect of the number of neighbors (K) on Error in KNN model.
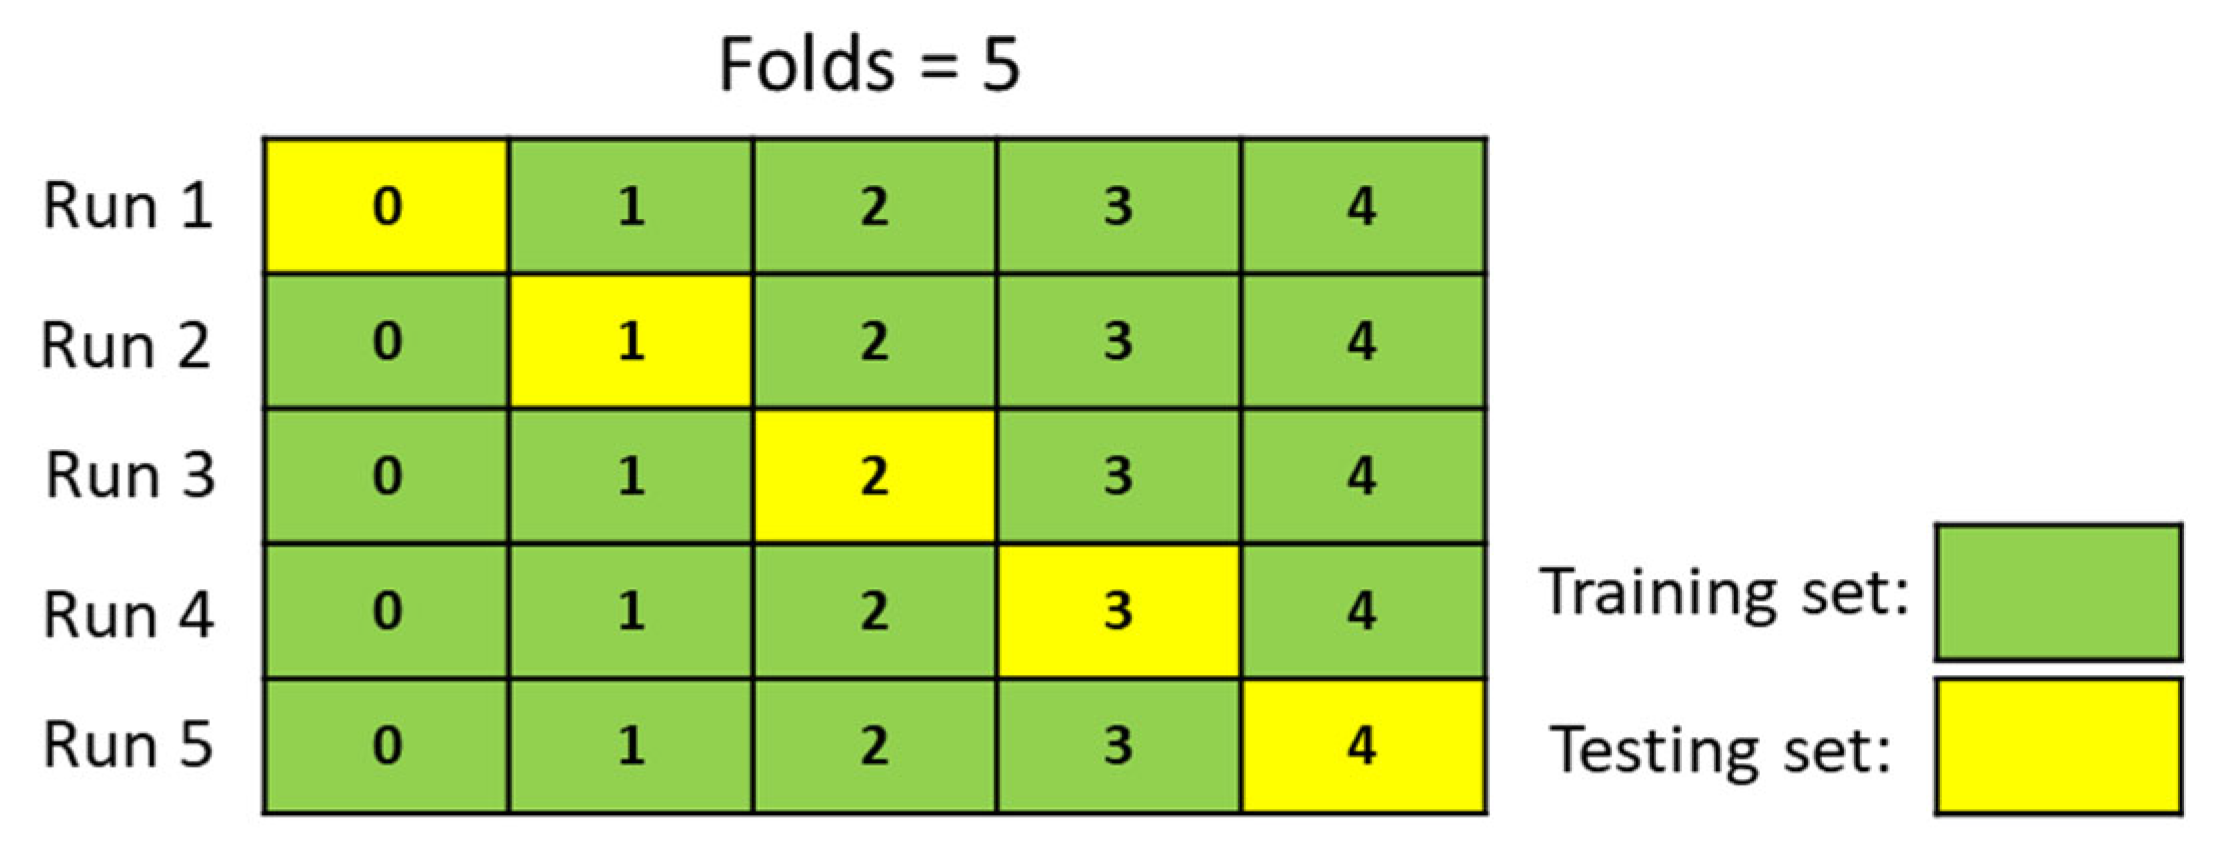
Figure 6.
Example of cross-validation for folds 5.
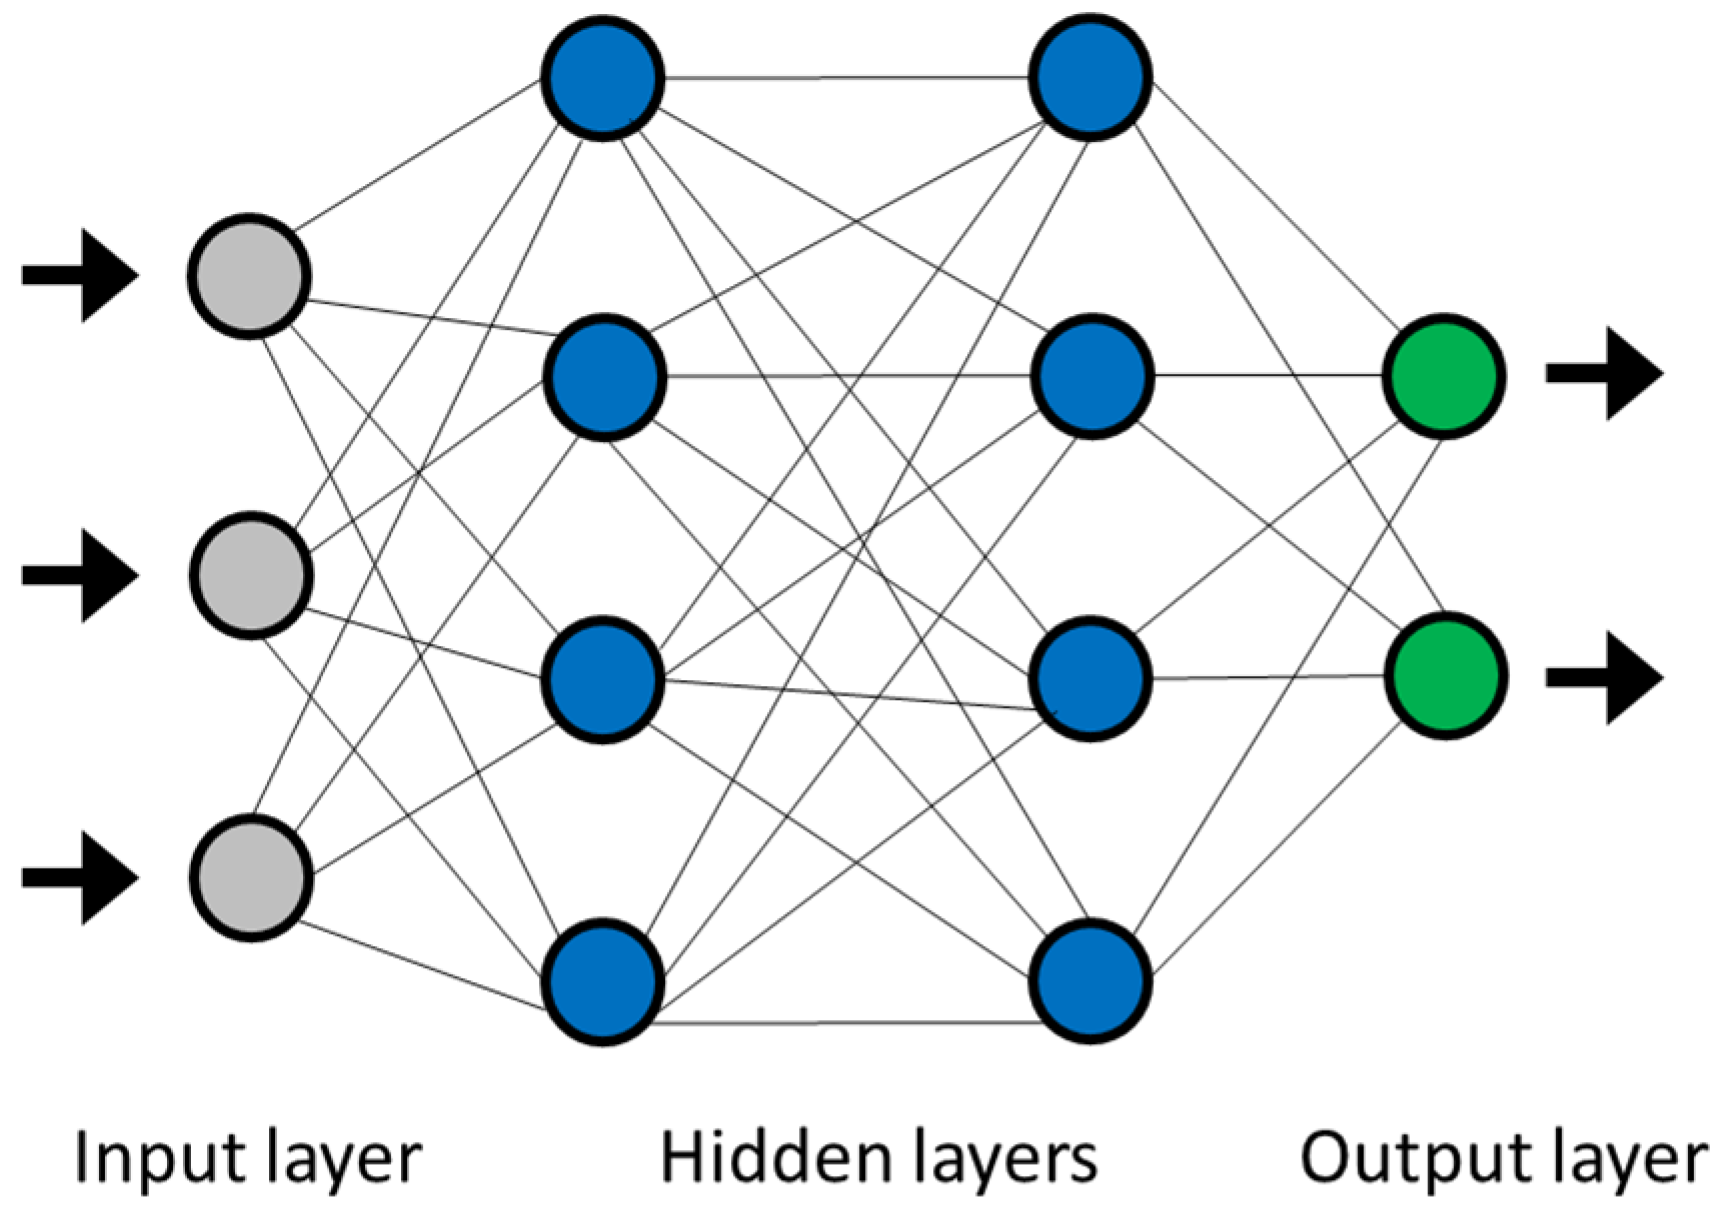
Figure 7.
Typical structure of multilayer perceptron neural network.
Figure 8.
Comparison of fractional power of five frequency bands calculated from data collected while participants participated in all three tests such as Shape Matching, Shape Sorting, and Number Matching.
Figure 9.
Signal ratio (Alpha/Beta) over AF7 (left frontal) and AF8 (right frontal) for subjects engaging in three tasks.
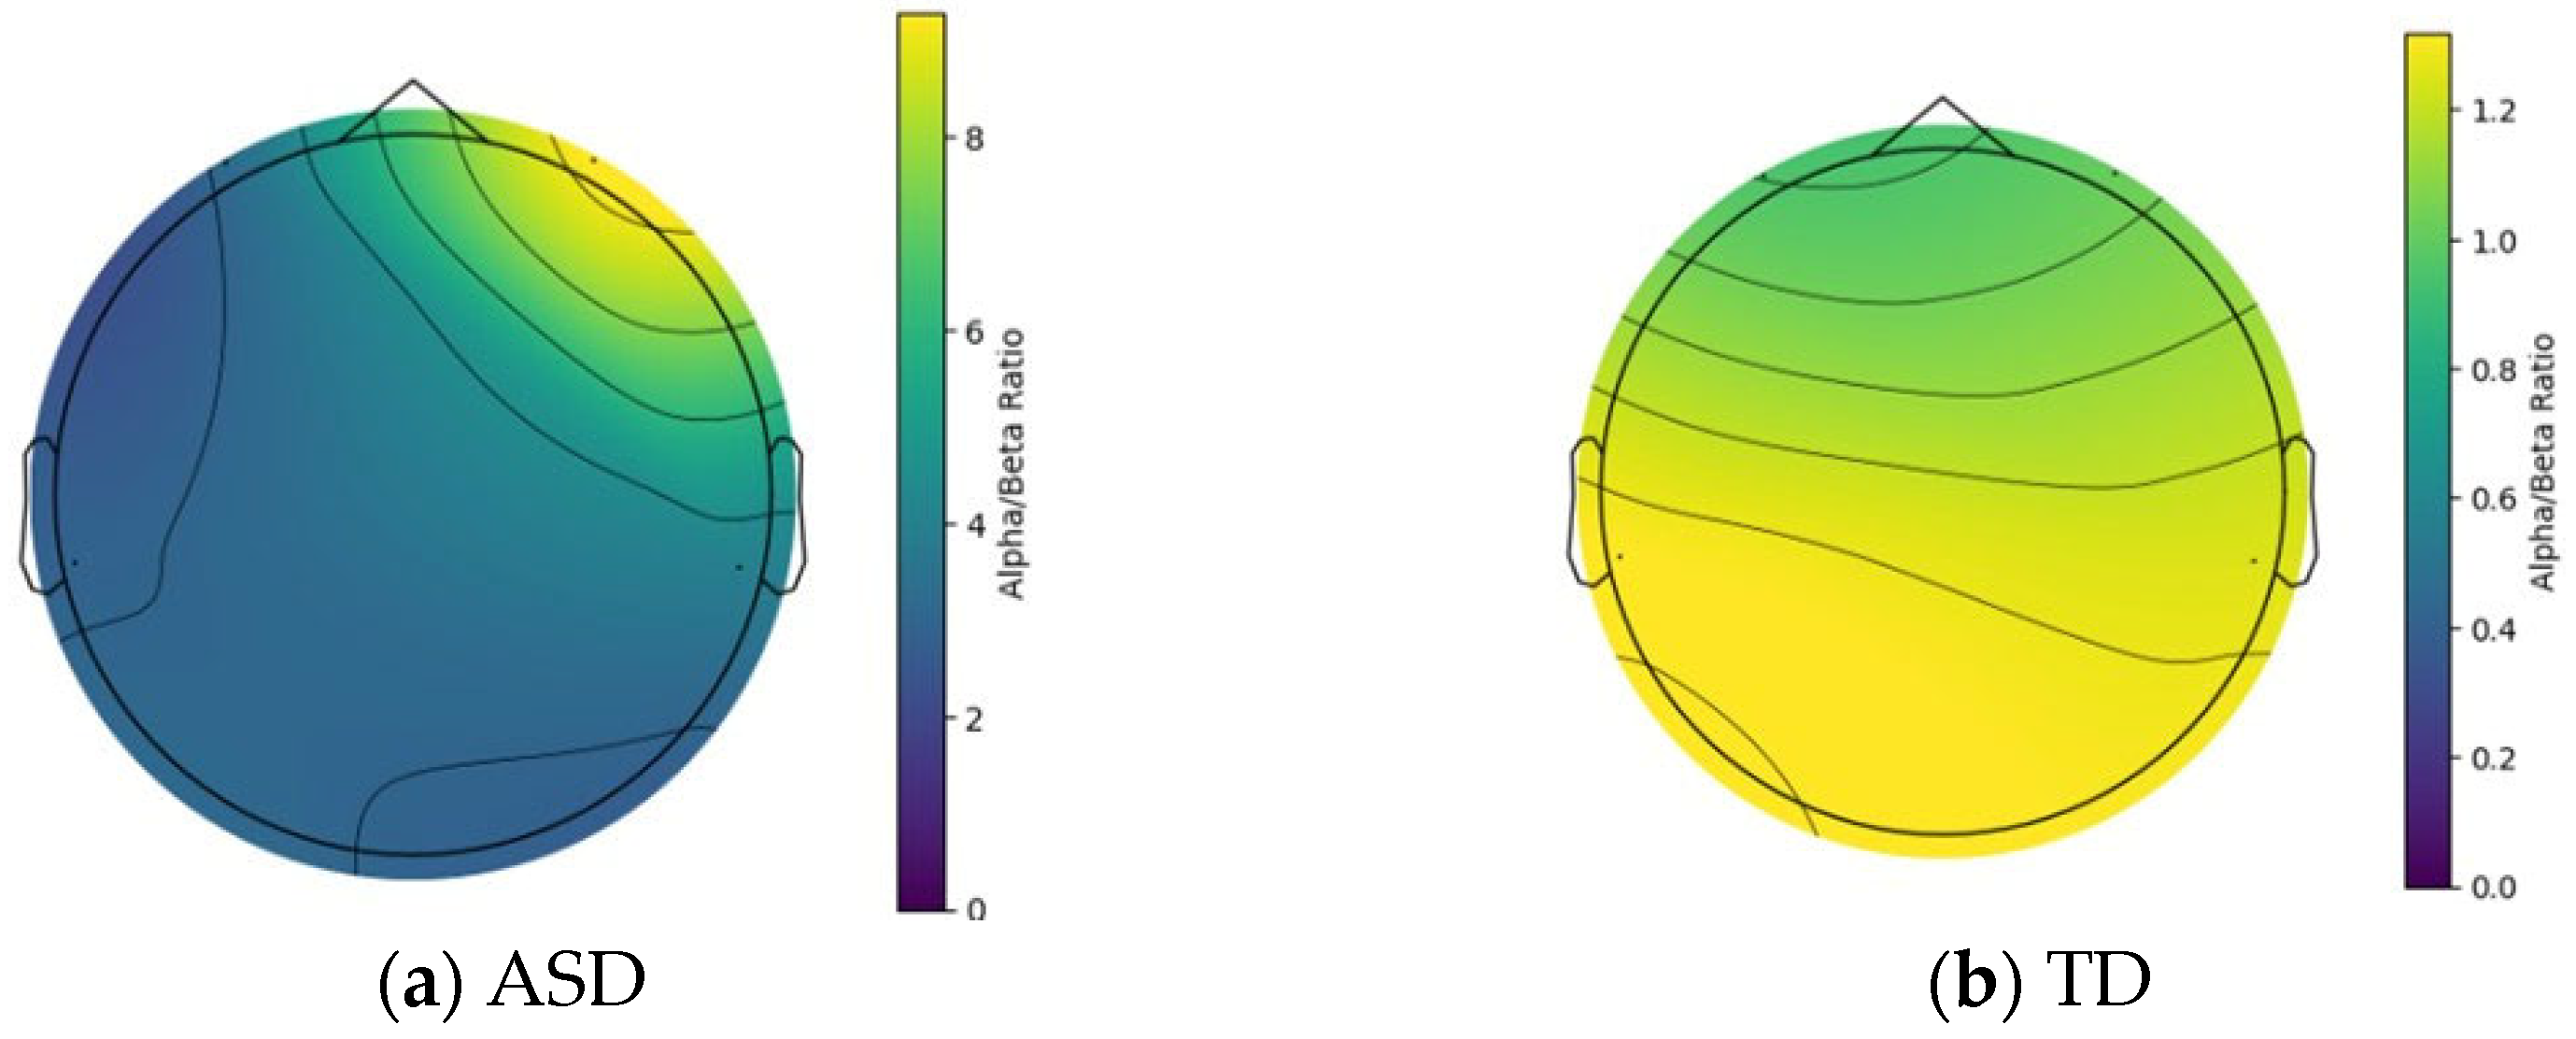
Figure 10.
Topographic map of ASD and TD while engaging in Shape Sorting.
Figure 11.
Signal ratios (Theta/Alpha, Theta/Beta) over AF7 and AF8.
Figure 12.
Dynamic attention change calculated by Morlet wavelet transform.
Figure 13.
Feature contribution to Random Forest and Ensemble classification models.
Figure 14.
ASD map formed by the most significant features, AF7_Beta and AF8_Beta.
Table 1.
Summary of hyperparameters considered for the ML models.
| Model | Tuned Parameters | Grid Search Values |
|---|
| SVM | C, gamma, kernel | C = [0.1, 1, 10, 100];
gamma = [0.001, 0.01, 0.1, 1];
Kernel = [Linear, rbf, poly] |
| KNN | Number of neighbors (K) | K = [1, 3, 5, …, max_safe_k] (odd numbers only, chosen based on dataset size) |
| Random Forest | n_estimators, max_depth, min_samples_split, min_samples_leaf,
max_features, bootstrap, criterion | n_estimators = [100, 200, 300];
max_depth = [5, 10, 15, None];
min_samples_split = [2, 4, 6];
min_samples_leaf = [1, 2, 4];
max_features = [‘sqrt’, ‘log2′];
bootstrap = [True, False];
criterion = [‘gini’, ‘entropy’] |
Table 2.
Summary of prediction results of machine learning models.
| Model | Accuracy | Precision | Recall | F1-Score |
|---|
| SVM | 0.84 ± 0.16 | 0.84 ± 0.21 | 0.90 ± 0.15 | 0.86 ± 0.14 |
| KNN | 0.84 ± 0.12 | 0.97 ± 0.07 | 0.70 ± 0.27 | 0.78 ± 0.18 |
| Random Forest | 0.88 ± 0.08 | 0.95 ± 0.10 | 0.82 ± 0.19 | 0.86 ± 0.11 |
| Ensemble | 0.90 ± 0.08 | 0.97 ± 0.07 | 0.82 ± 0.18 | 0.87 ± 0.11 |
| Neural Network | 0.79 ± 0.12 | 0.90 ± 0.13 | 0.67 ± 0.27 | 0.72 ± 0.19 |
| Disclaimer/Publisher’s Note: The statements, opinions and data contained in all publications are solely those of the individual author(s) and contributor(s) and not of MDPI and/or the editor(s). MDPI and/or the editor(s) disclaim responsibility for any injury to people or property resulting from any ideas, methods, instructions or products referred to in the content. |
© 2025 by the authors. Licensee MDPI, Basel, Switzerland. This article is an open access article distributed under the terms and conditions of the Creative Commons Attribution (CC BY) license (https://creativecommons.org/licenses/by/4.0/).

