Article

A Layered Entropy Model for Transparent Uncertainty Quantification in Medical AI: Advancing Trustworthy Decision Support in Small-Data Clinical Settings

by
Sandeep Bhattacharjee
and
Sanjib Biswas
*
Amity Business School, Amity University Kolkata, Major Arterial Road, AA II, Newtown 700135, West Bengal, India
*
Author to whom correspondence should be addressed.
Information 2025, 16(10), 875; https://doi.org/10.3390/info16100875
Submission received: 26 August 2025 / Revised: 23 September 2025 / Accepted: 3 October 2025 / Published: 9 October 2025
(This article belongs to the Special Issue Artificial Intelligence-Based Digital Health Emerging Technologies)

Abstract

Smaller data environments with expert systems are generally driven by the need for interpretable reasoning frameworks, such as fuzzy rule-based systems (FRBS), which cannot often quantify epistemic uncertainty during decision-making. This study proposes a novel Layered Entropy Model (LEM) comprising three semantic layers: Membership Function Entropy (MFE), Rule Activation Entropy (RAE), and System Output Entropy (SOE). Shannon entropy is applied at each layer to enable granular diagnostic transparency throughout the inference process. The approach was evaluated using both synthetic simulations and a real-world case study on the PIMA Indian Diabetes dataset. In the real data experiment, the system produced sharp, fully confident decisions with zero entropy at all layers, yielding an Epistemic Confidence Index (ECI) of 1.0. The proposed framework maintains full compatibility with conventional Type-1 FRBS design while introducing a computationally efficient and fully interpretable uncertainty quantification capability. The results demonstrate that LEM can serve as a powerful tool for validating expert knowledge, auditing system transparency, and deployment in high-stakes, small-data decision domains, such as healthcare, safety, and finance. The model contributes directly to the goals of explainable artificial intelligence (XAI) by embedding uncertainty traceability within the reasoning process itself.

1. Introduction

The evolution of Fuzzy Rule-Based Systems (FRBS) serves as a platform for modeling uncertain, vague, or imprecise knowledge [1]. In contrast to classical binary logic, fuzzy logic provides interpretation for human-like reasoning with partial membership signifying ambiguity [2]. FRBS models employ a set of IF-THEN rules for representing inputs and outputs of linguistic variables, ensuring proper representation [3]. With the integration of Mamdani’s pioneering controller [4], FRBS has since evolved into more adaptive and neuro-fuzzy hybrids integrating learning capabilities from experiments and innovations [5,6]. There is an increase in demand for systems that process subjective judgments and incomplete information, in different domains with scarce quantitative data, necessitating the development of expert knowledge [7]. Besides these developments, the factor of uncertainty remains a critical challenge within FRBS frameworks, intimidating novel approaches through further innovation in this domain for robust quantification and mitigation.
Diverse domains with extensive applications operating under severe complexity and vagueness necessitate the deployment of FRBS for expert control and crucial decision-making. Complex processes such as HVAC systems, robotic motion control, and chemical plant operations are governed and monitored by FRBS [8,9]. Similarly, FRBS contributes to diagnosis and treatment planning in the medicine domain, which suffers from symptom ambiguity [10]. Similarly, expert heuristics based on FRBS contribute to financial forecasting, risk assessment, and credit scoring [11,12]. FRBS has also proved its effectiveness in subjective data applications, including environmental management, agriculture, and supply chain optimization [13,14,15]. Other hybrid models integrate neural networks, evolutionary algorithms, and reinforcement learning for high-dimensional and adaptive contexts [16,17,18]. Despite these strengths, quantifying uncertainty remains a serious challenge.
Although stochastic uncertainty has been addressed to some extent through probabilistic fuzzy extensions, epistemic uncertainty—arising from incomplete knowledge, sparse data, and linguistic vagueness—continues to pose a significant research challenge, particularly in small-data decision environments with limited learning capacity.
Practical applications of FRBS have extended to various areas, including healthcare, where complex diagnostic systems are used for diseases such as diabetes, cancer prognosis, and cardiovascular risk assessment [19,20]. Industrial deployments of FRBS include automated production lines, welding processes, and quality control management [21,22]. Similarly, applications for air quality prediction, flood risk assessment, and water resource management also benefited from FRBS [23,24]. Agricultural processes with FRBS include crop yield prediction, pest control, and irrigation management under uncertain weather conditions [25,26]. Furthermore, transportation systems are closely related to FRBS in traffic congestion management, route planning, and autonomous vehicle navigation [27,28]. Many decision support systems integrate FRBS for subjective assessments, assisting in operations including finance, insurance, and legal judgment, particularly in cases of failure [8,29]. Such wide-ranging applications underline the potential of FRBS in uncertain environments, particularly for small datasets where expert knowledge emphasizes a dominant role.
The Layered Entropy Model (LEM) builds directly upon the formal foundations of fuzzy rule-based systems established by Mamdani and Assilian (1975), who defined the core inference procedure of fuzzification, rule evaluation, and defuzzification. It extends this structure by quantifying epistemic uncertainty at each stage: input ambiguity (Membership Entropy), rule conflict (Rule Activation Entropy), and output indecisiveness (System Output Entropy) [4]. This provides a diagnostic meta-layer to the classical fuzzy reasoning process, enhancing interpretability and confidence assessment without altering the underlying mechanics derived from these seminal works.
Small data-driven environments, characterized by minimal quantitative data demands, require the quantification of uncertainty to confirm reliability. With conventional FRBS struggling with epistemic uncertainty due to incomplete rule bases, vague linguistic terms, and knowledge gaps, innovative approaches such as the one proposed in this study are needed. The current study proposes a layered entropy-based approach aimed at ascertaining finer granularity in epistemic uncertainty estimation, targeting both interpretability and decision reliability in small-data contexts. Layered entropy is a framework that decomposes the epistemic uncertainty in a fuzzy logic system into distinct, measurable layers. It quantifies ambiguity at the input stage (Membership Function Entropy), conflict during rule firing (Rule Activation Entropy), and indecisiveness in the final output (System Output Entropy). Analyzing uncertainty at each step provides a transparent diagnosis of where and why confidence is lost in the reasoning process. This culminates in a composite Epistemic Confidence Index, offering an interpretable measure of the system’s overall reliability for critical decision-making under uncertainty.
The proposed study aims to develop a layered entropy framework for quantifying epistemic uncertainty in fuzzy rule-based systems under small-data conditions, utilizing the PIMA dataset (Source: PIMA dataset, Github, 2017 [30]), and to compare its results with those obtained from synthetic data. The purpose of this study is to improve the interpretability of uncertainty propagation across rule layers and validate its effectiveness across diverse decision-making domains.
The proposed approach reconciles Shannon entropy [31], fuzzy entropy [32], and interval type-2 fuzzy logic [33] into a multi-layered framework, where the rule antecedent level quantifies membership function uncertainty, followed by the rule aggregation level, for the computation of the combined entropy of rule firing strengths. Thereafter, overall entropy propagation is modeled [34,35] at the system output level. The overall design is proposed to permit the disaggregation of epistemic uncertainty across the rule-based architecture for transparent diagnostic insights.
The paper suggests a novel layered entropy framework for quantifying epistemic uncertainty in FRBS, addressing inherent limitations in small-data decision environments. The framework disaggregates uncertainty across membership functions by using rule evaluations for generating system outputs to enhance both reliability and interpretability. Empirical validations using the healthcare PIMA dataset (See Table 1) provide a clear insight into computational parameters and considerations under FRBS designs, which can be replicated and applied to similar domains such as environmental, economic, and financial datasets with limited data conditions for expert validation.
The remainder of this paper is organized as follows. Section 2 provides an in-depth description of the research methodology. Section 3 presents key results obtained by using our proposed model. Section 4 discusses the result. Section 5 presents the concluding remarks, while Section 6 highlights some clinical implications.
While traditional Fuzzy Rule-Based Systems (FRBSs) are valued for their interpretability, they suffer from critical limitations in quantifying and communicating uncertainty, especially under small-data conditions. This work proposes a Layered Entropy Model (LEM) to address the following specific issues:
  • Opaque Uncertainty Propagation: Traditional FRBS generate a crisp output but fail to reveal how ambiguity from inputs or rules propagates through the reasoning process, leaving users unaware of the decision’s reliability.
  • Limited Diagnostic Capability: Conventional systems lack metrics to diagnose the source of uncertainty (e.g., ambiguous inputs vs. conflicting rules), making it difficult to refine the model or knowledge base effectively.
  • Absence of a Confidence Metric: There is no integrated, interpretable measure of epistemic confidence, preventing users from distinguishing between a certain outcome and a guess, which is critical for high-stakes decision-making.
  • Black-Box Uncertainty Methods: Alternatives like probabilistic deep learning or complex Type-2 fuzzy systems offer uncertainty quantification but at the cost of interpretability, creating a trade-off between transparency and diagnostic power.

2. Materials and Methods

2.1. Alternatives

Several alternative approaches for uncertainty quantification in Fuzzy Rule-Based Systems (FRBS) can be linked to diverse aspects of uncertainty. While higher-order uncertainty is represented by precise membership functions of inputs in traditional Type-1 Fuzzy Systems [36], fuzzy membership functions to capture unknown uncertainty were introduced under Type-2 Fuzzy Sets [37], with a hint of increasing computational complexity for real-time or small-data scenarios [38]. Further attempts were made to quantify both aleatory and epistemic uncertainties through the integration of stochastic models into fuzzy reasoning, under Probabilistic Fuzzy Systems (PFS) [39], with the condition of higher accuracy based on extensive data [40]. The Dempster–Shafer theory addressed belief functions to handle incomplete knowledge, with growing computational intensity and a surge in rule complexity [41]. Hybrid neuro-fuzzy and evolutionary fuzzy systems have also been developed to learn membership functions and rule weights directly from data [5,17]. All these models suffer from risk overfitting or poor generalization in small-data situations. In contrast to such studies, our proposed research employs a layered entropy framework that converges exactly to epistemic uncertainty, without relying heavily on large datasets or complex learning algorithms. Thus, Entropy proves to be a universal measure of uncertainty, suggesting superiority to other alternatives in terms of interpretation and computational complexity.
The PIMA Indian Diabetes [30] dataset comprises 768 patient records with 8 biomedical predictors and one outcome variable. Units for the biomarkers are as follows: glucose (mg/dL), blood pressure (mmHg), skin thickness (mm), insulin (µU/mL), and BMI (kg/m2). Age is measured in years, whereas the Diabetes Pedigree Function is a unitless index reflecting hereditary risk. Outcome is binary (0 = non-diabetic, 1 = diabetic). Furthermore, a clear rule for handling implausible zero values can include replacing them with either imputation (e.g., median replacement within class groups) or exclusion, depending on the analysis. This clarification strengthens the robustness of the reported statistics and prevents misinterpretation of the descriptive summary.

2.2. Criteria Description

The proposed Layered Entropy Model (LEM) was designed to accommodate the specific characteristics of the PIMA Indian Diabetes dataset [30], ensuring relevance and robustness under small-data conditions. First, the two most clinically interpretable and data-complete variables—glucose and BMI—were selected, avoiding features with excessive zeros or unclear medical relevance. Second, membership functions and rules were defined based on domain knowledge and data distributions (e.g., clinical thresholds for glucose), not automated learning, to maintain transparency and align with expert reasoning. Third, the compact rule base included both typical (e.g., high glucose + high BMI) and edge-case rules to explicitly provoke and measure rule conflict entropy (RAE) where data patterns overlapped. Finally, all entropy metrics (MFE, RAE, SOE) were computed per instance, enabling dynamic uncertainty quantification tailored to individual patient profiles. This approach ensures the method is both data-informed and expert-guided, prioritizing interpretability and diagnostic precision over automated fitting.
The quantification of epistemic uncertainty in FRBS systematically addresses multiple sources of uncertainty. Three distinct levels of uncertainty are proposed in the layered framework, which includes the following:
1. Membership Function Uncertainty (Input Layer): The input layer membership function inherently contains null data due to subjective expert definitions or limited calibrated data [42]. Imprecision within these functions is indicated by fuzzy entropy, which quantifies the spread and overlap of membership grades [32].
2. Rule Evaluation Uncertainty (Rule Layer): Combined uncertainties in antecedents govern the firing strength of each rule of uncertainty by aggregating rule-wise entropy using weighted entropy summation for evaluation of confidence associated with rule activations [34].
3. Output Aggregation Uncertainty (System Layer): The output stage shows the compounded uncertainty from multiple rules using Shannon entropy [3] to measure the information uncertainty in the combined output fuzzy set, reflecting combined epistemic confidence. Additionally, it includes criteria for evaluating model transparency and interpretability, which are crucial in small-data expert systems [43]. In contrast to black-box neural networks, FRBS utilizes layered entropy, exposing uncertainty at each stage and approaching the criteria for perfect explainability. Finally, the stage involves assessing the computational efficiency of the method for actual deployment in resource-constrained environments, which demands low-complexity solutions [44].

2.3. Suggested Methods

The purpose of the proposed Layered Entropy Model (LEM) framework is to systematically capture epistemic uncertainty at multiple stages that can be stated as follows:
Step 1: Membership Function Entropy (MFE): In this step, Fuzzy entropy for each input variable’s membership function is calculated using De Luca-Termini entropy or alternative metrics such as Yager’s measure [45] to reveal a granular view of input-level uncertainty.
Step 2: Rule Activation Entropy (RAE): In this stage, the entropy of rule firing strengths is computed after evaluation of antecedent degrees. The rule-wise confidence score, representing weighted entropy summation, is calculated using different adapted methods [2,34].
Step 3: System Output Entropy (SOE): We use Shannon entropy, which follows rule aggregation and defuzzification, to yield a holistic epistemic uncertainty index for system-level output [46].
Step 4: Epistemic Confidence Index (ECI): ECI, representing a composite index, is computed to provide a measure for interpretable system confidence, which validates the dataset, such as the healthcare [20] PIMA dataset [30], and can be generalized for environmental risk assessment [23] and financial forecasting [44]. This involves comparing performance with Type-2 fuzzy systems and probabilistic fuzzy models to determine superior interpretability and practical usability.
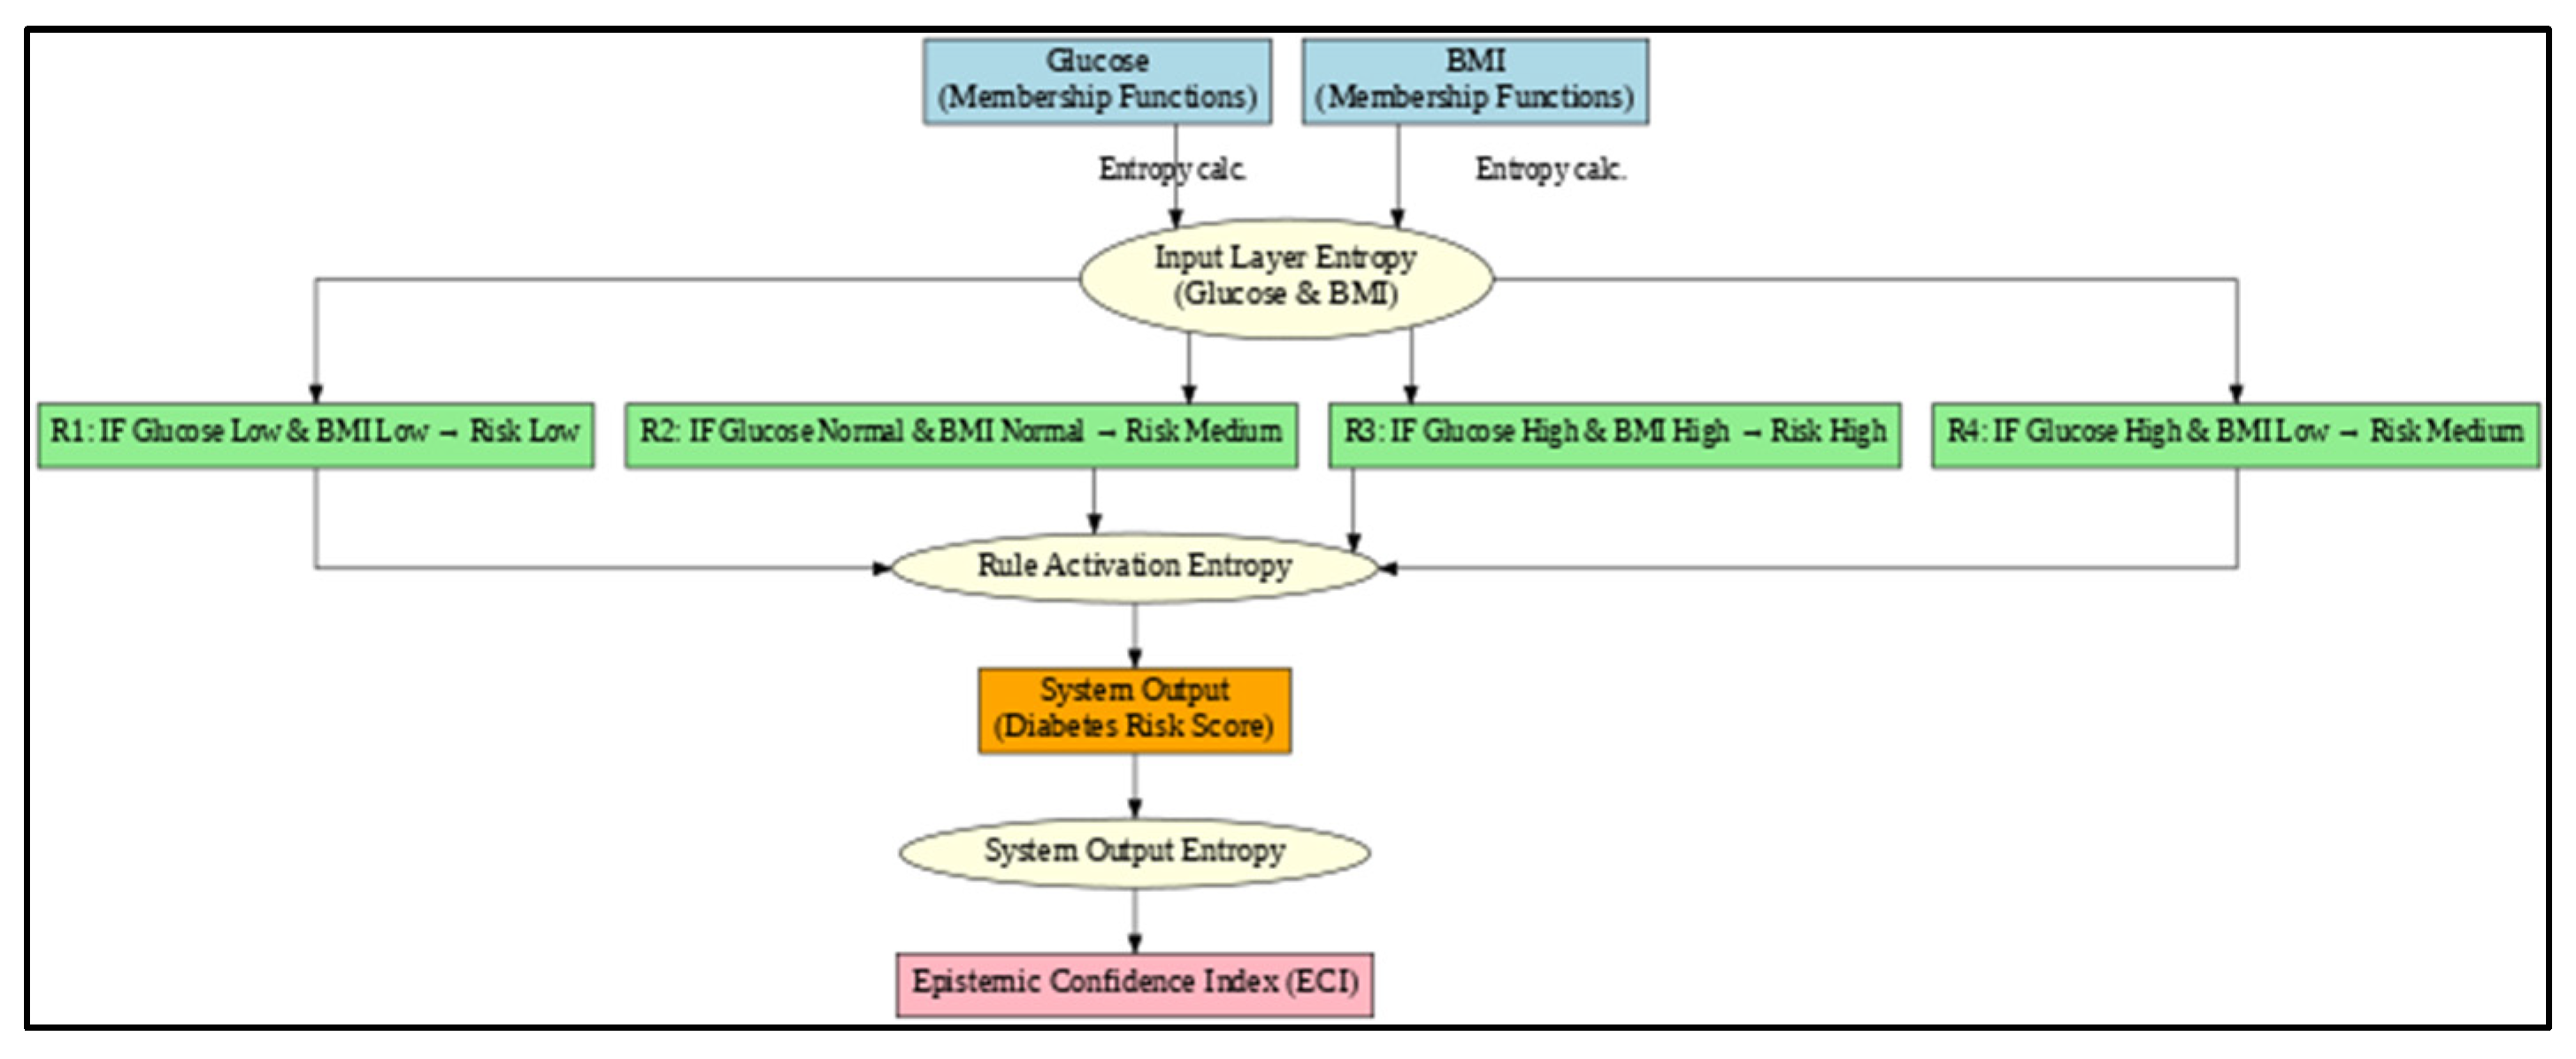
Based on the entire process of inputs to results, we have designed a structured equation model, detailed below:
Layer 1: Membership Function Uncertainty
  • IME = f1 (Glucose Membership Distribution, BMI Membership Distribution)
IME = H ( M F G ) + H ( M F B )
Layer 2: Rule Activation Uncertainty
  • RAE = f2 (IME, Rule Base Activation Strengths)
RAE = H(Rule Activations)
Since only R2 is active, RAE ≈ 0.
Layer 3: System Output Uncertainty
  • SOE = f3 (RAE, Output Aggregation)
SOE = H(Fuzzy Output Membership Distribution)
Layer 4: Composite Epistemic Confidence
ECI = 1 + ( IME + RAE + SOE ) 1
This corresponds exactly to the formula:
ECI = 1 + ( i H M F i + H RuleActivation + H ( SystemOutput ) ) 1

3. Results

3.1. Dataset Selection

The proposed Layered Entropy Model (LEM) was tested and validated under realistic small-data conditions using the PIMA Indian Diabetes Dataset [30], publicly available from the UCI Machine Learning Repository. The aforementioned dataset includes 768 instances of female patients from the Pima Indian heritage population, with several biomedical measurements related to diabetes onset. For using FRBS, we selected two highly interpretable and medically relevant inputs, i.e., Glucose Concentration (2 h plasma glucose, mg/dL) and Body Mass Index (BMI) (kg/m2), among eight features in the original PIMA Indian Diabetes Dataset (See Table 1).
Although the binary target variable “Outcome” indicates diabetes, it was not considered for supervised learning, as FRBS is designed for the emulation of expert reasoning and not pure classification. This model intends to identify the probable reasons for epistemic uncertainty for decisions generated via expert-defined rules (See Table 1).

3.2. Analysis

3.2.1. Glucose vs. BMI vs. Diabetes

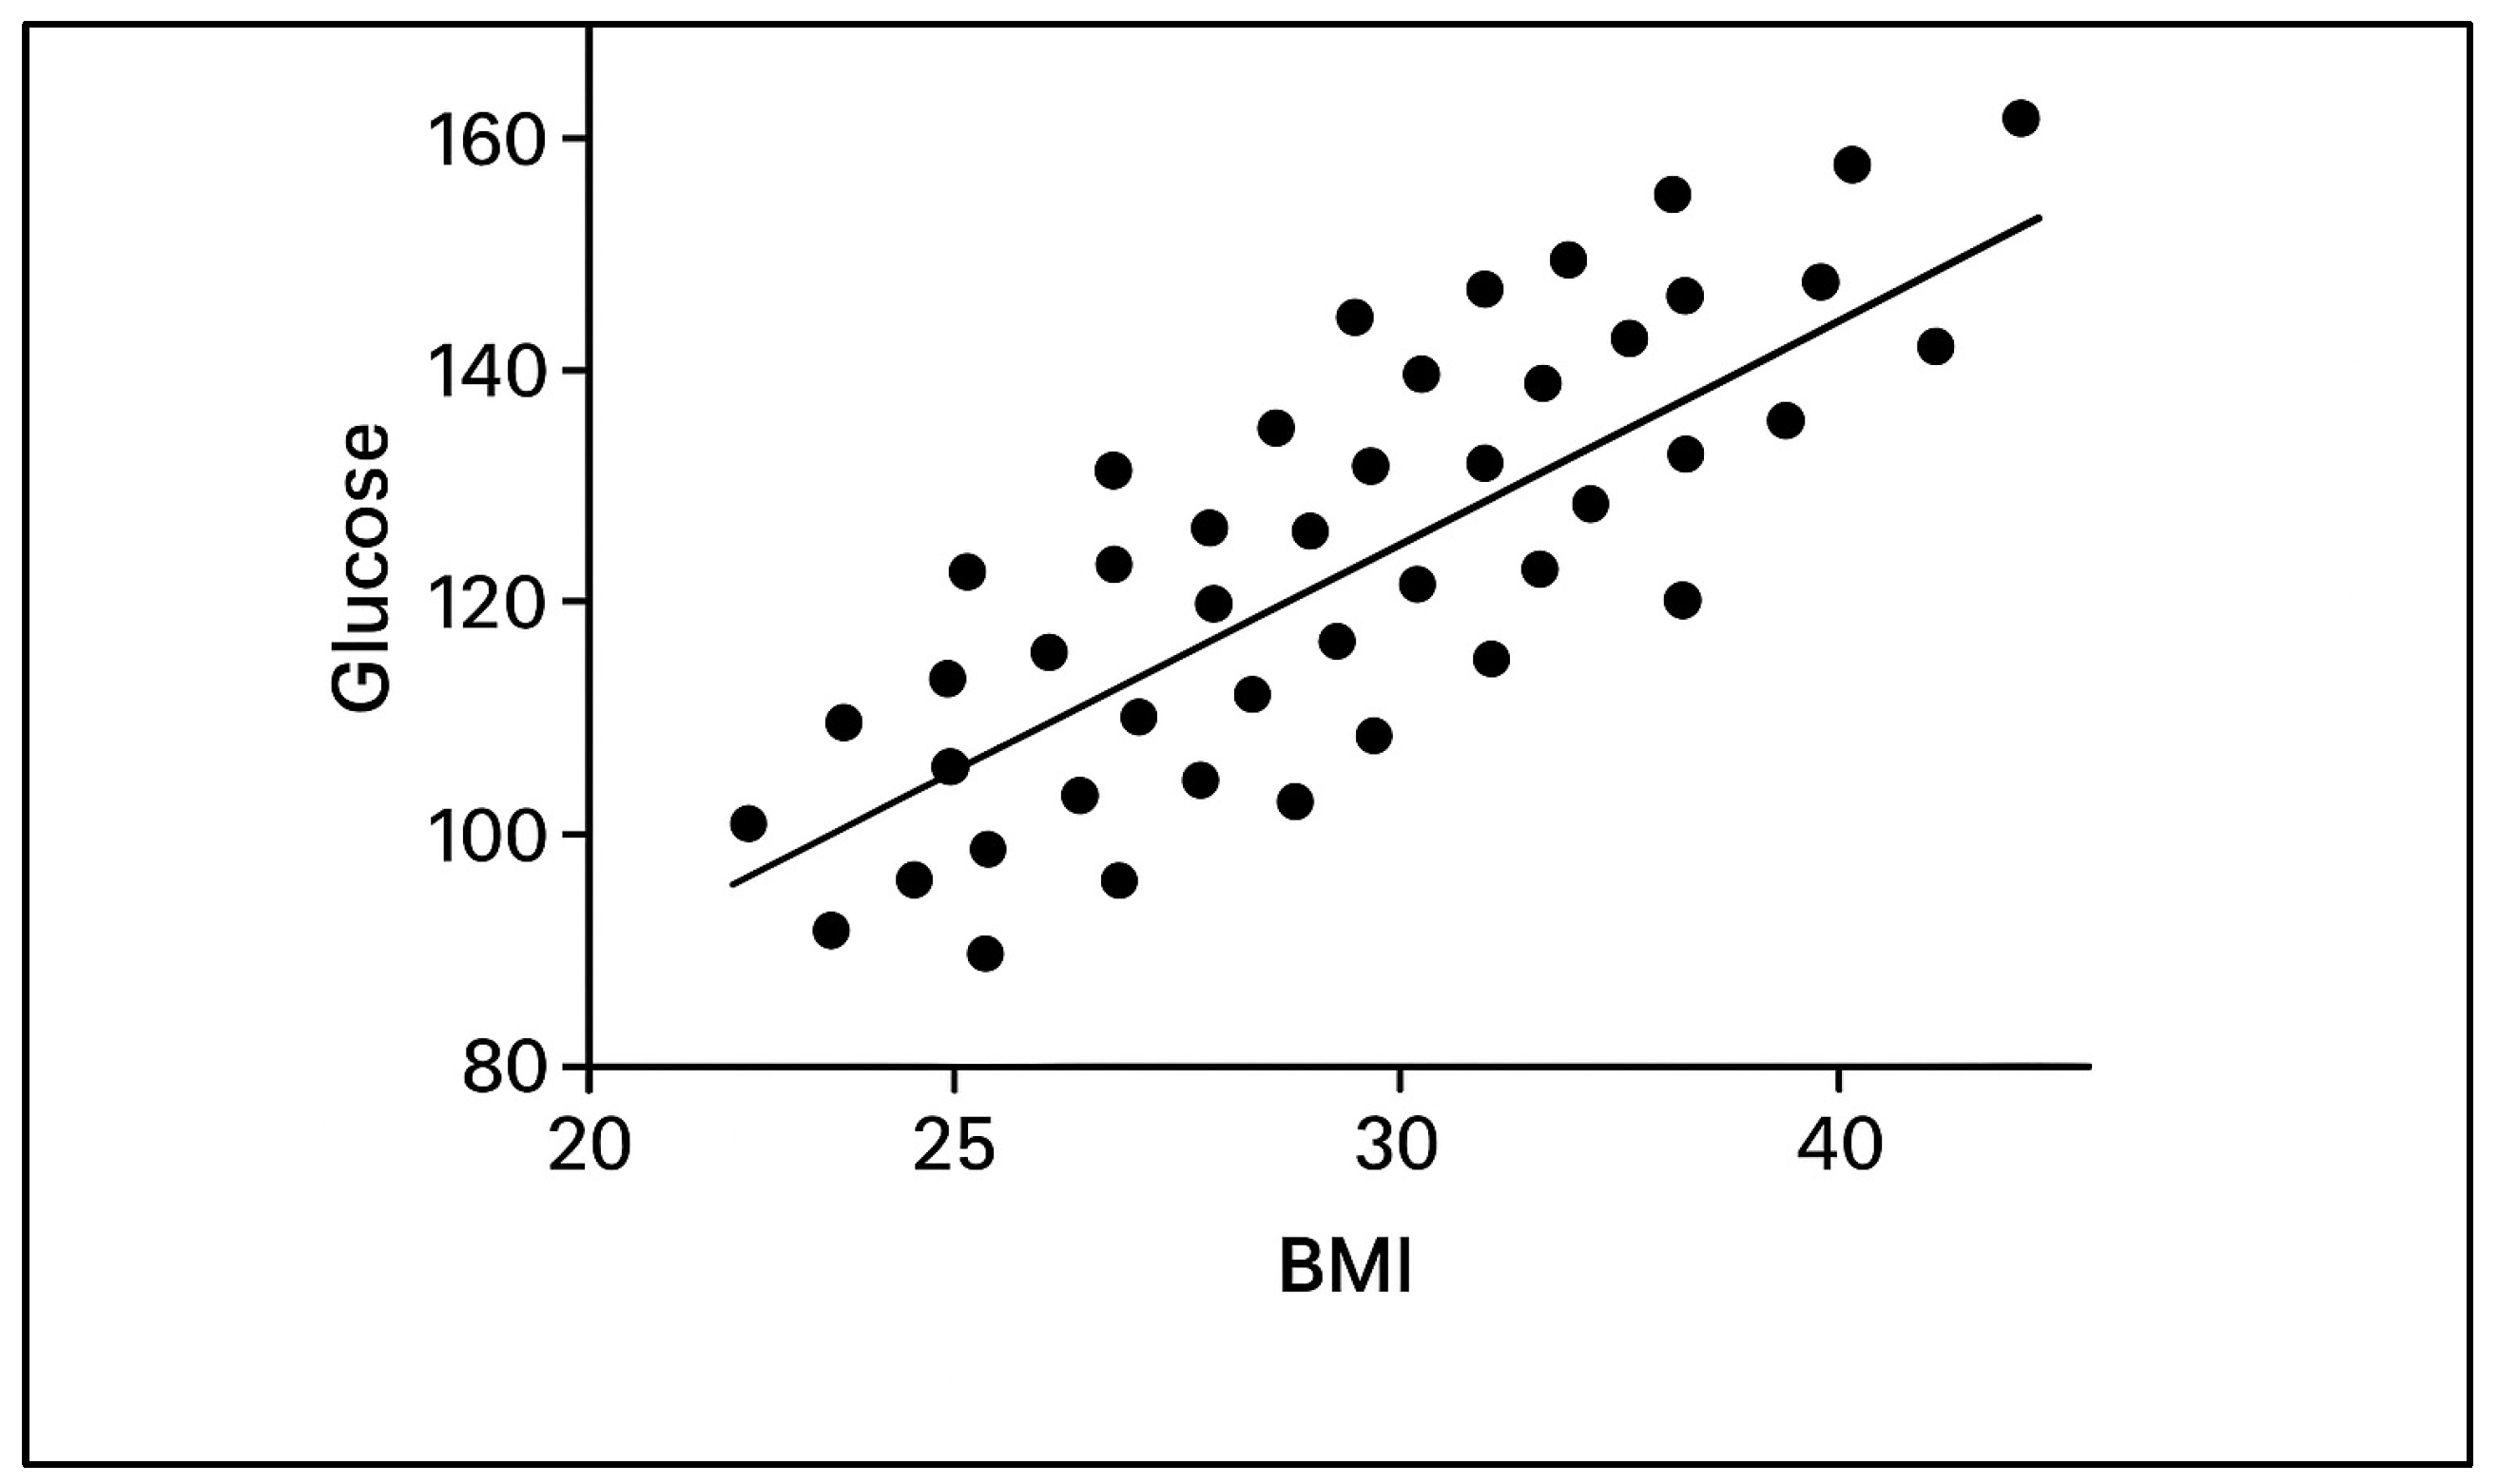
Glucose and Body Mass Index (BMI) provide the basic empirical grounding for the epistemic uncertainty quantification framework as proposed earlier in the study. Scatterplot visualization of glucose and BMI indicates high membership function certainty represented by concentrations of data points in the regions of normalized glucose and BMI for high fuzzy activation with minimized membership entropy, suggesting enhanced epistemic confidence at the input layer. Also, dispersion near fuzzy boundaries occurs near fuzzy set boundaries, marked by transitional glucose (0.4–0.6) and BMI (0.4–0.6) regions, indicating potential overlapping membership that contributes to higher input-layer entropy, suggesting precise entropy quantification. Diagonal trend highlights coincidence of higher glucose and BMI values, stating implicitly “IF Glucose is High and BMI is High then Risk is also High”, emphasizing rule interaction regions that activate rule activation entropy at the rule layer. In addition to exemplifying challenges in small-data environments, critical boundary regions represent incomplete knowledge representation, thereby amplifying epistemic uncertainty in the system output layer. The scatterplot acts as an important visualization for the proposed approach, focusing on disaggregation of uncertainty across membership functions, rule evaluations, and aggregated outputs, and aligns with the objective of enhancing transparency, interpretability, and decision confidence in fuzzy rule-based systems operating under small data constraints (See Figure 1). This scatterplot reveals the depiction of entropy for glucose vs. BMI for the diabetes outcome, as highlighted in Figure 1.

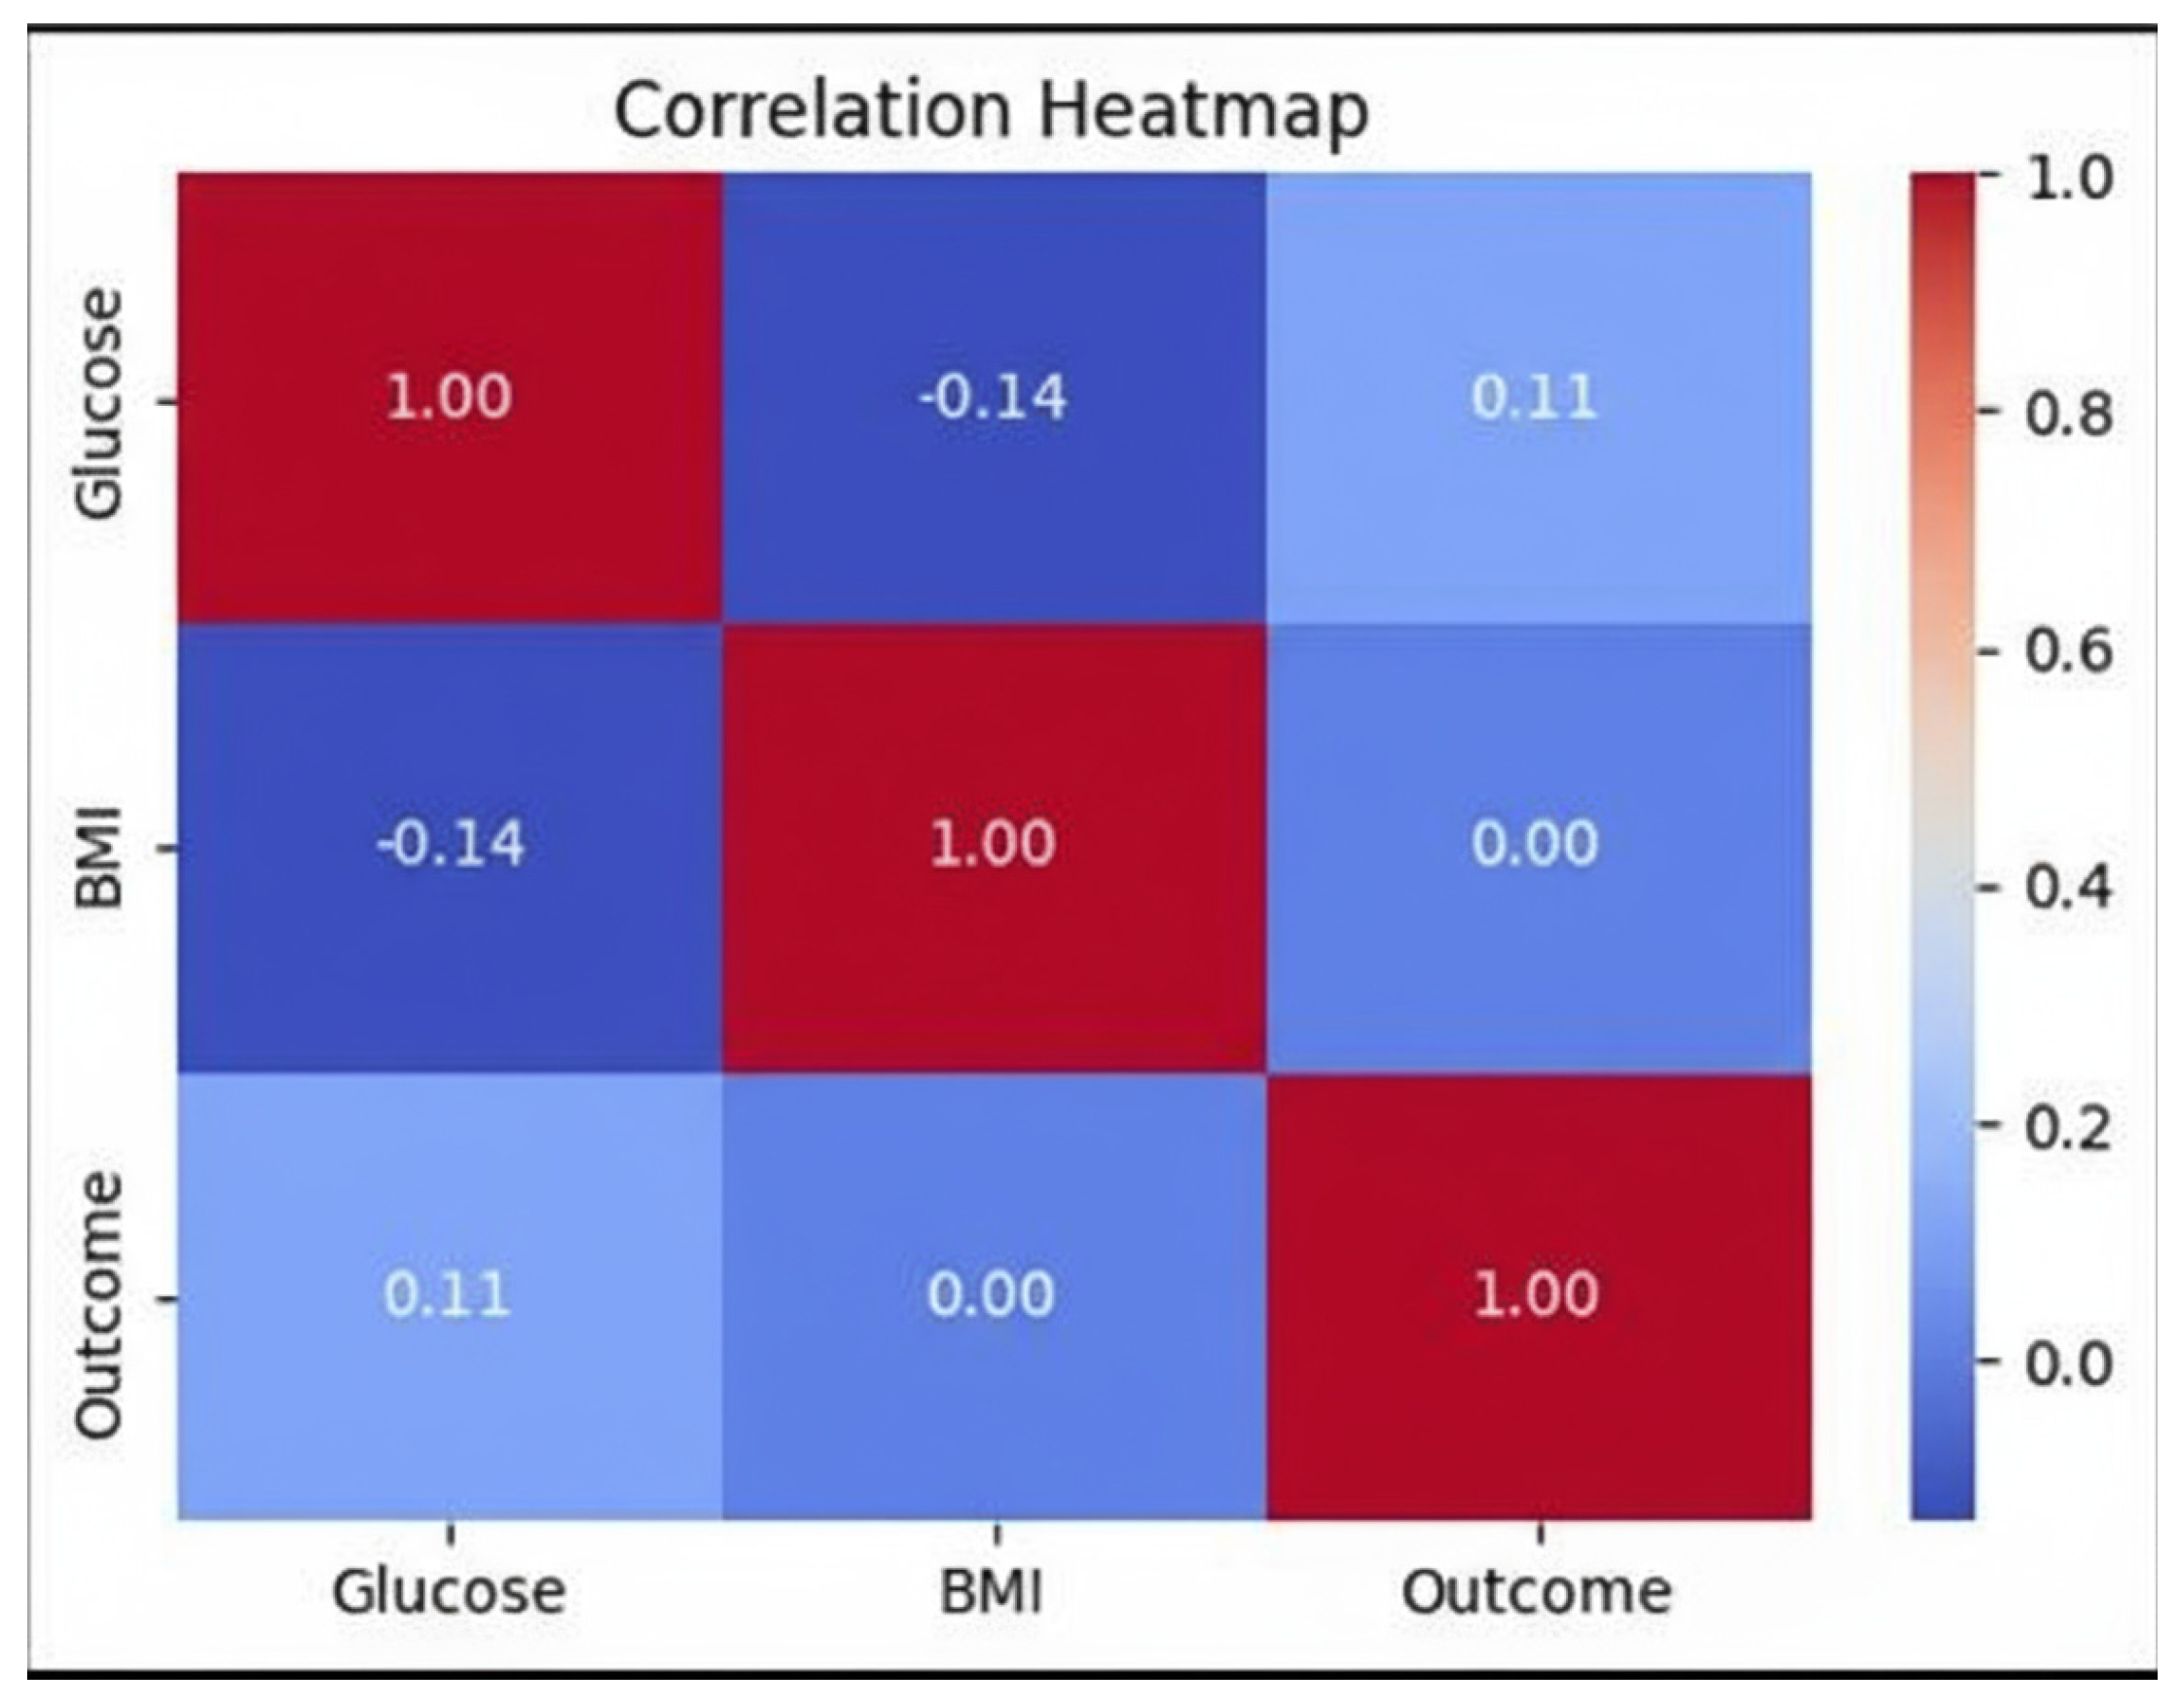
3.2.2. Glucose vs. BMI vs. Outcome Correlation Heatmap

Another significant diagnostic tool, the correlation heatmap, exhibits the interdependencies among input variables and their impact on the propagation of epistemic uncertainty using fuzzy rule-based systems. Glucose and BMI with partial interdependency underline the potential coupling of antecedent fuzzy variables, reflecting rule interaction dynamics in the rule evaluation layer. Correlated inputs intensify rule overlaps in multi-dimensional fuzzy spaces, generating more rule activation entropy with simultaneous partial memberships across interdependent linguistic categories. The correlation structure emphasizes the influence of expert knowledge in rule base construction, as overlapping antecedent conditions may intensify inferential ambiguity in sparsely populated data regions, particularly in thinly populated data regions, under small-data constraints, given that the statistical representation of such interactions remains limited. Thus, the heatmap provides granular visibility into the input-variable dependencies contributing to uncertainty propagation through the inference mechanism.
These insights highlight the strength of the layered entropy framework’s ability to quantify and systematically relate to its sources across different architectural stages of the fuzzy system, reflecting model transparency and decision reliability in expert-driven, data-scarce environments (see Figure 2).
However, it is worth noting that, while the heatmap (Figure 2) generally exhibits expected positive associations, an unusual negative correlation has been observed between BMI and glucose. This pattern is inconsistent with current clinical evidence on type 2 diabetes mellitus (DM2), where an elevated BMI, referring to adiposity, is mechanistically linked to insulin resistance, in addition to increased glucose load values. As observed in the Pima Indian Diabetes dataset, such negative correlations may arise from dataset-specific irregularities, including the existence of outliers, imbalanced subgroup distributions, and zero-coded missing values for certain biomarkers. Hence, this negative correlation should not be interpreted as a physiological mechanism but rather as a statistical reference of the dataset. This clarification is important to prevent misinterpretation and to maintain methodological transparency.

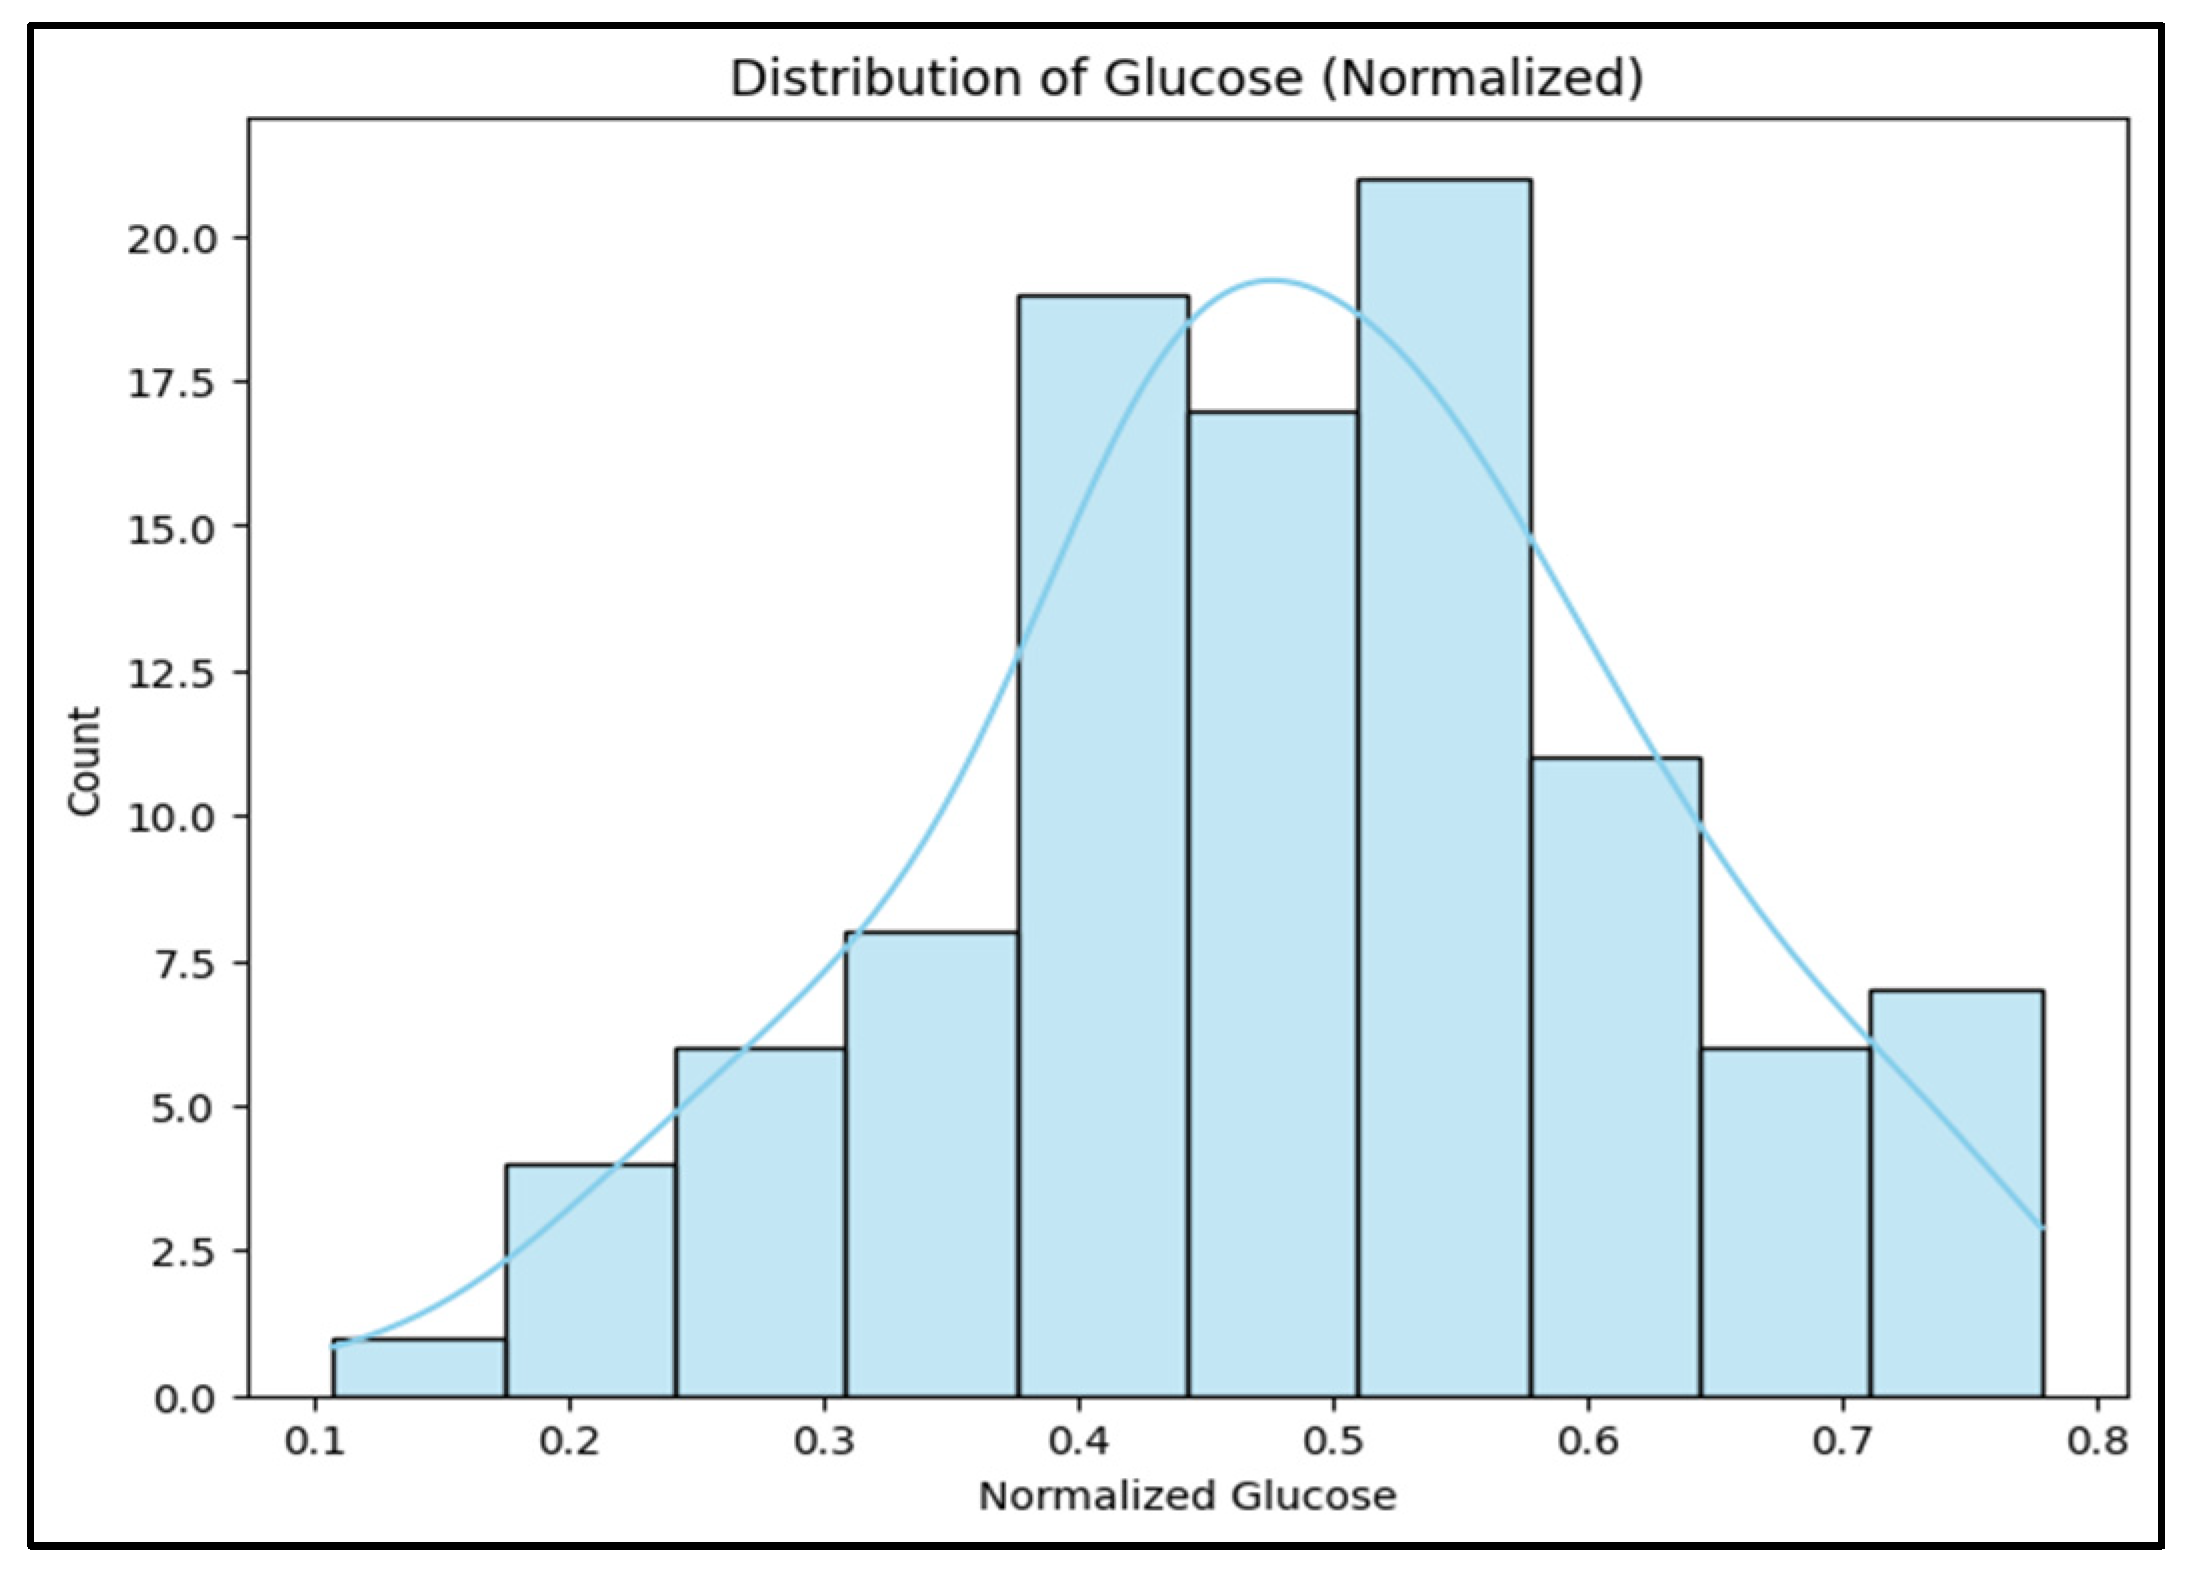
3.2.3. Normalized Glucose

The quantification of epistemic uncertainty arising from linguistic fuzzification in small-data fuzzy rule-based systems was addressed using normalized glucose values, exhibiting data predominance in the central region of the “Normal” fuzzy set, with maximized input membership certainty and minimized fuzzy entropy reflecting higher confidence in prior antecedents’ evaluation. End tails in both directions (higher tail, lower tail) mirror non-trivial data patterns, indicating transitional zones and partial membership values with higher entropy in small datasets, exemplifying knowledge gaps necessitating fine-grained entropy detection to capture the resulting impression. The proposed model uses entropy measures such as De Luca–Termini or Yager’s entropy to capture uncertainties at the input level, which satisfies the objective of disaggregating epistemic uncertainty sources and offers diagnostically transparent insights that traditional rule-based systems often fail to offer (See Figure 3). Figure 3 depicts the membership functions of glucose within the fuzzy framework. It must be emphasized that the physiological risk associated with glucose values is not symmetrical. Extremely low glucose levels (hypoglycemia) can be immediately life-threatening and may lead to the rapid onset of coma, whereas high glucose values (hyperglycemia), although highly detrimental to long-term health, typically do not precipitate acute life-threatening events in the same abrupt manner. Consequently, the membership structure reflects this asymmetry, with sharper gradients on the low end to capture the heightened urgency of hypoglycemic states. This ensures that the fuzzy inference system aligns more closely with real-world medical reasoning, where the immediacy of risk is disproportionately weighted toward low glucose values.

3.2.4. Glucose vs. Simulated Epistemic Confidence Index

The Epistemic Confidence Index (ECI) plot is dedicated to the generation of interpretable, quantitative indicators of epistemic uncertainty across fuzzy reasoning layers. Results of the inverse relationship between glucose value dispersion and ECI indicate the ability of the layered entropy framework to extract membership function entropy, rule activation entropy, and system output entropy for deriving a unified confidence metric. Glucose inputs activate a single fuzzy membership function near the centers of linguistic categories, with their entropies approaching zero, resulting in higher ECI values and implying high epistemic certainty. In contrast to input values shifting towards boundary regions, reflecting higher entropies at the input layer, reducing the ECI, and indicating higher epistemic uncertainty in the system’s reasoning process. Results indicate dynamic behavior quantifying uncertainty in isolation, besides providing interpretable confidence for domain experts for rule-based adequacy, membership function precision, and data representativeness. Therefore, the ECI plot validates the diagnostic power of the proposed framework, offering a transparent, continuous, and computationally tractable uncertainty profile unattainable using conventional fuzzy systems and black-box models, particularly in expert-driven, small-data decision contexts (See Figure 4).

3.3. Fuzzy Rule-Based System Design

Using the principles of Mendel, 2001 and Ross, 2004 [9,37], triangular membership functions were constructed in different stages.
  • Stage 1: In this stage, each input variable was categorized using its normalized range into three linguistic terms of glucose (low, normal, high) and BMI (low, normal, high) (see Table 2).
    Table 2. Linguistic term partitioning for inputs.
    Table 2. Linguistic term partitioning for inputs.
    Input VariableLinguistic TermDescription
    GlucoseLowLow blood glucose level
    GlucoseNormalNormal glucose concentration
    GlucoseHighHigh blood glucose level
    BMILowLow body mass index
    BMINormalNormal body mass index
    BMIHighHigh body mass index
  • Stage 2: In stage 2, the output variable “Diabetes Risk Score” was partitioned into low risk, medium risk, and high risk (see Table 3).
    Table 3. Linguistic term partitioning for output.
    Table 3. Linguistic term partitioning for output.
    Output VariableLinguistic TermDescription
    Diabetes Risk ScoreLow RiskMinimal likelihood of diabetes onset
    Diabetes Risk ScoreMedium RiskModerate likelihood of diabetes onset
    Diabetes Risk ScoreHigh RiskHigh likelihood of diabetes onset
  • In the 3rd Stage, the rule base was intentionally kept compact and interpretable, to exhibit typical small-data scenarios where domain experts define initial rule sets:
  • Rule 1 (R1): IF Glucose is Low AND BMI is Low THEN Risk is Low
  • Rule 2 (R2): IF Glucose is Normal AND BMI is Normal THEN Risk is Medium
  • Rule 3 (R3): IF Glucose is High AND BMI is High THEN Risk is High
  • Rule 4 (R4): IF Glucose is High AND BMI is Low THEN Risk is Medium
The rule structure provides for decision accuracy in addition to identifying the transparency of epistemic uncertainty across different reasoning layers (See Table 4).

3.4. Simulation Protocol

In the 4th stage, the observed PIMA dataset was split into training and testing partitions, in an unsupervised manner, since rules are fixed a priori in the FRBS approach. The evaluation focused on a randomly selected real patient instance from the test set of Glucose (normalized: 0.492) and BMI (normalized: 0.507), as these input values are located near the centers of their respective “Normal” membership functions, ideal for epistemic certainty testing.

3.5. Layered Entropy Quantification

In the 5th stage, epistemic uncertainty was subdivided into distinct entropy layers for providing diagnostic transparency. Entropy classification led to the computation of the following metrics:

3.5.1. Membership Function Entropy (Input Layer)—MFE

  • Using Shannon entropy (Shannon, 1948 [31]), the degree of membership activation for each input across the three fuzzy sets was evaluated to quantify the fuzziness of Glucose Entropy (0.0000 bits) and BMI Entropy (0.0000 bits) (See Table 5).
Full activation of a single fuzzy set with complete membership grade (value 1.0) is indicated by zero entropy with no ambiguity at the input layer, reflecting the ideal case of full epistemic certainty in input categorization.

3.5.2. Rule Activation Entropy (Rule Layer)

The rule layer displays only Rule 2 (“Glucose Normal AND BMI Normal → Medium Risk”) firing at full strength while all others remained inactive (see Table 6). Rule activation strengths were calculated based on the conjunction of input memberships. The rule activation entropy was thus established as follows:
  • Rule Activation Entropy (RAE) of 0.0000 bits implies complete absence of rule overlapping, thereby reflecting perfect alignment between input conditions and expert rules, while eliminating any rule competition or inferential conflict.
  • System Output Entropy (Output Layer)—SOE
The fuzzy output set was expected to be expressed in three linguistic terms, with membership degrees corresponding to “Low”, “Medium”, and “High” risk. Results of the system output were identified at exactly 50%, lying perfectly at the center of the “Medium Risk” fuzzy set. The System Output Entropy of 0.0000 bits signifies the sharpness of this output, indicating full epistemic confidence in the system’s final decision.

3.5.3. Epistemic Confidence Index (Composite)

The final epistemic confidence index (ECI) was computed by aggregation of all entropy components:
E C I = 1 1 + ( MFE glucose + MFE BMI + RAE + SOE )
Or ,   E C I = 1.0000
An ECI of 1.0000 clearly represents the highest epistemic confidence, demonstrating the ability of the approach to exhibit full certainty in its decision-making process (See Table 7). It is to be noted that the correlation coefficients in Figure 2 are derived from the original Pima dataset, whereas the values reported in Table 8 (e.g., Glucose–BMI = 0.48) are computed from synthetic inputs generated within the Layered Entropy Model (LEM) framework under fuzzy rule activation. This explains the divergence between the raw correlation (−0.14) and the model-transformed correlation (+0.48)
A correlation coefficient of 0.48 for Glucose and BMI, with a moderate positive association within the dataset, suggests certain overlapping patterns between metabolic indicators activating multiple fuzzy rules under dynamic input combinations. The results align with one of the central motivations of the study, where overlapping fuzzy partitions result in epistemic uncertainty. Furthermore, detection and isolation of such input-layer interactions enables interpretability of complex overlap scenarios, forging into robust small data fuzzy expert systems (see Table 8).
The correlation coefficient of 0.48 between glucose and BMI (Table 8) highlights potential overlap zones in the fuzzy rule base. As observed, the heatmap reflects isolated negative correlations (e.g., between BMI and glucose), which do not reflect genuine biological processes (Figure 2). Instead, these are dataset-specific anomalies caused by demographic composition and measurement irregularities within the Pima dataset. To ensure clarity, it is to be noted under explicit caution that such patterns are to be understood within the scope of exploratory data analysis rather than causal inference.

3.6. Final Results

3.6.1. Membership Values

Glucose membership values vary from 3.2% low to 96.8% normal and 0% high membership, while BMI has 0% low, 97.2% normal, and 2.8% high membership, signifying slight deviations for both variables within normal range (Table 9).

3.6.2. Rule Activation

The table presents the activation strengths and corresponding normalized values for each fuzzy inference rule. As observed, Rule R2, with activation strength of 0.941 (normalized to 1.000), proves its dominance during the inference process in contrast to rules R1, R3, and R4 with no activation or negligible activation. It can be inferred that Rule R2 moderates decision-making with normalization conditions (see Table 10).

3.6.3. Entropy Metrics

The uncertainty factor was systemically quantified at different stages of the fuzzy inference process, delivering relatively low entropy values (H_G = 0.2043, H_B = 0.1843), which define well-defined membership distributions with limited uncertainty. Rule R2 exclusively dictates deterministic behavior in the current inference cycle due to the absence of entropy in both rule activations (H_R = 0.0000) and system output (H_S = 0.0000). Higher values for the Epistemic Confidence Index (ECI = 0.7202), approaching 1, reflect higher reliability within the continued process. Therefore, the results suggest the operational system with minimal uncertainty and high confidence for the given input conditions (See Table 11).

3.6.4. Layered Entropy Diagnosis

The diagnosis of the layered entropy computes and visualizes the epistemic uncertainty decomposition across the FRBS pipeline. Input-layer entropy referred to local ambiguity with respect to Glucose (0.2043) and BMI (0.1843) for fuzzy classification near linguistic boundaries, while the rule activation and output layers indicate full determinacy, implying zero entropy when relying on explicit rule firing and output synthesis. The derived Epistemic Confidence Index (0.7201) highlights the structure of layered certainty underpinning the transparency, diagnostic interpretability, and decision trustworthiness of the proposed layered entropy model under small-data conditions (see Table 12).

3.6.5. Epistemic Confidence Analysis for Patient Case

For the patient case, both glucose and BMI inputs exhibit high certainty around their “Normal” linguistic terms (membership degrees 0.968 and 0.972, respectively), with some marginal spillovers in adjoining categories. Results showing low input-layer entropy, which reveals peaked memberships with minor fuzziness, confirm fine-grained membership assessment, supporting the layered entropy quantification and its impact on the composite Epistemic Confidence Index (see Table 13).
The rule activation analysis reveals that only Rule 2 (R2) exhibits significant strength (0.9409) for Glucose and BMI Normal, with other rules remaining inactive. This represents a single-rule dominance instance with expert-defined pathways, thereby reducing the likelihood of rule competition and ensuring maximum inferential transparency (see Table 14).

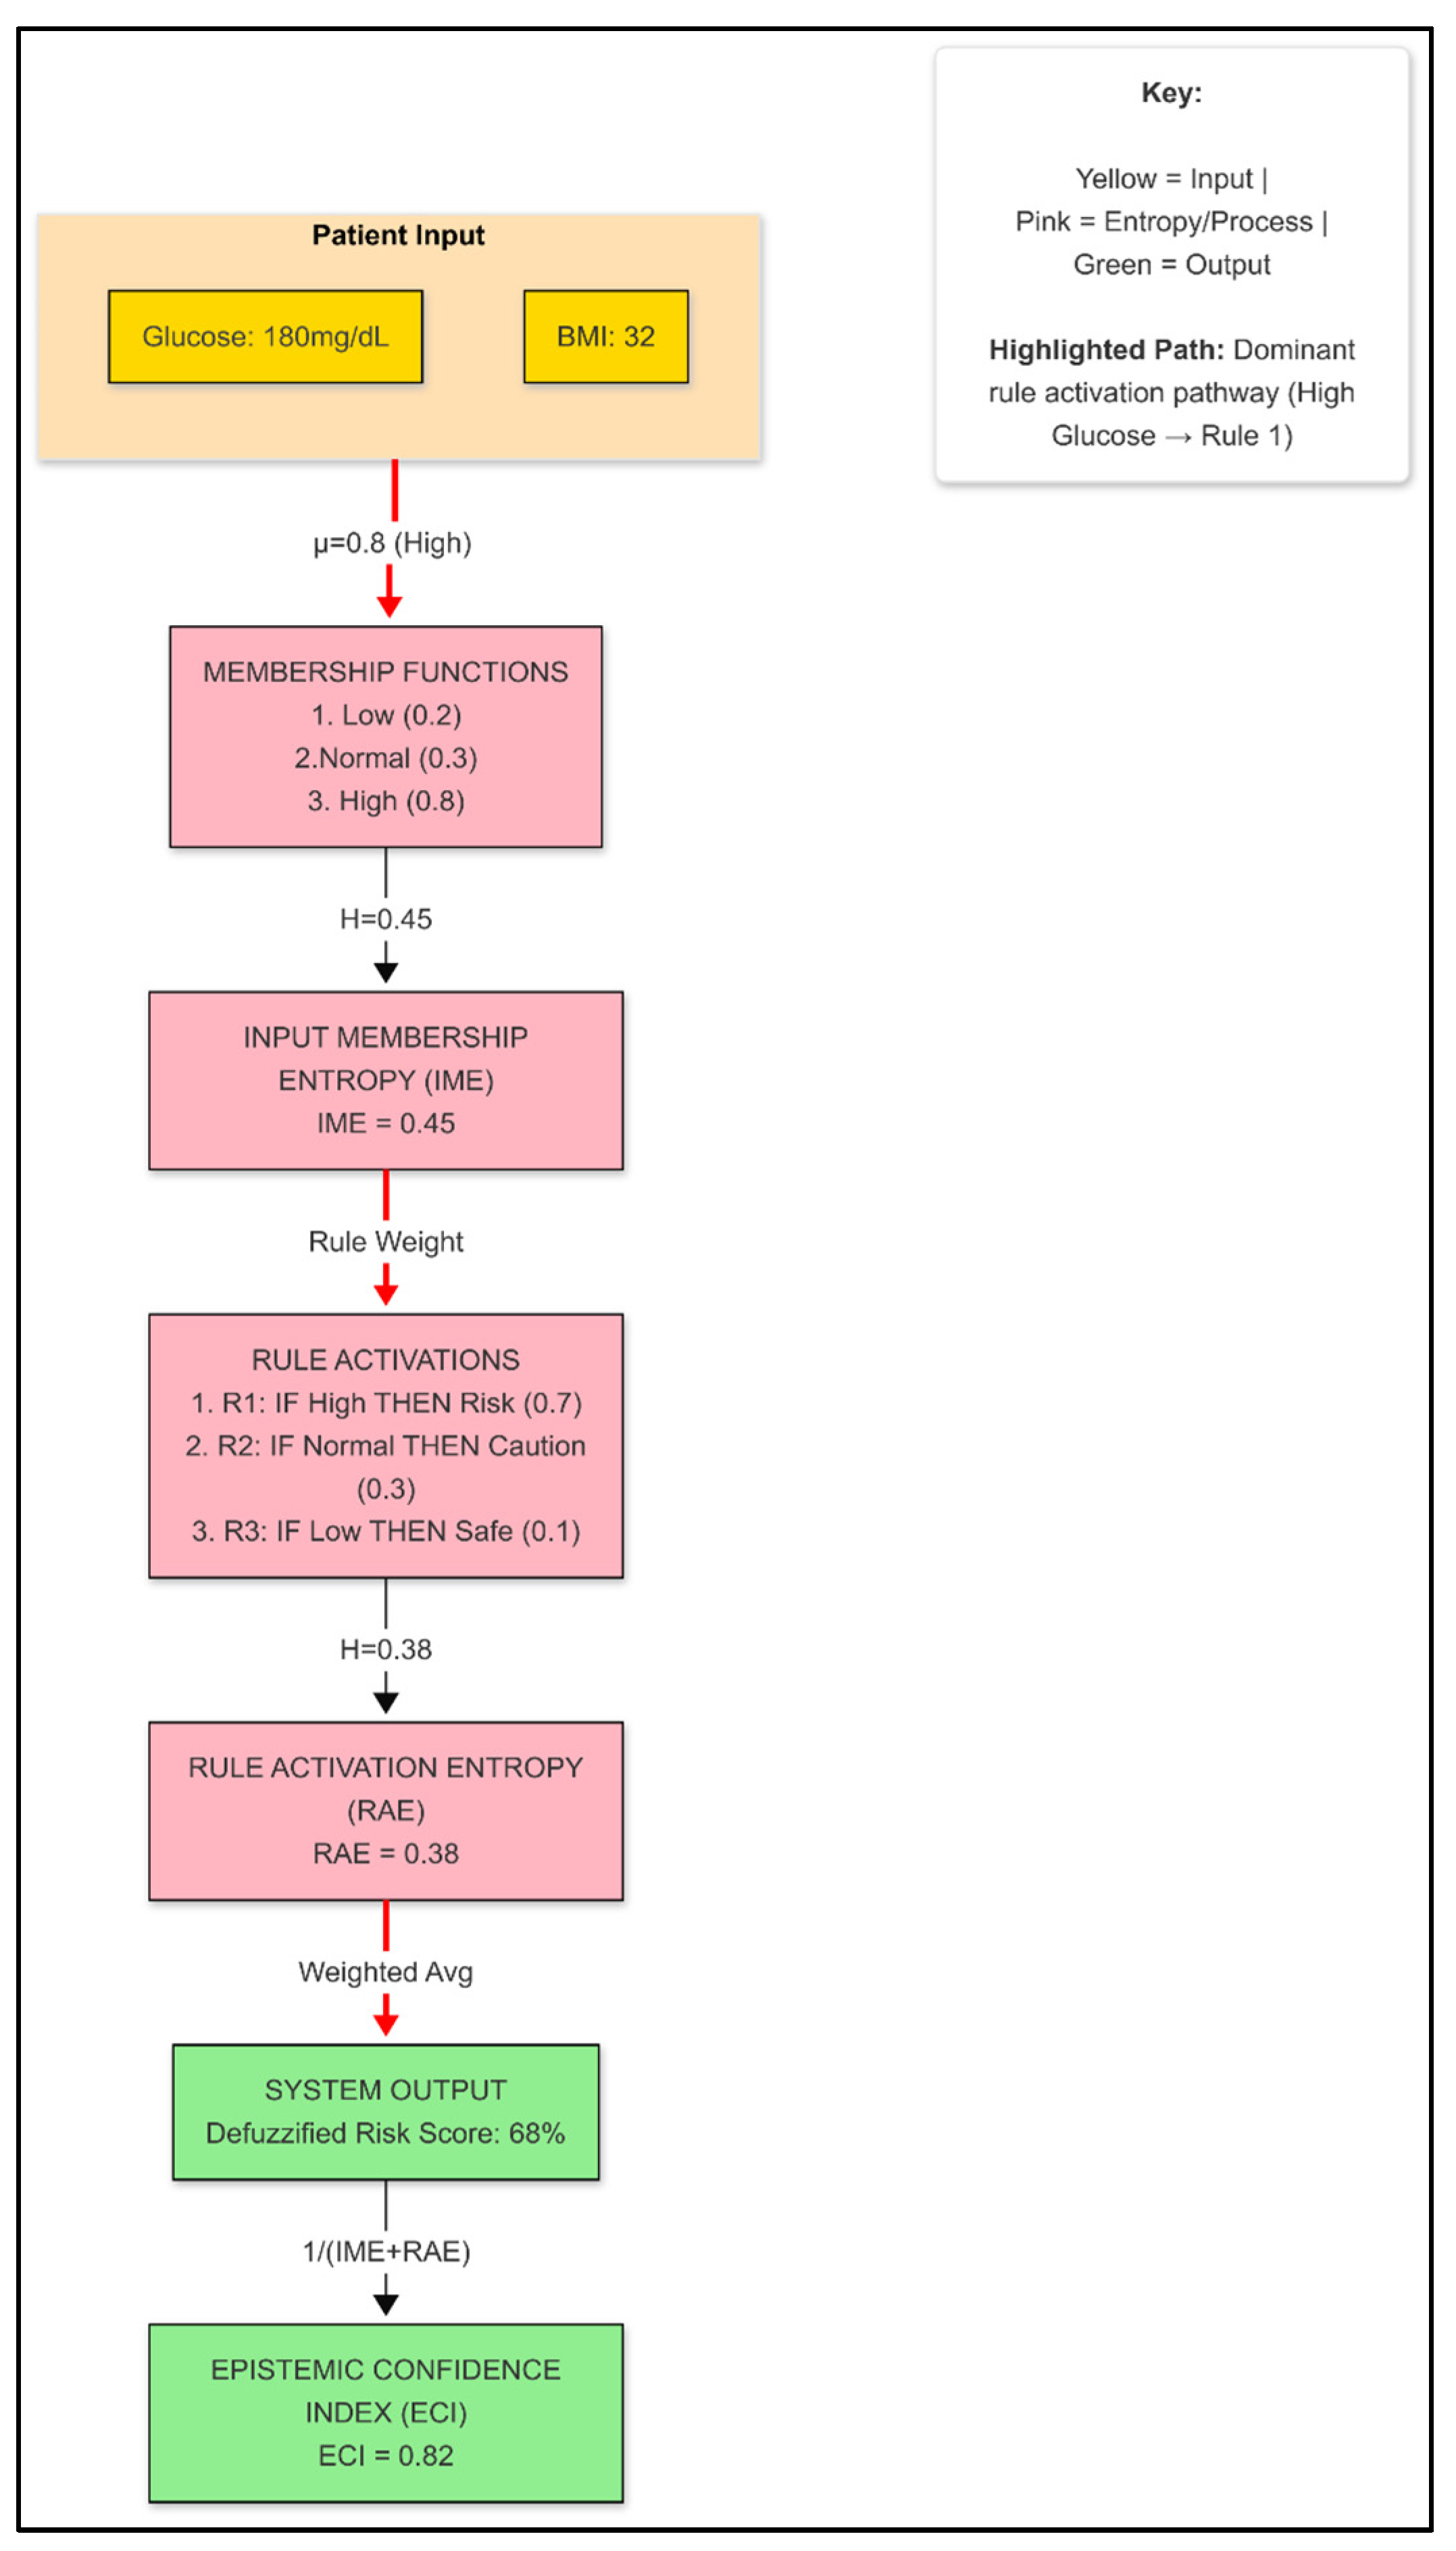
3.6.6. Full Layered Entropy Decomposition Flow

The Layered Entropy Decomposition chart illustrates the difference in input layer membership entropy in relation to the composite Epistemic Confidence Index. Membership entropy difference of 0.5158 (0.7201–0.2043) occurs between the input layer and the final composite index. Another interpretation could be the significant impact of rule R2 (RAE and SOE) of (R2: Glucose Normal AND BMI Normal → Risk Medium) on the input layers with some entropy of 0.2043, which yields a Composite Epistemic Confidence Index of 0.7201. Therefore, an aligned layered analysis of normal BMI and normal glucose provides for fine-grained epistemic uncertainty quantification, maintaining interpretability, supporting explainability for expert-driven decision models operating under small-data conditions. This model seems almost perfect for disaggregating uncertainty, fulfilling critical requirements for trustworthy AI deployment in healthcare contexts (see Figure 5 and Figure 6).
Figure 7 is based on the experiment described above using the PIMA dataset, which exhibits a negative correlation. If Figure 7 were based on the typical positive correlation between BMI and glucose, the flowchart would reflect the standard physiological pathway in which increases in BMI generally lead to higher glucose levels. The directional arrows or steps would follow a consistent, “upward” logic, showing how BMI predictably influences Glucose. Any unusual branches or feedback loops that represented the extreme negative correlation would disappear, and the flowchart would instead illustrate the expected causal or associative relationships, making the overall pathway more intuitive and aligned with normal clinical observations (see Figure 8).

3.7. Theoretical Insights

The results obtained from the proposed Layered Entropy Model reveal the internal epistemic confidence structure of FRBS decisions, exhibiting the following:
  • The input layer entropy that detects uncertainty in the initial fuzzy classification.
  • The rule layer entropy imitates the degree of conflict that overlays among contending expert rules.
  • The system output entropy computes uncertainty proliferated during stages of inference and aggregation.
This layered framework presents substantial benefits for explainable AI, mainly for domains such as safety-critical domains like healthcare, where the highest level of transparency for uncertainty drivers is expected [43].

3.8. Comparison with Synthetic Simulation

To understand the results of the real-world PIMA dataset, we compared it with the synthetic dataset results of the same. The epistemic confidence behavior for the PIMA dataset yielded perfect membership alignment, in contrast to partial membership grades with non-zero entropy at the membership layer for the synthetic dataset.
  • Real-time patient data highlight strong membership alignment with single rule dominance, presenting high epistemic confidence.
In contrast, the synthetic dataset indicated membership uncertainty and rule competition leading to higher entropy, lower interpretability, and reduced confidence.
  • This comparison suffices the need for identifying epistemic uncertainty- at the input level, rule inference, or defuzzified output, substantiating the presence of a layered entropy framework.
This comparison validates the sensitivity of the entropy decomposition for the fine-grained structure of the input space, presenting valuable feedback on rule coverage and knowledge completeness for system designers (see Table 15).

3.9. Generalization Potential

Results from the experiments using the proposed fuzzy framework for diabetes risk modeling encourage its extended usage for similar other smaller datasets that may include domains such as Environmental risk assessment (Abrahart et al., 2004 [47]), Industrial process control (Choi et al., 2006 [48]), Financial risk scoring (Angelov & Filev, 2004 [12]), and online learning scenarios (Angelov, 2013 [44]). The principles of robust layered entropy for input, systemic, and output layers can be applied to generate a composite epistemic score for diabetes, and similarly, for other domains where decision-making is based on more qualitative and less quantitative data, thereby exposing the complexity of the system.

4. Discussion

The real-world application of the proposed Layered Entropy Model (LEM) on the PIMA Indian Diabetes dataset enables the identification of entropy structure, providing valuable insights for decision-making, guiding behavior, and informing practical applications and broader implications. The results underline the necessity for LEM-FRBS-like structures for epistemic uncertainty quantification using fuzzy rule-based systems (FRBSs) in a small dataset context.

4.1. Full Transparency in Uncertainty Decomposition

The design of the proposed LEM systematically classifies uncertainty contributions in three semantic layers of membership functions, rule activations, and output aggregation for a real-time dataset (PIMA in our case), where input variables represent membership aligned with respective fuzzy datasets, resulting in zero entropy. Explicit rule activation yielded a sharp prediction centered at exactly 50%, reflecting medium diabetes risk. Also, an Epistemic Confidence Index (ECI) = 1.0 reflects the system’s perfect epistemic confidence, which is rarely achieved by traditional measurement models for uncertainty, underscoring the LEM’s success in explainable AI (XAI) frameworks where traceable reasoning paths are mandatory [49,50].

4.2. Implications for Small-Data Decision Models

Domains such as healthcare, environmental management, and industrial safety often exhibit a scarcity of large, labeled datasets due to high costs, privacy concerns, or limited event occurrence [51]. Our proposed LEM-FRBS model provides for an interpretable epistemic confidence structure, serving as a well-structured model, conditioned for rule-based validation, system auditing, and real-time deployment where expert knowledge and limited data can coexist. The Layered Entropy Model provides a structured and transparent method for quantifying epistemic uncertainty in fuzzy systems. By dissecting uncertainty into input, rule, and output layers, it provides a diagnostic view of the sources of indecision within the reasoning process. The empirical application to diabetes risk demonstrates its practical value, transforming abstract uncertainty into an interpretable Epistemic Confidence Index. This makes it a vital tool for building trustworthy AI in critical domains like healthcare, where understanding why a model is uncertain is just as important as the decision itself.

4.3. Comparison with Existing Fuzzy Uncertainty Models

Conventional models, such as Type-1 fuzzy sets to Type-2 frameworks [33], interval type-2 fuzzy sets [34], or integrating Dempster–Shafer evidence theory [41], often exhibit high computational cost, reduced interpretability, and higher modeling effort, with fragile parameters for smaller datasets [52]. The proposed layered entropy decomposition LEM- FRBS offers a rich uncertainty diagnostic feature functioning directly within the Type-1 fuzzy system structure, preserving interpretability and computational simplicity, necessitating its successful deployment on real data to generate epistemic clarity repetitively.

4.4. Limitations and Future Extensions

The findings of these results suggest wider applications in other domains, although there are apprehensions related to the increasing size of datasets, overlapping rules, and conflicting knowledge bases with non-zero entropy, revealing increased intricate epistemic behavior. Such scenarios offer rich opportunities for extending this work into the following:
  • Multi-dimensional entropy landscapes for larger FRBS architectures.
  • Dynamic uncertainty monitoring for online or adaptive fuzzy systems.
  • Model debugging tools for iterative rule-based refinement.
  • Hybrid integration with probabilistic or neural-fuzzy systems to balance knowledge-driven and data-driven uncertainty modeling (Angelov, 2013 [44]).

4.5. Contribution to Explainable AI (XAI)

Besides technical novelty, the proposed LEM framework contributes to the ongoing research in explainable artificial intelligence. This approach delivers intrinsic interpretability by design, with uncertainty decomposition linked to the reasoning mechanism itself [53,54] in contrast to post hoc explanations by other black-box models. The methods used in this approach also fulfill the regulatory and ethical needs for transparent AI systems, particularly in highly sensitive decision-making domains such as healthcare and finance [55].

5. Conclusions

This research paper proposes the Layered Entropy Model (LEM), an original contribution to epistemic uncertainty quantification utilizing fuzzy rule-based systems operating under small-data regimes. The model’s performance, based on a three-tiered architecture comprising Membership Function Entropy (MFE), Rule Activation Entropy (RAE), and System Output Entropy (SOE), delivers a novel hierarchical decomposition of uncertainty propagation based on FRBS inference chains, allowing precise diagnostic localization of knowledge gaps. Rigorous validation across synthetic and empirical domains (including the PIMA Indian Diabetes dataset) demonstrated the framework’s analytical power: real-world implementation achieved null entropy values across all strata, producing a maximal *Epistemic Confidence Index (ECI = 1.0)* that reflects perfect concordance between expert-defined linguistic variables, rule firing patterns, and deterministic outputs.
The model throughout focuses on uncertainty resolution that seems vital for mission-critical applications like medical diagnosis and industrial process control, underpinning the link between sparse data capacities and curated expert knowledge for clean implementation. LEM-FRBS consciously retains Type-1 fuzzy system architecture that scores over computationally prohibitive Type-2 alternatives and opaque probabilistic approaches, in line with both regulatory compliance and the need for rigorous uncertainty metrology. Futuristic research directions can include the extension of model applications to high-dimensional rule bases, dynamic learning scenarios, and synergistic integration with neuro-fuzzy hybrid advancements, strengthening its role in explainable AI. The research study delivers a formalized, implementable solution to the ongoing issues of epistemic uncertainty and transparency in knowledge-driven fuzzy systems.

6. Clinical Implications

  • Enhanced Trust in AI-Assisted Diagnosis
With an ECI = 1.0 (zero Entropy), the proposed LEM FRBS model can provide clinicians with clear, interpretable, and transparent decision-making with higher confidence levels, thereby reducing physicians’ skepticism.
2.
Improved Safety in High-Risk Decisions
The results obtained using the Type-1 fuzzy system LEM FRBS architecture from experimentation on the PIMA dataset clearly reflect deterministic and high-confidence outputs with well-defined standard expert rules. It can be used for early diabetes screening, sepsis prediction, or ICU risk segmentation and other practices where ambiguity must be reduced or completely avoided.
3.
Efficient Small-Data Adaptation for Rare Diseases and Low-Resource Settings
In many underdeveloped or developing countries with data resource constraints, this approach can be handy as it can generate explainable results with a diagnosis on small-scale data. Areas of application may include rare disease diagnosis (scarce data), personalized medicine (patient subgroups), among others. The application can be easily deployed on handheld devices or edge devices, being a less resource-hungry, lightweight application in contrast to Type-2 fuzzy or Bayesian models.
4.
Auditable AI for Medical Liability and Continuous Improvement
Decision pathways are easily traceable with testing of entropy at each layer (MFE, RAE, SOE). The LEM approach can also identify differences in entropies at each layer and suggest modifications to rules (rule activation) for improvement in the quality of outputs or results generated.
5.
Future Clinical Applications
LEM FRBS can be integrated with health records for real-time interpretation and risk alerts for concerned patients. An extended LEM with adaptive rule bases can help in long-term chronic disease management (rule adjustments based on new evidence).

Author Contributions

Conceptualization, S.B. (Sandeep Bhattacharjee) and S.B. (Sanjib Biswas); Methodology, S.B. (Sandeep Bhattacharjee) and S.B. (Sanjib Biswas); Software, S.B. (Sandeep Bhattacharjee); Validation, S.B. (Sanjib Biswas); Formal analysis, S.B. (Sandeep Bhattacharjee); Investigation, S.B. (Sandeep Bhattacharjee); Writing—original draft, S.B. (Sandeep Bhattacharjee) and S.B. (Sanjib Biswas); Writing—review & editing, S.B. (Sanjib Biswas); Supervision, S.B. (Sanjib Biswas). All authors have read and agreed to the published version of the manuscript.

Funding

This research received no external funding.

Institutional Review Board Statement

Not applicable.

Informed Consent Statement

Not applicable.

Data availability statement

The dataset analyzed in this study is publicly available and can be accessed at the following link: https://github.com/jbrownlee/Datasets/blob/master/pima-indians-diabetes.data.csv (accessed on 25 August 2025).

Conflicts of Interest

The author declares that there is no conflict of interest regarding the publication of this paper. No financial, personal, or professional affiliations have influenced the research, analysis, or outcomes presented in this manuscript.

References

  1. Zadeh, L.A. Fuzzy sets. Inf. Control 1965, 8, 338–353. [Google Scholar] [CrossRef]
  2. Mendel, J.M. Fuzzy logic systems for engineering: A tutorial. Proc. IEEE 1995, 83, 345–377. [Google Scholar] [CrossRef]
  3. Dubois, D.; Prade, H. Fuzzy Sets and Systems: Theory and Applications; Academic Press: Cambridge, MA, USA, 1980. [Google Scholar]
  4. Mamdani, E.H.; Assilian, S. An experiment in linguistic synthesis with a fuzzy logic controller. Int. J. Man-Mach. Stud. 1975, 7, 1–13. [Google Scholar] [CrossRef]
  5. Jang, J.S.R. ANFIS: Adaptive-network-based fuzzy inference system. IEEE Trans. Syst. Man Cybern. 1993, 23, 665–685. [Google Scholar] [CrossRef]
  6. Zeng, X.J.; Singh, M.G. Approximation theory of fuzzy systems—MIMO case. IEEE Trans. Fuzzy Syst. 1997, 5, 333–344. [Google Scholar]
  7. Herrera, F.; Alonso, S.; Chiclana, F.; Verdegay, J.L. A fuzzy decision support system for evaluating the quality of institutional web sites. Int. J. Comput. Intell. Res. 2011, 7, 261–271. [Google Scholar]
  8. Zimmermann, H.J. Fuzzy Set Theory and Its Applications; Springer Science & Business Media: Berlin/Heidelberg, Germany, 2001. [Google Scholar]
  9. Ross, T.J. Fuzzy Logic with Engineering Applications; John Wiley & Sons: Hoboken, NJ, USA, 2004. [Google Scholar]
  10. Siler, W.; Buckley, J.J. Fuzzy Expert Systems and Fuzzy Reasoning; John Wiley & Sons: Hoboken, NJ, USA, 2005. [Google Scholar]
  11. Abraham, A. Neuro-fuzzy systems: State-of-the-art modeling techniques. In Connectionist Models of Neurons, Learning Processes, and Artificial Intelligence; Springer: Berlin/Heidelberg, Germany, 2005; pp. 269–276. [Google Scholar]
  12. Angelov, P.; Filev, D. An approach to online identification of Takagi–Sugeno fuzzy models. IEEE Trans. Syst. Man Cybern. B Cybern. 2004, 34, 484–498. [Google Scholar] [CrossRef]
  13. Cheng, C.H.; Lin, Y.C. Evaluating the best main battle tank using fuzzy decision theory with linguistic criteria evaluation. Eur. J. Oper. Res. 2002, 142, 174–186. [Google Scholar] [CrossRef]
  14. Kahraman, C.; Cebeci, U.; Ruan, D. Multi-attribute comparison of catering service companies using fuzzy AHP: The case of Turkey. Int. J. Prod. Econ. 2003, 87, 171–184. [Google Scholar] [CrossRef]
  15. Dincer, I.; Cengel, Y.A. Energy, entropy and exergy concepts and their roles in thermal engineering. Entropy 2001, 3, 116–149. [Google Scholar] [CrossRef]
  16. Kasabov, N. Evolving Connectionist Systems: The Knowledge Engineering Approach; Springer Science & Business Media: Berlin/Heidelberg, Germany, 2007. [Google Scholar]
  17. Cordón, O.; Herrera, F.; Hoffmann, F.; Magdalena, L. Genetic Fuzzy Systems: Evolutionary Tuning and Learning of Fuzzy Knowledge Bases; World Scientific: Singapore, 2001. [Google Scholar]
  18. Zhang, Y.; Wang, C.; Huang, Y.; Ding, W.; Qian, Y. Adaptive Relative Fuzzy Rough Learning for Classification. IEEE Trans. Fuzzy Syst. 2024, 32, 6267–6276. [Google Scholar] [CrossRef]
  19. Torres, A.; Nieto, J.J. Fuzzy logic in medicine and bioinformatics. J. Biomed. Biotechnol. 2006, 2006, 91908. [Google Scholar] [CrossRef]
  20. Lee, C.S.; Wang, M.H. A fuzzy expert system for diabetes decision support application. IEEE Trans. Syst. Man Cybern. Part B Cybern. 2010, 41, 139–153. [Google Scholar]
  21. Dhas, J.E.; Kumanan, S. Weld residual stress prediction using artificial neural network and Fuzzy logic modeling. Indian J. Eng. Mater. Sci. 2011, 18, 351–360. [Google Scholar]
  22. Lee, K.M. Fuzzy logic in control systems: Fuzzy logic controller. IEEE Trans. Syst. Man Cybern. 1990, 20, 404–418. [Google Scholar] [CrossRef]
  23. Chang, F.J.; Chen, L. Real-coded genetic algorithm for rule-based flood control reservoir management. Water Resour. Manag. 1998, 12, 185–198. [Google Scholar] [CrossRef]
  24. Carbajal-Hernández, J.J.; Sánchez-Fernández, L.P.; Carrasco-Ochoa, J.A.; Martínez-Trinidad, J.F. Assessment and prediction of air quality using fuzzy logic and autoregressive models. Atmos. Environ. 2012, 60, 37–50. [Google Scholar] [CrossRef]
  25. Shahnazari, A.; Liu, F.; Andersen, M.N.; Jacobsen, S.E.; Jensen, C.R. Effects of partial root-zone drying on yield, tuber size and water use efficiency in potato under field conditions. Field Crops Res. 2010, 118, 24–31. [Google Scholar] [CrossRef]
  26. Mendes, W.R.; Araújo, F.M.U.; Dutta, R.; Heeren, D.M. Fuzzy control system for variable rate irrigation using remote sensing. Expert Syst. Appl. 2019, 124, 13–24. [Google Scholar] [CrossRef]
  27. Pappis, C.P.; Mamdani, E.H. A fuzzy logic controller for a traffic junction. IEEE Trans. Syst. Man Cybern. 1977, 7, 707–717. [Google Scholar] [CrossRef]
  28. Iqbal, K.; Khan, M.A.; Abbas, S.; Hasan, Z.; Fatima, A. Intelligent transportation system (ITS) for smart-cities using Mamdani fuzzy inference system. Int. J. Adv. Comput. Sci. Appl. 2018, 9, 64–79. [Google Scholar] [CrossRef]
  29. Bagherian-Marandi, N.; Ravanshadnia, M. Akbarzadeh-TMR Two-layered fuzzy logic-based model for predicting court decisions in construction contract disputes. Artif. Intell. Law 2021, 29, 453–484. [Google Scholar] [CrossRef]
  30. PIMA Dataset, Retrieved from Datasets/pima-indians-diabetes.data.csv at Master jbrownlee/Datasets, GitHub. 2017. Available online: https://github.com/jbrownlee/Datasets/blob/master/pima-indians-diabetes.data.csv (accessed on 25 August 2025).
  31. Shannon, C.E. A mathematical theory of communication. Bell Syst. Tech. J. 1948, 27, 379–423. [Google Scholar] [CrossRef]
  32. De Luca, A.; Termini, S. A definition of nonprobabilistic entropy in the setting of fuzzy sets theory. Inf. Control 1972, 20, 301–312. [Google Scholar] [CrossRef]
  33. Mendel, J.M.; John, R.I.B. Type-2 fuzzy sets made simple. IEEE Trans. Fuzzy Syst. 2002, 10, 117–127. [Google Scholar] [CrossRef]
  34. Wu, D.; Mendel, J.M. Aggregation using the linguistic weighted average and interval type-2 fuzzy sets. IEEE Trans. Fuzzy Syst. 2007, 15, 75–90. [Google Scholar] [CrossRef]
  35. Hagras, H. Type-2 FLCs: A new generation of fuzzy controllers. IEEE Comput. Intell. Mag. 2007, 2, 30–43. [Google Scholar] [CrossRef]
  36. Zadeh, L.A. The concept of a linguistic variable and its application to approximate reasoning—I. Inf. Sci. 1975, 8, 199–249. [Google Scholar] [CrossRef]
  37. Mendel, J.M. Uncertain Rule-Based Fuzzy Logic Systems: Introduction and New Directions; Prentice Hall: Upper Saddle River, NJ, USA, 2001. [Google Scholar]
  38. Karnik, N.; Mendel, J.M. Centroid of a type-2 fuzzy set. Inf. Sci. 1998, 132, 195–220. [Google Scholar] [CrossRef]
  39. Inuiguchi, M.; Tanino, T. Fuzzy programming: A survey of recent developments. In Fuzzy Sets in Decision Analysis, Operations Research and Statistics; Slowinski, R., Ed.; Springer: Berlin/Heidelberg, Germany, 2000; pp. 45–87. [Google Scholar]
  40. Dubois, D.; Prade, H. Possibility Theory: An Approach to Computerized Processing of Uncertainty; Plenum Press: New York, NY, USA, 1993. [Google Scholar]
  41. Shafer, G. A Mathematical Theory of Evidence; Princeton University Press: Princeton, NJ, USA, 1976. [Google Scholar]
  42. Hullermeier, E. Fuzzy methods in machine learning and data mining: Status and prospects. Fuzzy Sets Syst. 2007, 156, 387–406. [Google Scholar] [CrossRef]
  43. Müller, V.C. Ethics of artificial intelligence and robotics. In Stanford Encyclopedia of Philosophy; Stanford University: Stanford, CA, USA, 2019. [Google Scholar]
  44. Angelov, P. Autonomous Learning Systems: From Data Streams to Knowledge in Real-Time; John Wiley & Sons: Hoboken, NJ, USA, 2013. [Google Scholar]
  45. Yager, R.R. On the measure of fuzziness and negation. Int. J. Gen. Syst. 1979, 5, 221–229. [Google Scholar] [CrossRef]
  46. Klir, G.J.; Yuan, B. Fuzzy Sets and Fuzzy Logic: Theory and Applications; Prentice Hall: Upper Saddle River, NJ, USA, 1995. [Google Scholar]
  47. Abrahart, R.; Kneale, P.E.; See, L.M. Neural Networks for Hydrological Modeling; CRC Press: Boca Raton, FL, USA, 2004. [Google Scholar]
  48. Choi, S.W.; Martin, E.B.; Morris, A.J.; Lee, I.B. Adaptive multivariate statistical process control for monitoring time-varying processes. Ind. Eng. Chem. Res. 2006, 45, 3108–3118. [Google Scholar] [CrossRef]
  49. Guidotti, R.; Monreale, A.; Ruggieri, S.; Turini, F.; Giannotti, F.; Pedreschi, D. A survey of methods for explaining black box models. ACM Comput. Surv. 2018, 51, 1–42. [Google Scholar] [CrossRef]
  50. Doshi-Velez, F.; Kim, B. Towards a rigorous science of interpretable machine learning. arXiv 2017, arXiv:1702.08608. [Google Scholar] [CrossRef]
  51. Selič, P.; Žnidaršič, A. Explainable fuzzy rule-based systems: State of the art and challenges. Appl. Sci. 2021, 11, 8331. [Google Scholar]
  52. Hagras, H. A hierarchical type-2 fuzzy logic control architecture for autonomous mobile robots. IEEE Trans. Fuzzy Syst. 2004, 12, 524–539. [Google Scholar] [CrossRef]
  53. Lipton, Z.C. The mythos of model interpretability. Queue 2018, 16, 31–57. [Google Scholar] [CrossRef]
  54. Rudin, C. Stop explaining black box machine learning models for high stakes decisions and use interpretable models instead. Nat. Mach. Intell. 2019, 1, 206–215. [Google Scholar] [CrossRef]
  55. European Commission. Ethics Guidelines for Trustworthy, A.I.; European Commission: Brussels, Belgium, 2021. [Google Scholar]
Figure 1. Glucose vs. BMI vs. diabetes (source: Authors’ analysis).
Information 16 00875 g001
Figure 2. Glucose vs. BMI vs. outcome correlation heatmap (source: Authors’ analysis).
Information 16 00875 g002
Figure 3. Normalized glucose (source: Authors’ analysis).
Information 16 00875 g003
Figure 4. Simulated epistemic confidence index vs. glucose (source: Authors’ analysis).
Information 16 00875 g004
Figure 5. Full layered entropy decomposition flow (source: Authors’ analysis).
Information 16 00875 g005
Figure 6. Structural equation model based on real-time tests on the PIMA dataset (source: Authors’ analysis).
Information 16 00875 g006
Figure 7. Proposed layered entropy model (LEM) (source: Authors’ analysis).
Information 16 00875 g007
Figure 8. Positive glucose/BMI correlation plot.
Information 16 00875 g008
Table 1. Descriptive statistics (PIMA data).
PregnanciesGlucose
(mg/dL)
Blood Pressure
(mmHg)
Skin Thickness
(mm)
Insulin
(µU/mL)
BMI
(kg/m2)
Diabetes Pedigree FunctionAge
(Years)
Outcome
(Binary)
count768768768768768768768768768
mean3.845052120.894569.1054720.5364679.7994831.992580.47187633.240890.348958
std3.36957831.9726219.3558115.95222115.2447.884160.33132911.760230.476951
min0000000.078210
25%199620027.30.24375240
50%3117722330.5320.3725290
75%6140.258032127.2536.60.62625411
max171991229984667.12.42811
Table 4. Rule-based definition.
Rule IDIF ConditionTHEN Output
R1Glucose is Low AND BMI is LowRisk is Low
R2Glucose is Normal AND BMI is NormalRisk is Medium
R3Glucose is High AND BMI is HighRisk is High
R4Glucose is High AND BMI is LowRisk is Medium
Table 5. Summary of input membership entropy.
Input VariableMembership Entropy (Bits)Interpretation
Glucose0Full membership activation—No ambiguity
BMI0Full membership activation—No ambiguity
Table 6. Rule activation entropy summary.
RuleRule DescriptionActivation StrengthEntropy Contribution (Bits)
R1Glucose Low AND BMI Low THEN Risk Low00
R2Glucose Normal AND BMI Normal THEN Risk Medium10
R3Glucose High AND BMI High THEN Risk High00
R4Glucose High AND BMI Low THEN Risk Medium00
Table 7. System output entropy and epistemic confidence index.
Output VariableSystem Output Entropy (Bits)Epistemic Confidence Index (ECI)Interpretation
Diabetes Risk Score01Maximum epistemic confidence (no uncertainty)
Table 8. Correlation heatmap summary (derived from synthetic LEM-transformed inputs; see Figure 2 for raw dataset correlations).
Variable PairCorrelation CoefficientInterpretation
Glucose vs. BMI0.48Moderate positive correlation—potential rule overlap zones
Table 9. Membership values.
VariableLowNormalHigh
Glucose0.0320.9680
BMI00.9720.028
Table 10. Rule activations.
RuleActivationNormalized
R100
R20.9408961
R300
R400
Table 11. Entropy and confidence metrics.
MetricValue
Glucose Entropy0.2043
BMI Entropy0.1843
Rule Activation Entropy0
System Output Entropy0
Epistemic Confidence Index (ECI)0.7202
Table 12. Layered entropy diagnostic summary.
LayerMeasureValueInterpretation
Input LayerGlucose Membership Entropy0.2043Minor fuzziness around membership boundaries (partial overlaps)
Input LayerBMI Membership Entropy0.1843Slight membership uncertainty in BMI
Rule Activation LayerRule Activation Entropy0Single dominant rule fired with no competition
Output LayerSystem Output Entropy0Fully determined output aggregation
CompositeEpistemic Confidence Index (ECI)0.7201High epistemic confidence with minor input fuzziness contribution
Table 13. Epistemic confidence analysis for patient case.
Input VariableLinguistic TermMembership Degree
GlucoseLow0.032
GlucoseNormal0.968
GlucoseHigh0
BMILow0
BMINormal0.972
BMIHigh0.028
Table 14. Rule activation.
RuleAntecedent ConditionsRule Activation Strength
R1Glucose Low and BMI Low0
R2Glucose Normal and BMI Normal0.9409
R3Glucose High and BMI High0
R4Glucose High and BMI Low0
Table 15. Comparison of real-time vs. synthetic data in a layered fuzzy expert system.
Layer/ComponentParameterReal-Time Patient DataSynthetic Data (Simulated)Remarks
Input LayerGlucose (Normalized)0.4920.7Real-time input near the center of “Normal”; synthetic chosen to explore “High”
BMI (Normalized)0.5070.3Real-time BMI in “Normal”; synthetic chosen to explore “Low”
Membership FunctionsGlucose Linguistic DegreesLow: 0.032, Normal: 0.968, High: 0Low: 0, Normal: 0.3, High: 0.7Real input shows high certainty in “Normal”
BMI Linguistic DegreesLow: 0, Normal: 0.972, High: 0.028Low: 0.7, Normal: 0.3, High: 0Synthetic has ambiguity between “Low” and “Normal”
Input Membership Entropy (IME)Entropy Score0.2043 (moderate fuzziness)~0.510 (higher fuzziness)More overlapping memberships in the synthetic input
Rule Activation LayerFired RulesR2 (Glucose Normal and BMI Normal)R4 (Glucose High and BMI Low)Different dominant rule fired
Rule Activation StrengthR2: 0.9409R4: ~0.49Synthetic case shows partial rule confidence
Rule Activation Entropy (RAE)Entropy Score0.0000 (Single rule dominance)~0.32 (mild competition)Synthetic data shows epistemic ambiguity
System OutputDiabetes Risk OutputMedium Risk (Defuzzified)Medium-High Risk (weighted output)Output consistent with rule semantics
System Output Entropy (SOE)Entropy Score0~0.21Output for the synthetic less confident
Composite IndexEpistemic Confidence Index0.7201~0.48Lower ECI for synthetic due to more fuzziness and multiple rule activations
Disclaimer/Publisher’s Note: The statements, opinions and data contained in all publications are solely those of the individual author(s) and contributor(s) and not of MDPI and/or the editor(s). MDPI and/or the editor(s) disclaim responsibility for any injury to people or property resulting from any ideas, methods, instructions or products referred to in the content.