Article

Research on Trade Credit Risk Assessment for Foreign Trade Enterprises Based on Explainable Machine Learning

1
School of Management Science and Engineering, Beijing Information Science and Technology University, Beijing 102206, China
2
School of Economics and Management, Beijing University of Posts and Telecommunications, Beijing 100876, China
*
Author to whom correspondence should be addressed.
Information 2025, 16(10), 831; https://doi.org/10.3390/info16100831
Submission received: 24 August 2025 / Revised: 19 September 2025 / Accepted: 24 September 2025 / Published: 26 September 2025

Abstract

As global economic integration deepens, import and export trade plays an increasingly vital role in China’s economy. To enhance regulatory efficiency and achieve scientific, transparent credit supervision, this study proposes a trade credit risk evaluation model based on interpretable machine learning, incorporating loss preferences. Key risk features are identified through a comprehensive interpretability framework combining SHapley Additive exPlanations (SHAP) and Local Interpretable Model-agnostic Explanations (LIME), forming an optimal feature subset. Using Light Gradient Boosting Machine (LightGBM) as the base model, a weight adjustment strategy is introduced to reduce costly misclassification of high-risk enterprises, effectively improving their recognition rate. However, this adjustment leads to a decline in overall accuracy. To address this trade-off, a Bagging ensemble framework is applied, which restores and slightly improves accuracy while maintaining low misclassification costs. Experimental results demonstrate that the interpretability framework improves transparency and business applicability, the weight adjustment strategy enhances high-risk enterprise detection, and Bagging balances the overall classification performance. The proposed method ensures reliable identification of high-risk enterprises while preserving overall model robustness, thereby providing strong practical value for enterprise credit risk assessment and decision-making.

1. Introduction

Foreign trade enterprises, defined as firms engaged in international trade and deriving profits primarily from import and export operations, are vital to China’s economic growth and global competitiveness. By mid-2023, more than 540,000 enterprises were active in foreign trade, highlighting both the dynamism of the sector and the increasing challenges of supervision. Traditional manual reviews and random inspections are labor-intensive, resource-consuming, and often lack transparent evaluation criteria, which undermines regulatory efficiency and credibility [1]. These limitations underscore the urgent need for data-driven, intelligent, and transparent mechanisms that can improve both fairness and effectiveness in credit risk management.
Unlike financial institutions, where credit risk often stems from insolvency, risks in foreign trade enterprises are more frequently associated with subjective behaviors such as misreporting or evasion in trade-related activities. As a result, their credibility is not determined solely by financial performance [2], but it is also influenced by organizational stability, regulatory compliance, and their capacity to adapt to the dynamics of global trade. These complexities make risk classification particularly challenging, as misclassifying high-risk enterprises as low-risk can result in disproportionately severe economic and regulatory consequences. Accordingly, the research problem addressed in this study is how to design a machine learning-based framework that can provide reliable classification of foreign trade enterprises, minimize the costs of misclassification, and deliver interpretable results that support transparent and fair supervision. Unlike most existing studies that mainly concentrate on the financial and banking sectors, this research focuses on credit risk assessment for foreign trade enterprises, a field that remains relatively underexplored despite its practical importance. Furthermore, while previous studies often employ a single interpretability method, we propose a unified multi-dimensional interpretability framework that integrates SHAP and LIME, thereby combining global feature importance with local instance-level explanations. In addition, unlike earlier models that overlook the asymmetric costs of misclassification, this study incorporates loss preferences into the LightGBM model and further enhances its robustness with a Bagging ensemble strategy. Finally, our model is validated using both third-party enterprise data and official customs datasets, which ensures a more comprehensive and reliable empirical evaluation. The main innovative contributions of this study can be listed as follows:
Multi-dimensional interpretable key risk feature identification framework: By integrating SHAP and LIME into a unified framework, this study constructs a multi-level interpretation approach that combines global feature importance with local instance-specific explanations. This framework enables accurate identification of critical credit risk factors and provides transparent, traceable interpretation paths, thereby enhancing both the credibility of model outputs and their acceptance in practical applications.
Loss-preference-based dynamic weighted evaluation model: To address the asymmetric cost of misclassifying high- versus low-risk enterprises, this study proposes a LightGBM model that incorporates loss preferences. By dynamically adjusting sample weights to emphasize high-risk enterprises, the model enhances their identification. While this weighting may slightly lower overall accuracy, the application of a Bagging ensemble strategy restores and even improves accuracy, all while maintaining low misclassification costs. This approach achieves a practical balance between accuracy and cost sensitivity, providing a robust framework for enterprise credit risk assessment.

2. Related Work

This study reviews related work in two main areas. First, we review the application of machine learning models in credit risk prediction, focusing on recent progress in ensemble methods and approaches that address misclassification costs. Second, we review studies that highlight the importance of transparency and interpretability in such models, focusing on the development and application of explainable machine learning techniques.

2.1. Application of Machine Learning Models in Enterprise Credit Risk Evaluation

Early research on corporate credit risk assessment mainly relied on statistical approaches such as probability models and regression-based scoring methods. With the advancement of artificial intelligence, machine learning algorithms have increasingly been applied to credit risk evaluation and have demonstrated superior performance compared to traditional techniques. Methods such as support vector machines (SVM), neural networks, random forests (RF), and gradient boosting algorithms have shown significant improvements in predictive accuracy and robustness.
Yao et al. [3] improved the classical slime mold algorithm by combining it with the basic Support Vector Machine (SVM) model for parameter optimization, thereby enhancing the rating model. Lu et al. [4] established a post-loan risk level evaluation model for consumer loans by integrating Genetic Algorithms (GA) with BP neural networks. In response to the default issues faced by real estate companies, Liu et al. [5] adopted various classification models for default risk prediction, concluding that the logistic model has the highest accuracy. Machado [6] utilized a hybrid machine learning algorithm that integrates both unsupervised and supervised machine learning methods to predict the credit scores of commercial clients. Sun [7] constructed a default rate calculation model based on logistic regression to estimate the expected default rates of enterprises; Meng et al. [8] focused on small and medium-sized enterprises, developing a credit risk assessment model using SVM; and Zhang et al. [9] applied the FA-SVM method to evaluate enterprise credit risk based on correlation and evaluation methods, implementing it in supply chain finance evaluations with varying indicator selections. Zhang et al. [10] established an indicator system for the risk assessment of the supply chain of badminton goods enterprises by integrating the steps of the Fuzzy Comprehensive Evaluation (FCE) method, proposing the modeling process of the Classification and Regression Tree (CART) algorithm within the overall supply chain risk decision tree based on these evaluation indicators.
Ensemble learning models integrate multiple weak learners, outperforming individual machine learning models in both predictive performance and model robustness. Some scholars have undertaken related research aimed at exploring the potential of ensemble learning methods in enhancing credit risk assessment effectiveness. Wang et al. [11] studied the issue of bond default risk, optimizing the parameters of the EXtreme Gradient Boosting (XGBoost) model using grid search algorithms and k-fold cross-validation, significantly improving prediction accuracy compared to existing models. Mitra et al. [12] constructed a knowledge graph-driven credit risk assessment model (RGCN-RF) based on relational graph convolutional networks (RGCN) and random forests (RF). Li et al. [13] utilized the BP-Adaboost model to evaluate corporate credit risk. Yu et al. [14] built a new weighted feature selection ensemble model, AR-WSAB, which measures feature importance to select an appropriate subset of features for inclusion in the ensemble model. Liu et al. [15] proposed an ensemble classification method based on genetic algorithms and random forests. Zhang et al. [16] introduced a two-layer feature extraction method based on gradient boosting decision trees (GBDT) and convolutional neural networks (CNN), ultimately using a logistic regression (LR) model for prediction; the results showed that the GBDT-CNN-LR model had the best performance, demonstrating good generalization ability and stability in reliability tests. Sun et al. [17] employed a one-vs-one decomposition fusion approach for multi-class classification, combining asymmetric bagging (AB) and Light Gradient Boosting Machine (LightGBM) to propose two new credit evaluation ensemble models. Zhang et al. [18] first utilized correlation coefficient methods and GBDT to select features, added attention mechanisms to the features of subsets separated from metadata, and subsequently trained four subsets using both XGBoost and LightGBM models, merging the training results of individual models under different subsets through Bayesian ridge regression. Machine learning, as a new technology, has injected new vitality into enterprise credit risk management [19].
However, an important limitation of many existing models is their insufficient treatment of misclassification costs. In credit risk management, misclassifying high-risk enterprises as low-risk ones (false negatives) often leads to far more severe consequences than false positives. Some studies have attempted to address class imbalance or improve minority class detection through resampling methods or weighting strategies. Zhang et al. [20] considered the fact of imbalanced data distribution, that is, the proportion of defaulting small and medium-sized enterprises is much smaller than that of non-defaulting small and medium-sized enterprises, and proposed a new method, which takes into account the actual losses caused by misclassification of credit risk prediction for small and medium-sized enterprises. Song et al. [21] proposed a multi-objective ensemble learning framework for specific ratings, effectively balancing the model’s default recognition ability and overall classification accuracy. While few studies have considered the asymmetric cost structure of misclassified credit risks in foreign trade based on practical considerations.

2.2. Interpretability Under Credit Risk Analysis

Alongside predictive performance, explainability has become an increasingly critical issue in credit risk management [22]. Stakeholders such as regulators and financial institutions require transparent and interpretable models to ensure fairness, trust, and practical applicability. In recent years, a growing body of research has focused on applying explainable artificial intelligence (XAI) methods to credit scoring and enterprise risk assessment. For instance, approaches such as partial dependency plots, feature quantification, and semi-supervised learning have been used to improve interpretability and highlight the most influential risk factors.
Teng et al. [23] introduced a new method called the “Rescaled Cluster-then-Predict Method”, which aims to improve the interpretability and predictive performance of credit scoring models. Park et al. [24] proposed an evaluation method that includes diversified quantification and semi supervised learning, which quantifies various information and mainly analyzes the identification of enterprise characteristics. Based on the results, several significant features are derived to improve the interpretability of the model. Xia et al. [25] evaluated corporate credit risk based on four commonly used machine learning algorithms and combined the evaluation results to use partial dependency graph method for visual analysis of important indicators. Jiang et al. [26] ranked the importance of feature values in the random forest model to identify the key influencing factors that measure the credit risk of real estate enterprises and assessed their risk. Chang et al. [27] also improved the transparency of artificial intelligence in supply chain finance credit risk control by ranking the importance of features that affect system decision-making. Xie et al. [28] innovatively designed a random forest weighted naive Bayes model with good interpretability. Zhao et al. [29] quantified the impact of various feature variables on model decision-making through SHAP values and analyzed the decision-making process of the model in a visual form.
Nevertheless, the application of explainable machine learning in the foreign trade domain remains limited. Existing studies are largely concentrated in the financial and banking sectors, and current approaches to interpretability often rely on a single method, offering only partial insights. Moreover, most models fail to explicitly address the asymmetric costs of misclassification, even though overlooking high-risk enterprises can be far more costly than misjudging low-risk ones. To bridge these gaps, this study develops an interpretable credit risk assessment framework tailored to foreign trade enterprises. Specifically, SHAP and LIME are integrated into a multi-dimensional interpretability system, LightGBM is enhanced with mechanisms to account for misclassification costs, and predictive robustness is further strengthened through Bagging. This design ensures both transparency and stability, enabling accurate identification of high-risk enterprises while maintaining practical applicability in regulatory contexts.

3. Material and Methods

3.1. Data Types and Sources

Firstly, this study uses the data from the third-party enterprise information service providers to cover multiple dimensions of enterprise characteristics. The enterprise credit risk label comes from the China Customs enterprise import and export credit information disclosure platform. The data is divided into two categories. The black sample (label 1) represents the list of dishonest enterprises, that is, enterprises with violations, tax risks or other negative behaviors in the credit rating system of the regulatory authorities; The white sample (label 0) represents the list of highly certified enterprises, which have high credit ratings, can operate in compliance and benefit from trade facilitation policies. Enterprise characteristics include basic information (such as registered capital, years in operation, and enterprise scale), financial status (such as paid-in capital), credit history (such as administrative penalty records), and intellectual property (such as trademarks, patents, and software copyrights). The dataset contains 3005 enterprises in total, of which 656 are labeled as high-risk enterprises (approximately 21.83%) and 2349 as low-risk enterprises (approximately 78.17%). This dataset provides a representative foundation for constructing and validating the credit risk evaluation model.
In addition, through consultation with domain experts, we obtained an official dataset that contains risk-related attributes recognized as critical for assessing the creditworthiness of foreign trade enterprises. The dataset includes 579,733 registered enterprises with import and export activities, among which 33,406 are high-risk enterprises, 46,327 are medium-risk enterprises, and the remainder are classified as low-risk. The feature set comprehensively reflects multiple aspects of enterprise operations, covering basic enterprise information (such as enterprise type, registered capital, and annual inspection date), credit indicators (such as public penalty records and licensing disclosures), behavioral characteristics (such as violation inspection rate and violation detection rate), as well as import–export taxation indicators. In subsequent experiments, the complete feature set of the official dataset is adopted to ensure that the model fully leverages its multidimensional information for risk identification and assessment. The two datasets and related information are shown in Table 1.

3.2. Data Pre-Processing

In data preprocessing, missing values for newly registered enterprises are imputed using the overall median for continuous variables and clear default values for categorical variables to avoid information loss and maintain model stability. Feature engineering includes standardizing registered and paid-in capital across currencies (Renminbi, Japanese Yen, Euro), adjusting business duration variables, calculating establishment age, and categorizing enterprise scale into four levels (large to micro). Categorical string features such as enterprise scale, province, and industry category are transformed via one-hot encoding to produce independent numerical representations suitable for modeling. To address class imbalance, the SMOTE algorithm is applied to synthetically generate minority class samples by interpolating between nearest neighbors, effectively increasing the number of high-risk (blacklist) enterprises and balancing the dataset, thereby improving the model’s ability to detect minority classes.

3.3. Methodology

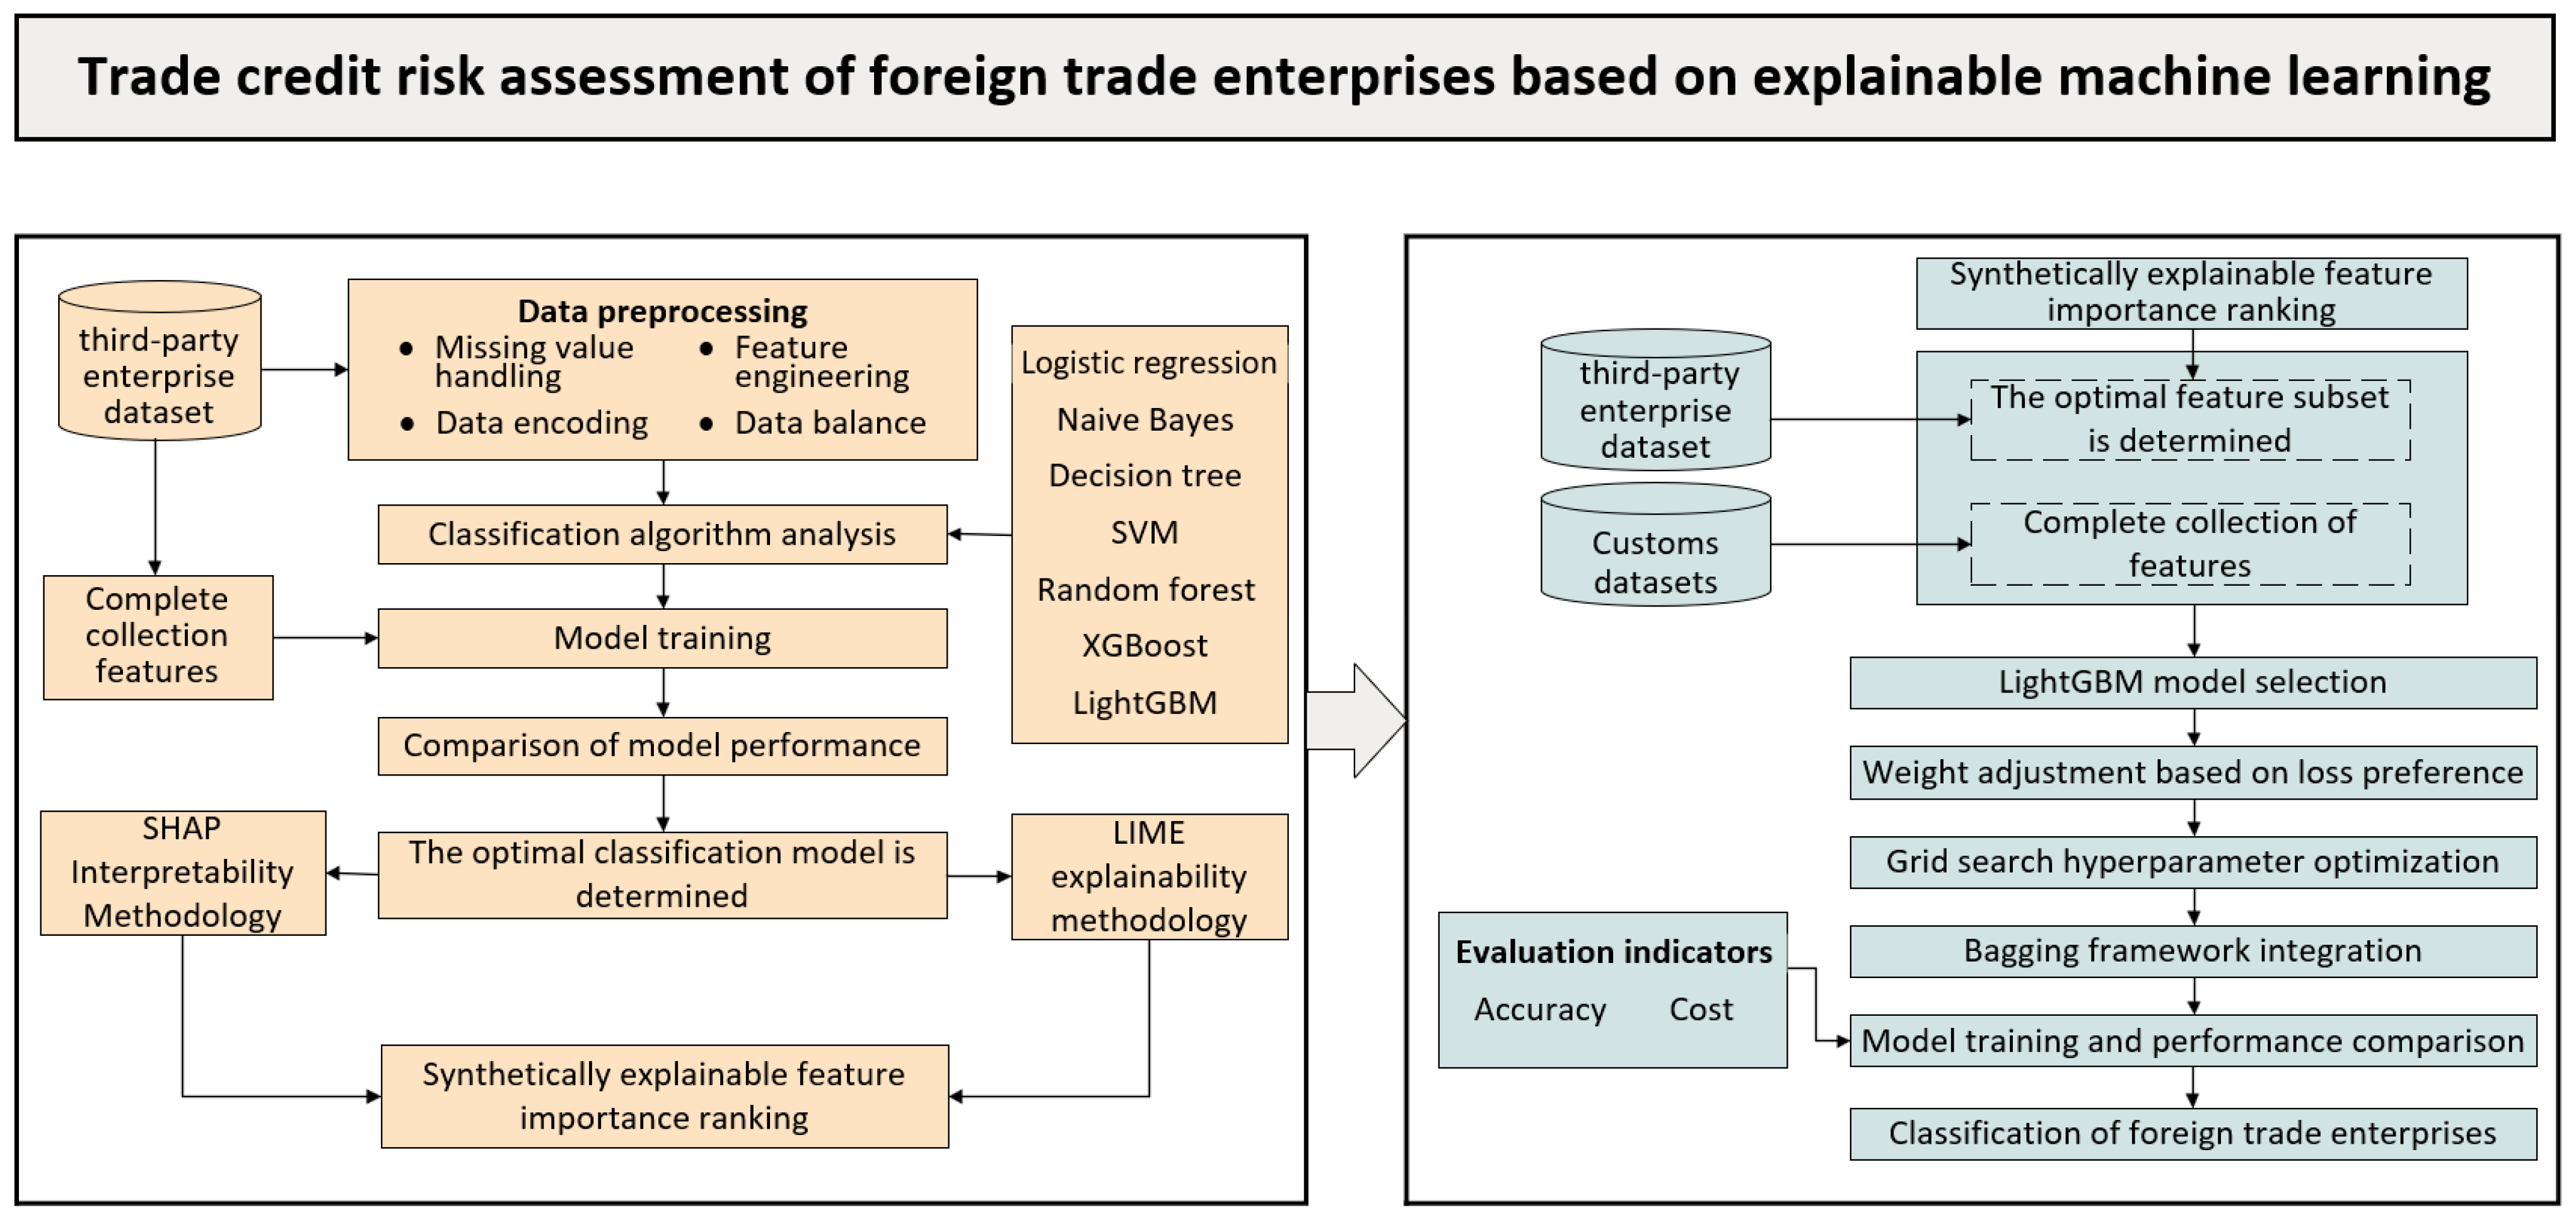
Figure 1 presents a research framework for trade credit risk evaluation of foreign trade enterprises based on interpretable machine learning. The framework includes two core stages: identification of key risk characteristics and construction of credit risk evaluation model, so as to accurately describe the credit risk level of foreign trade enterprises.

3.3.1. Classification Models

This section introduces several machine learning models used to construct a trade credit risk evaluation framework for foreign trade enterprises. Each model is trained on the complete feature set to compare their performance and identify those with superior overall effectiveness, laying the groundwork for subsequent feature selection.
Logistic Regression (LR) is a classic, interpretable algorithm widely used in credit risk assessment due to its robustness and resistance to overfitting. It estimates the probability that a sample belongs to a particular class through a logistic function applied to a weighted sum of input features.
Naive Bayes (NB) is a probabilistic classifier based on Bayes’ theorem, assuming feature independence. It calculates posterior probabilities for each class and selects the most probable one, making it suitable for datasets with many features.
Decision Trees (DT) recursively split data based on feature values to create a tree structure aimed at maximizing the purity of subsets. They are intuitive, easy to visualize, and do not require feature normalization.
Support Vector Machines (SVM) aim to find a hyperplane that maximizes the margin between classes, offering strong generalization, especially for high-dimensional data. SVMs have demonstrated excellent performance in credit risk classification.
Random Forest (RF) is an ensemble method combining multiple decision trees trained on random data subsets with feature randomness, using majority voting for classification. This approach reduces overfitting and enhances model robustness and generalization.
XGBoost is a gradient boosting ensemble method that iteratively builds trees to correct residual errors from previous models. It incorporates a regularization term to control model complexity and prevent overfitting, thus improving predictive accuracy.
LightGBM, an optimized gradient boosting framework, accelerates training and reduces memory use by discretizing continuous features and growing trees leaf-wise. It efficiently handles large datasets while maintaining strong performance.

3.3.2. Identification of Key Risk Features Based on Comprehensive Interpretative Methods

This section introduces comprehensive interpretability methods used to explain machine learning models for trade credit risk evaluation. SHAP (SHapley Additive exPlanations) is a model-agnostic interpretability method grounded in game theory’s Shapley values [30]. The global interpretability of SHAP comes from aggregating feature contributions across all samples to show which factors have the greatest overall impact on the model’s predictions. In other words, SHAP not only explains why a single result is predicted in a certain way but also reveals, at the dataset level, which features are most important and whether they generally push predictions upward or downward.
LIME (Local Interpretable Model-agnostic Explanations) explains individual predictions of complex black-box models by approximating their behavior locally [31]. For a given sample, LIME creates many slightly changed versions of it and checks how the black-box model predicts on these new samples. Then, it builds a simple and easy-to-understand model (like a small linear model or decision tree), giving more weight to the samples that are closer to the original one. This simple model mimics how the black-box model behaves around that specific sample, making it clear which features had the biggest influence on that particular prediction. The flow chart of key risk feature identification based on comprehensive interpretable method is shown in Figure 2.
Assuming that SHAPs are performed for k models, resulting in S 1 , S 2 , , S k , which represent the absolute mean SHAP values of features for each model. At this point, the absolute mean SHAP value results for a model constructed with m features is given by S i = S i 1 , S i 2 , , S i m , where S i denotes the absolute mean SHAP value of the j-th feature in the i-th model. Normalizing S i yields S i nor . The evaluation of each model during one round yields various A U C = A U C 1 , A U C 2 , , A U C k , which serve as weights, denoted as φ : φ 1 , φ 2 , , φ k . Consequently, the weighted_SHAP for each feature is denoted as S :
S = i = 1 k φ i S i nor
The LIME method is instance-specific, so let us assume that LIMEs are performed on each sample for k models, and the absolute mean is obtained, resulting in L 1 , L 2 , , L k . For any given model, the absolute mean of its features can be denoted as L i = L i 1 , L i 2 , , L i m , where m represents the dimensionality of the features, and L i j signifies the absolute mean of the j-th feature in the i-th model, denoted as:
L i j = t = 1 N L it j N , t = 1 , 2 , , N
where N is the total number of samples in the test set across each fold of cross-validation. Subsequently, L i is normalized to yield L i nor . The weights, denoted as φ : φ 1 , φ 2 , , φ k , allow us to obtain the weighted_LIME for each feature, denoted as:
L = i = 1 k φ i L i nor
The final feature composite score, weighted_COMP, used for selection is obtained by adding composite score one and composite score two:
C = S + L
SHAP and LIME can explain the decision-making logic of models from both global and local perspectives, assisting managers in identifying key risk features and understanding how the model maps corporate operational data to credit risk levels.

3.3.3. A Trade Credit Risk Assessment Model for Foreign Trade Enterprises Considering Loss Aversion Preferences

In the foreign trade scenario, the number of black samples is relatively small, and the misclassification of high-risk enterprises (marked as 1) as low-risk enterprises (marked as 0) will lead to serious smuggling risks undetected, while the cost of misclassification of low-risk enterprises as high-risk enterprises is relatively low. In order to improve the recognition ability of the model for high-risk enterprises, a weight adjustment strategy of lightgbm model based on loss preference is designed. By dynamically adjusting sample weights and gradient sampling techniques, we adjust the weights of high-risk enterprise samples, forcing the model to focus more on these difficult to identify samples to reduce the risk of underreporting. Since this study is based on foreign trade enterprises and the amount of enterprise data is large, considering the advantages of lightgbm in processing large-scale data, such as high computational efficiency, support for parallel training and robustness to missing values, it is more suitable for the customization of large-scale and growing data sets. Therefore, lightgbm is selected as the basic model in this study.
In order to further enhance the learning ability of the model for high-risk samples, the gradient sampling strategy is introduced. In each iteration, the difference between the prediction probability of each sample and the actual label is calculated, and the training sample is dynamically selected according to the size of the gradient, and the sample weight is considered. The specific sampling steps are as follows:
(1)
Gradient Sampling:
In each iteration, compute the squared error gradient g i = ( p i y i ) 2 . Select the top 10% highest-gradient samples (hard to classify), plus 20% randomly from the rest, to form the next training subset.
(2)
Weight Adjustment:
Assign high-risk samples a weight w 1 = 5 w 0 , adjusting dynamically per iteration based on category and gradient magnitude to reduce high-risk misclassification.
When the model pays more attention to detecting high-risk enterprises, the overall accuracy may drop slightly. Therefore, we introduced the method of “collective voting”, which integrates the Bagging framework to improve generalization ability. LightGBM is an efficient Gradient Boosting framework that builds decision trees step by step using gradient descent. In each step, it corrects the errors of the previous model, gradually reducing prediction bias through an additive process. However, because Boosting follows a serial learning strategy and focuses mainly on reducing bias, it is less effective at controlling variance. In contrast, Bagging creates multiple training subsets by resampling the data and combines the predictions of many base models through a voting mechanism. This approach effectively lowers variance and reduces the chance of misjudgment. By combining the strengths of both methods, the model achieves better balance between bias reduction and variance control. This study combines grid search and lightgbm under the bagging framework, as follows:
(1)
Self-service sampling and base classifier training:
Based on the optimal parameters obtained through grid search, multiple base classifiers of LightGBM are created. Each base classifier is trained on a bootstrap sample subset of the training set. Bootstrapping involves randomly sampling with replacement, ensuring that the training data for each base classifier has diversity, thereby enhancing the model’s diversity.
(2)
Voting Integration:
All base classifiers make predictions on the test set, and the results are combined through a majority voting mechanism. For the binary classification task in this study, if more than half of the base classifiers predict a sample as belonging to a certain class, it is then classified as that class.
Let the number of base classifiers be T, and the prediction result of each classifier be h t x 0 , 1 . The final ensemble prediction is:
H ( x ) = sign t = 1 T h t ( x )
When  h t x T / 2 , the prediction is 1; otherwise, it is 0.

4. Results

4.1. Selection of Classification Algorithms

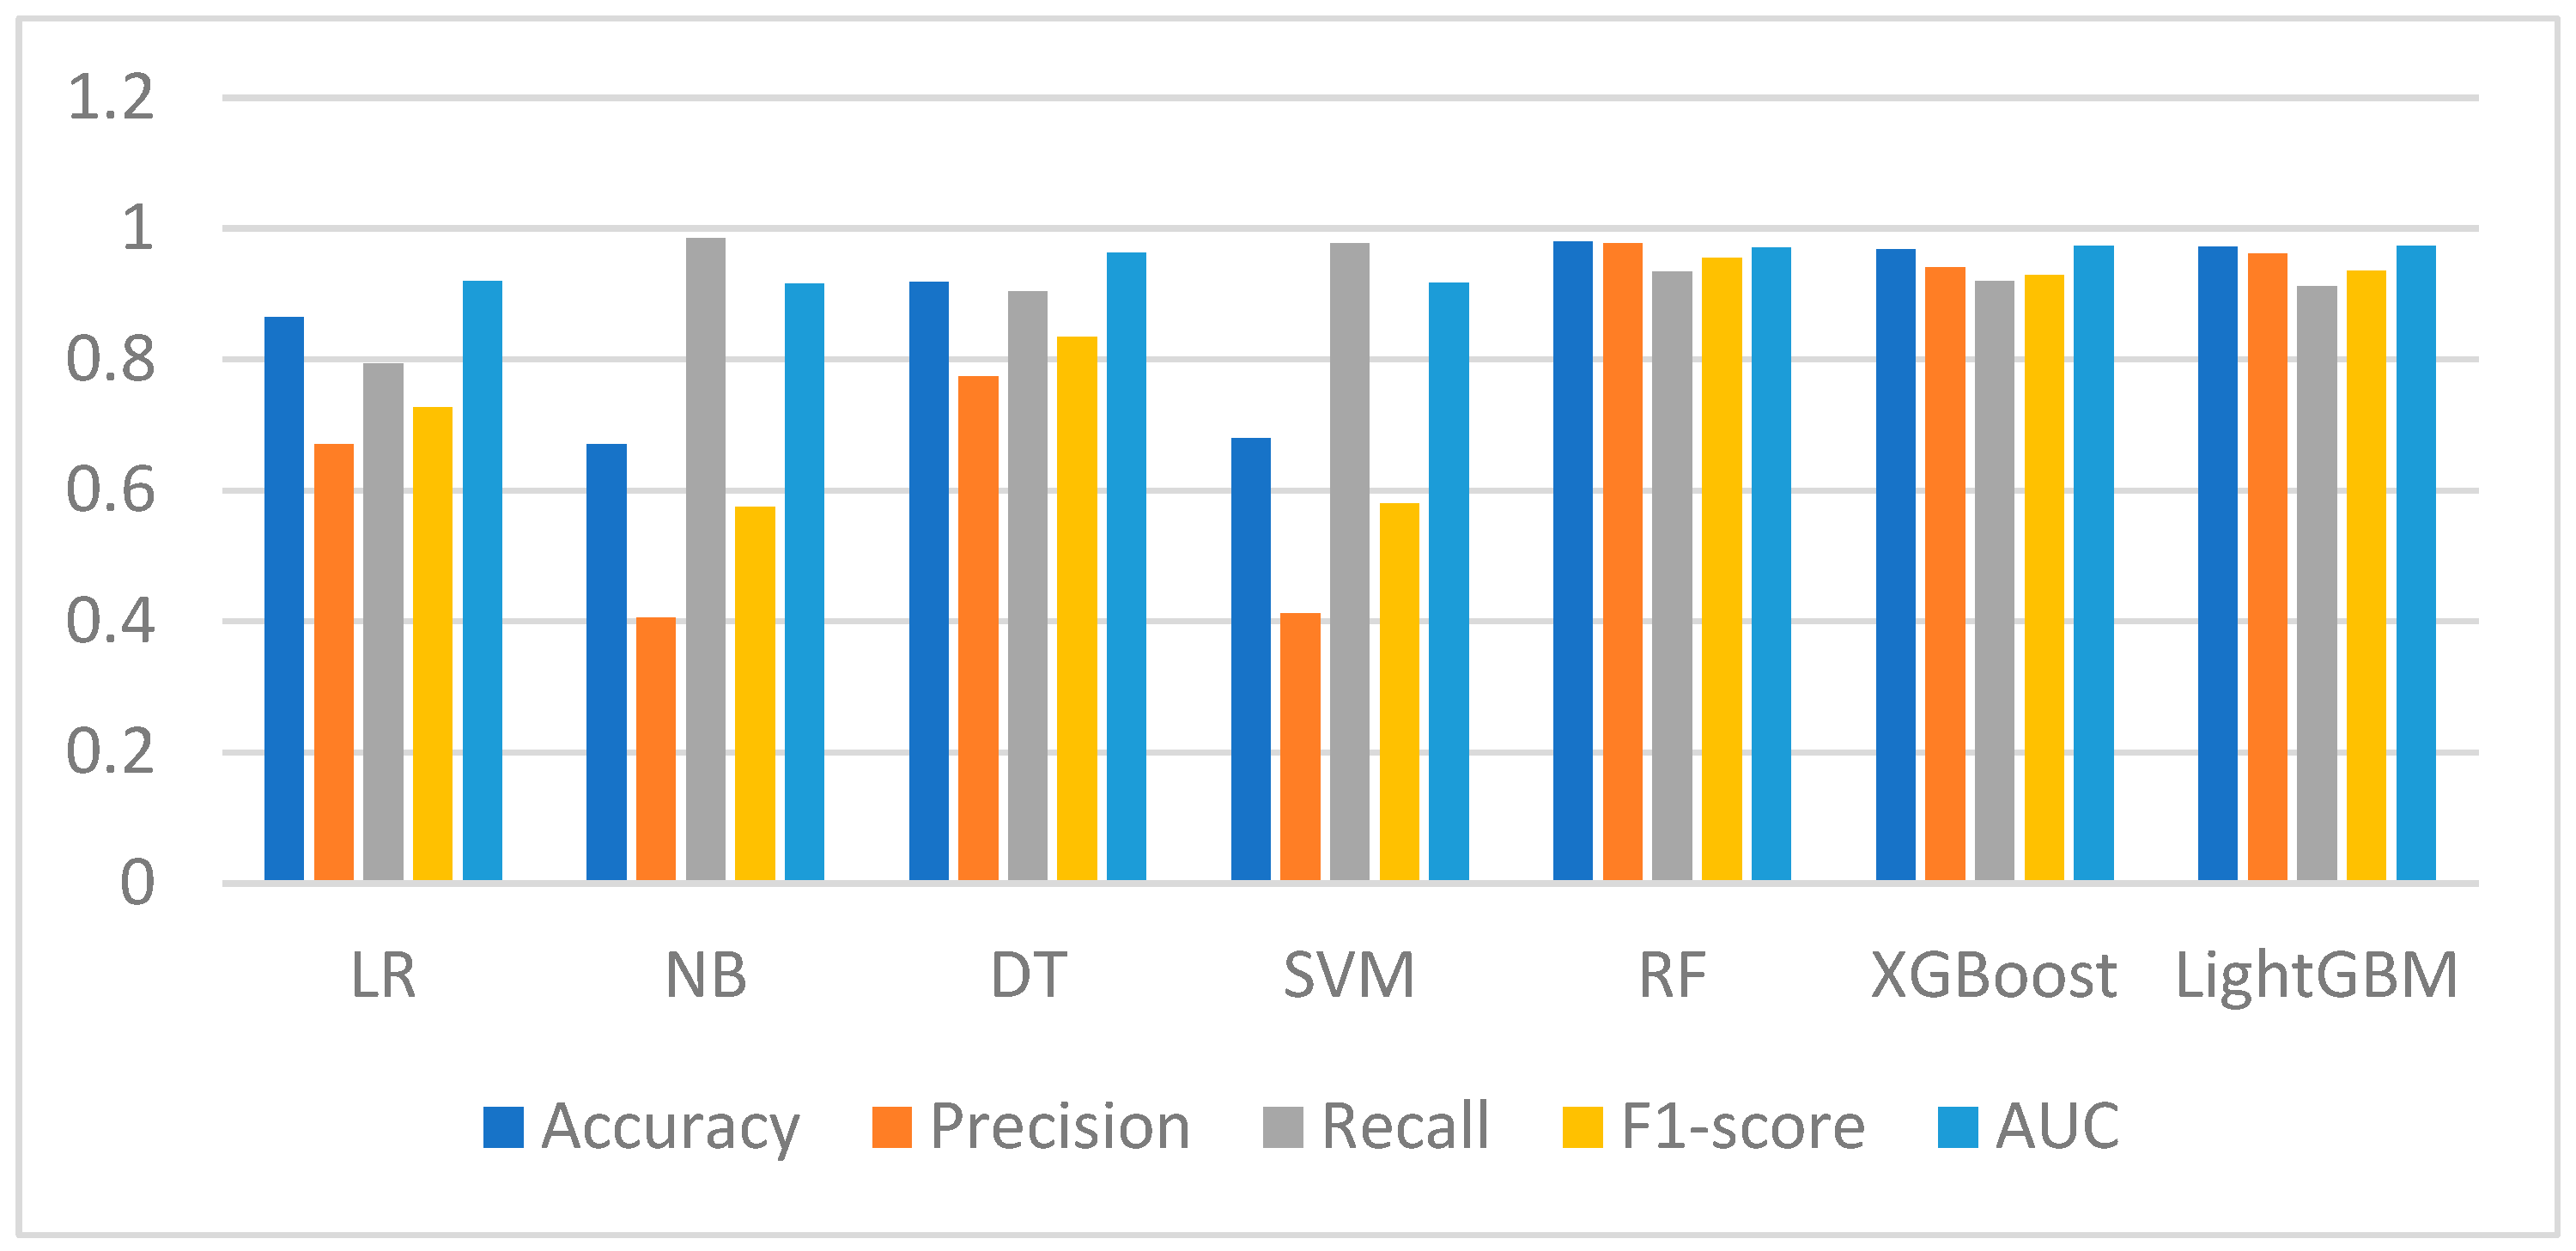
The performance of each classification model is shown in Table 2 and Figure 3. From the performance metrics of various models, Random Forest (RF), LightGBM, and XGBoost significantly outperform other models across most indicators, forming a clear hierarchy of performance advantage. RF has the highest accuracy (0.980), F1 score (0.955), and Area Under Curve (AUC) value (0.971), demonstrating a strong comprehensive discriminative ability; LightGBM and XGBoost follow closely with accuracy rates of 0.972 and 0.968, respectively, and AUC values of 0.973, indicating their robustness in identifying high-risk enterprises.
Based on the significant advantages of the model in terms of overall performance and practicability, this study finally selected RF, LightGBM and XGBoost as the core models of credit risk assessment. The subsequent research will focus on the above three models, combined with interpretable methods, to deeply explore the key characteristics of trade credit risk of foreign trade enterprises, so as to build an evaluation system with high robustness and transparency.

4.2. Identification of Key Risk Characteristics

The features employed in this study reflect multiple dimensions of foreign trade enterprises, including financial strength, operational stability, compliance behavior, and innovation capacity. For example, capital-related variables such as registered and paid-up capital indicate the economic base of an enterprise, while operational features such as establishment period, business years, enterprise scale, and whether there is an official website reflect maturity and organizational stability. Compliance-related attributes, including taxpayer qualifications and administrative penalties, capture the extent of regulatory adherence, which is especially relevant in foreign trade, where risks often arise from misreporting or tax evasion. In addition, innovation-oriented indicators such as the number of patents, trademarks, software copyrights, and innovation and technology scores represent a company’s long-term competitiveness and sustainability. Complementary information such as industry classification, province, and tripartite scoring further contextualize enterprise credibility from external and sectoral perspectives. Collectively, these features provide a comprehensive foundation for evaluating enterprise credit risk beyond traditional financial indicators.
Firstly, the SHAP method is used to explain the above models, obtaining the importance ranking of each feature and the corresponding SHAP values. Table 3 presents the absolute mean SHAP values for the three models.
Based on the experimental results, an analysis of the SHAP feature importance of the XGBoost, LightGBM, and RF models was conducted. As shown in the table, despite the variation in specific SHAP values among the models, certain features consistently ranked high across multiple models, highlighting their importance in the evaluation of trade credit risk for foreign trade enterprises. In all three models, the SHAP value of registered capital ranked first, indicating the significant impact of this feature on credit risk assessment. National Standard Industry and patent followed closely, both appearing in the top four, demonstrating their importance. Business years and taxpayer qualifications were ranked lower, indicating that these features are not particularly significant in evaluating trade credit risk for foreign trade enterprises.
Secondly, the LIME method is employed to interpret the above models, obtaining the importance ranking of each feature along with the corresponding LIME values. This study will sequentially acquire the LIME values of 100 samples and calculate their absolute mean, thus deriving the LIME absolute mean which represents the comprehensive influence degree of the features. Table 4 displays the LIME absolute means for the three models.
From the table, it can be observed that there are significant differences between the LIME feature importance values and SHAP feature importance values for the XGBoost, LightGBM, and RF models. This discrepancy primarily arises because LIME is a local model that approximates the complex original model using a simplified linear model. Consequently, the feature importance values calculated by LIME are typically lower.
Finally, the weighted_shap and weighted_lime of each feature are weighted to obtain a new ranking of feature contributions, as shown in Table 5. At this stage, the features are sorted according to their scores to determine their importance. The purpose of this ranking is to filter out those features that show significant contributions when considered comprehensively, so as to include them in the next round of model development.

4.3. Analysis of Trade Credit Risk Assessment

In this study, considering its computational efficiency, scalability, and ability to handle large datasets, LightGBM was selected as the base model for further optimization and integration with interpretable methods. LightGBM selects the GBDT model as the base classifier for the ensemble learning model. All algorithms utilize the same subset of features, and grid search is employed for parameter tuning. 80% of the data randomly selected from the original dataset is used as the training set for model training, while the remaining 20% serves as the test set for evaluating model performance. In addition to the third-party enterprise dataset, we include the official dataset to demonstrate the model’s applicability.
This study introduces a misclassification cost index to more comprehensively assess the classification effectiveness of the model. In the credit evaluation process, two types of misclassification may occur: first, misjudging enterprises with low credit risk as having high credit risk (False Positive, FP); second, misjudging enterprises with high credit risk as having low credit risk (False Negative, FN). Since the costs of these two types of errors are different, existing research has indicated that in traditional offline lending, the losses from the second type of error may be 5 to 20 times that of the first type of error, meaning that the risk posed by failing to accurately identify individuals with poor credit is significantly greater. Therefore, this study sets the misclassification cost ratio of the first and second types of errors at 1:10 and constructs a corresponding misclassification cost index to measure the overall classification capability of the model for credit groups. The smaller the value of the misclassification cost index, the better the overall classification effectiveness of the model.
Cost = F P R + 10 × F N R
F P R = F P F P + T N , F N R = F N F N + T P
To confirm the optimal feature subset of the third-party enterprise dataset, LightGBM was trained using subsets of features ranked by importance, as shown in Table 6. The experimental results indicate that when the number of features is 13, the model achieves optimal performance across various metrics. Compared to the situation using the full feature set, there is an improvement in accuracy, recall, and F1 score. As the number of features gradually decreases, the model’s performance declines, indicating that the reduction in feature information has a progressively significant impact on the model. This suggests that the 13-feature subset provides the best trade-off between predictive power and interpretability, while avoiding redundancy.
The experimental results based on the third-party enterprise dataset are presented in Table 7. Compared with the traditional LightGBM model, introducing the weight adjustment strategy leads to an increase in the false positive rate (FPR) but a significant decrease in the false negative rate (FNR), thereby improving the model’s ability to identify high-risk enterprises. This adjustment also reduces the overall misclassification cost (from 0.884 to 0.431), demonstrating the effectiveness of incorporating loss preferences.
However, the improvement in risk detection comes at the expense of classification accuracy, which drops from 0.977 to 0.879. This indicates that the model sacrifices some overall accuracy to prioritize minimizing false negatives. After integrating the Bagging framework, accuracy is not only restored but slightly improved to 0.980, while maintaining a comparably low misclassification cost (0.433). These results suggest that the combined strategy achieves a better balance between accuracy and cost sensitivity, effectively enhancing high-risk enterprise detection without significantly increasing overall misclassification costs.
The experimental results on the official dataset are summarized in Table 8. The traditional LightGBM model achieves an accuracy of 0.856 with a misclassification cost of 5.611. After applying the weight adjustment strategy, accuracy decreases to 0.822, but the cost value is significantly reduced to 4.866. This indicates that, although overall accuracy declined, the reduction in false negatives effectively lowered the overall misclassification cost.
When the Bagging framework is integrated, accuracy improves to 0.848, partially recovering from the decline observed under weight adjustment alone. Meanwhile, the cost increases slightly to 4.964, higher than the 4.866 of the weight-adjusted model but still substantially lower than the 5.611 of the traditional LightGBM. These results demonstrate that Bagging mitigates the accuracy loss caused by weight adjustment while maintaining a lower misclassification cost, thereby enhancing the robustness and practical applicability of the proposed model in credit risk assessment.
In summary, this study demonstrates that integrating a weight adjustment strategy with a Bagging ensemble framework effectively balances accuracy and misclassification costs. Specifically, the weight adjustment strategy significantly reduces false negatives and improves the detection of high-risk enterprises, though at the expense of overall accuracy. By incorporating Bagging, accuracy is restored, while the misclassification cost remains substantially lower than that of the traditional model. These results highlight that the proposed strategy achieves a robust trade-off between accuracy and cost sensitivity, enhancing both the stability and the practical applicability of credit risk assessment in regulatory contexts.

4.4. Interpretability Analysis

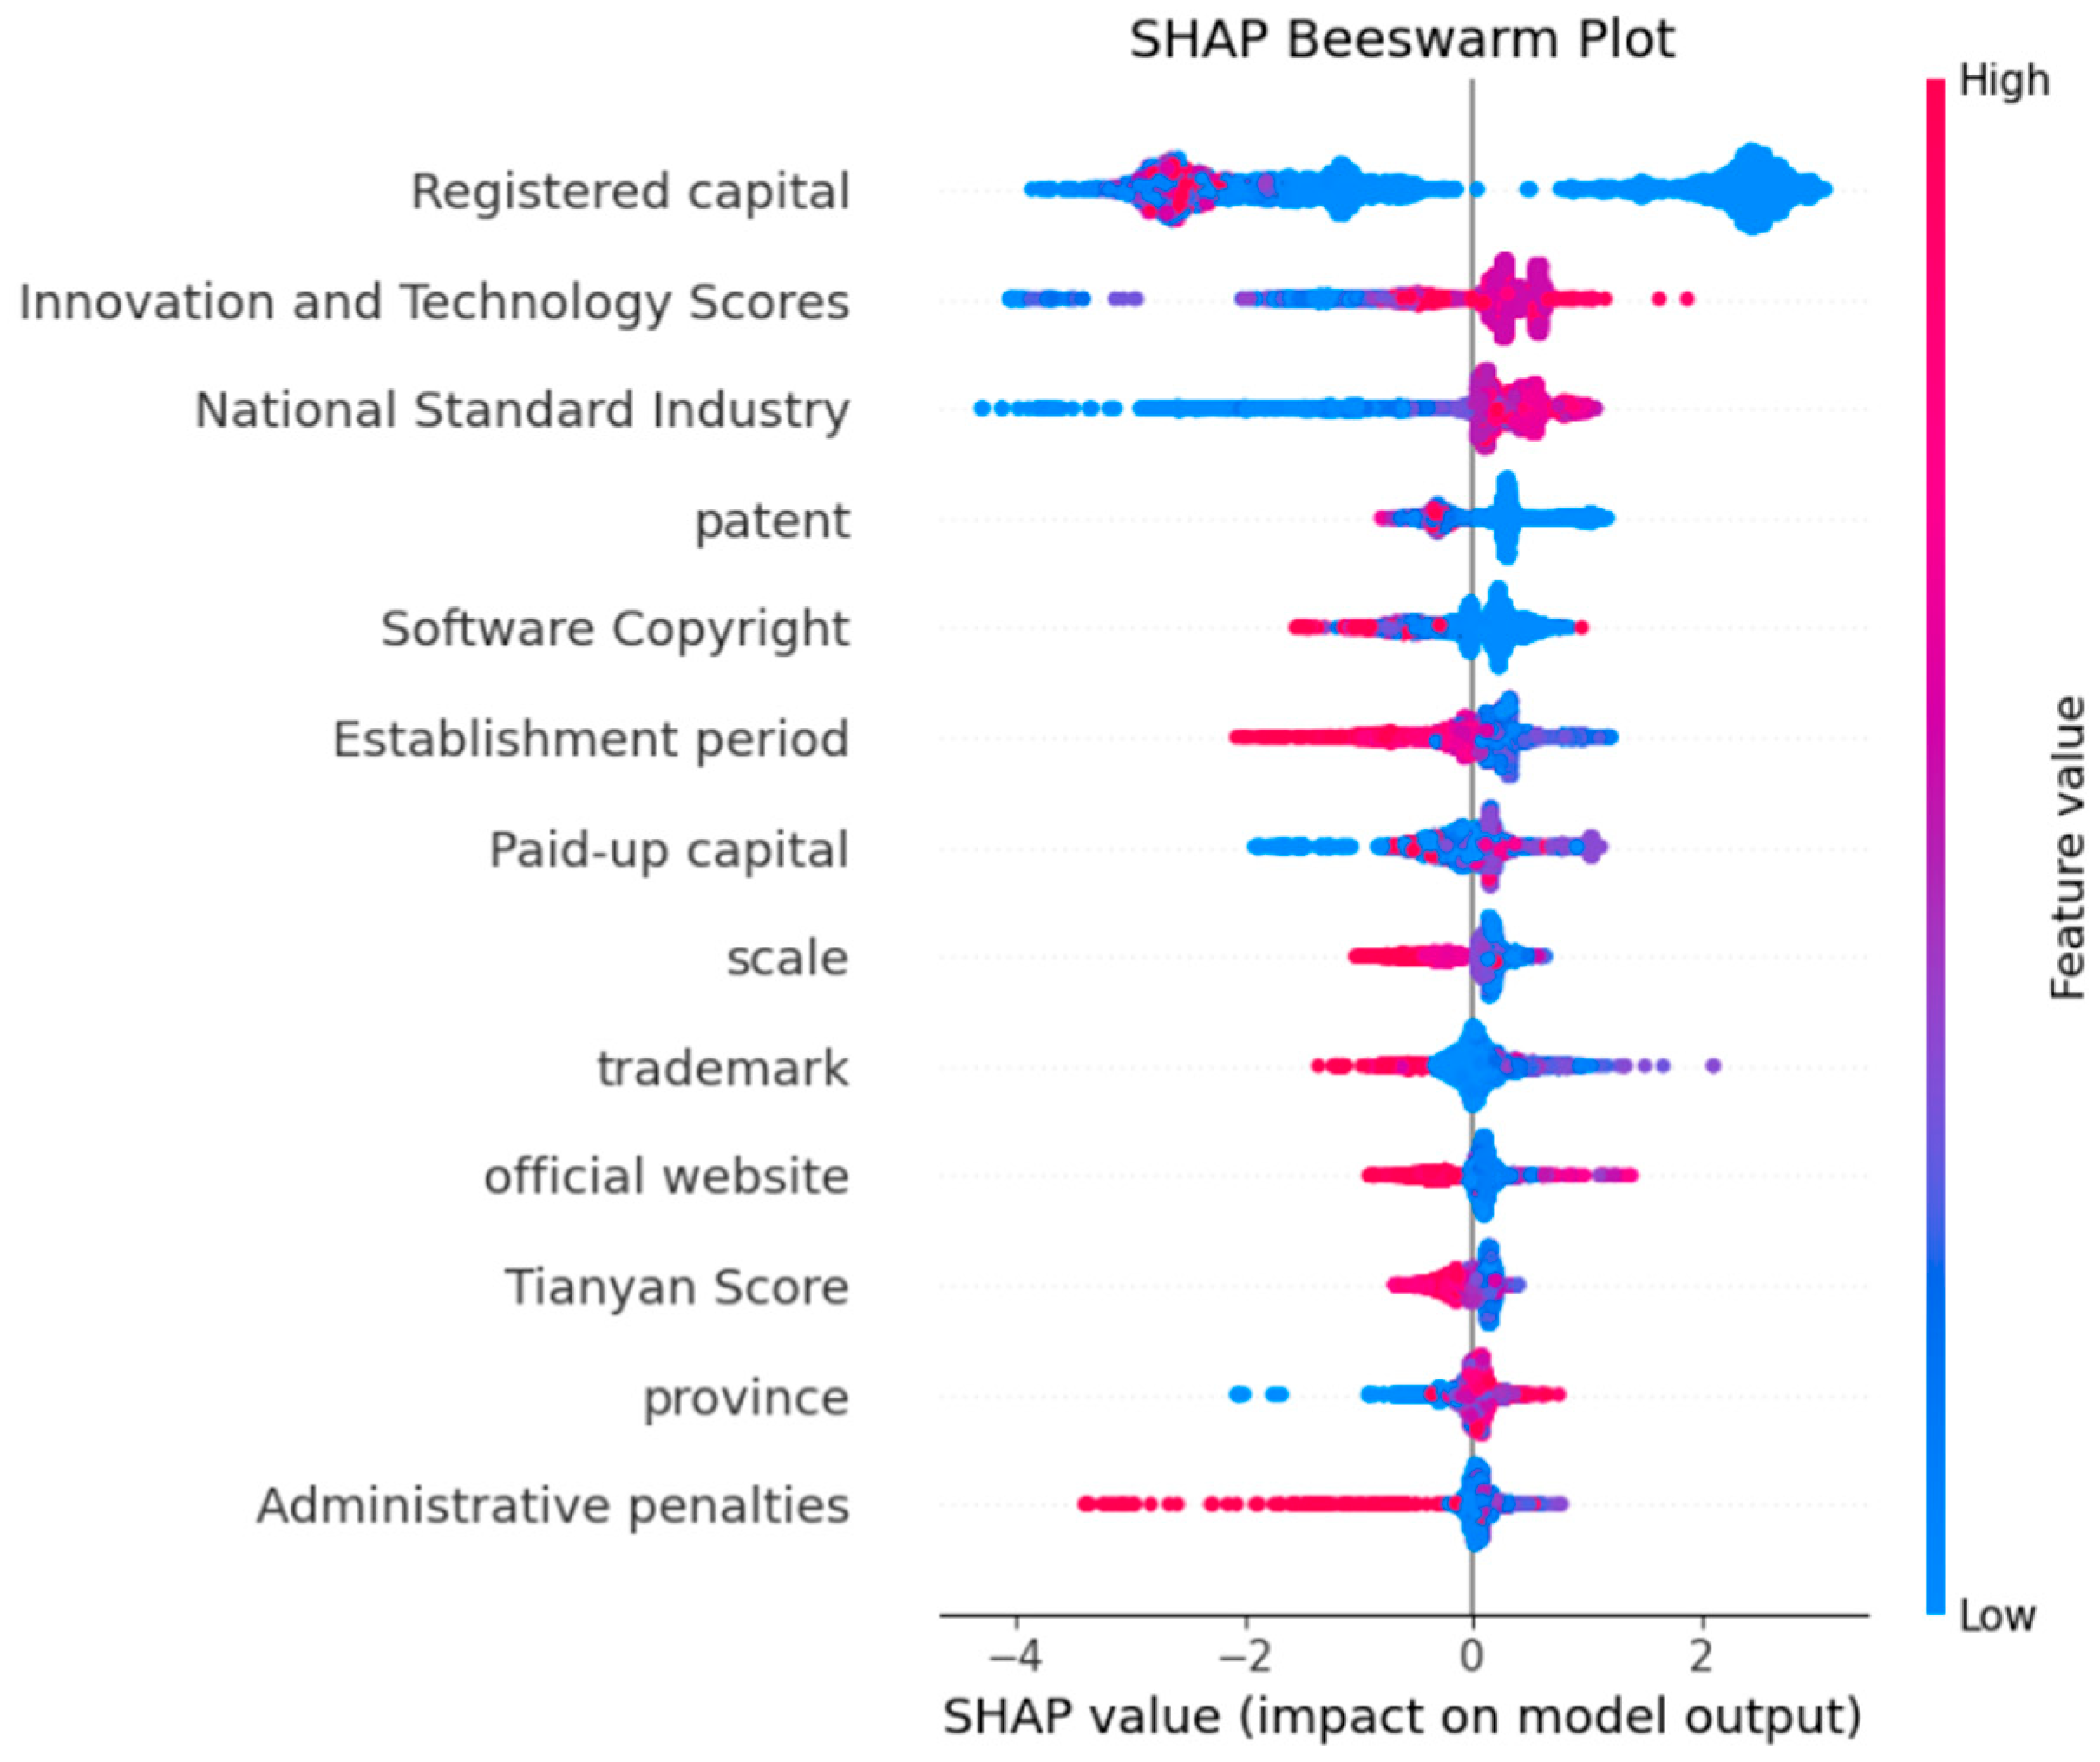
Figure 4 presents the Beeswarm plot of SHAP values for various features in the model, used to analyze the impact of features on credit risk prediction. The horizontal axis represents the distribution of SHAP values, with each feature consisting of multiple points, where the colors range from blue (low feature values) to red (high feature values). A positive SHAP value indicates that the feature prompts the model to make a ‘high-risk’ judgment, while a negative SHAP value suggests that the feature leans towards a ‘low-risk’ prediction. From the figure, it can be seen that ‘registered capital’ is the feature that most significantly affects the model’s predictions, indicating that this feature has strong discriminative power in distinguishing between high and low credit risk enterprises. Companies with high registered capital significantly reduce the probability of being predicted as high-risk, whereas low registered capital is strongly associated with high risk. Generally, a company’s registered capital can reflect its operational scale. A larger registered capital often implies a more stable business condition and relatively lower credit risk. An increase in the number of patents and software copyrights can also lower the probability of high risk.
In contrast, features such as ‘affiliated province’ and ‘administrative penalties’ have lower importance, with their SHAP value distribution being more concentrated and having a smaller impact, indicating that these features have a relatively limited effect on credit risk prediction. This may be due to the minor differences in credit levels among enterprises in different regions, or that administrative penalties do not directly reflect the current operational stability of enterprises.
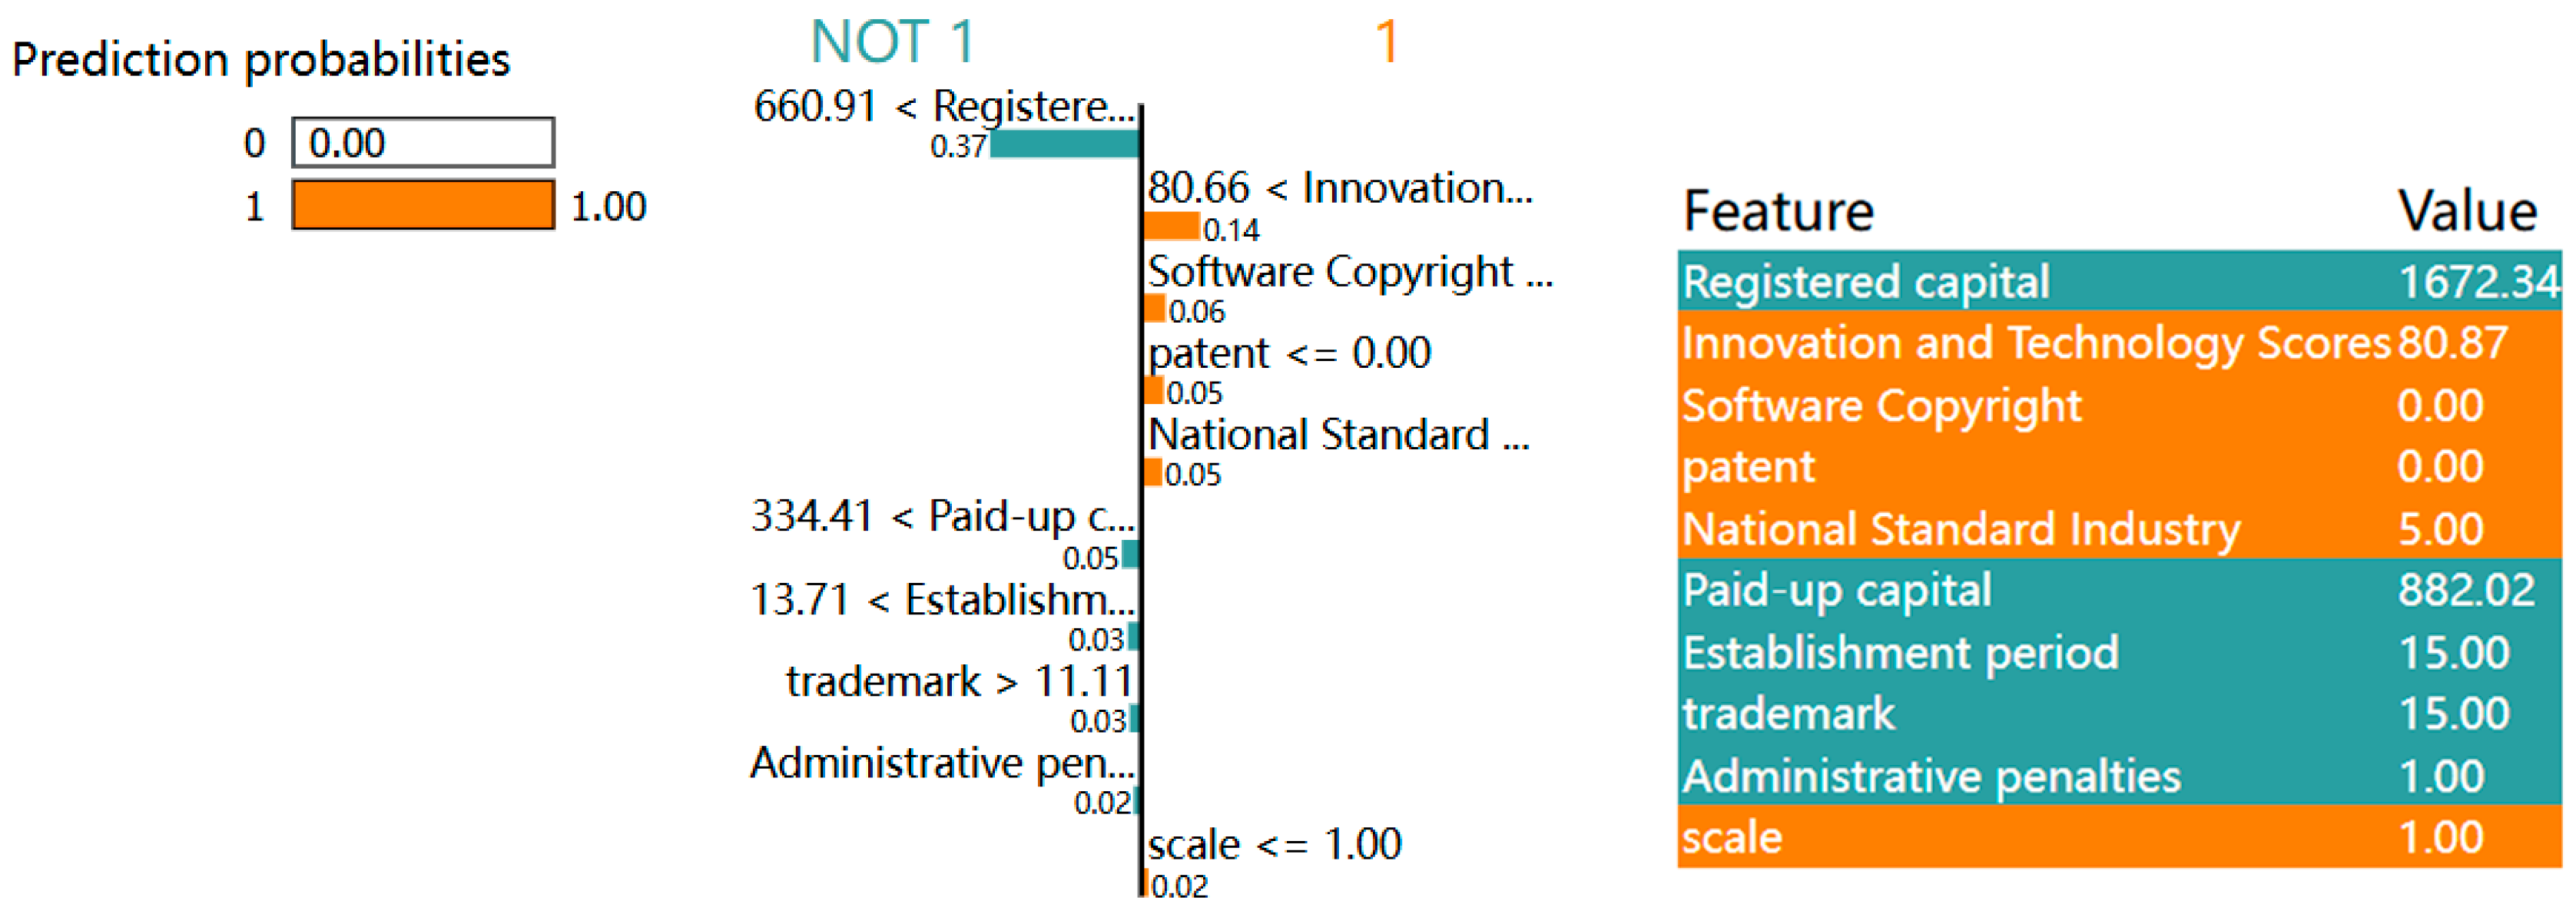
To interpret the model’s predictions, LIME was applied to individual samples, revealing the decision basis for specific instances. For the example shown in Figure 5, the model predicts the enterprise as low-risk (Category 1) with 100% confidence. The main positive contributors are ‘Registered Capital (16.7234 million yuan)’ and ‘Innovation and Technology Score (80.87)’, indicating that strong financial strength and technological capabilities are key factors supporting a low-risk rating.

5. Discussion

This study set out to develop an interpretable machine learning framework for credit risk assessment of foreign trade enterprises. The goal is to allocate limited supervisory resources to high-risk enterprises, reduce the economic and regulatory costs of misclassification, and generate interpretable outputs to support transparent decision-making. In the context of foreign trade regulation, misclassifying high-risk enterprises as low-risk ones can result in severe supervisory failures. To mitigate this risk, the proposed framework introduces a loss-preference weighting strategy within the LightGBM model, improving the detection of high-risk enterprises, while the integration of Bagging ensures overall robustness and stability. Moreover, the framework incorporates SHAP and LIME to provide transparent and traceable explanations. This multidimensional interpretability not only enhances trust in the model’s predictions but also helps regulators identify the key factors driving enterprise risk, thereby strengthening the credibility and effectiveness of supervision.

5.1. Theoretical Contributions

Although prior studies on enterprise credit evaluation are extensive, many rely on single-method feature selection, leading to limited perspectives and unstable results. In addition, existing approaches often emphasize global feature importance while overlooking the heterogeneity of local samples. This study advances the literature by introducing a comprehensive interpretability framework that integrates SHAP and LIME, enabling the identification of key risk features from both global and local perspectives. On the algorithmic side, the study explicitly incorporates loss preferences into the LightGBM model, thereby balancing overall accuracy with the asymmetric costs of misclassification. Together, these innovations collectively promote the theoretical development of machine learning that can explain and consider the cost of misclassification in the context of corporate credit risk assessment.

5.2. Practical Implications

Traditional regulatory approaches are increasingly unable to meet the demands of modern foreign trade supervision, making it necessary to adopt credit risk–based classification management. For regulators, the misclassification of high-risk enterprises carries extremely high costs—for example, if such enterprises are mistakenly categorized as low-risk, smuggling, tax evasion, or other violations may go undetected, resulting in revenue losses and public security risks. Conventional machine learning models often optimize for overall accuracy, which tends to marginalize minority classes such as high-risk enterprises, and their loss functions usually fail to reflect the asymmetric costs of misclassification. As a result, these models cannot fully meet the supervisory need for “precise interception.” The framework developed in this study directly addresses these issues by quantifying the cost of misclassifying high-risk cases, dynamically adjusting loss preferences, and enhancing the detection of risky enterprises while preserving overall accuracy. Combined with SHAP and LIME, the framework also overcomes the “black box” problem of traditional models, providing transparent explanations that strengthen fairness, trust, and regulatory acceptance. In practice, this enables supervisory authorities to allocate resources more efficiently, adjust inspection frequency and methods based on risk levels, and achieve both effective risk control and optimized regulatory efficiency.

5.3. Limitations and Future Research

Despite its contributions, this study has several limitations. First, the analysis relies mainly on structured data, without incorporating unstructured sources such as textual disclosures, transaction records, or market dynamics, which may also provide valuable insights into enterprise risk. Second, the model evaluation is based on specific datasets of foreign trade enterprises, which may limit the generalizability of the results to other industries or international contexts. Third, while the proposed framework enhances interpretability through SHAP and LIME, the explanations may still be challenging for non-technical stakeholders to fully understand and apply in practice. Future research could address these limitations by integrating unstructured and real-time data, expanding empirical validation to broader datasets and cross-industry comparisons, and developing more user-friendly interpretability tools that bridge the gap between technical outputs and managerial decision-making.

6. Conclusions

This study developed an efficient and interpretable trade credit risk evaluation model for foreign trade enterprises by integrating explainable machine learning methods with an enhanced LightGBM algorithm. The experimental results demonstrate that the proposed model significantly reduces the misclassification rate of high-risk enterprises while maintaining high overall accuracy, thereby improving the precision and efficiency of customs supervision. Furthermore, the interpretability analysis offers scientific support for regulatory decision-making, enhancing the transparency and fairness of oversight.
Empirically, the proposed approach achieves a clear and measurable trade-off between identifying high-risk enterprises and overall predictive performance. On the third-party enterprise dataset, the model achieved a misclassification cost of 0.433 and an accuracy of 0.980, indicating both a significant reduction in cost and a slight improvement in accuracy compared to the traditional LightGBM. On the official dataset, although accuracy slightly decreased to 0.848 compared to the traditional LightGBM (0.856), the misclassification cost was substantially reduced from 5.611 to 4.964. These results demonstrate the framework’s ability to prioritize detection of high-risk cases without sacrificing acceptable overall performance in large-scale monitoring tasks.
Mechanistically, the improvements can be understood in terms of two complementary effects. First, the loss-preference weighting and gradient sampling intentionally shift the model’s decision boundary to increase sensitivity toward costly errors (reducing missed detections of high-risk firms). Second, Bagging counteracts the variance and overfitting risk introduced by this targeted weighting—aggregating diverse base learners stabilizes predictions and restores generalization. The joint application therefore realizes the bias–variance trade-off in a way that is practically meaningful for regulatory objectives. Furthermore, by integrating explainable methods, the study identified key features that contribute significantly to credit risk evaluation and constructed an optimal feature subset. Experimental results demonstrate that the model using this optimal subset outperforms the model with the full feature set across accuracy, recall, F1 score, and AUC metrics. This indicates that careful feature selection not only enhances predictive performance but also improves interpretability, enabling regulators to better understand the drivers of credit risk and make informed supervisory decisions.

Author Contributions

Conceptualization, M.L. and W.J.; methodology, M.L. and W.J.; software, W.J.; validation, M.L., W.J. and J.Z.; formal analysis, M.L.; investigation, W.J.; resources, M.L. and J.Z.; data curation, W.J.; writing—original draft preparation, W.J.; writing—review and editing, M.L. and W.J.; visualization, M.L.; supervision, M.L.; project administration, J.Z.; funding acquisition, J.Z. All authors have read and agreed to the published version of the manuscript.

Funding

This research was funded by the National Key R&D Program of China (2021YFC3340501).

Data Availability Statement

Part of the data used in this study were collected from publicly available websites (https://www.tianyancha.com/, accessed on 8 January 2025; http://credit.customs.gov.cn/, accessed on 8 January 2025) and was processed by the authors. Another dataset was obtained from official authorities and is not publicly available due to confidentiality restrictions.

Conflicts of Interest

The authors declare no conflicts of interest.

Abbreviations

The following abbreviations are used in this manuscript:
SHAPSHapley Additive exPlanations
LIMELocal Interpretable Model-agnostic Explanations
LRLogistic Regression
NBNaive Bayes
DTDecision Trees
SVMSupport Vector Machines
RFRandom Forest
XGBoostEXtreme Gradient Boosting
LightGBMLight Gradient Boosting Machine
GBDTGradient Boosting Decision Tree
AUCArea Under Curve

References

  1. Wang, G.L. Research on Improving the Credit Classification Supervision of Foreign Trade Enterprises in the Field of Foreign Exchange:A Case Study of Zhoukou City, Henan Province. Credit Ref. 2023, 41, 73–79. [Google Scholar]
  2. Wu, Z.Y.; Jin, L.M.; Han, X.L.; Wang, Z.; Wu, B. Research on Financial Crisis Early Warning Model for Foreign Trade Listed Companies Based on SMOTE-XGBoost Algorithm. Comput. Eng. Appl. 2024, 60, 281–289. [Google Scholar]
  3. Yao, D.J.; Gu, Y.; Chen, W. Research on Credit Risk Evaluation of Small and Medium-sized Enterprises Based on RF-LSMA-SVM Model. Ind. Technol. Econ. 2023, 42, 85–94. [Google Scholar]
  4. Lu, H.; Wei, Y.; Jiao, L.D. Credit Card Post-loan Risk Rating Model and Empirical Research Based on GA-BP Neural Network. Oper. Res. Manag. Sci. 2023, 32, 192–198. [Google Scholar]
  5. Liu, H.B.; Liu, J.Y. Research on Credit Risk Evaluation of China’s Real Estate Enterprises. Credit Ref. 2023, 41, 66–72. [Google Scholar]
  6. Machado, M.R.; Karray, S. Assessing credit risk of commercial customers using hybrid machine learning algorithms. Expert Syst. Appl. 2022, 200, 116889. [Google Scholar] [CrossRef]
  7. Sun, Y.C. Research on Banks’ Optimal Credit Strategy for MSMEs Under Information Asymmetry—Default Rate Measurement Model Based on Logistic Regression. J. Financ. Dev. Res. 2021, 6, 78–84. [Google Scholar] [CrossRef]
  8. Meng, J.; Li, T.; Yuan, Z.M. Credit Risk Assessment of SMES Based on ODR-BADASYN-SVM. J. Financ. Dev. Res. 2018, 1, 24–31. [Google Scholar] [CrossRef]
  9. Zhang, H.; Shi, Y.; Yang, X. A firefly algorithm modified support vector machine for the credit risk assessment of supply chain finance. Res. Int. Bus. Financ. 2021, 58, 101482. [Google Scholar] [CrossRef]
  10. Zhang, D.; Tang, Y.; Yan, X. Supply chain risk management of badminton supplies company using decision tree model assisted by fuzzy comprehensive evaluation. Expert Syst. 2024, 41, e13275. [Google Scholar] [CrossRef]
  11. Wang, J.; Rong, W.; Zhang, Z.; Mei, D. Credit debt default risk assessment based on the XGBoost algorithm: An empirical study from China. Wirel. Commun. Mob. Comput. 2022, 2022, 8005493. [Google Scholar] [CrossRef]
  12. Mitra, R.; Dongre, A.; Dangare, P.; Goswami, A.; Tiwari, M.K. Knowledge graph driven credit risk assessment for micro, small and medium-sized enterprises. Int. J. Prod. Res. 2024, 62, 4273–4289. [Google Scholar] [CrossRef]
  13. Li, J.J.; Li, T. Research on Enterprise Credit Risk Assessment from the Perspective of Corporate Governance: Based on BP-Adaboost Model. Commun. Financ. Account. 2018, 05, 100–104. [Google Scholar] [CrossRef]
  14. Yu, L.A.; Zhang, Y.D. Weight-selected attribute bagging based on association rules for credit dataset classification. Syst. Eng. Theory Pract. 2020, 40, 366–372. [Google Scholar]
  15. Liu, C.; Shi, Y.; Xie, W.J.; Bao, X.Z. A novel approach to screening patents for securitization: A machine learning-based predictive analysis of high-quality basic asset. Kybernetes 2024, 53, 763–778. [Google Scholar] [CrossRef]
  16. Zhang, L.; Song, Q. Credit Evaluation of SMEs Based on GBDT-CNN-LR Hybrid Integrated Model. Wirel. Commun. Mob. Comput. 2022, 2022, 5251228. [Google Scholar] [CrossRef]
  17. Sun, J.; Li, J.; Fujita, H. Multi-class imbalanced enterprise credit evaluation based on asymmetric bagging combined with light gradient boosting machine. Appl. Soft Comput. 2022, 130, 109637. [Google Scholar] [CrossRef]
  18. Zhang, L.; Song, Q. Multimodel integrated enterprise credit evaluation method based on attention mechanism. Comput. Intell. Neurosci. 2022, 2022, 8612759. [Google Scholar] [CrossRef]
  19. Jia, D.; Wu, Z. Application of Machine Learning in Enterprise Risk Management. Secur. Commun. Netw. 2022, 2022, 4323150. [Google Scholar] [CrossRef]
  20. Zhang, W.; Yan, S.; Li, J.; Peng, R.; Tian, X. Deep reinforcement learning imbalanced credit risk of SMEs in supply chain finance. Ann. Oper. Res. 2024, 1–31. [Google Scholar] [CrossRef]
  21. Song, Y.; Wang, Y.; Ye, X.; Zaretzki, R.; Liu, C. Loan default prediction using a credit rating-specific and multi-objective ensemble learning scheme. Inf. Sci. 2023, 629, 599–617. [Google Scholar] [CrossRef]
  22. Salih, A.M.; Raisi-Estabragh, Z.; Galazzo, I.B.; Radeva, P.; Petersen, S.E.; Lekadir, K.; Menegaz, G. A perspective on explainable artificial intelligence methods: SHAP and LIME. Adv. Intell. Syst. 2025, 7, 2400304. [Google Scholar] [CrossRef]
  23. Teng, H.W.; Kang, M.H.; Lee, I.H.; Bai, L.C. Bridging accuracy and interpretability: A rescaled cluster-then-predict approach for enhanced credit scoring. Int. Rev. Financ. Anal. 2024, 91, 103005. [Google Scholar] [CrossRef]
  24. Park, S.; Park, K.; Shin, H. Network based Enterprise Profiling with Semi-Supervised Learning. Expert Syst. Appl. 2024, 238, 121716. [Google Scholar] [CrossRef]
  25. Xia, Y.; Xu, T.; Wei, M.X. Predicting Chain’s Manufacturing SME Credit Risk in Supply Chain Finance Based on Machine Learning Methods. Sustainability 2023, 15, 1087. [Google Scholar] [CrossRef]
  26. Jiang, H.; Cui, J.; Liu, Y. Credit Risk Measurement of Real Estate Enterprises Based on the Random Forest Model. J. Nonlinear Convex Anal. 2025, 26, 1593–1604. [Google Scholar]
  27. Chang, V.; Xu, Q.A.; Akinloye, S.H.; Benson, V.; Hall, K. Prediction of bank credit worthiness through credit risk analysis: An explainable machine learning study. Ann. Oper. Res. 2024, 1–25. [Google Scholar] [CrossRef]
  28. Xie, X.; Zhang, J.; Luo, Y.; Gu, J.; Li, Y. Enterprise credit risk portrait and evaluation from the perspective of the supply chain. Int. Trans. Oper. Res. 2024, 31, 2765–2795. [Google Scholar] [CrossRef]
  29. Zhao, L.; Yang, S.; Wang, S.; Shen, J. Research on PPP enterprise credit dynamic prediction model. Appl. Sci. 2022, 12, 10362. [Google Scholar] [CrossRef]
  30. Meng, Y.; Yang, N.; Qian, Z.; Zhang, G.Y. What makes an online review more helpful: An interpretation framework using XGBoost and SHAP values. J. Theor. Appl. Electron. Commer. Res. 2020, 16, 466–490. [Google Scholar] [CrossRef]
  31. Abdullah, T.A.; Zahid, M.S.; Turki, A.F.; Ali, W.; Jiman, A.A.; Abdulaal, M.J.; Sobahi, N.M.; Attar, E.T. Sig-lime: A signal-based enhancement of lime explanation technique. IEEE Access 2024, 12, 52641–52658. [Google Scholar] [CrossRef]
Figure 1. Evaluation model for trade credit risk in foreign trade enterprises.
Information 16 00831 g001
Figure 2. Key risk characteristic identification flowchart.
Information 16 00831 g002
Figure 3. Comparison chart of classification algorithm performance.
Information 16 00831 g003
Figure 4. Global characteristics of SHAP values depicted in a Beeswarm plot.
Information 16 00831 g004
Figure 5. Visualization of individual sample predictions based on LIME.
Information 16 00831 g005
Table 1. Overview of datasets used in this study.
DatasteNumber of SamplesNumber of FeaturesNumber of ClassesHigh-Risk SamplesMedium-Risk SamplesLow-Risk Samples
Third-party enterprise dataset300515265602349
official dataset579,73323333,40646,327500,000
Table 2. Comparison of classifier performance.
AccuracyPrecisionRecallF1-ScoreAUC
LR0.8650.6710.7940.7270.920
NB0.6710.4060.9850.5750.916
DT0.9180.7740.9040.8340.963
SVM0.6790.4120.9780.5800.917
RF0.9800.9770.9340.9550.971
XGBoost0.9680.9400.9190.9290.973
LightGBM0.9720.9610.9120.9360.973
Table 3. Feature importance ranking of various models based on the absolute mean values of SHAP.
The SHAP Values of XGBoostThe SHAP Values of LightGBMThe SHAP Values of RF
 FeatureImportance FeatureImportance FeatureImportance
1Registered capital1.5141411Registered capital2.1337151Registered capital0.125314
2National Standard Industry0.844532Patent0.6029252Patent0.08003
3Patent0.6316753National Standard Industry0.5606253Tripartite scoring0.071085
4Innovation and Technology Scores0.551324Innovation and Technology Scores0.3706684National Standard Industry0.06304
5Establishment period0.4623675Software Copyright0.3433645Establishment period0.047699
6Trademark0.4431676Establishment period0.2919326Software Copyright0.03744
7Tripartite scoring0.4310257Scale0.2518377Scale0.031746
8Scale0.4165998Paid-up capital0.2265978Innovation and Technology Scores0.029942
9Paid-up capital0.4145699Official website0.2129679Paid-up capital0.026295
10Software Copyright0.38966110Tripartite scoring0.20433710Trademark0.012235
11Official website0.2818811Trademark0.19818211Province0.01196
12Taxpayer qualifications0.25392212Province0.10917512Administrative penalties0.011958
13Province0.24338713Administrative penalties0.09770213Official website0.011383
14Administrative penalties0.18142114Taxpayer qualifications0.0715114Business years0.008608
15Business years0.08135615Business years0.03747415Taxpayer qualifications0.003407
Table 4. The importance ranking of features based on the absolute values of LIME for each model.
The LIME Values of XGBoostThe LIME Values of LightGBMThe LIME Values of RF
 FeatureImportance FeatureImportance FeatureImportance
1Registered capital0.0785671Registered capital0.0874741Registered capital0.044437
2Innovation and Technology Scores0.0453942Innovation and Technology Scores0.0508772Software Copyright0.034238
3Software Copyright0.0453473Software Copyright0.0320213Patent0.029114
4Patent0.0440144Patent0.0258344Tripartite scoring0.020657
5Scale0.0236045National Standard Industry0.0142575Innovation and Technology Scores0.017056
6Tripartite scoring0.0226786Paid-up capital0.0139486Establishment period0.010006
7Establishment period0.0178417Establishment period0.0122237National Standard Industry0.005938
8Trademark0.0169958Tripartite scoring0.0093768Trademark0.005342
9National Standard Industry0.0162629Scale0.0092609Scale0.005320
10Paid-up capital0.01459510Administrative penalties0.00785610Administrative penalties0.004280
11Province0.00728011Trademark0.00745711Paid-up capital0.003802
12Official website0.00697612Province0.00230512Province0.001796
13Taxpayer qualifications0.00302313Official website0.00174113Official website0.000698
14Administrative penalties0.00064814Taxpayer qualifications0.00156314Taxpayer qualifications0.000641
15Business years0.00014915Business years0.00063915Business years0.000112
Table 5. Comprehensive score ranking table for each characteristic.
FeatureImportance-COMP
Registered capital5.834000
Patent2.708405
Software Copyright2.282456
Innovation and Technology Scores2.180662
National Standard Industry1.716226
Tripartite scoring1.681475
Establishment period1.295706
Scale1.054599
Paid-up capital0.905581
Trademark0.790605
Official website0.391056
Province0.355480
Administrative penalties0.342384
Taxpayer qualifications0.190590
Business years0.041426
Table 6. Comparison of model performance based on different numbers of feature subsets.
Feature SetAccuracyPrecisionRecallF1-ScoreAUC
Full Feature Set0.9720.9610.9120.9360.973
14 Feature Subsets0.9680.9470.9120.9290.973
13 Feature Subsets0.9730.9760.9040.9390.973
12 Feature Subsets0.9720.9690.9040.9350.972
11 Feature Subsets0.9680.9610.8970.9280.972
10 Feature Subsets0.9670.9530.8970.9240.972
9 Feature Subsets0.9600.9180.9040.9110.973
Table 7. Comparison of performance improvements in the third-party enterprise dataset model.
ModelTPTNFPFNFPRFNRAccuracyCost
LightGBM1244632120.0040.0880.9770.884
LightGBM + Weight Adjustment1393896940.1510.0280.8790.431
This study137452660.0130.0420.9800.433
Table 8. Comparison of performance improvements in the official dataset model.
ModelTPTNFPFNFPRFNRAccuracyCost
LightGBM4940157,663508162360.0310.5580.8565.611
LightGBM + Weight Adjustment5197154,762913748240.0560.4810.8224.866
This study5088156,731716849330.0440.4920.8484.964
Disclaimer/Publisher’s Note: The statements, opinions and data contained in all publications are solely those of the individual author(s) and contributor(s) and not of MDPI and/or the editor(s). MDPI and/or the editor(s) disclaim responsibility for any injury to people or property resulting from any ideas, methods, instructions or products referred to in the content.