Improving the Selection of PV Modules and Batteries for Off-Grid PV Installations Using a Decision Support System
Abstract
1. Introduction
1.1. Background and Significance
1.2. Literature Review
1.3. Motivation and Contribution
- How do the criteria weights obtained from the AHP method compare with those obtained from the Entropy method?
- Which of the criteria weighting method (AHP or Entropy) provides a more effective foundation for evaluating and ranking PV modules and batteries using the TOPSIS method?
- How do the rankings of PV modules and batteries differ when using TOPSIS with criteria weighted by AHP versus those weighted by the Entropy method?
- Can the proposed three-phase DSS framework effectively support decision making for optimising stand-alone PV installations by selecting the most suitable PV module and battery technologies?
2. Methodology
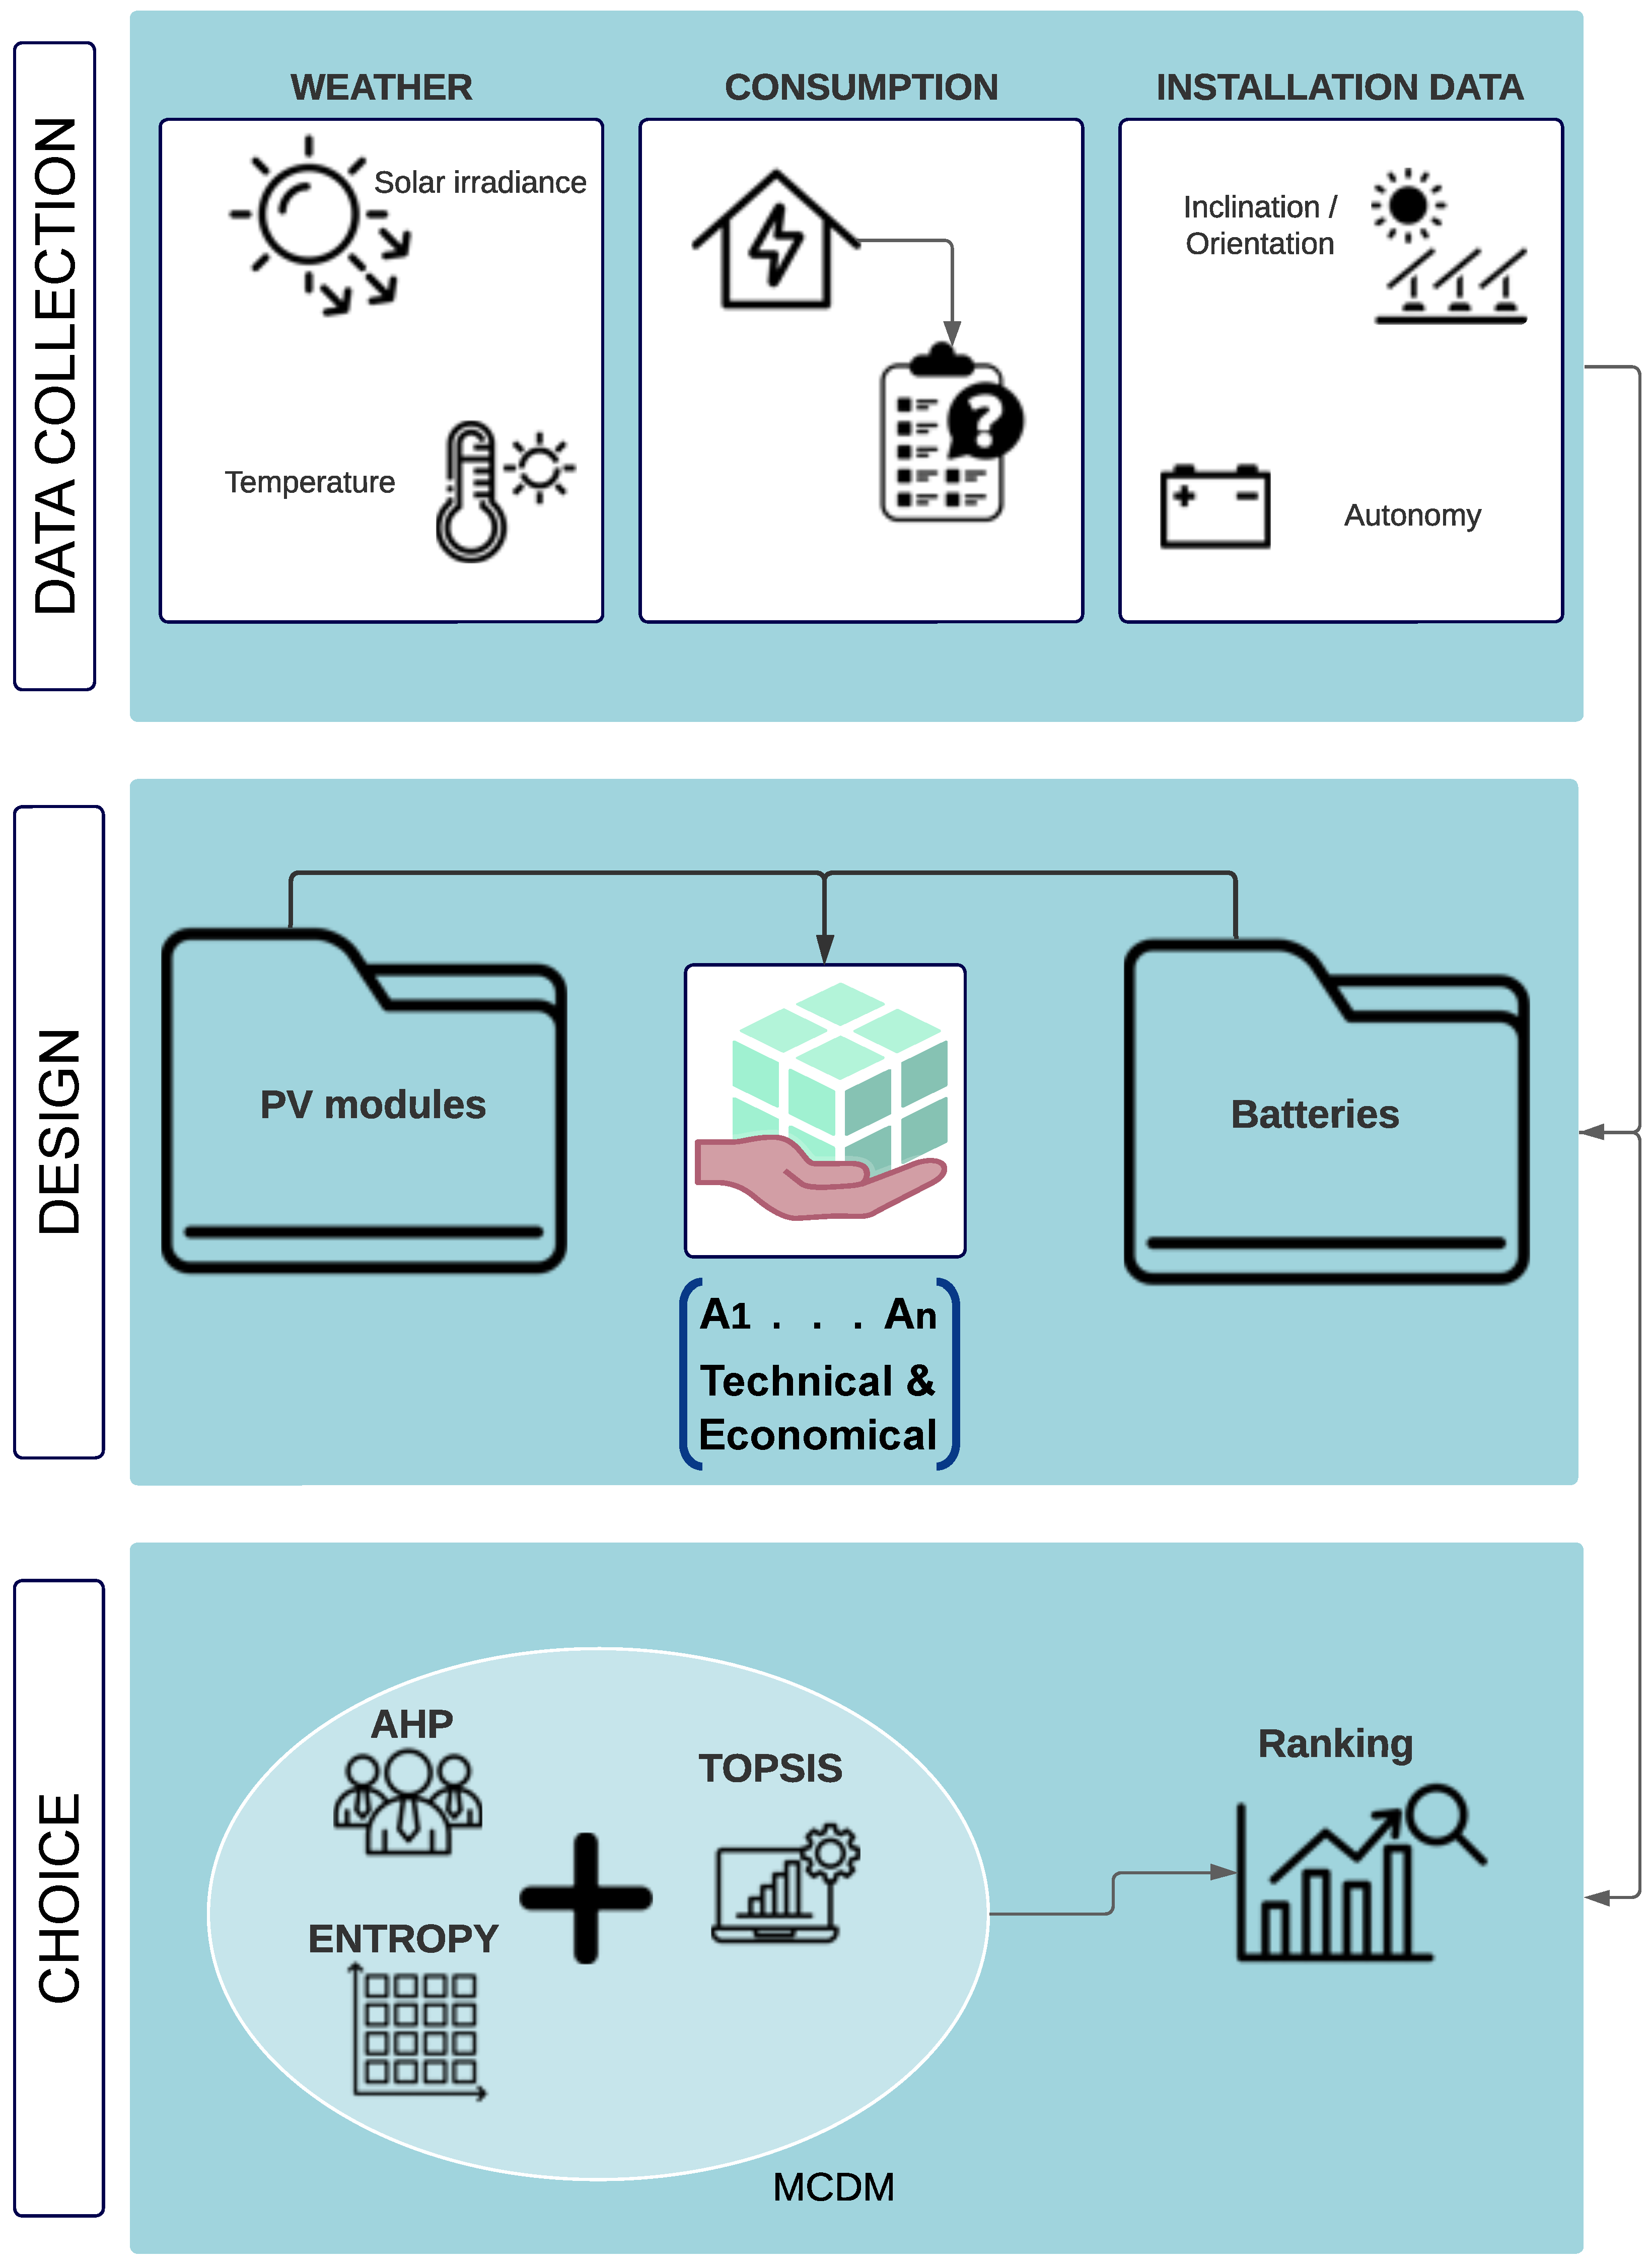
2.1. Data Collection
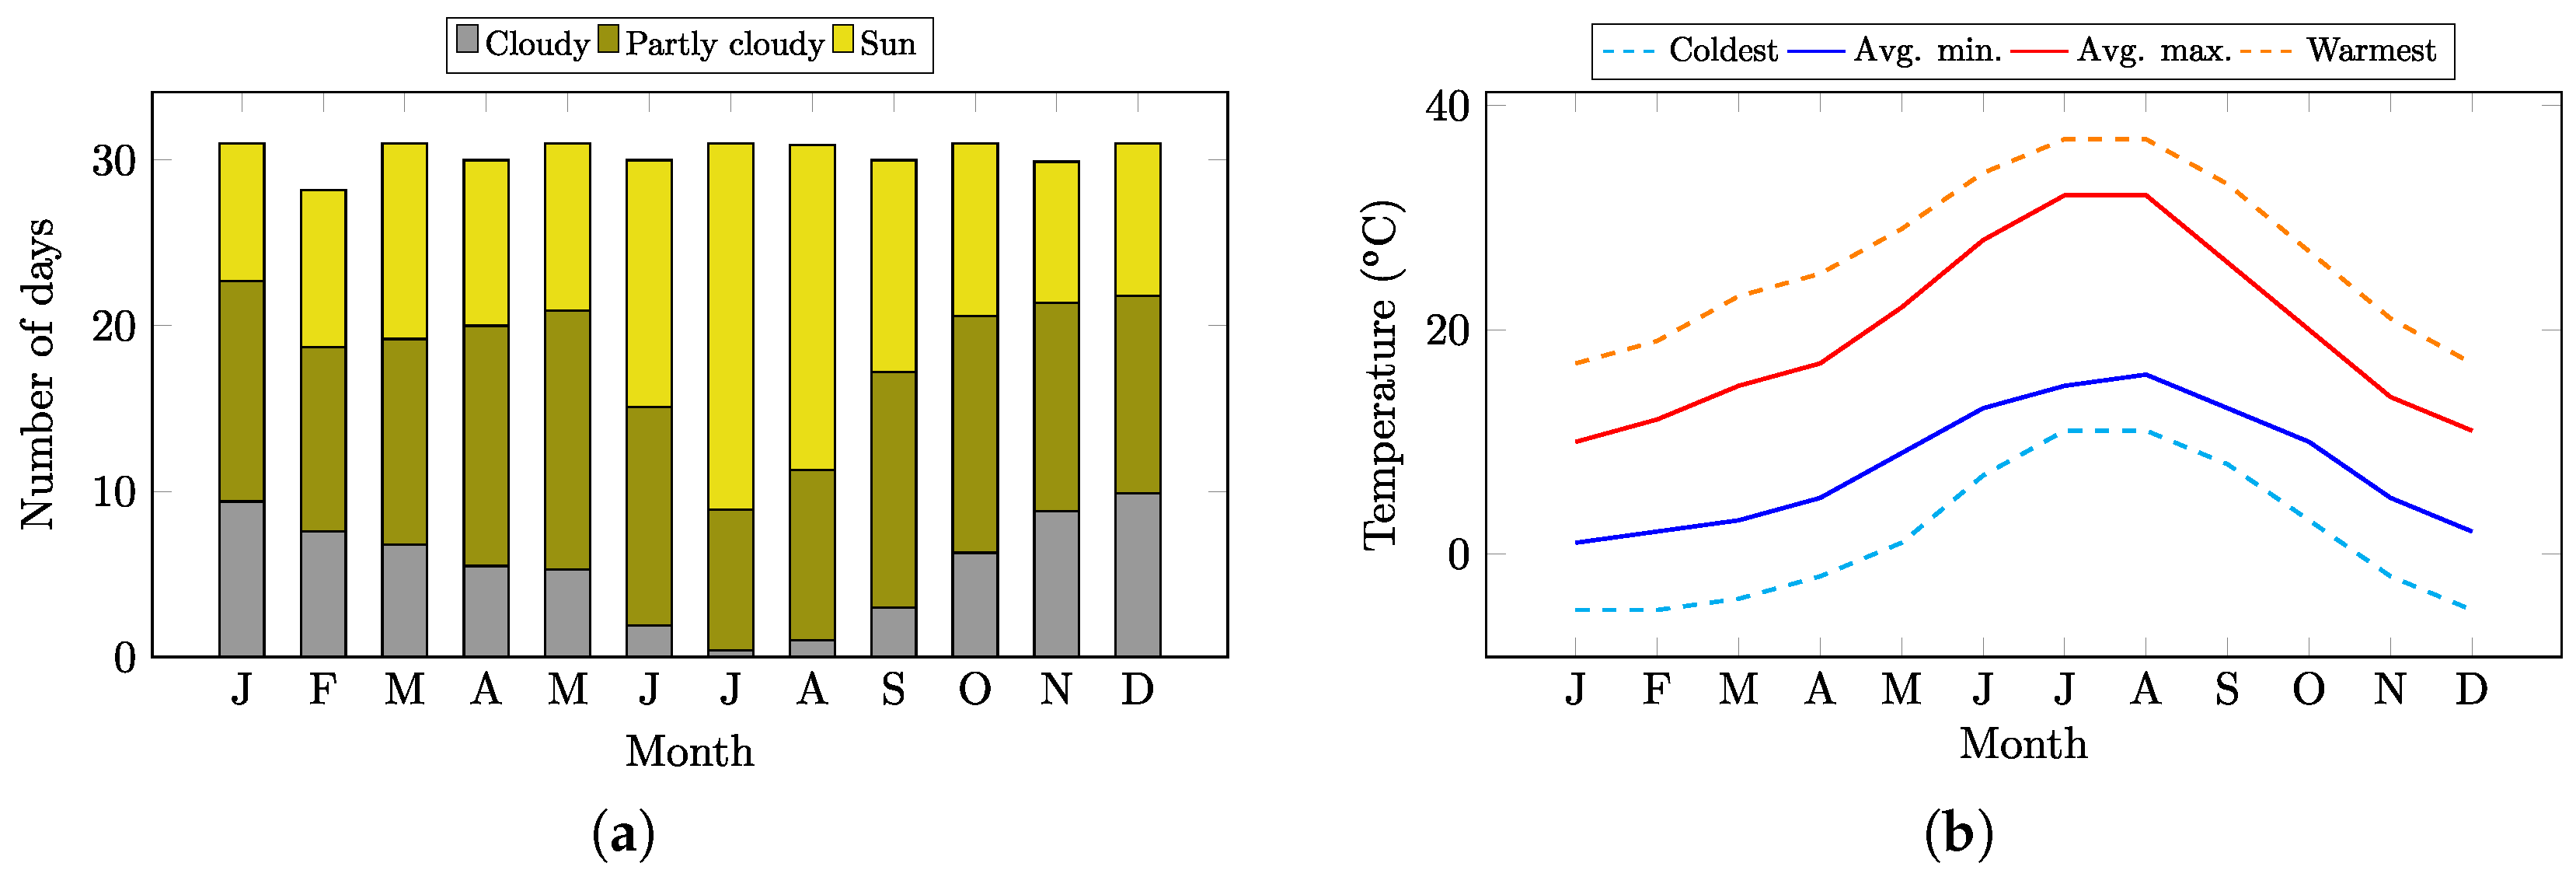
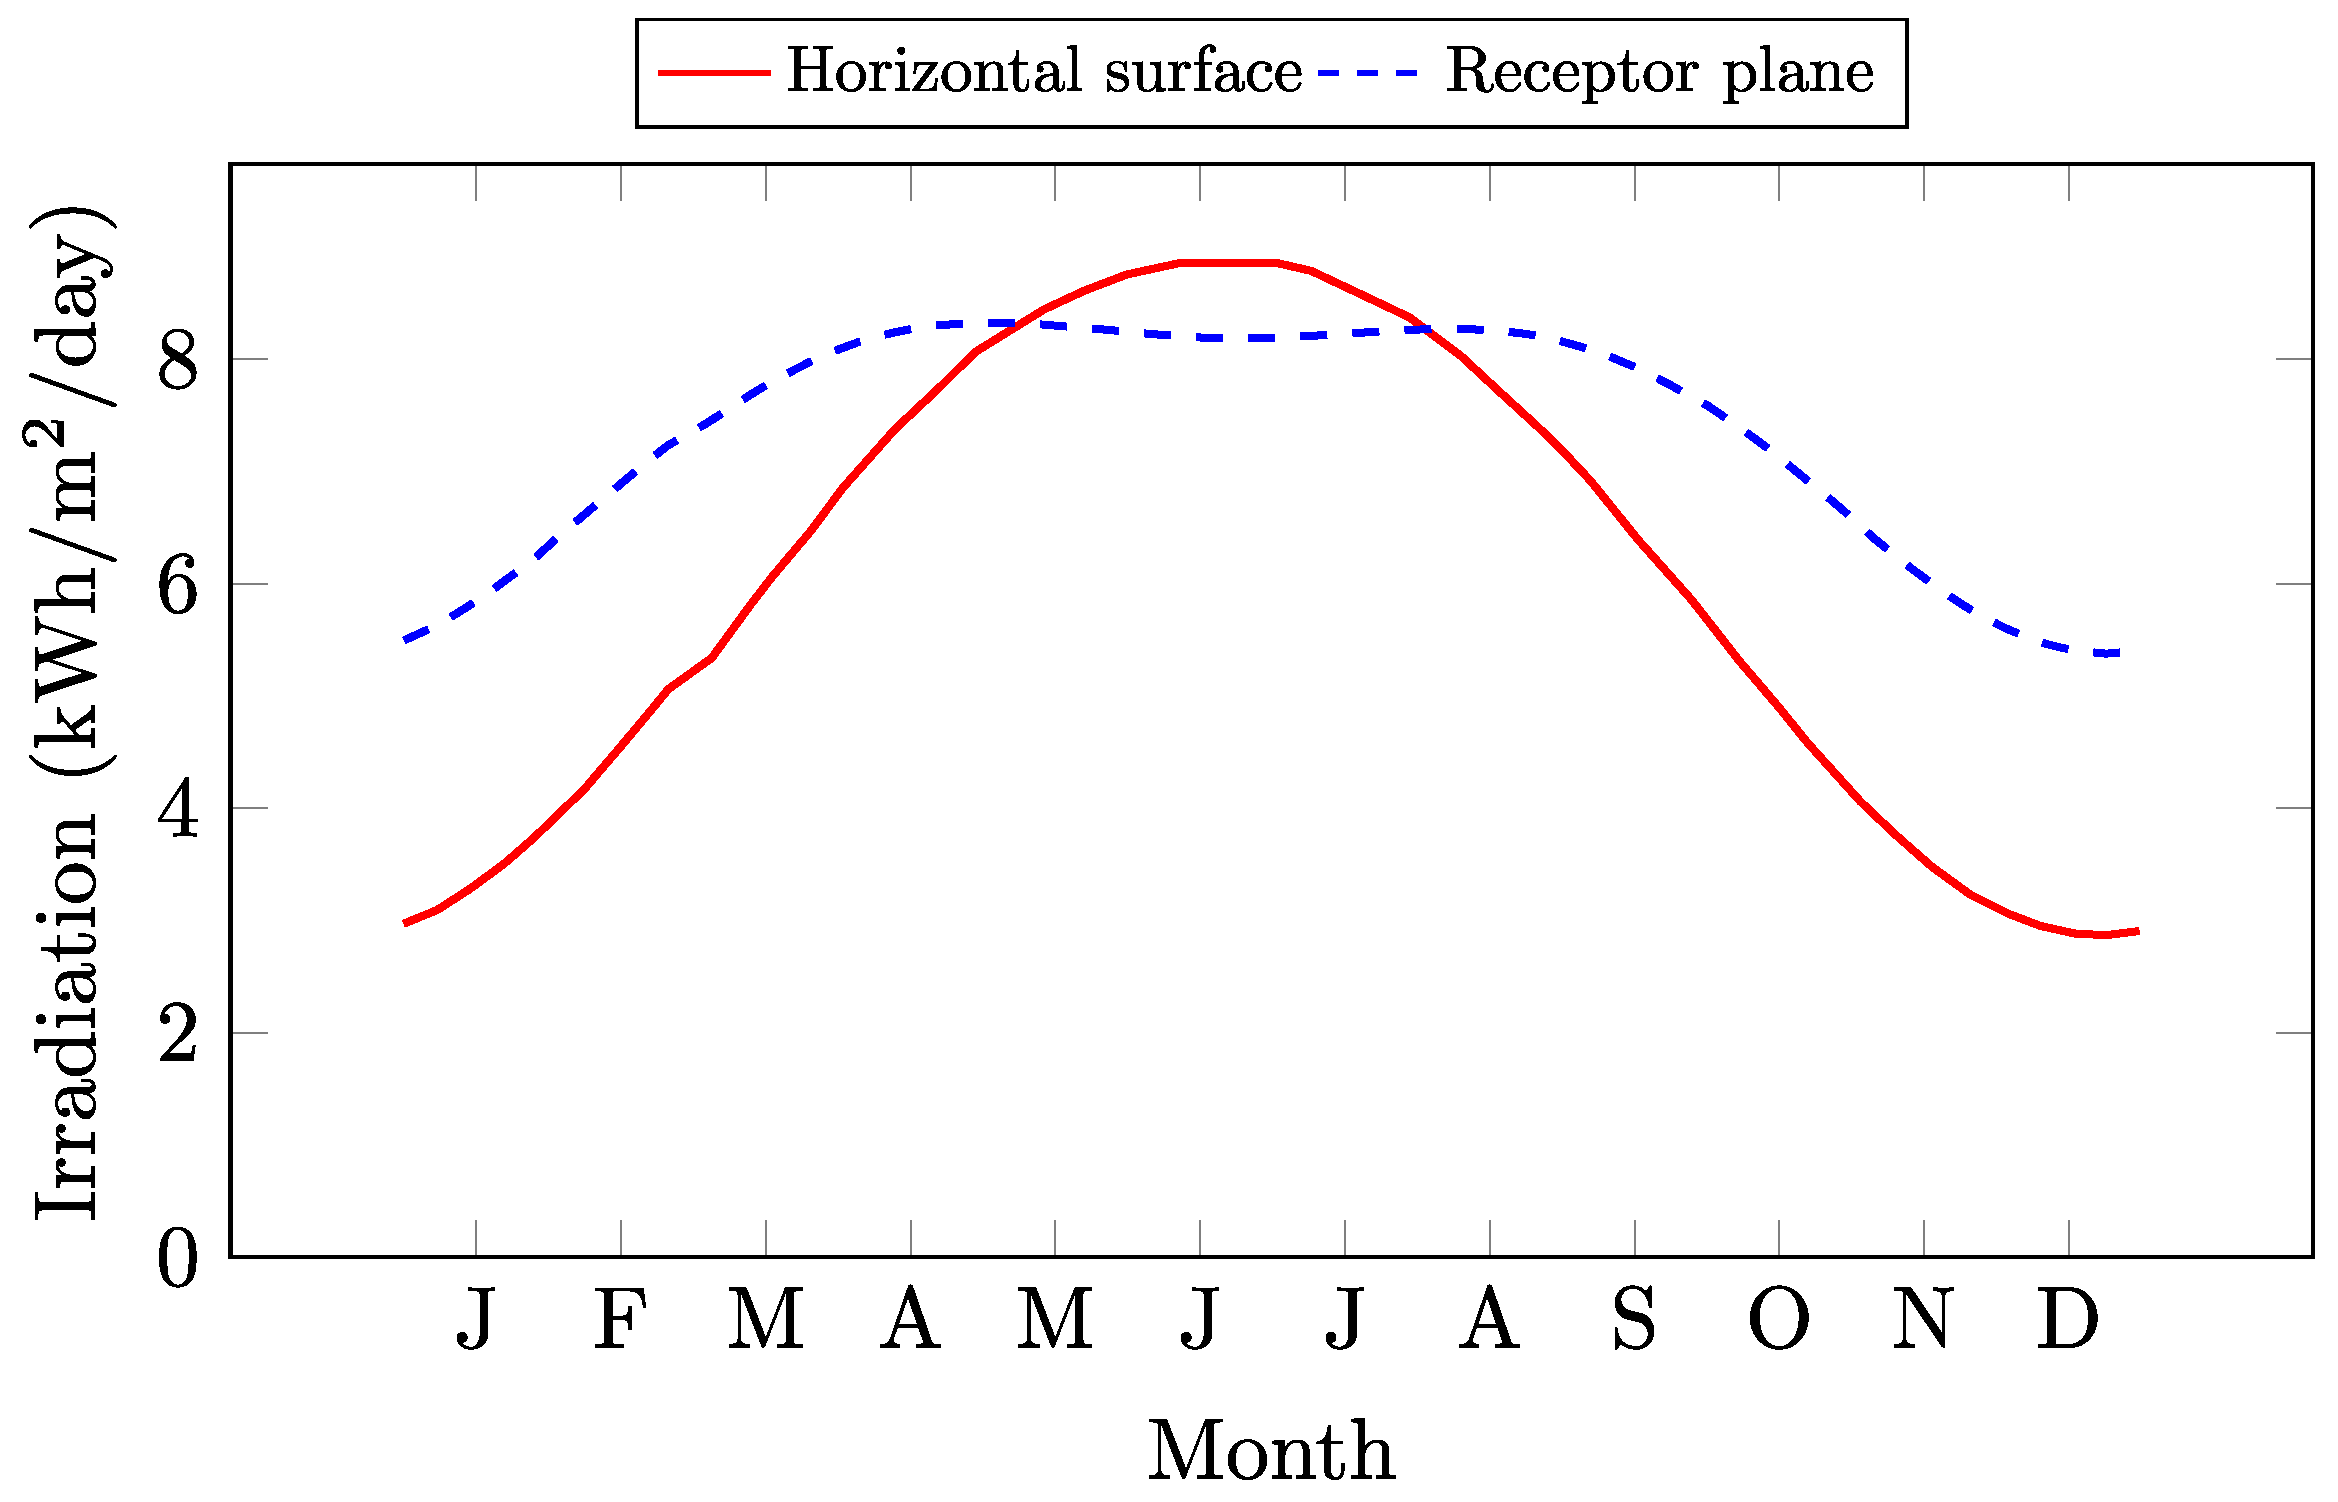
- Solar irradiation and temperature analysis. Both the solar irradiance and the temperature affect the behaviour of the PV modules [64]. On one hand, a PV module transforms the solar irradiance it receives into an electrical current, increasing its output as the irradiance increases. On the other hand, the electrical efficiency of the module decreases as the module temperature increases, due to the transformation of solar energy into heat [65]. These parameters can be assessed by directly measuring them at the specific site, using several online tools (like PVGIS [66]) or through a specific PV software, which usually has databases included (like PVSYST ©). The aim of this step is to determine if the location is suitable for a PV installation.
- Estimation of consumption. As the installation is off-grid, an exhaustive consumption questionnaire should be provided to the users of the installation. This means to know the installed and future electrical equipment, its electrical characteristics, and how the user will use the electrical receivers (hours/day, seasonality, during weekends…), as it is vital for the size of the PV installation and the batteries bank.
- Installation data. Several data regarding the installation system should be defined, highlighting the following:
- –
- The system’s direct current voltage.
- –
- The system’s alternating current voltage.
- –
- The type of installation (rooftop or on-site) and available surface for it.
- –
- The modules’ inclination and orientation.
- –
- The batteries’ autonomy days.
- –
- The possibility of a future expansion of the system.
2.2. Design
2.3. Choice
2.3.1. Weighting Phase
AHP
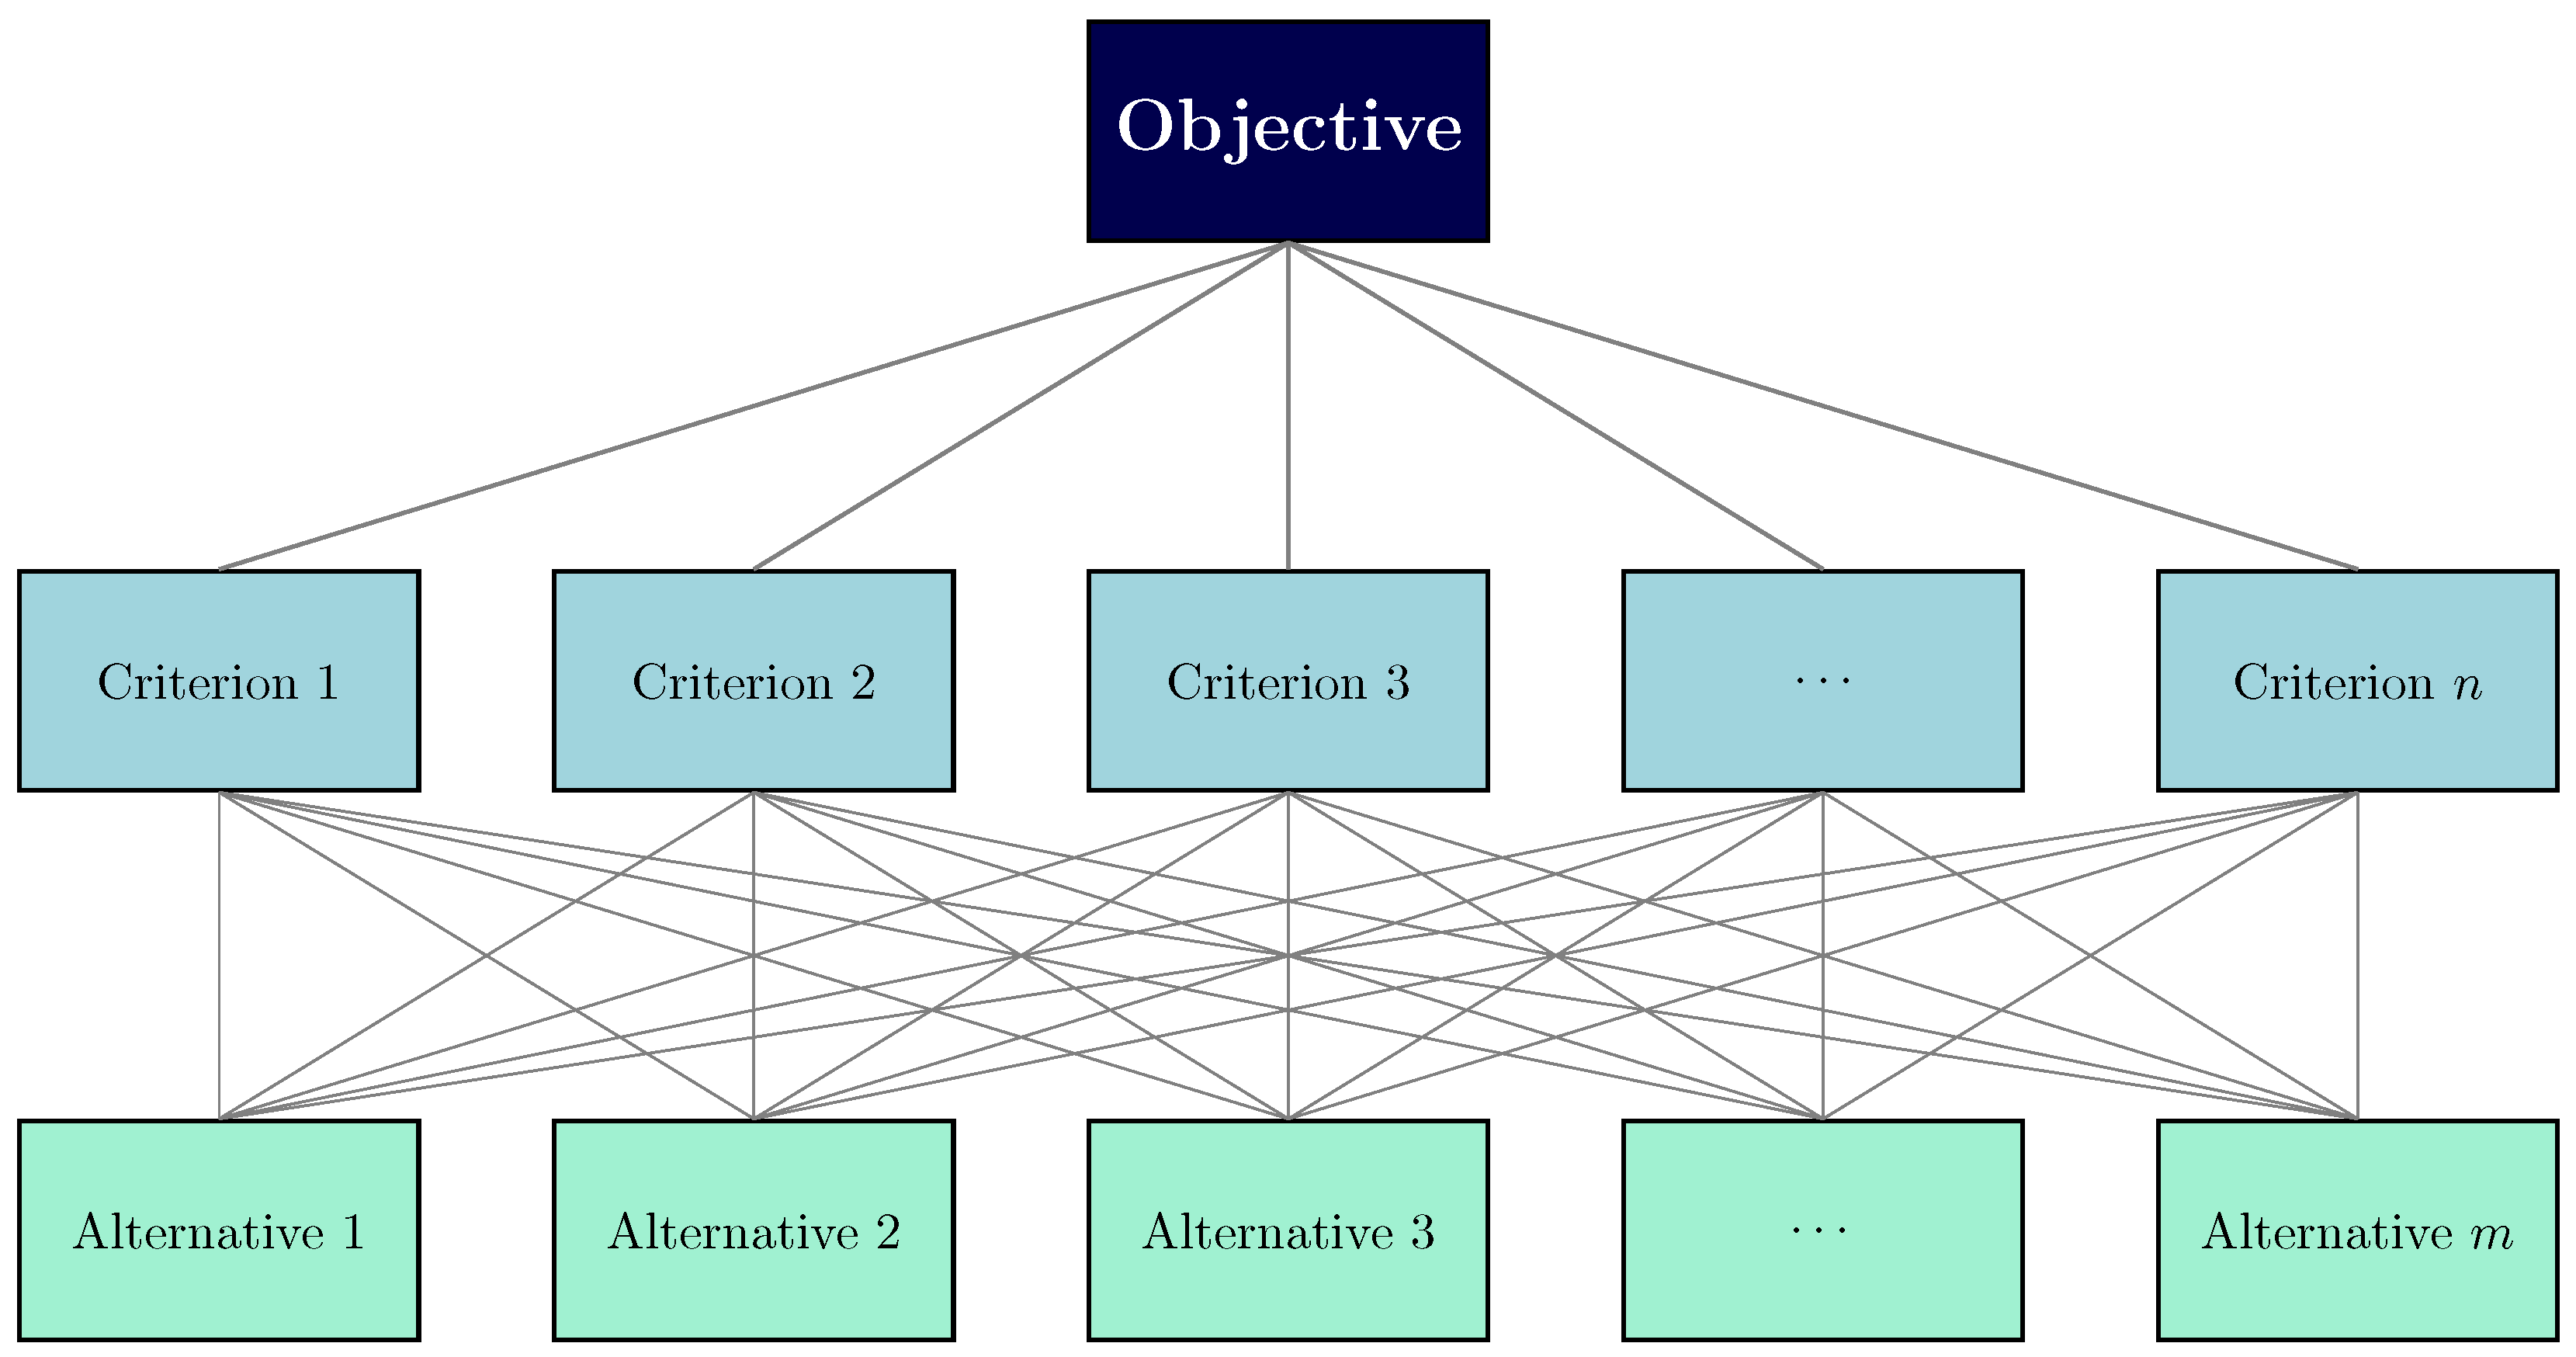
- Designing the hierarchical model: The problem is structured into a three-level hierarchy comprising the objective, the criteria, and the alternatives (see Figure 4).
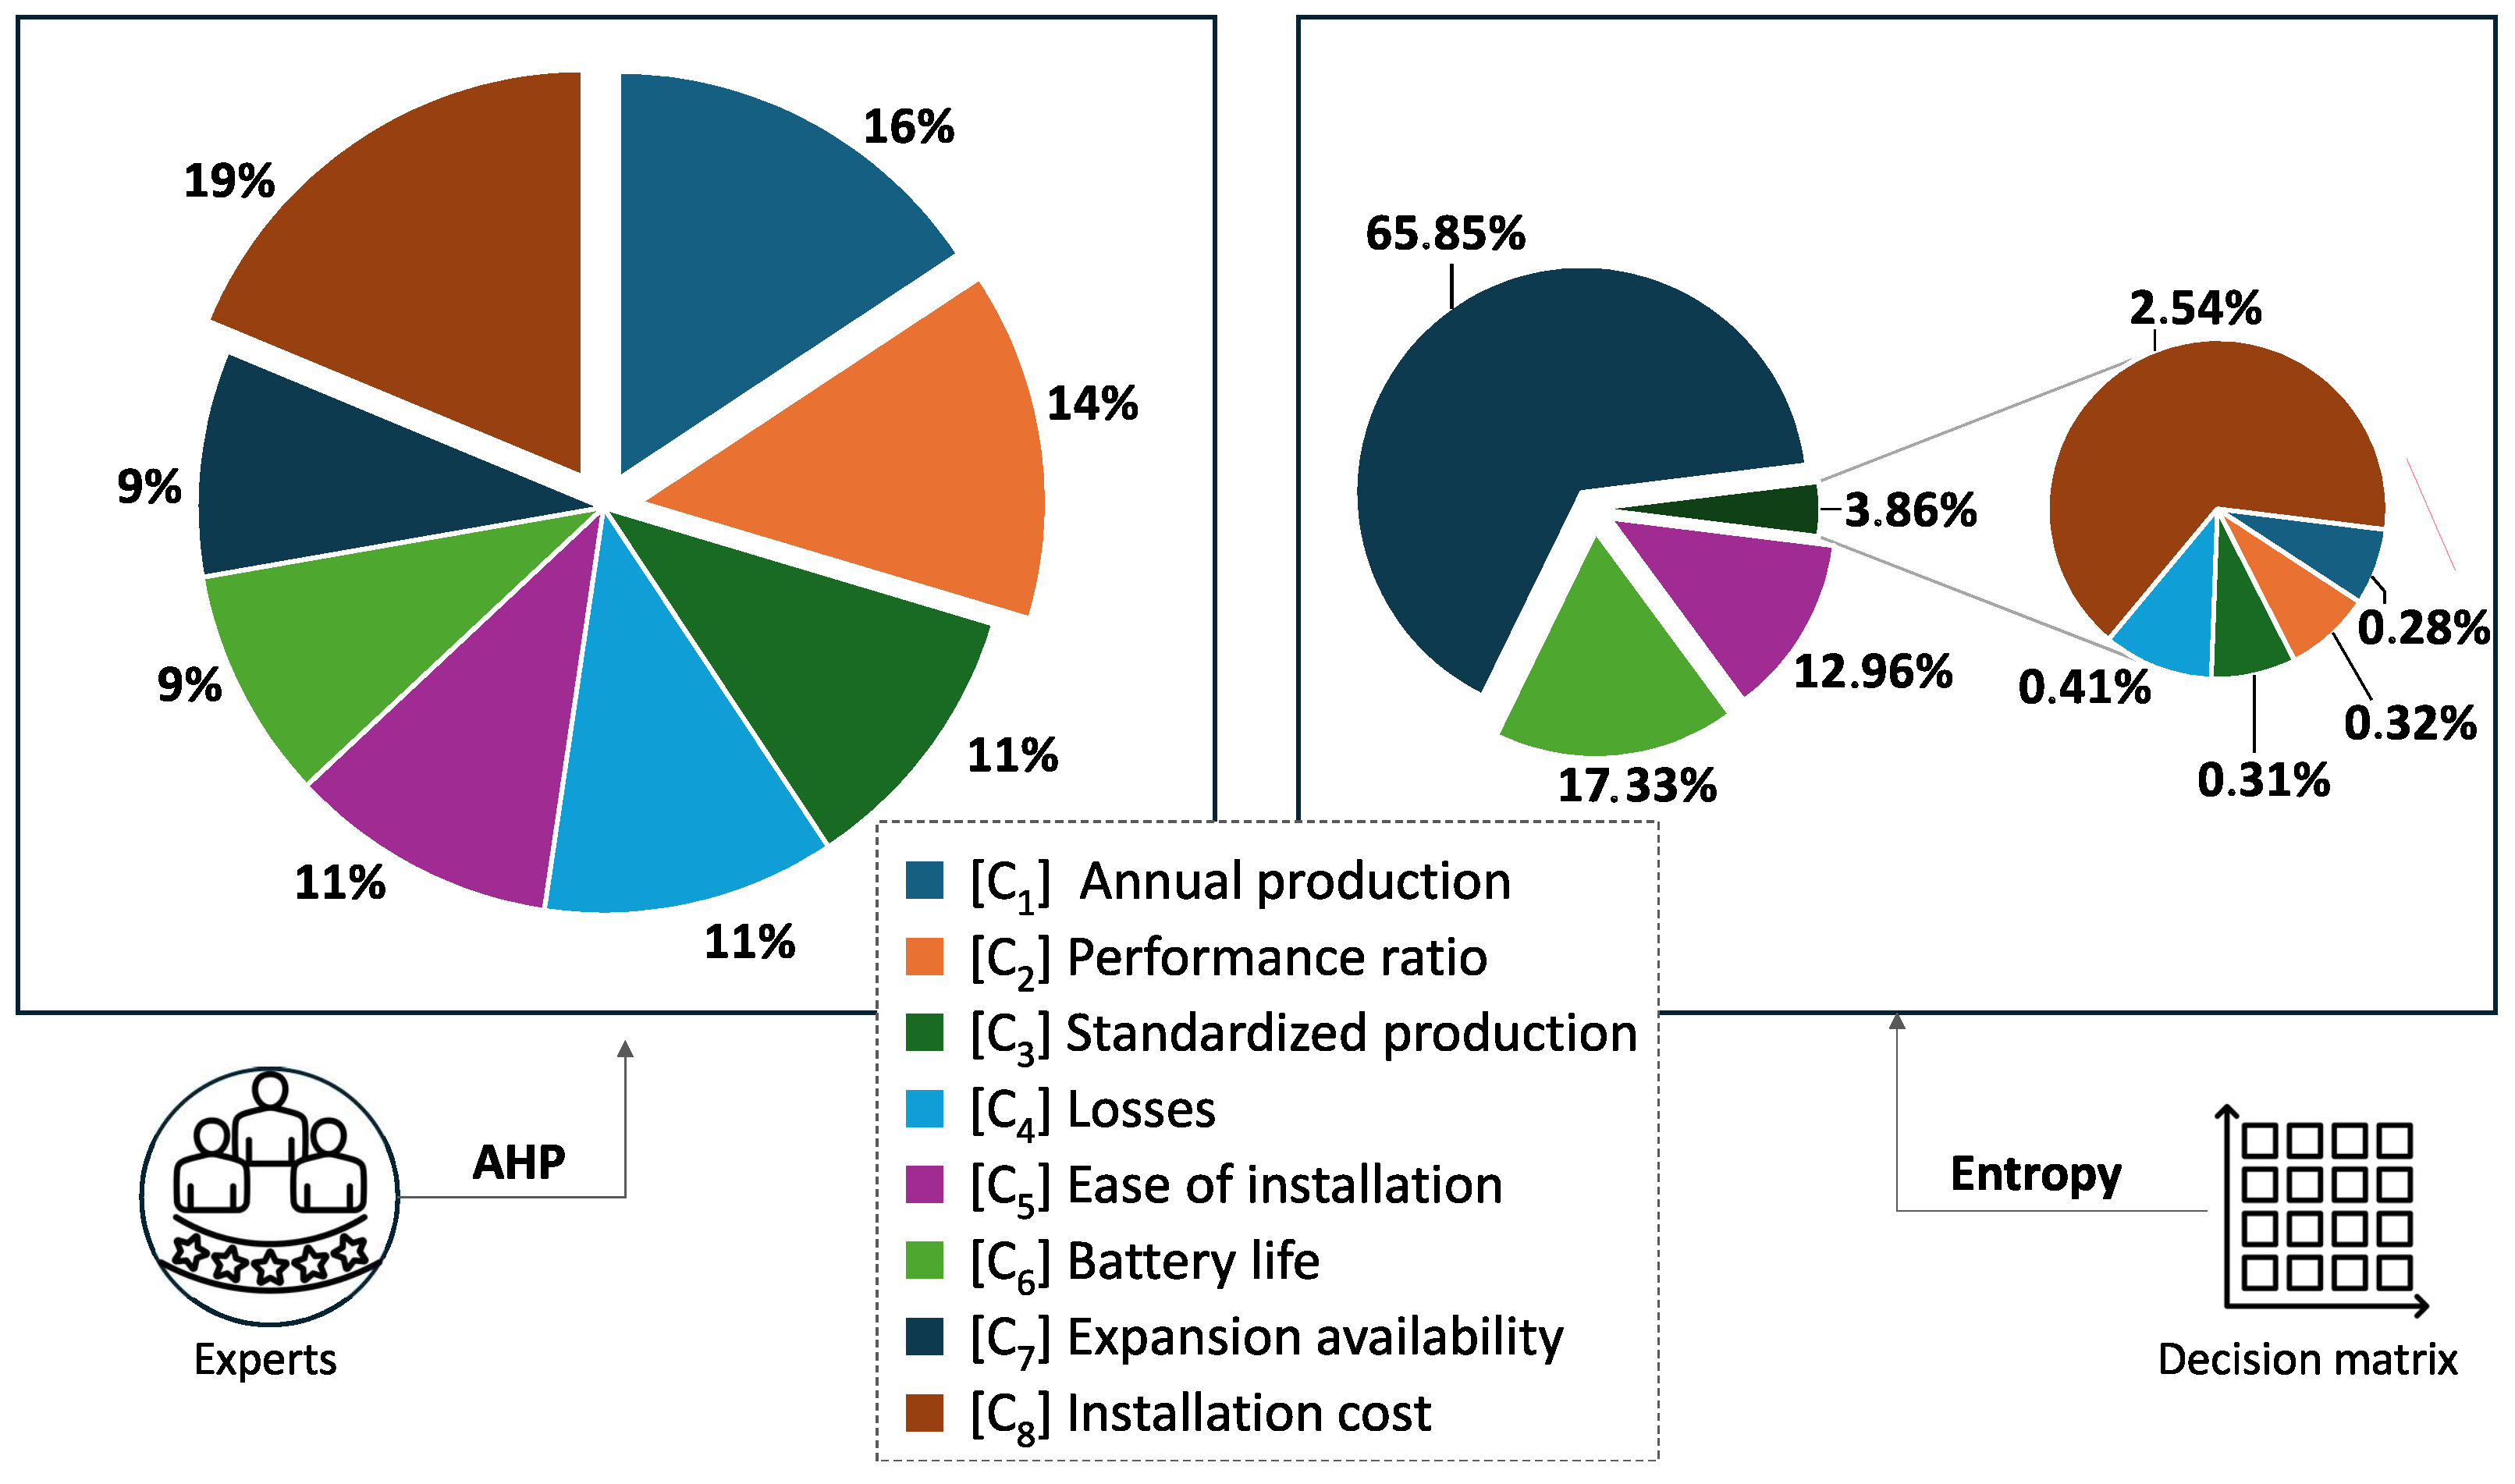
- Assigning and evaluating priorities: This step aims to determine the criteria weights through direct scaling or pairwise comparisons, generating a priority matrix W. Each matrix element represents the relative priority between row and column criteria, following a pre-defined scale (refer to Table 1). This pairwise comparison was carried out by a group of experts in the field.
Entropy
- Normalisation of the decision matrix: The normalised value of the in the alternative i is called and is determined from [83]:where is the evaluation of alternative relative to criterion .
- Determine the entropy of each criterion: The calculation is performed according to Equation (6):where K is a constant obtained aswhere m is the number of alternatives. In this way, the importance of a criterion is proportional to the amount of information intrinsically provided by the set of alternatives with respect to that criterion [84].
- Weight calculation: Finally, the weight w of each criterion is calculated according to Equation (8):
2.3.2. Ranking of Alternatives: TOPSIS
- Ai
- Alternatives, where ;
- Cj
- Criteria, where ;
- Alternative evaluation relative to criterion ;
- Criterion weight derived from the weighting phase (Section 2.3.1), where .
- Decision matrix construction. The method evaluates a decision matrix like the one shown in Table 3, where there are m alternatives () evaluated according to n criteria (), represented by values (the evaluation of the alternative following criterion ). The vector expresses the weights of the factors of , which is obtained following Section 2.3.1, always fulfilling that .
- Decision matrix normalisation. The matrix from Table 3 is normalised as follows:
- Normalised weighted matrix generation. The previous matrix is weighted () following the weights of the criteria:
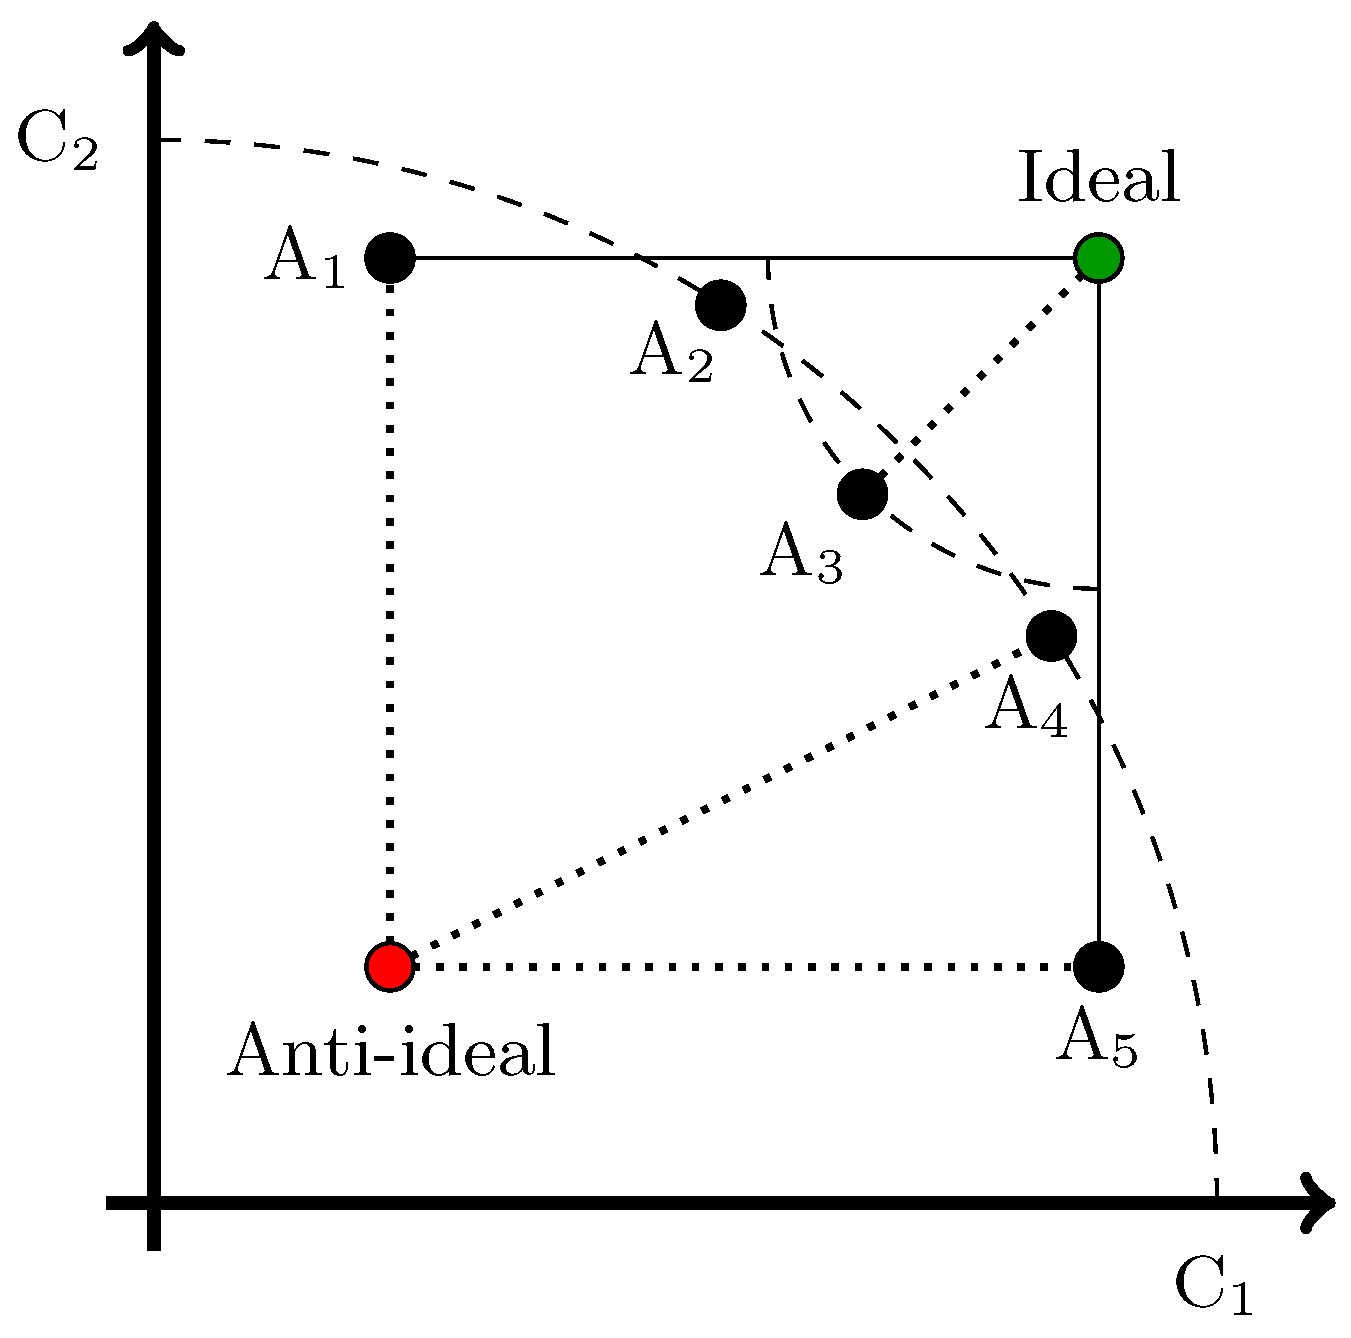
- Positive and negative ideal solution identification. The positive solution and negative solution are determined as follows:where J is related to maximising criteria, and is related to minimising criteria.
- Distance to the ideal solutions’ calculation. The distance between each alternative and the positive and negative solutions are estimated following a Euclidean m-multidimensional distance:
- Distance to positive ideal solution :
- Distance to negative ideal solution :
- Relative proximity to the ideal solutions’ computation. The relative proximity to the ideal solution is
- Alternatives’ ranking. Following the value of , the closer it is to 1, the better the alternative.
3. Case Study
4. Results
4.1. Data Collection
- Average electricity daily consumption: kWh/day.
- Autonomy of the system: 3 days.
- Use of the system: permanent.
- Suggested PV power: 2572 Wp.
- Suggested storage capacity: 559 Ah.
4.2. Design
- Lead-acid battery: Rolls 4 × 2 Sealed-Plates 12-CS-11PS (12 Vcc and 296 Ah).
- Lithium-ion battery: Pylontech Force H2/384 (384 Vcc and 37 Ah).
- A1
- Cadmium telluride module with lead-acid battery;
- A2
- Mono crystalline module with lead-acid battery;
- A3
- CIGS module with lead-acid battery;
- A4
- Bifacial module with lead-acid battery;
- A5
- Cadmium telluride module with lithium-ion battery;
- A6
- Mono crystalline module with lithium-ion battery;
- A7
- CIGS module with lithium-ion battery;
- A8
- Bifacial module with lithium-ion battery;
4.3. Choice
- C1
- Annual production (electrical generation produced yearly), measured in kWh/year. Obtained through simulations with PVSYST ©. It must be maximised.
- C2
- Performance ratio, a dimensional value obtained through simulations with PVSYST ©. It must be maximised.
- C3
- Standardised production, measured in kWh/kWp day and obtained through simulations with PVSYST ©. It must be maximised.
- C4
- Losses of the system, measured in kWh/kWp day, obtained through simulations with PVSYST ©. These losses are understood as generated energy by the PV installation, but not used by the user. Consequently, the lower its value, the better the installation’s design, and it must be minimised.
- C5
- Ease of installation, dimensionless and (ranked as 0–0.5–1) mainly affected by the configuration and type of battery to install. It must be maximised.
- C6
- Battery life, understood as the useful life of batteries, measured in years and obtained through simulations with PVSYST ©. It must be maximised.
- C7
- Availability to expand the installation (dimensionless, ranked 0–1), understood as the possibility to add new PV panels without needing to modify the two main elements of the installation (load regulator and/or PV inverter). It must be maximised.
- C8
- Installation cost, measured in €/Wp, considering the initial elements’ costs and their installation’s costs (which mainly depend on the number of PV panels and the battery type to install in each alternative). Obtained through simulations with PVSYST ©. It must be minimised.
4.3.1. Weighting Phase
- E1
- Owner of the house and main user of the PV installation under development.
- E2
- Installer, person in charge of executing the installation, with a wide experience in the PV sector.
- E3
- Technologist, highly qualified professional in the RES sector, specialises in PV installation designs.
4.3.2. Ranking of Alternatives: TOPSIS
4.4. Discussion
5. Conclusions
- The proposed DSS provides a rigorous framework for evaluating complex PV system alternatives based on multiple technical and economic criteria.
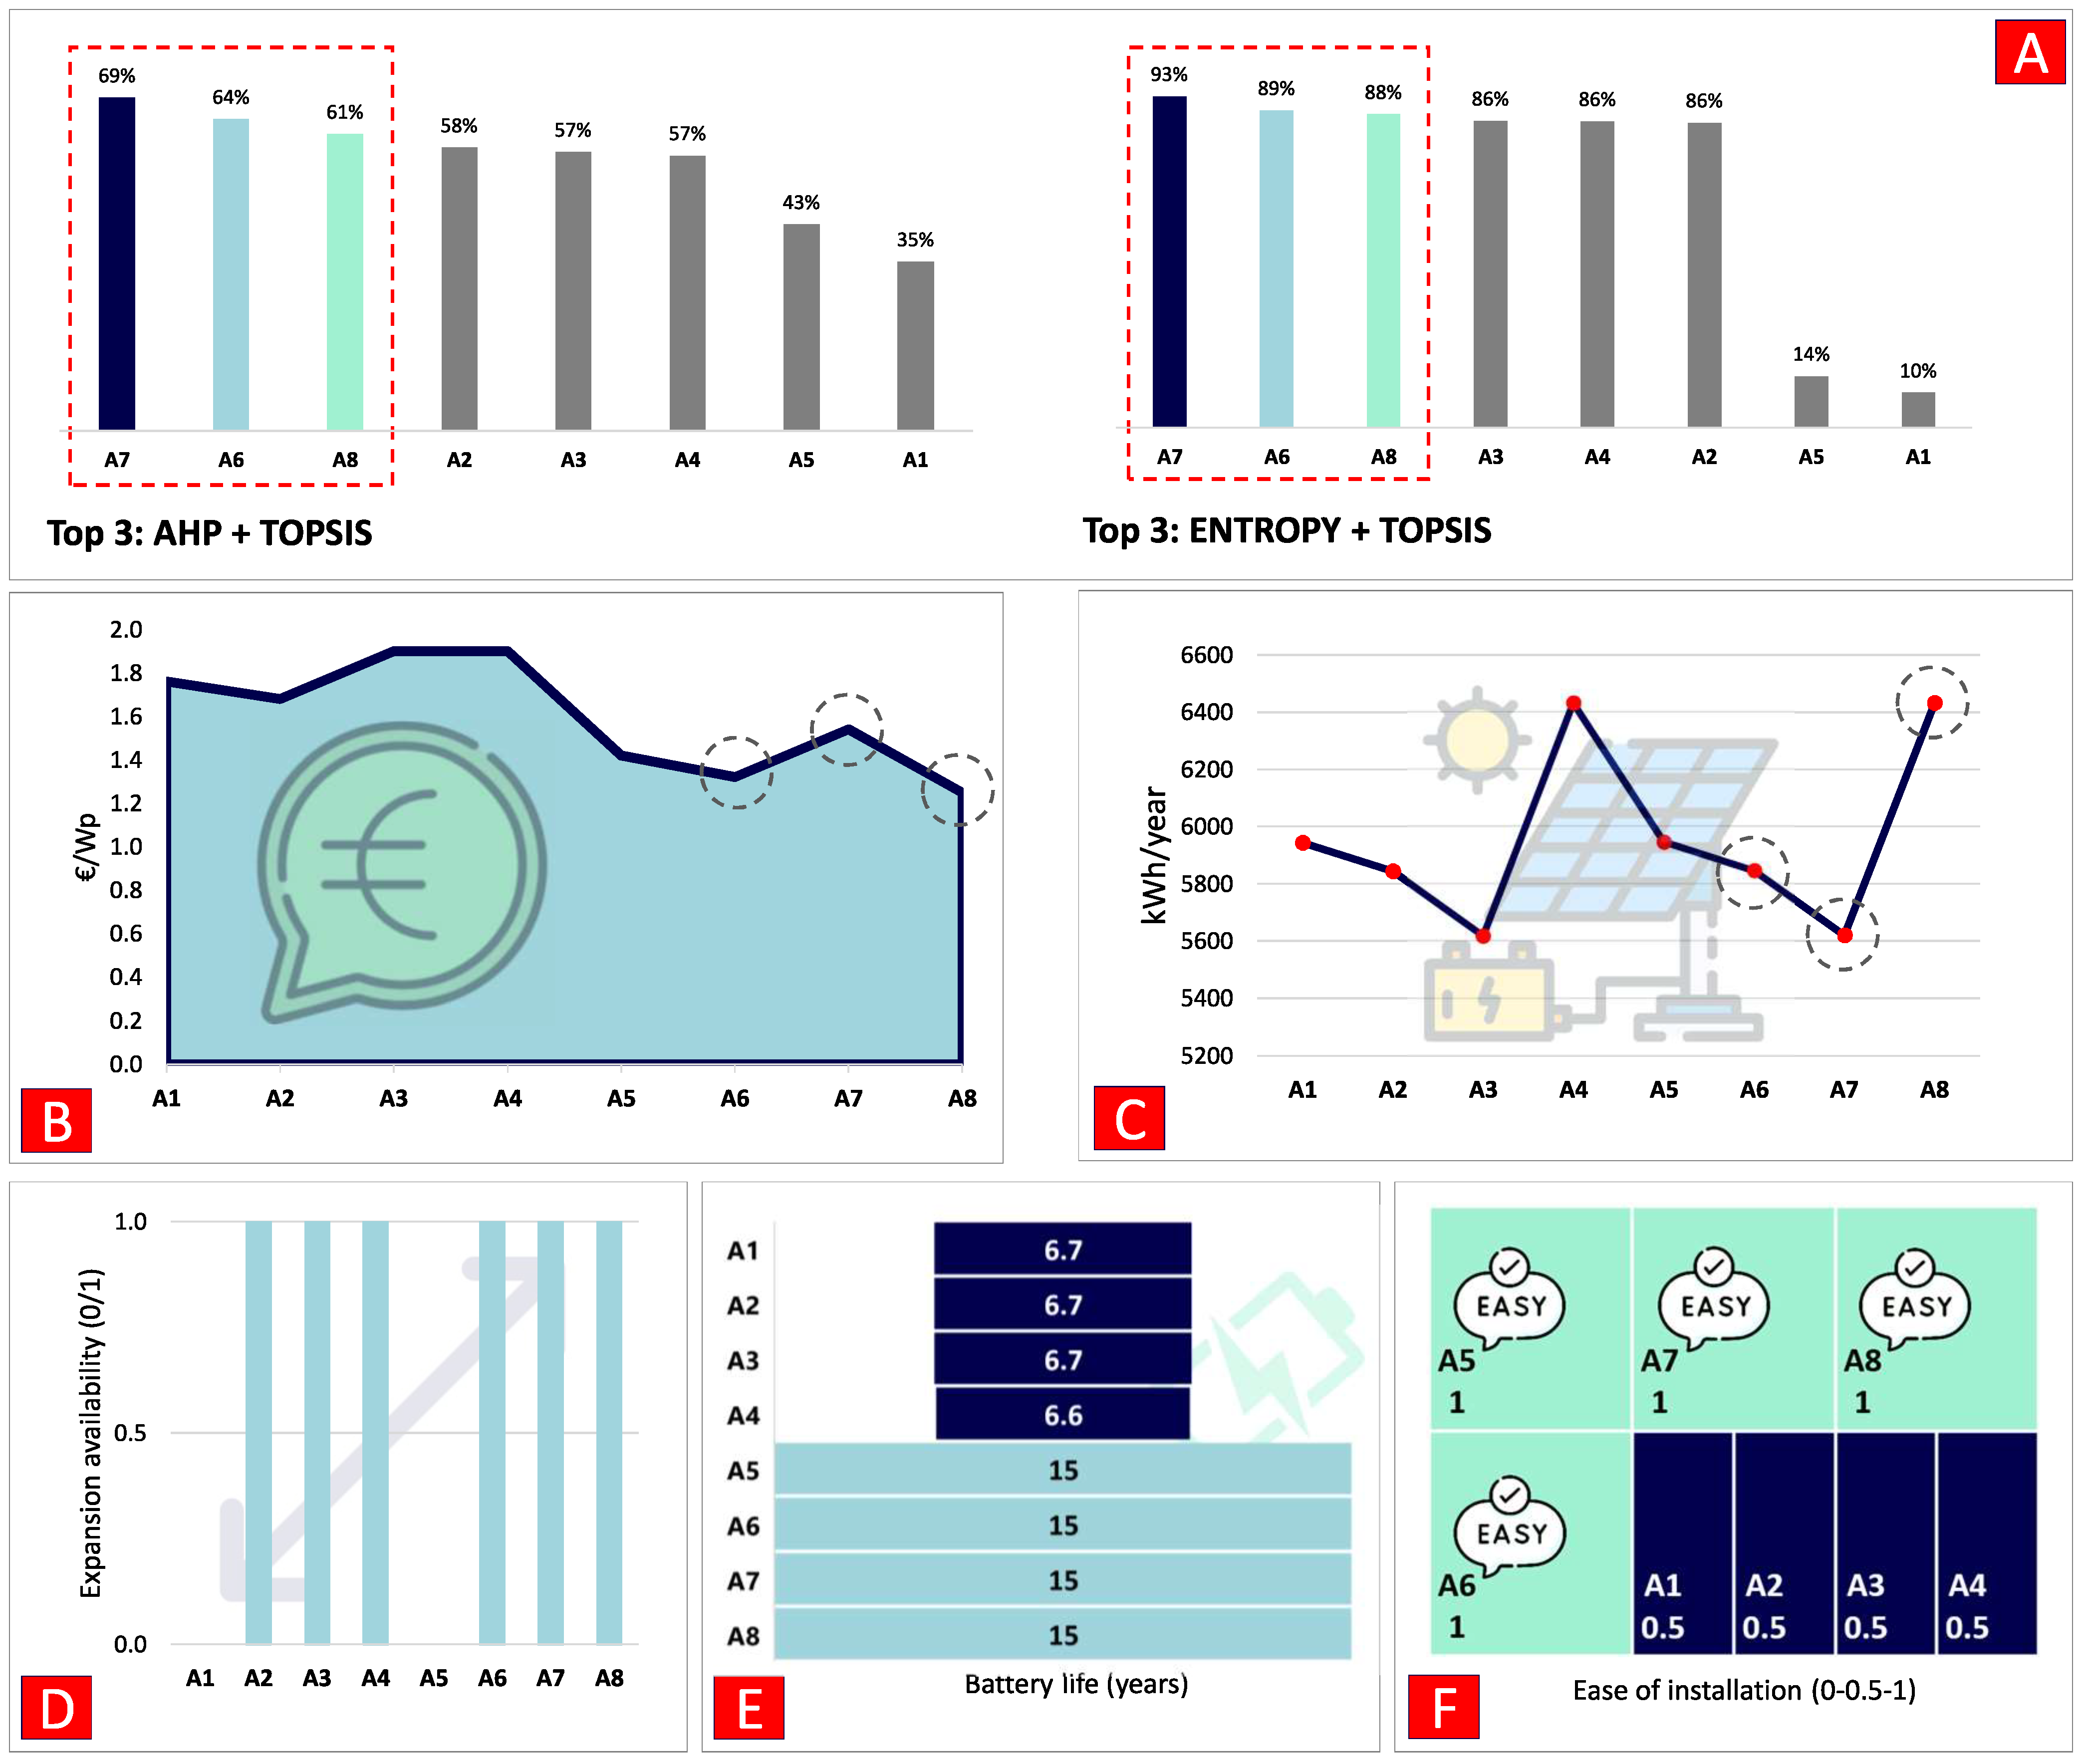
- While criterion weights differed substantially between the AHP and Entropy methods, TOPSIS proved robust in converging on similar alternative rankings.
- Lithium-ion batteries outperformed traditional lead-acid for this off-grid application due to factors like a higher discharge capacity and longer lifetimes.
- The CIGS module technology, though currently niche, showed promise by being the top-ranked solution when paired with lithium-ion batteries.
- AHP’s subjectivity allows prioritising intuitive criteria like costs and energy yield, while Entropy’s objectivity may disproportionately weight criteria with limited data variability. Therefore, it is recommended to consider both weighting approaches, or explore combining them through techniques like the compromised method, to leverage their respective strengths.
Author Contributions
Funding
Data Availability Statement
Conflicts of Interest
Abbreviations
| AHP | Analytical hierarchy process; |
| CIGS | Copper indium gallium selenide; |
| DSS | Decision support system; |
| ELECTRE | Elimination and choice expressing reality; |
| MCDM | Multi-criteria decision making; |
| PV | Photovoltaic; |
| RES | Renewable energy sources; |
| TOPSIS | Technique for order of preference by similarity to ideal solution. |
References
- García-Sánchez, T.; Mishra, A.K.; Hurtado-Pérez, E.; Puché-Panadero, R.; Fernández-Guillamón, A. A controller for optimum electrical power extraction from a small grid-interconnected wind turbine. Energies 2020, 13, 5809. [Google Scholar] [CrossRef]
- Baranes, E.; Jacqmin, J.; Poudou, J.C. Non-renewable and intermittent renewable energy sources: Friends and foes? Energy Policy 2017, 111, 58–67. [Google Scholar] [CrossRef]
- Fernández-Guillamón, A.; Villena-Lapaz, J.; Vigueras-Rodríguez, A.; García-Sánchez, T.; Molina-García, Á. An adaptive frequency strategy for variable speed wind turbines: Application to high wind integration into power systems. Energies 2018, 11, 1436. [Google Scholar] [CrossRef]
- Fernández-Guillamón, A.; Das, K.; Cutululis, N.A.; Molina-García, Á. Offshore Wind Power Integration into Future Power Systems: Overview and Trends. J. Mar. Sci. Eng. 2019, 7, 399. [Google Scholar] [CrossRef]
- Daaboul, J.; Moriarty, P.; Honnery, D. Net green energy potential of solar photovoltaic and wind energy generation systems. J. Clean. Prod. 2023, 415, 137806. [Google Scholar] [CrossRef]
- Lebedys, A.; Akande, D.; Coënt, N.; Elhassan, N.; Escamilla, G.; Arkhipova, I.; Whiteman, A. Renewable Capacity Statistics 2023; Technical Report; International Renewable Energy Agency: Abu Dhabi, United Arab Emirates, 2023. [Google Scholar]
- Ram, M.; Bogdanov, D.; Aghahosseini, A.; Gulagi, A.; Oyewo, S.A.; Child, M.; Caldera, U.; Sadovskaia, K.; Farfan, J.; Barbosa, L.S.; et al. Global Energy System Based on 100 Transport and Desalination Sectors; Technical Report; Lappeenranta University of Technology and Energy Watch Group: Berlin, Germany, 2019. [Google Scholar]
- Jacobson, M.Z. Review of solutions to global warming, air pollution, and energy security. Energy Environ. Sci. 2009, 2, 148–173. [Google Scholar] [CrossRef]
- Luthander, R.; Widén, J.; Nilsson, D.; Palm, J. Photovoltaic self-consumption in buildings: A review. Appl. Energy 2015, 142, 80–94. [Google Scholar] [CrossRef]
- Warneryd, M.; Karltorp, K. The role of values for niche expansion: The case of solar photovoltaics on large buildings in Sweden. Energy Sustain. Soc. 2020, 10, 7. [Google Scholar] [CrossRef]
- Usman, Z.; Tah, J.; Abanda, H.; Nche, C. A Critical Appraisal of PV-Systems’ Performance. Buildings 2020, 10, 192. [Google Scholar] [CrossRef]
- Reindl, K.; Palm, J. Installing PV: Barriers and enablers experienced by non-residential property owners. Renew. Sustain. Energy Rev. 2021, 141, 110829. [Google Scholar] [CrossRef]
- Semaoui, S.; Arab, A.H.; Bacha, S.; Azoui, B. Optimal Sizing of a Stand-alone Photovoltaic System with Energy Management in Isolated Areas. Energy Procedia 2013, 36, 358–368. [Google Scholar] [CrossRef]
- Abualigah, L.; Zitar, R.A.; Almotairi, K.H.; Hussein, A.M.; Abd Elaziz, M.; Nikoo, M.R.; Gandomi, A.H. Wind, Solar, and Photovoltaic Renewable Energy Systems with and without Energy Storage Optimization: A Survey of Advanced Machine Learning and Deep Learning Techniques. Energies 2022, 15, 578. [Google Scholar] [CrossRef]
- Sioshansi, F.P.; Zamani, R.; Moghaddam, M.P. 1-Energy transformation and decentralization in future power systems. In Decentralized Frameworks for Future Power Systems; Moghaddam, M.P., Zamani, R., Alhelou, H.H., Siano, P., Eds.; Academic Press: Cambridge, MA, USA, 2022; pp. 1–18. [Google Scholar] [CrossRef]
- Pradhan, A.; Panda, B. Analysis of ten external factors affecting the performance of PV system. In Proceedings of the 2017 International Conference on Energy, Communication, Data Analytics and Soft Computing (ICECDS), Chennai, India, 1–2 August 2017; pp. 3093–3098. [Google Scholar] [CrossRef]
- Fouad, M.; Shihata, L.A.; Morgan, E.I. An integrated review of factors influencing the perfomance of photovoltaic panels. Renew. Sustain. Energy Rev. 2017, 80, 1499–1511. [Google Scholar] [CrossRef]
- Rediske, G.; Siluk, J.C.M.; Gastaldo, N.G.; Rigo, P.D.; Rosa, C.B. Determinant factors in site selection for photovoltaic projects: A systematic review. Int. J. Energy Res. 2019, 43, 1689–1701. [Google Scholar] [CrossRef]
- de Oliveira Azevêdo, R.; Rotela Junior, P.; Rocha, L.C.S.; Chicco, G.; Aquila, G.; Peruchi, R.S. Identification and Analysis of Impact Factors on the Economic Feasibility of Photovoltaic Energy Investments. Sustainability 2020, 12, 7173. [Google Scholar] [CrossRef]
- Aslam, A.; Ahmed, N.; Qureshi, S.A.; Assadi, M.; Ahmed, N. Advances in Solar PV Systems; A Comprehensive Review of PV Performance, Influencing Factors, and Mitigation Techniques. Energies 2022, 15, 7595. [Google Scholar] [CrossRef]
- Chang, K.H. A decision support system for planning and coordination of hybrid renewable energy systems. Decis. Support Syst. 2014, 64, 4–13. [Google Scholar] [CrossRef]
- Georgopoulou, E.; Sarafidis, Y.; Diakoulaki, D. Design and implementation of a group DSS for sustaining renewable energies exploitation. Eur. J. Oper. Res. 1998, 109, 483–500. [Google Scholar] [CrossRef]
- Dagdougui, H.; Ouammi, A.; Sacile, R. A regional decision support system for onsite renewable hydrogen production from solar and wind energy sources. Int. J. Hydrogen Energy 2011, 36, 14324–14334. [Google Scholar] [CrossRef]
- Beriro, D.; Nathanail, J.; Salazar, J.; Kingdon, A.; Marchant, A.; Richardson, S.; Gillet, A.; Rautenberg, S.; Hammond, E.; Beardmore, J.; et al. A decision support system to assess the feasibility of onshore renewable energy infrastructure. Renew. Sustain. Energy Rev. 2022, 168, 112771. [Google Scholar] [CrossRef]
- Liu, R.; Sun, H.; Zhang, L.; Zhuang, Q.; Zhang, L.; Zhang, X.; Chen, Y. Low-Carbon Energy Planning: A Hybrid MCDM Method Combining DANP and VIKOR Approach. Energies 2018, 11, 3401. [Google Scholar] [CrossRef]
- Solangi, Y.A.; Longsheng, C.; Shah, S.A.A.; Alsanad, A.; Ahmad, M.; Akbar, M.A.; Gumaei, A.; Ali, S. Analyzing Renewable Energy Sources of a Developing Country for Sustainable Development: An Integrated Fuzzy Based-Decision Methodology. Processes 2020, 8, 825. [Google Scholar] [CrossRef]
- Taylan, O.; Alamoudi, R.; Kabli, M.; AlJifri, A.; Ramzi, F.; Herrera-Viedma, E. Assessment of Energy Systems Using Extended Fuzzy AHP, Fuzzy VIKOR, and TOPSIS Approaches to Manage Non-Cooperative Opinions. Sustainability 2020, 12, 2745. [Google Scholar] [CrossRef]
- Trojanowska, M.; Nęcka, K. Selection of the Multiple-Criiater Decision-Making Method for Evaluation of Sustainable Energy Development: A Case Study of Poland. Energies 2020, 13, 6321. [Google Scholar] [CrossRef]
- Wang, C.N.; Kao, J.C.; Wang, Y.H.; Nguyen, V.T.; Nguyen, V.T.; Husain, S.T. A Multicriteria Decision-Making Model for the Selection of Suitable Renewable Energy Sources. Mathematics 2021, 9, 1318. [Google Scholar] [CrossRef]
- Wang, C.N.; Nguyen, V.T.; Thai, H.T.N.; Duong, D.H. Multi-Criteria Decision Making (MCDM) Approaches for Solar Power Plant Location Selection in Viet Nam. Energies 2018, 11, 1504. [Google Scholar] [CrossRef]
- Al-Shammari, S.; Ko, W.; Al Ammar, E.A.; Alotaibi, M.A.; Choi, H.J. Optimal Decision-Making in Photovoltaic System Selection in Saudi Arabia. Energies 2021, 14, 357. [Google Scholar] [CrossRef]
- Prieto-Amparán, J.A.; Pinedo-Alvarez, A.; Morales-Nieto, C.R.; Valles-Aragón, M.C.; Álvarez Holguín, A.; Villarreal-Guerrero, F. A Regional GIS-Assisted Multi-Criteria Evaluation of Site-Suitability for the Development of Solar Farms. Land 2021, 10, 217. [Google Scholar] [CrossRef]
- Kowalczyk, A.M.; Czyża, S. Optimising Photovoltaic Farm Location Using a Capabilities Matrix and GIS. Energies 2022, 15, 6693. [Google Scholar] [CrossRef]
- Ali, S.; Lee, S.M.; Jang, C.M. Determination of the Most Optimal On-Shore Wind Farm Site Location Using a GIS-MCDM Methodology: Evaluating the Case of South Korea. Energies 2017, 10, 2072. [Google Scholar] [CrossRef]
- Wang, C.N.; Huang, Y.F.; Chai, Y.C.; Nguyen, V.T. A Multi-Criteria Decision Making (MCDM) for Renewable Energy Plants Location Selection in Vietnam under a Fuzzy Environment. Appl. Sci. 2018, 8, 2069. [Google Scholar] [CrossRef]
- Gil-García, I.C.; Ramos-Escudero, A.; García-Cascales, M.; Dagher, H.; Molina-García, A. Fuzzy GIS-based MCDM solution for the optimal offshore wind site selection: The Gulf of Maine case. Renew. Energy 2022, 183, 130–147. [Google Scholar] [CrossRef]
- Yousefi, H.; Motlagh, S.G.; Montazeri, M. Multi-Criteria Decision-Making System for Wind Farm Site-Selection Using Geographic Information System (GIS): Case Study of Semnan Province, Iran. Sustainability 2022, 14, 7640. [Google Scholar] [CrossRef]
- Gil-García, I.C.; Ramos-Escudero, A.; Molina-García, Á.; Fernández-Guillamón, A. GIS-based MCDM dual optimization approach for territorial-scale offshore wind power plants. J. Clean. Prod. 2023, 428, 139484. [Google Scholar] [CrossRef]
- Chien, F.; Wang, C.N.; Nguyen, V.T.; Nguyen, V.T.; Chau, K.Y. An Evaluation Model of Quantitative and Qualitative Fuzzy Multi-Criteria Decision-Making Approach for Hydroelectric Plant Location Selection. Energies 2020, 13, 2783. [Google Scholar] [CrossRef]
- Wang, C.N.; Tsai, T.T.; Huang, Y.F. A Model for Optimizing Location Selection for Biomass Energy Power Plants. Processes 2019, 7, 353. [Google Scholar] [CrossRef]
- Wang, C.N.; Chen, Y.T.; Tung, C.C. Evaluation of Wave Energy Location by Using an Integrated MCDM Approach. Energies 2021, 14, 1840. [Google Scholar] [CrossRef]
- Shao, M.; Zhang, S.; Sun, J.; Han, Z.; Shao, Z.; Yi, C. GIS-MCDM-Based Approach to Site Selection of Wave Power Plants for Islands in China. Energies 2022, 15, 4118. [Google Scholar] [CrossRef]
- Ali, F.; Bennui, A.; Chowdhury, S.; Techato, K. Suitable Site Selection for Solar-Based Green Hydrogen in Southern Thailand Using GIS-MCDM Approach. Sustainability 2022, 14, 6597. [Google Scholar] [CrossRef]
- Krassakis, P.; Karavias, A.; Zygouri, E.; Roumpos, C.; Louloudis, G.; Pyrgaki, K.; Koukouzas, N.; Kempka, T.; Karapanos, D. GIS-Based Assessment of Hybrid Pumped Hydro Storage as a Potential Solution for the Clean Energy Transition: The Case of the Kardia Lignite Mine, Western Greece. Sensors 2023, 23, 593. [Google Scholar] [CrossRef]
- Ramezanzade, M.; Karimi, H.; Almutairi, K.; Xuan, H.A.; Saebi, J.; Mostafaeipour, A.; Techato, K. Implementing MCDM Techniques for Ranking Renewable Energy Projects under Fuzzy Environment: A Case Study. Sustainability 2021, 13, 2858. [Google Scholar] [CrossRef]
- da Silva, R.F.; Bellinello, M.M.; de Souza, G.F.M.; Antomarioni, S.; Bevilacqua, M.; Ciarapica, F.E. Deciding a Multicriteria Decision-Making (MCDM) Method to Prioritize Maintenance Work Orders of Hydroelectric Power Plants. Energies 2021, 14, 8281. [Google Scholar] [CrossRef]
- Zhao, J.; Patwary, A.K.; Qayyum, A.; Alharthi, M.; Bashir, F.; Mohsin, M.; Hanif, I.; Abbas, Q. The determinants of renewable energy sources for the fueling of green and sustainable economy. Energy 2022, 238, 122029. [Google Scholar] [CrossRef]
- Gribiss, H.; Aghelinejad, M.M.; Yalaoui, F. Configuration Selection for Renewable Energy Community Using MCDM Methods. Energies 2023, 16, 2632. [Google Scholar] [CrossRef]
- Lee, A.H.; Hung, M.C.; Kang, H.Y.; Pearn, W. A wind turbine evaluation model under a multi-criteria decision making environment. Energy Convers. Manag. 2012, 64, 289–300. [Google Scholar] [CrossRef]
- Madlener, R.; Antunes, C.H.; Dias, L.C. Assessing the performance of biogas plants with multi-criteria and data envelopment analysis. Eur. J. Oper. Res. 2009, 197, 1084–1094. [Google Scholar] [CrossRef]
- Alsayed, M.; Cacciato, M.; Scarcella, G.; Scelba, G. Design of hybrid power generation systems based on multi criteria decision analysis. Sol. Energy 2014, 105, 548–560. [Google Scholar] [CrossRef]
- Mardani, A.; Jusoh, A.; Zavadskas, E.K.; Cavallaro, F.; Khalifah, Z. Sustainable and Renewable Energy: An Overview of the Application of Multiple Criteria Decision Making Techniques and Approaches. Sustainability 2015, 7, 13947–13984. [Google Scholar] [CrossRef]
- Rigo, P.D.; Rediske, G.; Rosa, C.B.; Gastaldo, N.G.; Michels, L.; Neuenfeldt Júnior, A.L.; Siluk, J.C.M. Renewable Energy Problems: Exploring the Methods to Support the Decision-Making Process. Sustainability 2020, 12, 10195. [Google Scholar] [CrossRef]
- Liu, S.; Duffy, A.H.; Whitfield, R.I.; Boyle, I.M. Integration of decision support systems to improve decision support performance. Knowl. Inf. Syst. 2010, 22, 261–286. [Google Scholar] [CrossRef]
- Jozaghi, A.; Alizadeh, B.; Hatami, M.; Flood, I.; Khorrami, M.; Khodaei, N.; Ghasemi Tousi, E. A Comparative Study of the AHP and TOPSIS Techniques for Dam Site Selection Using GIS: A Case Study of Sistan and Baluchestan Province, Iran. Geosciences 2018, 8, 494. [Google Scholar] [CrossRef]
- Zhu, S.; Li, D.; Feng, H.; Gu, T.; Zhu, J. AHP-TOPSIS-Based Evaluation of the Relative Performance of Multiple Neighborhood Renewal Projects: A Case Study in Nanjing, China. Sustainability 2019, 11, 4545. [Google Scholar] [CrossRef]
- Hajduk, S.; Jelonek, D. A Decision-Making Approach Based on TOPSIS Method for Ranking Smart Cities in the Context of Urban Energy. Energies 2021, 14, 2691. [Google Scholar] [CrossRef]
- Khorsandi, A.; Li, L. A Multi-Analysis of Children and Adolescents’ Video Gaming Addiction with the AHP and TOPSIS Methods. Int. J. Environ. Res. Public Health 2022, 19, 9680. [Google Scholar] [CrossRef]
- Vásquez, J.A.; Escobar, J.W.; Manotas, D.F. AHP–TOPSIS Methodology for Stock Portfolio Investments. Risks 2022, 10, 4. [Google Scholar] [CrossRef]
- Wang, K.; Wang, Z.; Deng, J.; Feng, Y.; Li, Q. Study on the Evaluation of Emergency Management Capacity of Resilient Communities by the AHP-TOPSIS Method. Int. J. Environ. Res. Public Health 2022, 19, 16201. [Google Scholar] [CrossRef] [PubMed]
- Howari, H.; Parvez, M.; Khan, O.; Alhodaib, A.; Mallah, A.; Yahya, Z. Multi-Objective Optimization for Ranking Waste Biomass Materials Based on Performance and Emission Parameters in a Pyrolysis Process—An AHP–TOPSIS Approach. Sustainability 2023, 15, 3690. [Google Scholar] [CrossRef]
- Whitaker, R. Criticisms of the Analytic Hierarchy Process: Why they often make no sense. Math. Comput. Model. 2007, 46, 948–961. [Google Scholar] [CrossRef]
- Nolberto-Munier, E.H. Uses and Limitations of the AHP Method; Springer: Berlin/Heidelberg, Germany, 2021. [Google Scholar]
- Perraki, V.; Kounavis, P. Effect of temperature and radiation on the parameters of photovoltaic modules. J. Renew. Sustain. Energy 2016, 8, 013102. [Google Scholar] [CrossRef]
- Hasan, K.; Yousuf, S.B.; Tushar, M.S.H.K.; Das, B.K.; Das, P.; Islam, M.S. Effects of different environmental and operational factors on the PV performance: A comprehensive review. Energy Sci. Eng. 2022, 10, 656–675. [Google Scholar] [CrossRef]
- Photovoltaic Geographical Information System. Available online: https://re.jrc.ec.europa.eu/pvg_tools/es/ (accessed on 29 March 2024).
- IEC 61215:2022; Terrestrial Photovoltaic (PV) Modules-Design Qualification and Type Approval. International Electrotechnical Commission: Geneva, Switzerland, 2022.
- IEC 61427:2013; Secondary Cells and Batteries for Renewable Energy Storage-General Requirements and Methods of Test. International Electrotechnical Commission: Geneva, Switzerland, 2013.
- Mesquita, D.D.B.; de S. Silva, J.L.; Moreira, H.S.; Kitayama, M.; Villalva, M.G. A review and analysis of technologies applied in PV modules. In Proceedings of the 2019 IEEE PES Innovative Smart Grid Technologies Conference-Latin America (ISGT Latin America), Gramado, Brazil, 15–18 September 2019; pp. 1–6. [Google Scholar] [CrossRef]
- Benda, V.; Černá, L. PV cells and modules–State of the art, limits and trends. Heliyon 2020, 6, 1–8. [Google Scholar] [CrossRef] [PubMed]
- Oberbeck, L.; Alvino, K.; Goraya, B.; Jubault, M. IPVF’s PV technology vision for 2030. Prog. Photovolt. Res. Appl. 2020, 28, 1207–1214. [Google Scholar] [CrossRef]
- Esparcia, E.A.; Castro, M.T.; Odulio, C.M.F.; Ocon, J.D. A stochastic techno-economic comparison of generation-integrated long duration flywheel, lithium-ion battery, and lead-acid battery energy storage technologies for isolated microgrid applications. J. Energy Storage 2022, 52, 104681. [Google Scholar] [CrossRef]
- Carroquino, J.; Escriche-Martínez, C.; Valiño, L.; Dufo-López, R. Comparison of Economic Performance of Lead-Acid and Li-Ion Batteries in Standalone Photovoltaic Energy Systems. Appl. Sci. 2021, 11, 3587. [Google Scholar] [CrossRef]
- Dufo-López, R.; Cortés-Arcos, T.; Artal-Sevil, J.S.; Bernal-Agustín, J.L. Comparison of Lead-Acid and Li-Ion Batteries Lifetime Prediction Models in Stand-Alone Photovoltaic Systems. Appl. Sci. 2021, 11, 1099. [Google Scholar] [CrossRef]
- Saaty, T.L. The analytic hierarchy process (AHP). J. Oper. Res. Soc. 1980, 41, 1073–1076. [Google Scholar]
- García-Cascales, M.S. Métodos Para la Comparación de Alternativas Mediante un Sistema de Ayuda a la Decisión SAD y “Soft Computing”. Ph.D. Thesis, Universidad Politécnica de Cartagena, Cartagena, Spain, 2009. Available online: https://repositorio.upct.es/handle/10317/1022 (accessed on 26 March 2024).
- Aguarón, J.; Moreno-Jimenez, J. The geometric consistency index:Approximated thresholds. Eur. J. Oper. Res. 2003, 147, 137–145. [Google Scholar] [CrossRef]
- Wong, J.K.; Li, H. Application of the analytic hierarchy process (AHP) in multi-criteria analysis of the selection of intelligent building systems. Build. Environ. 2008, 43, 108–125. [Google Scholar] [CrossRef]
- Sánchez-Lozano, J.M. Búsqueda y Evaluación de Emplazamientos óptimos para Albergar Instalaciones de Energías Renovables en la Costa de la Región de Murcia: Combinación de Sistemas de Información Geográfica (SIG) y Soft Computing. Ph.D. Thesis, Universidad Politécnica de Cartagena, Cartagena, Spain, 2013. Available online: https://repositorio.upct.es/entities/publication/b170a069-8db9-493e-9d2f-9e0a3426154e (accessed on 26 March 2024).
- Forman, E.; Peniwati, K. Aggregating individual judgments and priorities with the analytic hierarchy process. Eur. J. Oper. Res. 1998, 108, 165–169. [Google Scholar] [CrossRef]
- Zeleny, M. Multiple Criteria Decision Making; McGra-Hill: New York City, NY, USA, 1982. [Google Scholar]
- Kasim, M.M.; Jemain, A.A. Performance of Entropy-Based Criteria Weights in Solving Multi-Criteria Problems. J. Phys. Conf. Ser. 2020, 1496, 012015. [Google Scholar] [CrossRef]
- Gorgij, A.D.; Kisi, O.; Moghaddam, A.A.; Taghipour, A. Groundwater quality ranking for drinking purposes, using the entropy method and the spatial autocorrelation index. Environ. Earth Sci. 2017, 76, 269. [Google Scholar] [CrossRef]
- Dong, G.; Shen, J.; Jia, Y.; Sun, F. Comprehensive Evaluation of Water Resource Security: Case Study from Luoyang City, China. Water 2018, 10, 1106. [Google Scholar] [CrossRef]
- Dasarathy, B. SMART: Similarity Measure Anchored Ranking Technique for the Analysis of Multidimensional Data Arrays. IEEE Trans. Syst. Man Cybern. 1976, SMC-6, 708–711. [Google Scholar] [CrossRef]
- Gil García, I.C. Integración del Recurso eólico Marino en los Sectores del Transporte y Climatización: Estudio de Transición Energética en la Costa este de EEUU. Ph.D. Thesis, Universidad Politécnica de Cartagena, Cartagena, Spain, 2020. Available online: https://repositorio.upct.es/handle/10317/9164 (accessed on 23 April 2024).
- Fernández, J.; Curt, M.; Aguado, P.; Esteban, B.; Sánchez, J.; Checa, M.; Romero, L. Caracterización de las Comarcas Agrarias de España. 2011. Available online: https://www.miteco.gob.es/content/dam/miteco/es/ministerio/servicios/publicaciones/TOMO%204%20Albacete%20primeras%20p%C3%A1ginas_tcm30-101352.pdf (accessed on 15 May 2024).
- Datos Climáticos y Meteorológicos Históricos Simulados para Chinchilla de Monte Aragón. Available online: https://www.meteoblue.com/es/tiempo/historyclimate/climatemodelled/chinchilla-de-monte-arag%c3%b3n_espa%c3%b1a_2519483 (accessed on 15 May 2024).
- Bahrami, A.; Okoye, C.O.; Atikol, U. Technical and economic assessment of fixed, single and dual-axis tracking PV panels in low latitude countries. Renew. Energy 2017, 113, 563–579. [Google Scholar] [CrossRef]
- Fazal, M.; Rubaiee, S. Progress of PV cell technology: Feasibility of building materials, cost, performance, and stability. Sol. Energy 2023, 258, 203–219. [Google Scholar] [CrossRef]
- Benda, V.; Cerna, L. A Note on Limits and Trends in PV Cells and Modules. Appl. Sci. 2022, 12, 3363. [Google Scholar] [CrossRef]
- Isabela, C.; Lameirinhas, R.A.M.; Torres, J.P.N.; Fernandes, C.A. Comparative study of the copper indium gallium selenide (CIGS) solar cell with other solar technologies. Sustain. Energy Fuels 2021, 5, 2273–2283. [Google Scholar] [CrossRef]
- Gu, W.; Ma, T.; Ahmed, S.; Zhang, Y.; Peng, J. A comprehensive review and outlook of bifacial photovoltaic (bPV) technology. Energy Convers. Manag. 2020, 223, 113283. [Google Scholar] [CrossRef]
- Fernández-Guillamón, A.; Gil-García, I.C.; Albertos López, I.; García Cascales, S. Comparativa de soluciones MCDM para determinar la ubicación óptima de una planta solar fotovoltaica de autoconsumo. In Proceedings of the 27th International Congress on Project Management and Engineering, Donostia-San Sebastián, Spain, 10–13 July 2023. [Google Scholar]
- CIGS Thin Film Solar Panels. Available online: https://solarbuy.com/solar-101/cigs-thin-film-solar-panels/ (accessed on 18 May 2024).


| Scale | Verbal Scale | Explanation |
|---|---|---|
| 1 | Equal importance | Two criteria contribute equally to the objective |
| 3 | Moderate importance | Experience and judgement favour one criterion over another |
| 5 | Strong importance | One criterion is strongly favoured |
| 7 | Very strong importance | One criterion is very dominant |
| 9 | Extreme importance | One criterion is favoured by at least one order of magnitude of difference |
| … | ||||
|---|---|---|---|---|
| … | ||||
| … | ||||
| … | ||||
| ⋮ | ⋮ | ⋮ | ⋱ | ⋮ |
| … |
| Technology | Reasons to Consider It | Commercial Module |
|---|---|---|
| Cadmium telluride | Has the potential to compete with crystalline silicon, with an efficiency of 18.6% [90] | First Solar FS-6440-P (440 Wp) |
| Mono crystalline | Projected to maintain its enduring role as the cornerstone of the industry [91] | Longi Solar LR5-54HPH-420M (430 Wp) |
| CIGS | CIGS cells minimise material wastage in production, nearly matching the efficiencies of conventional silicon-based PV modules, and yields equivalent output power [92] | Eterbright CIGS-3350A1 (335 Wp) |
| Bifacial | Increases the power output by 5–30%, by just increasing their initial costs up to 15.6% [93] | Axitec AXIbiperfect GL WB AC-430TGBL/108WB (430 Wp) |
| C1 | C2 | C3 | C4 | C5 | C6 | C7 | C8 | w | ||
|---|---|---|---|---|---|---|---|---|---|---|
| C1 | 1.00 | 3.00 | 3.00 | 1.00 | 5.00 | 1.00 | 1.00 | 1.00 | 1.683 | 0.095 |
| C2 | 0.33 | 1.00 | 3.00 | 1.00 | 5.00 | 1.00 | 3.00 | 1.00 | 1.397 | |
| C3 | 0.33 | 0.33 | 1.00 | 1.00 | 3.00 | 1.00 | 1.00 | 1.00 | 0.854 | |
| C4 | 1.00 | 1.00 | 1.00 | 1.00 | 3.00 | 1.00 | 1.00 | 1.00 | 1.082 | |
| C5 | 0.20 | 0.20 | 0.33 | 0.33 | 1.00 | 1.00 | 0.33 | 0.20 | 0.378 | |
| C6 | 1.00 | 1.00 | 1.00 | 1.00 | 1.00 | 1.00 | 3.00 | 1.00 | 1.156 | |
| C7 | 1.00 | 0.33 | 1.00 | 1.00 | 3.00 | 0.33 | 1.00 | 0.14 | 0.737 | |
| C8 | 1.00 | 1.00 | 1.00 | 1.00 | 5.00 | 1.00 | 7.00 | 1.00 | 1.632 |
| C1 | C2 | C3 | C4 | C5 | C6 | C7 | C8 | w | ||
|---|---|---|---|---|---|---|---|---|---|---|
| C1 | 1.00 | 5.00 | 1.00 | 3.00 | 0.33 | 5.00 | 1.00 | 0.20 | 0.974 | 0.099 |
| C2 | 0.20 | 1.00 | 1.00 | 3.00 | 0.20 | 1.00 | 0.33 | 0.14 | 0.397 | |
| C3 | 1.00 | 1.00 | 1.00 | 3.00 | 0.20 | 0.33 | 0.20 | 0.14 | 0.437 | |
| C4 | 0.33 | 0.33 | 0.33 | 1.00 | 0.20 | 1.00 | 0.33 | 0.14 | 0.285 | |
| C5 | 3.00 | 5.00 | 5.00 | 5.00 | 1.00 | 9.00 | 3.00 | 0.33 | 2.101 | |
| C6 | 0.20 | 1.00 | 3.00 | 1.00 | 0.11 | 1.00 | 0.20 | 0.11 | 0.371 | |
| C7 | 1.00 | 3.00 | 5.00 | 3.00 | 0.33 | 5.00 | 1.00 | 1.00 | 1.335 | |
| C8 | 5.00 | 7.00 | 7.00 | 7.00 | 3.00 | 9.00 | 1.00 | 1.00 | 2.973 |
| C1 | C2 | C3 | C4 | C5 | C6 | C7 | C8 | w | ||
|---|---|---|---|---|---|---|---|---|---|---|
| C1 | 1.00 | 1.00 | 1.00 | 1.00 | 7.00 | 1.00 | 3.00 | 5.00 | 1.501 | 0.047 |
| C2 | 1.00 | 1.00 | 1.00 | 1.00 | 5.00 | 3.00 | 5.00 | 5.00 | 1.725 | |
| C3 | 1.00 | 1.00 | 1.00 | 1.00 | 3.00 | 3.00 | 3.00 | 5.00 | 1.566 | |
| C4 | 1.00 | 1.00 | 1.00 | 1.00 | 3.00 | 3.00 | 5.00 | 3.00 | 1.554 | |
| C5 | 0.14 | 0.20 | 0.33 | 0.33 | 1.00 | 0.33 | 1.00 | 0.33 | 0.324 | |
| C6 | 1.00 | 0.33 | 0.33 | 0.33 | 3.00 | 1.00 | 5.00 | 3.00 | 0.949 | |
| C7 | 0.33 | 0.20 | 0.33 | 0.20 | 1.00 | 0.20 | 1.00 | 1.00 | 0.351 | |
| C8 | 0.20 | 0.20 | 0.20 | 0.33 | 3.00 | 0.33 | 1.00 | 1.00 | 0.416 |
| C1 (↑) | C2 (↑) | C3 (↑) | C4 (↓) | C5 (↑) | C6 (↑) | C7 (↑) | C8 (↓) | |
|---|---|---|---|---|---|---|---|---|
| A1 | 5942.81 | 38.89 | 2.12 | 0.71 | 0.50 | 6.70 | 0.00 | 1.76 |
| A2 | 5842.66 | 39.73 | 2.16 | 0.67 | 0.50 | 6.70 | 1.00 | 1.68 |
| A3 | 5616.82 | 40.78 | 2.22 | 0.73 | 0.50 | 6.70 | 1.00 | 1.90 |
| A4 | 6429.93 | 35.42 | 1.93 | 0.79 | 0.50 | 6.60 | 1.00 | 1.90 |
| A5 | 5944.88 | 38.94 | 2.12 | 0.71 | 1.00 | 15.00 | 0.00 | 1.42 |
| A6 | 5844.98 | 39.85 | 2.17 | 0.67 | 1.00 | 15.00 | 1.00 | 1.32 |
| A7 | 5619.05 | 40.88 | 2.22 | 0.73 | 1.00 | 15.00 | 1.00 | 1.54 |
| A8 | 6431.76 | 35.42 | 1.93 | 0.79 | 1.00 | 15.00 | 1.00 | 1.25 |
| AHP | Entropy | |||||||
|---|---|---|---|---|---|---|---|---|
| Ranking | Ranking | |||||||
| A1 | 0.05 | 0.03 | 0.35 | 8 | 0.27 | 0.03 | 0.10 | 8 |
| A2 | 0.03 | 0.04 | 0.58 | 4 | 0.05 | 0.27 | 0.86 | 6 |
| A3 | 0.04 | 0.05 | 0.57 | 5 | 0.04 | 0.27 | 0.86 | 4 |
| A4 | 0.04 | 0.05 | 0.57 | 6 | 0.04 | 0.27 | 0.86 | 5 |
| A5 | 0.04 | 0.03 | 0.43 | 7 | 0.27 | 0.05 | 0.14 | 7 |
| A6 | 0.03 | 0.05 | 0.64 | 2 | 0.03 | 0.27 | 0.89 | 2 |
| A7 | 0.02 | 0.05 | 0.69 | 1 | 0.02 | 0.27 | 0.93 | 1 |
| A8 | 0.03 | 0.05 | 0.61 | 3 | 0.04 | 0.27 | 0.88 | 3 |
Disclaimer/Publisher’s Note: The statements, opinions and data contained in all publications are solely those of the individual author(s) and contributor(s) and not of MDPI and/or the editor(s). MDPI and/or the editor(s) disclaim responsibility for any injury to people or property resulting from any ideas, methods, instructions or products referred to in the content. |
© 2024 by the authors. Licensee MDPI, Basel, Switzerland. This article is an open access article distributed under the terms and conditions of the Creative Commons Attribution (CC BY) license (https://creativecommons.org/licenses/by/4.0/).
Share and Cite
Serrano-Gomez, L.; Gil-García, I.C.; García-Cascales, M.S.; Fernández-Guillamón, A. Improving the Selection of PV Modules and Batteries for Off-Grid PV Installations Using a Decision Support System. Information 2024, 15, 380. https://doi.org/10.3390/info15070380
Serrano-Gomez L, Gil-García IC, García-Cascales MS, Fernández-Guillamón A. Improving the Selection of PV Modules and Batteries for Off-Grid PV Installations Using a Decision Support System. Information. 2024; 15(7):380. https://doi.org/10.3390/info15070380
Chicago/Turabian StyleSerrano-Gomez, Luis, Isabel C. Gil-García, M. Socorro García-Cascales, and Ana Fernández-Guillamón. 2024. "Improving the Selection of PV Modules and Batteries for Off-Grid PV Installations Using a Decision Support System" Information 15, no. 7: 380. https://doi.org/10.3390/info15070380
APA StyleSerrano-Gomez, L., Gil-García, I. C., García-Cascales, M. S., & Fernández-Guillamón, A. (2024). Improving the Selection of PV Modules and Batteries for Off-Grid PV Installations Using a Decision Support System. Information, 15(7), 380. https://doi.org/10.3390/info15070380


