


Automated Trace Clustering Pipeline Synthesis in Process Mining

 , , , and
Abstract
1. Introduction
- A new method for trace clustering pipeline synthesis based on AutoML.
- We present a state-of-the-art review of trace clustering and correlate it with the theoretical basic aspects of PM.
- We introduce the usage of a multi-objective function for trace clustering, based on combining clustering and process discovery metrics to improve clustering quality.
2. Related Work
3. Preliminaries
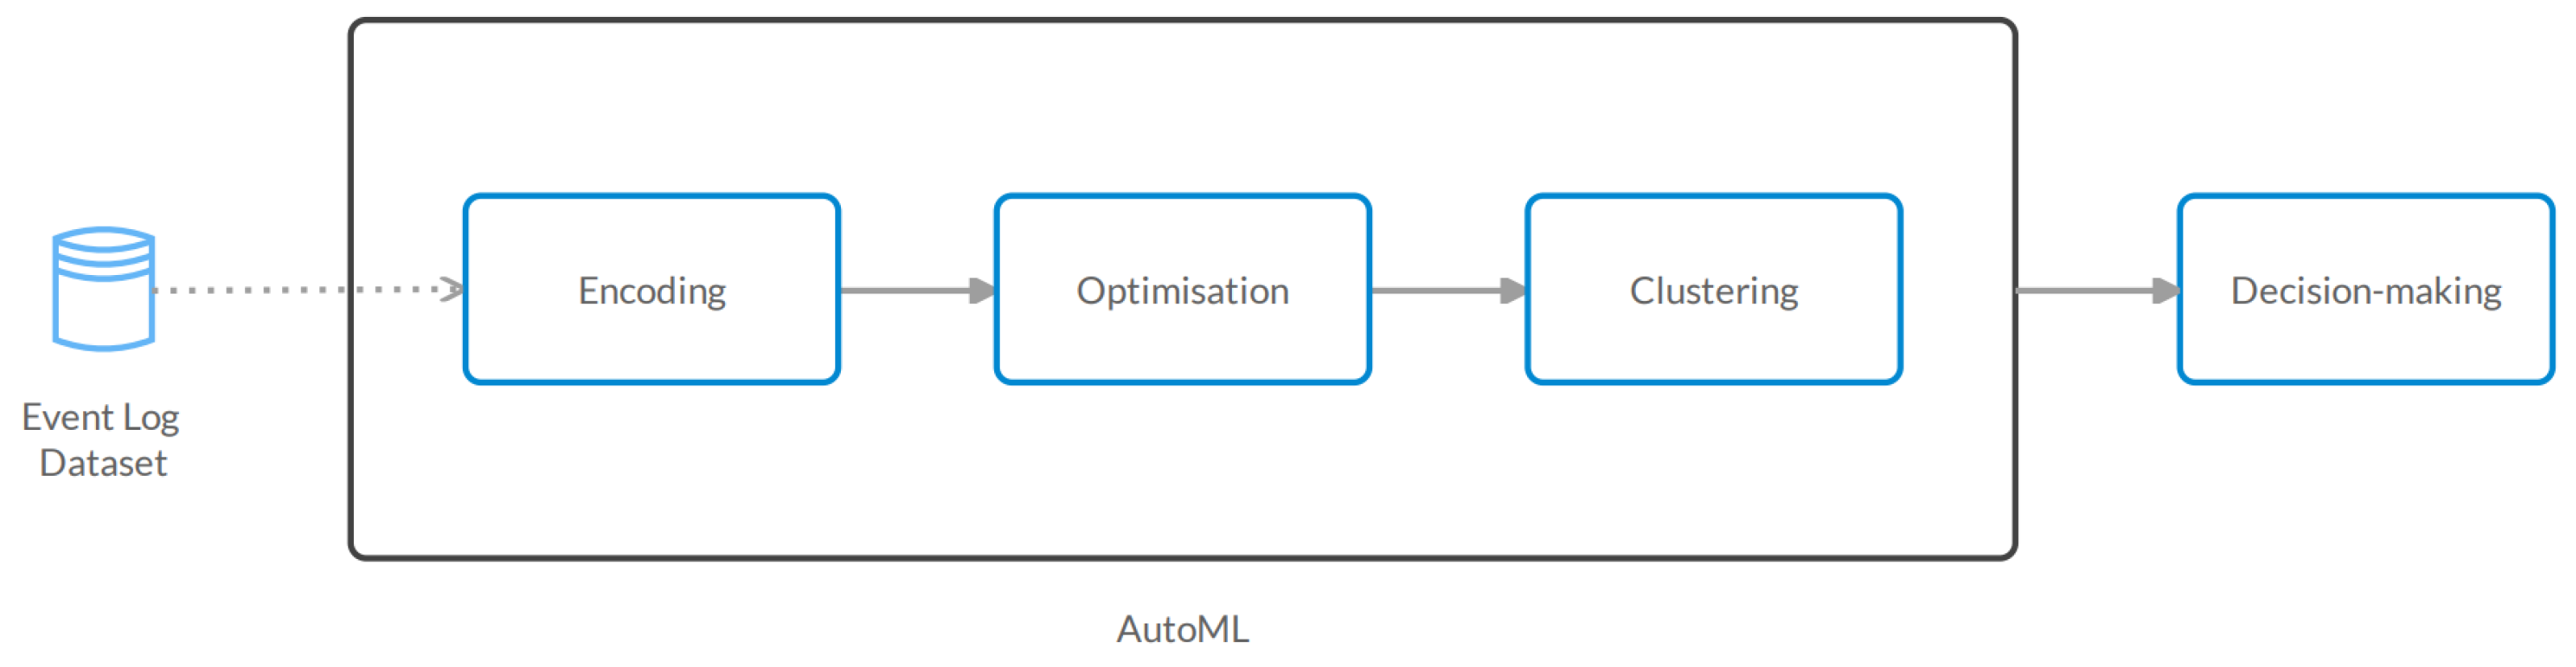
4. Materials and Methods
4.1. Dataset
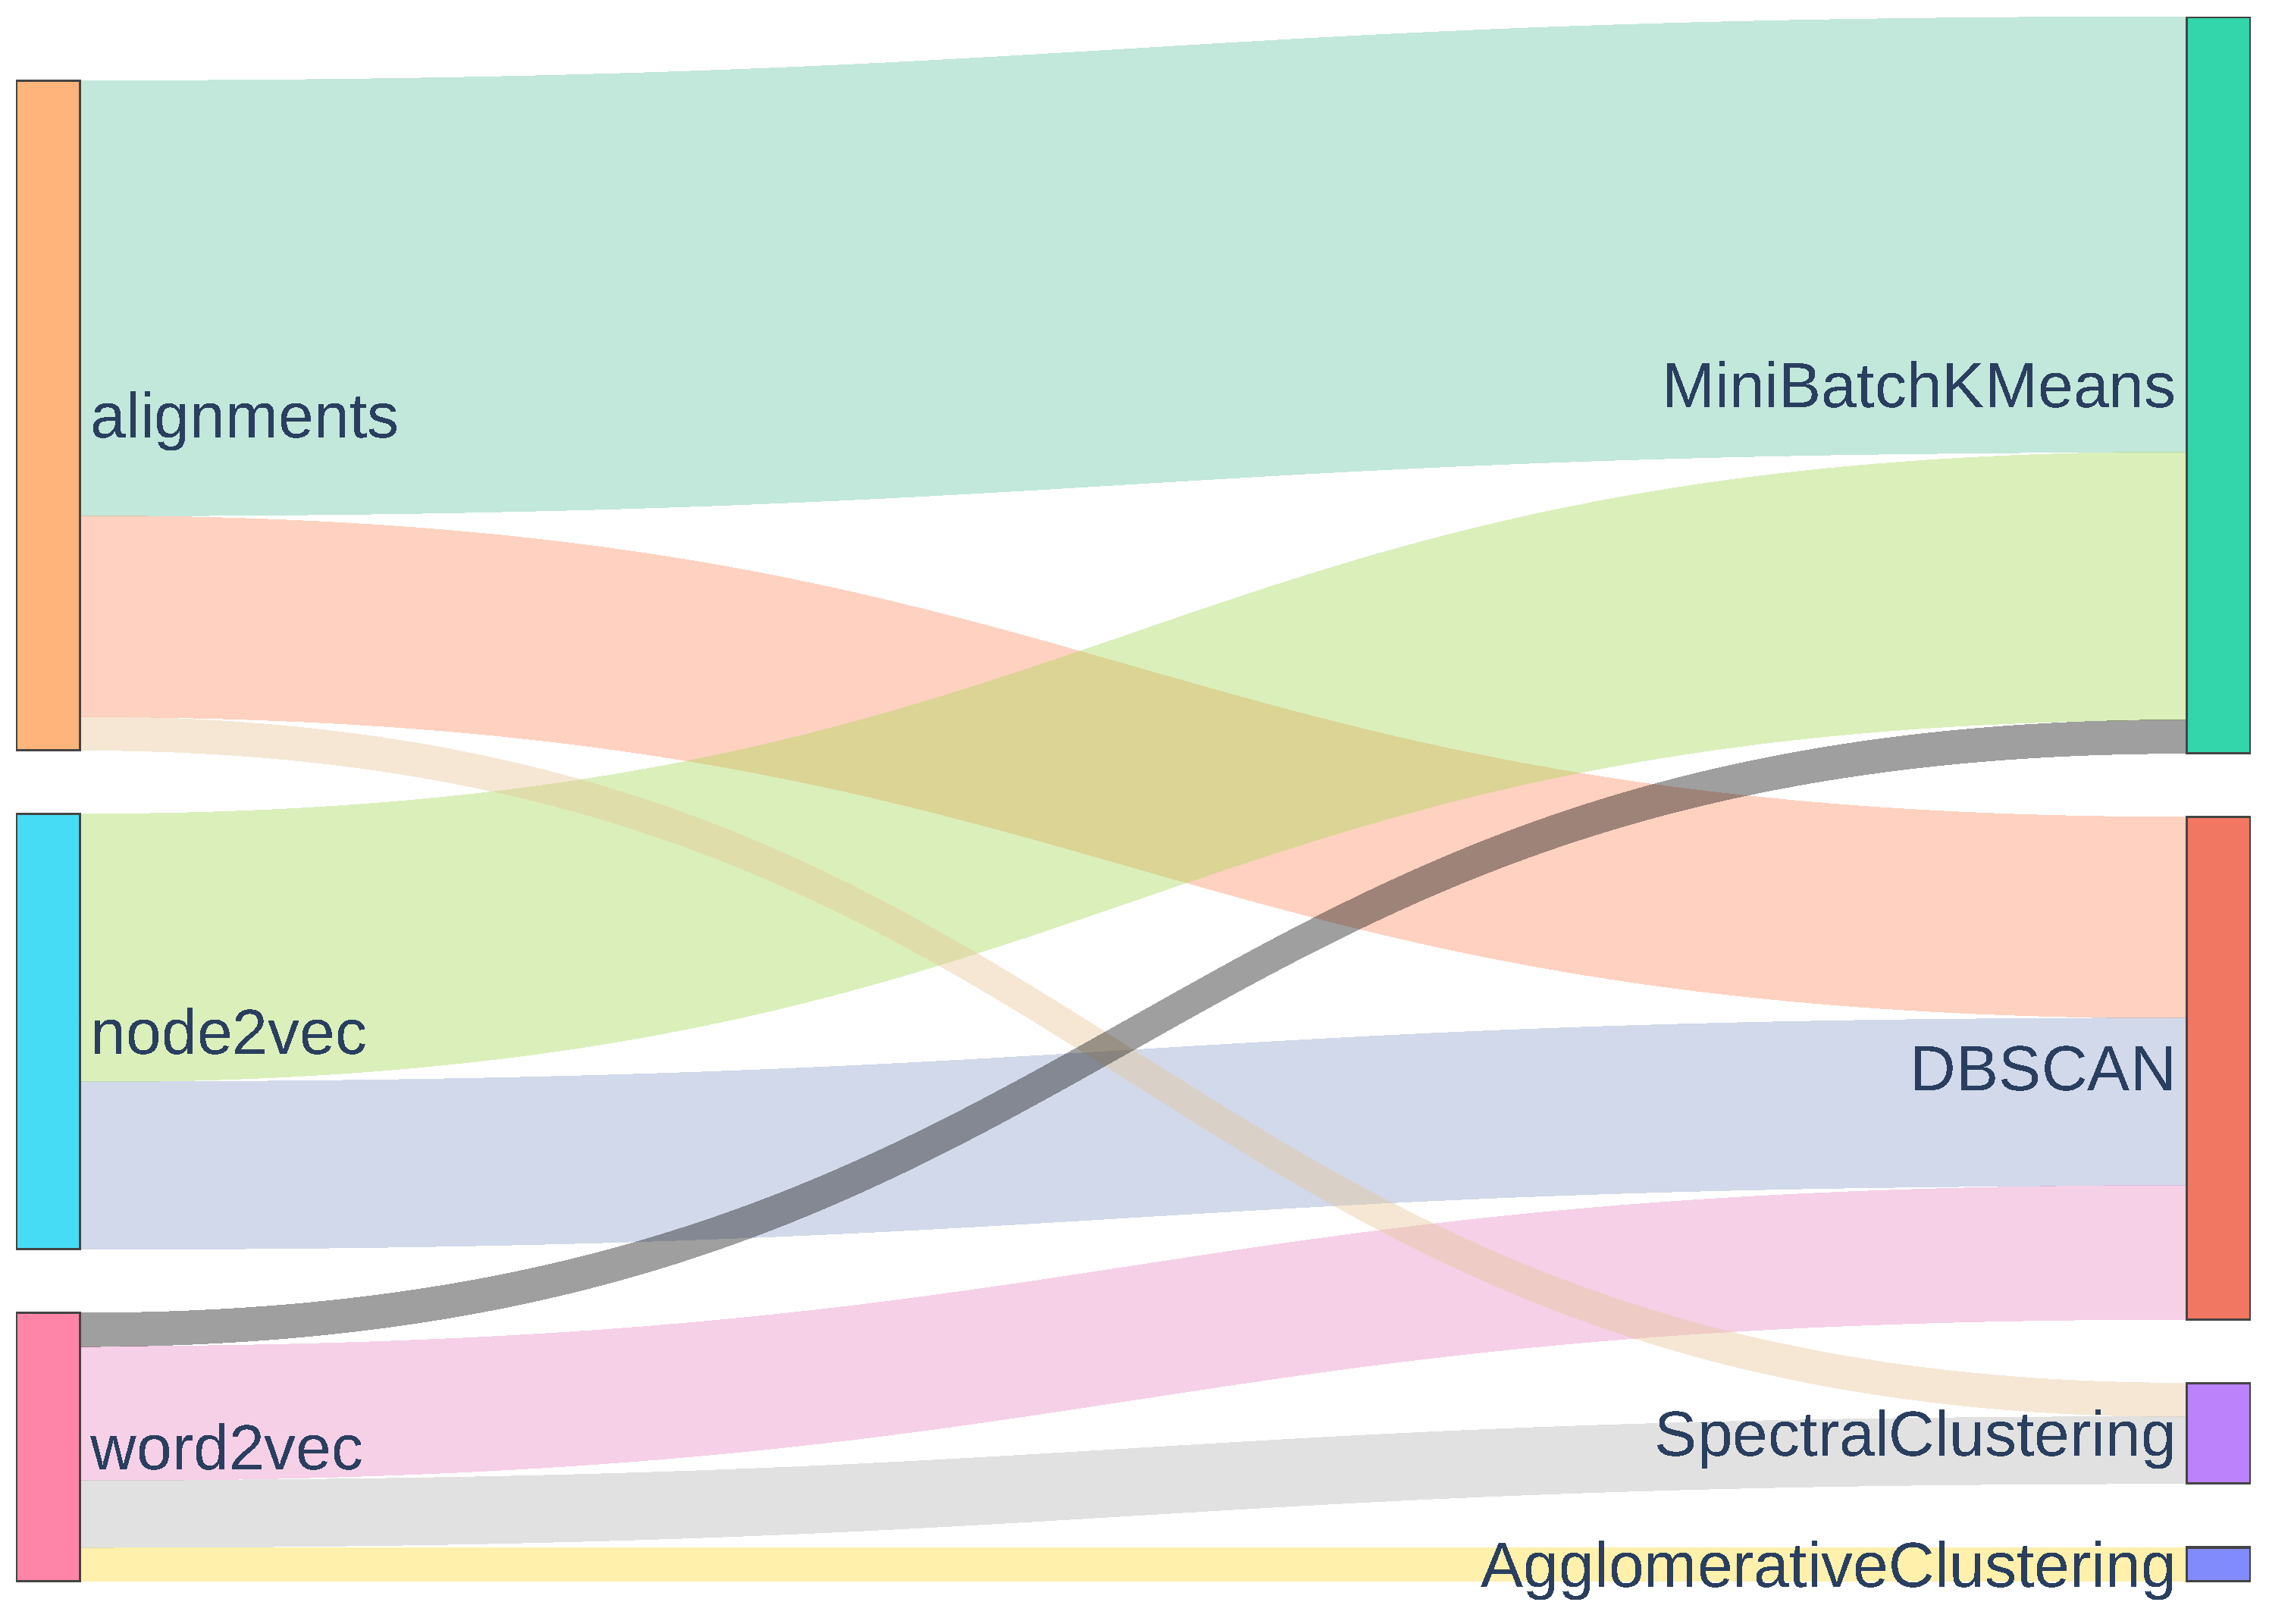
4.2. Encoding
4.3. Clustering
4.4. Optimization
4.5. Decision-Making
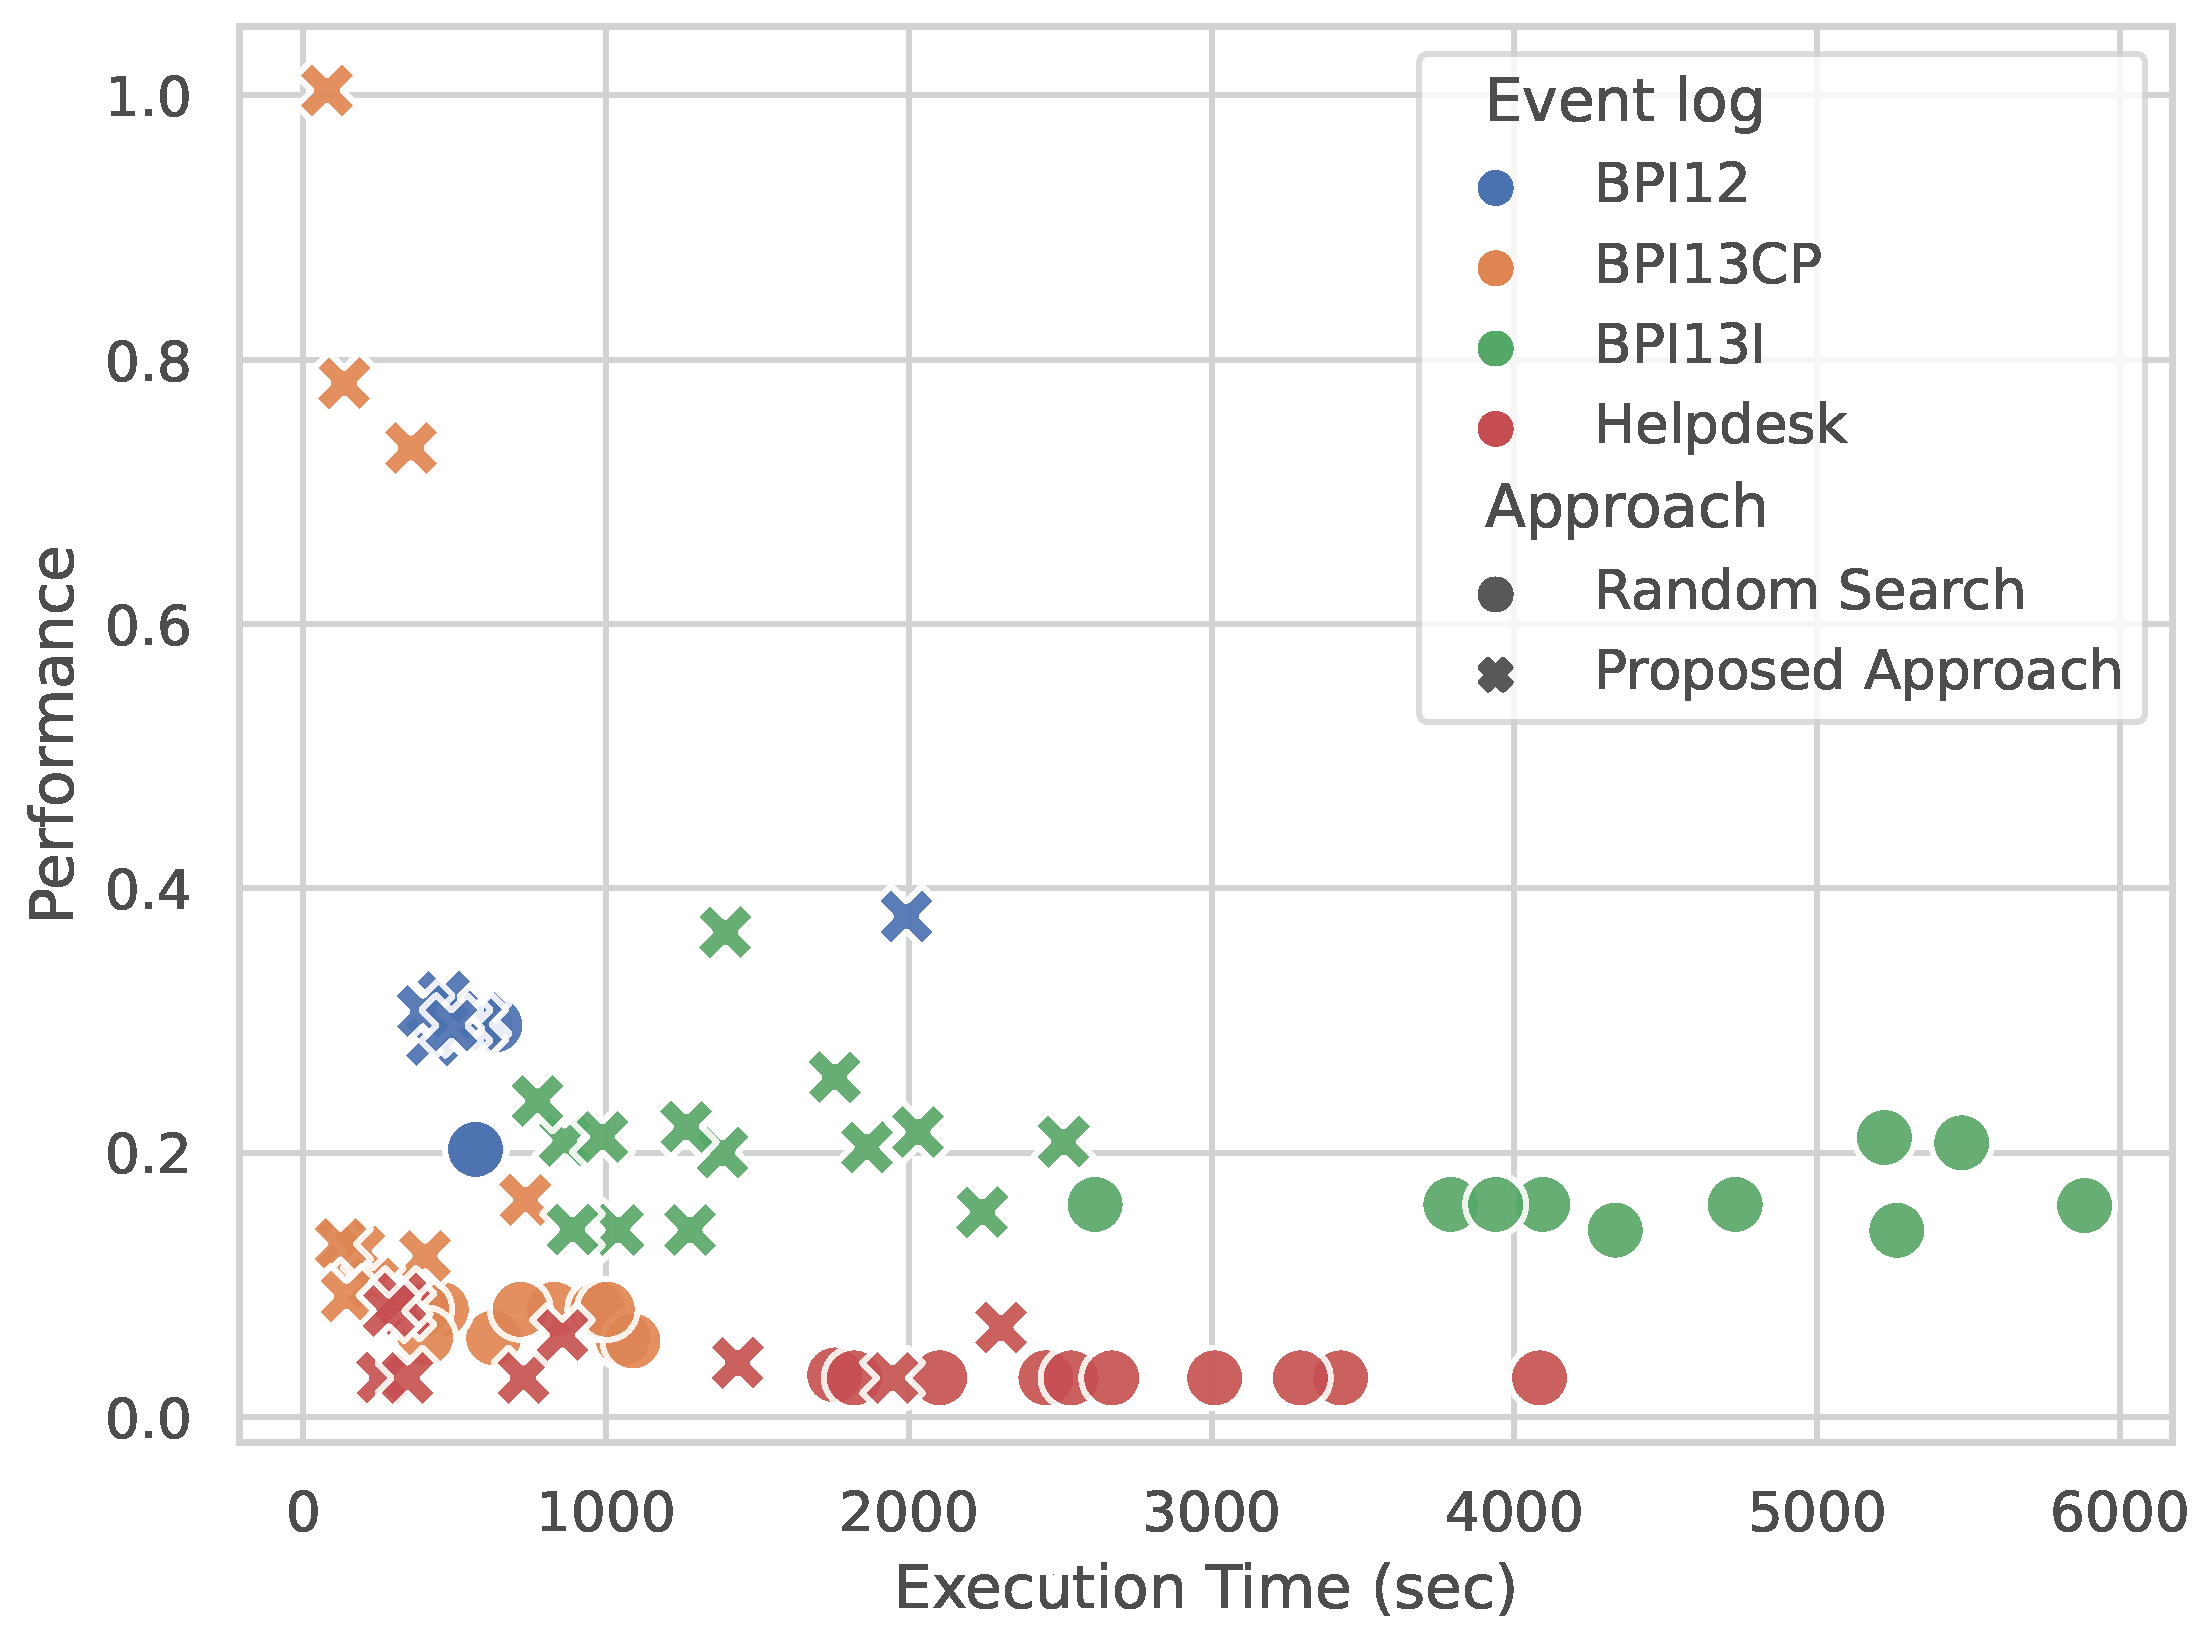
5. Results
- CPU: Intel Core i9-10980XE featuring 18 cores, 36 threads, and a maximum clock speed of 4.6 GHz.
- Memory: 62.5 GiB of RAM.
- Storage: Two SK Hynix PC801 NVMe 1TB drives.
- GPU: NVIDIA Quadro T1000 Mobile (TU117GLM).
- Operating System: Ubuntu 22.04.2 LTS (Jammy Jellyfish)
5.1. Process Mining Perspective
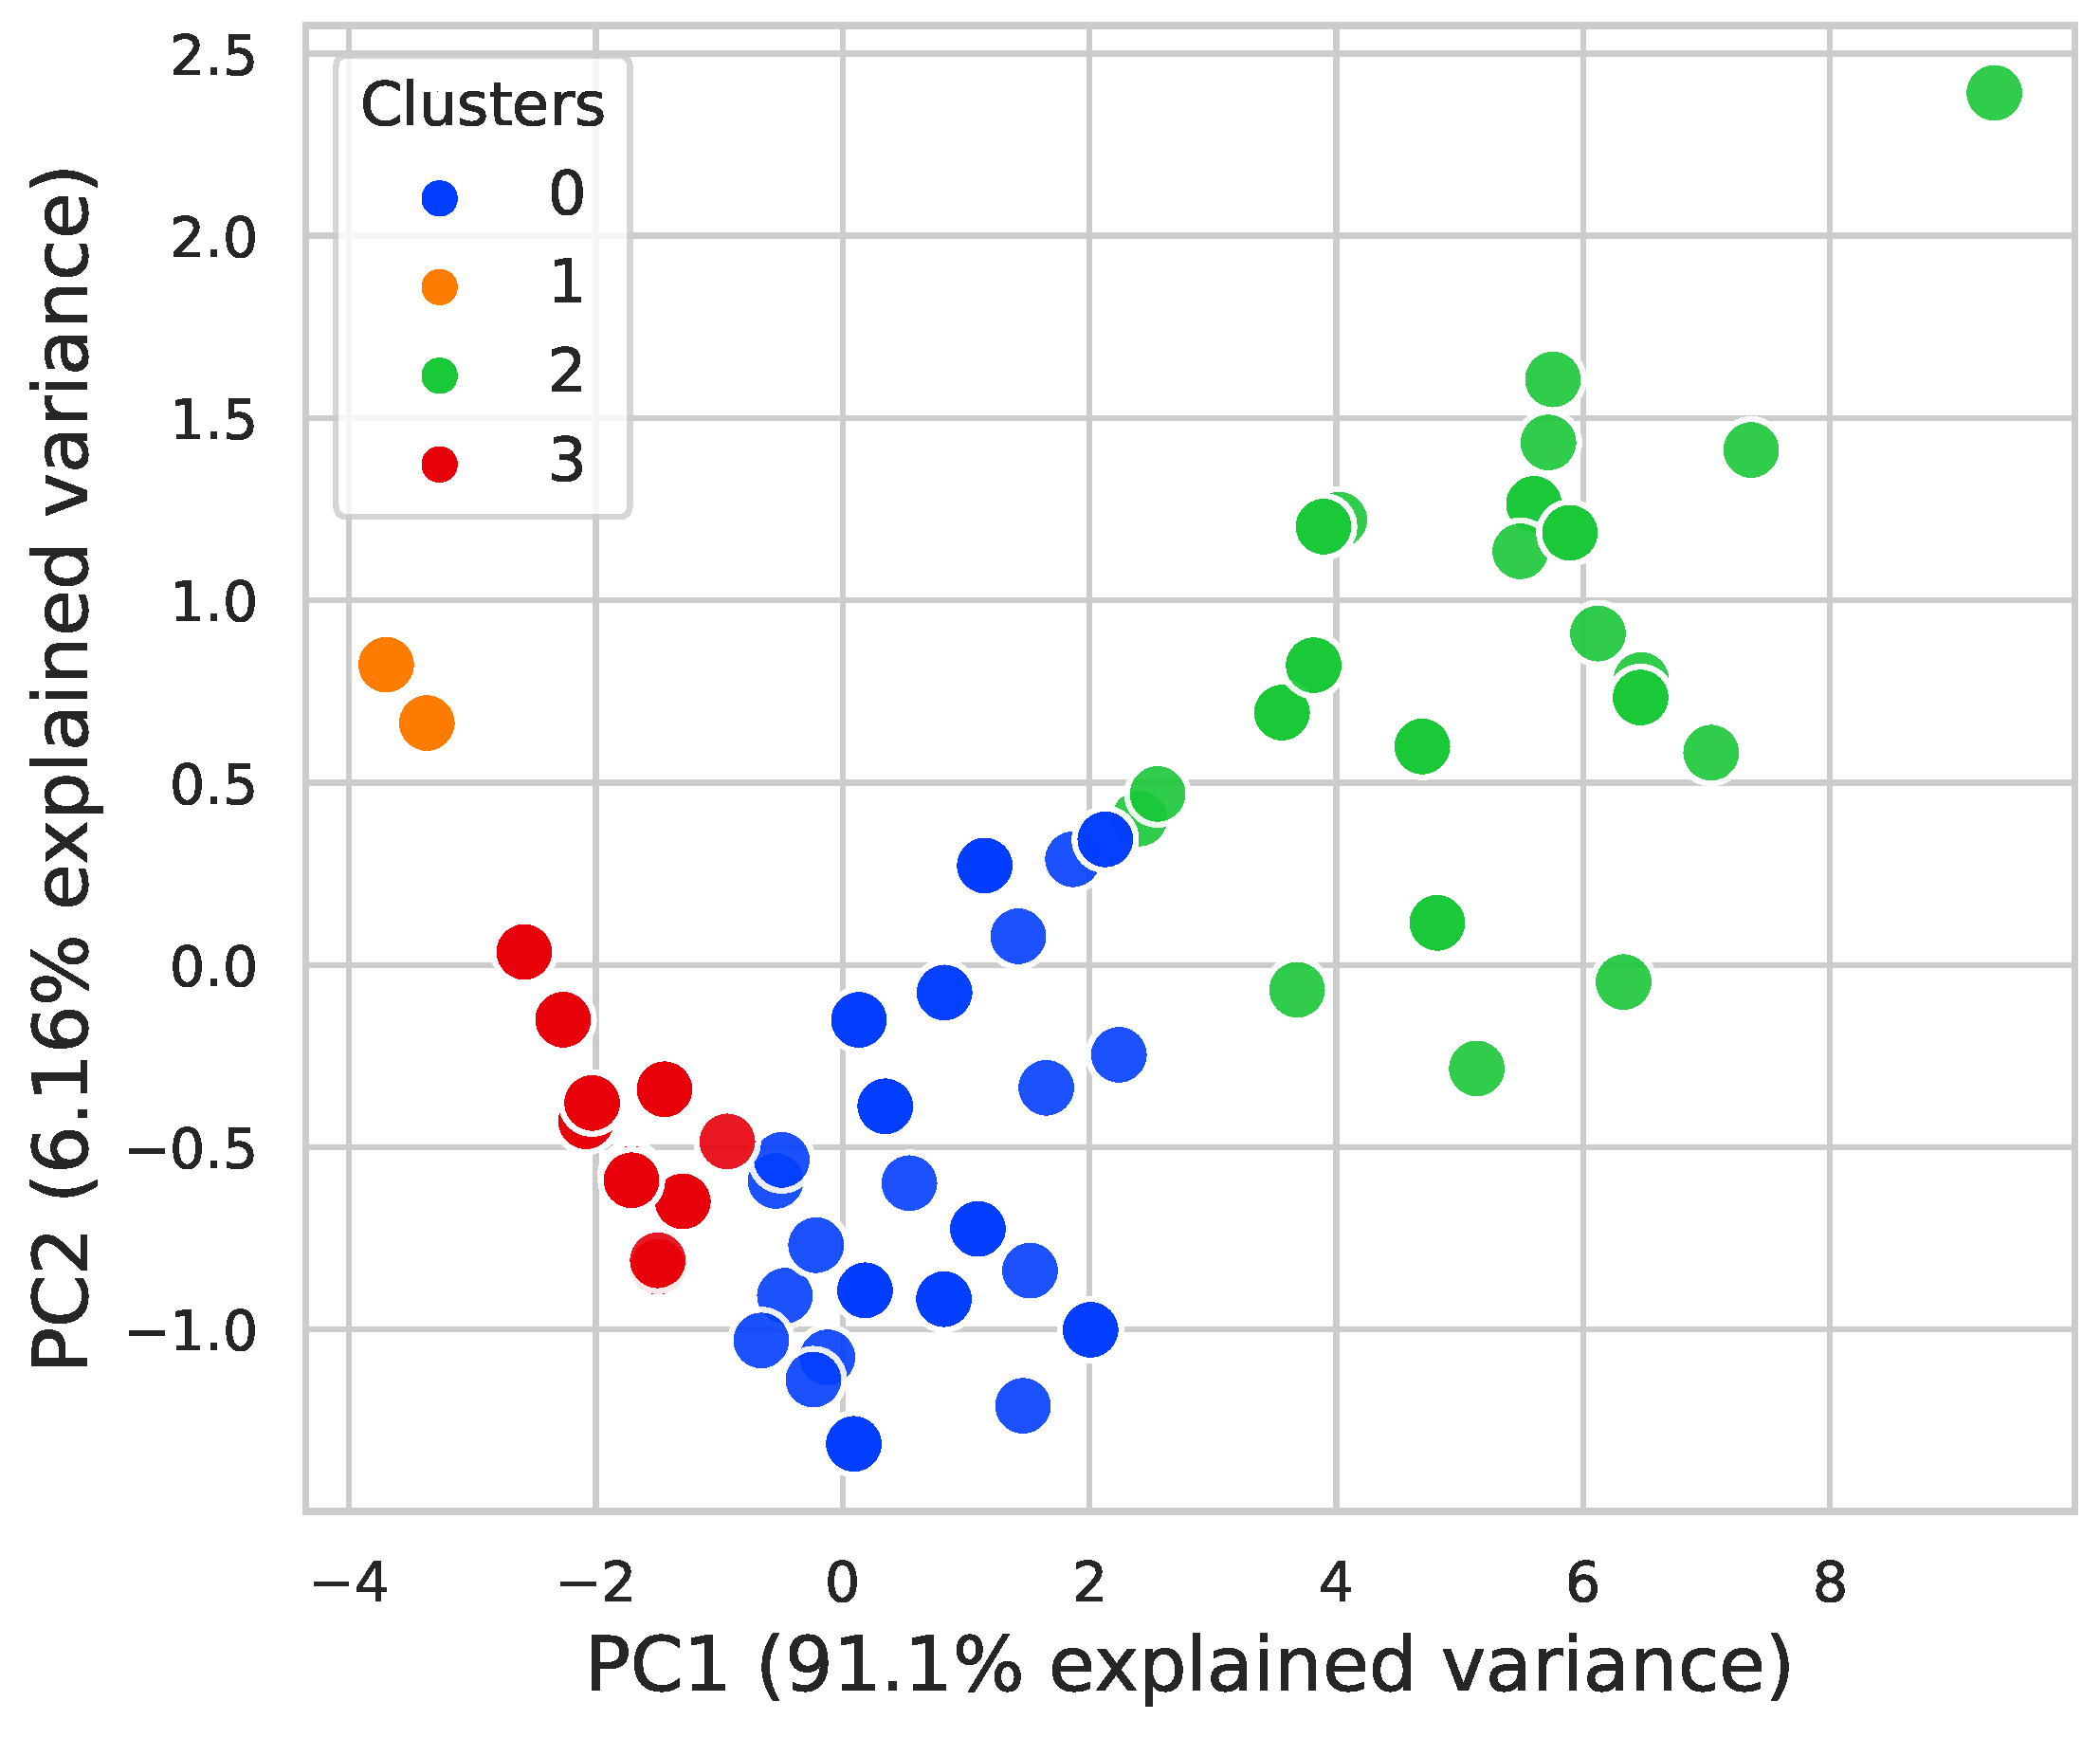
5.2. Data Mining Perspective
6. Discussion and Limitations
7. Conclusions
Author Contributions
Funding
Institutional Review Board Statement
Informed Consent Statement
Data Availability Statement
Conflicts of Interest
References
- van der Aalst, W.M. Business Process Management: A Comprehensive Survey. ISRN Softw. Eng. 2013, 2013, 507984. [Google Scholar] [CrossRef]
- Martin, N.; Fischer, D.A.; Kerpedzhiev, G.D.; Goel, K.; Leemans, S.J.J.; Röglinger, M.; van der Aalst, W.M.P.; Dumas, M.; La Rosa, M.; Wynn, M.T. Opportunities and Challenges for Process Mining in Organizations: Results of a Delphi Study. Bus. Inf. Syst. Eng. 2021, 63, 511–527. [Google Scholar] [CrossRef]
- van der Aalst, W.M.P.; Carmona, J. Process Mining Handbook; Springer: Berlin/Heidelberg, Germany, 2022. [Google Scholar]
- Tavares, G.M.; Barbon Junior, S.; Damiani, E.; Ceravolo, P. Selecting Optimal Trace Clustering Pipelines with Meta-learning. In Proceedings of the Intelligent Systems; Xavier-Junior, J.C., Rios, R.A., Eds.; Springer International Publishing: Cham, Switzerland, 2022; pp. 150–164. [Google Scholar]
- Neubauer, T.R.; Pamponet Sobrinho, G.; Fantinato, M.; Peres, S.M. Visualization for enabling human-in-the-loop in trace clustering-based process mining tasks. In Proceedings of the 2021 IEEE International Conference on Big Data (Big Data), Orlando, FL, USA, 15–18 December 2021; pp. 3548–3556. [Google Scholar] [CrossRef]
- Olson, R.S.; Bartley, N.; Urbanowicz, R.J.; Moore, J.H. Evaluation of a Tree-based Pipeline Optimization Tool for Automating Data Science. In Proceedings of the Genetic and Evolutionary Computation Conference 2016, New York, NY, USA, 20–24 July 2016; pp. 485–492. [Google Scholar] [CrossRef]
- James, G.; Witten, D.; Hastie, T.; Tibshirani, R. An Introduction to Statistical Learning; Springer: Berlin/Heidelberg, Germany, 2013; Volume 112. [Google Scholar]
- Tavares, G.M.; Junior, S.B.; Damiani, E. Automating process discovery through meta-learning. In Proceedings of the International Conference on Cooperative Information Systems, Bozen-Bolzano, Italy, 4–7 October 2022; Springer: Berlin/Heidelberg, Germany, 2022; pp. 205–222. [Google Scholar]
- Hutter, F.; Kotthoff, L.; Vanschoren, J. Automated Machine Learning: Methods, Systems, Challenges; Springer Nature: Berlin/Heidelberg, Germany, 2019. [Google Scholar]
- De Koninck, P.; De Weerdt, J.; vanden Broucke, S.K.L.M. Explaining clusterings of process instances. Data Min. Knowl. Discov. 2017, 31, 774–808. [Google Scholar] [CrossRef]
- Bose, R.P.J.C.; van der Aalst, W.M. Context Aware Trace Clustering: Towards Improving Process Mining Results. In Proceedings of the 2009 SIAM International Conference on Data Mining (SDM), Sparks, NV, USA, 30 April–2 May 2009; pp. 401–412. [Google Scholar] [CrossRef]
- Greco, G.; Guzzo, A.; Pontieri, L.; Sacca, D. Discovering expressive process models by clustering log traces. IEEE Trans. Knowl. Data Eng. 2006, 18, 1010–1027. [Google Scholar] [CrossRef]
- Song, M.; Günther, C.W.; van der Aalst, W.M.P. Trace Clustering in Process Mining. In Proceedings of the Business Process Management Workshops; Ardagna, D., Mecella, M., Yang, J., Eds.; Springer: Berlin/Heidelberg, Germany, 2009; pp. 109–120. [Google Scholar]
- Bui, H.-N.; Tri-Thanh Nguyen, T.C.N.; Ha, Q.T. A New Trace Clustering Algorithm Based on Context in Process Mining. In Lecture Notes in Computer Science; Springer International Publishing: Cham, Switzerland, 2018; Volume 11103. [Google Scholar] [CrossRef]
- Boltenhagen, M.; Chatain, T.; Carmona, J. Generalized Alignment-Based Trace Clustering of Process Behavior. In Lecture Notes in Computer Science; Springer International Publishing: Cham, Switzerland, 2019; Volume 11522. [Google Scholar] [CrossRef]
- Jablonski, S.; Röglinger, M.; Schönig, S.; Wyrtki, K.M. Multi-Perspective clustering of process execution traces. Enterp. Model. Inf. Syst. Archit. (Emisaj) Int. J. Concept. Model. 2019, 14. [Google Scholar] [CrossRef]
- Fani Sani, M.; Boltenhagen, M.; van der Aalst, W. Prototype Selection Using Clustering and Conformance Metrics for Process Discovery. In Proceedings of the Business Process Management Workshops; Del Río Ortega, A., Leopold, H., Santoro, F.M., Eds.; Springer International Publishing: Cham, Switzerland, 2020; pp. 281–294. [Google Scholar]
- de Medeiros, A.K.A.; Guzzo, A.; Greco, G.; van der Aalst, W.M.P.; Weijters, A.J.M.M.; van Dongen, B.F.; Saccà, D. Process Mining Based on Clustering: A Quest for Precision. In Proceedings of the Business Process Management Workshops; ter Hofstede, A., Benatallah, B., Paik, H.Y., Eds.; Springer: Berlin/Heidelberg, Germany, 2008; pp. 17–29. [Google Scholar]
- Delias, P.; Doumpos, M.; Grigoroudis, E.; Manolitzas, P.; Matsatsinis, N. Supporting healthcare management decisions via robust clustering of event logs. Knowl.-Based Syst. 2015, 84, 203–213. [Google Scholar] [CrossRef]
- Lakshmi Narayana, N.; Jagadishwari, V. Trace Clustering Techniques for Process Mining. In Proceedings of the 2023 Third International Conference on Advances in Electrical, Computing, Communication and Sustainable Technologies (ICAECT), Bhilai, India, 5–6 January 2023; pp. 1–6. [Google Scholar] [CrossRef]
- De Koninck, P.; Nelissen, K.; vanden Broucke, S.; Baesens, B.; Snoeck, M.; De Weerdt, J. Expert-driven trace clustering with instance-level constraints. Knowl. Inf. Syst. 2021, 63, 1197–1220. [Google Scholar] [CrossRef]
- Thornton, C.; Hutter, F.; Hoos, H.H.; Leyton-Brown, K. Auto-WEKA: Combined selection and hyperparameter optimization of classification algorithms. In Proceedings of the 19th ACM SIGKDD International Conference on Knowledge Discovery and Data Mining, New York, NY, USA, 11–14 August 2013. [Google Scholar]
- Feurer, M.; Klein, A.; Eggensperger, K.; Springenberg, J.; Blum, M.; Hutter, F. Efficient and robust automated machine learning. Adv. Neural Inf. Process. Syst. 2015, 28, 2962–2970. [Google Scholar]
- Chen, B.; Wu, H.; Mo, W.; Chattopadhyay, I.; Lipson, H. Autostacker: A compositional evolutionary learning system. In Proceedings of the Genetic and Evolutionary Computation Conference, New York, NY, USA, 15–19 July 2018; pp. 402–409. [Google Scholar]
- van der Aalst, W.M.P. Process Mining: A 360 Degree Overview. In Lecture Notes in Business Information Processing; Springer International Publishing: Cham, Switzerland, 2022; Volume 448. [Google Scholar]
- Tavares, G.M.; Barbon Junior, S. Matching business process behavior with encoding techniques via meta-learning: An anomaly detection study. Comput. Sci. Inf. Syst. 2023, 20, 1207–1233. [Google Scholar] [CrossRef]
- ElShawi, R.; Sakr, S. TPE-AutoClust: A Tree-based Pipline Ensemble Framework for Automated Clustering. In Proceedings of the 2022 IEEE International Conference on Data Mining Workshops (ICDMW), Orlando, FL, USA, 28 November–1 December 2022; pp. 1144–1153. [Google Scholar] [CrossRef]
- Fu, W.; Olson, R.; Nathan; Jena, G.; PGijsbers; Augspurger, T.; Romano, J.; Saha, P.; Shah, S.; Raschka, S.; et al. EpistasisLab/tpot: V0.11.5. 2020. Available online: https://zenodo.org/records/3872281 (accessed on 17 March 2024).
- De Koninck, P.; vanden Broucke, S.; De Weerdt, J. act2vec, trace2vec, log2vec, and model2vec: Representation Learning for Business Processes. In Proceedings of the Business Process Management; Weske, M., Montali, M., Weber, I., vom Brocke, J., Eds.; Springer International Publishing: Cham, Switzerland, 2018; pp. 305–321. [Google Scholar]
- Polato, M.; Sperduti, A.; Burattin, A.; Leoni, M.d. Time and activity sequence prediction of business process instances. Computing 2018, 100, 1005–1031. [Google Scholar] [CrossRef]
- Barbon Junior, S.; Ceravolo, P.; Damiani, E.; Marques Tavares, G. Evaluating Trace Encoding Methods in Process Mining. In Proceedings of the From Data to Models and Back; Bowles, J., Broccia, G., Nanni, M., Eds.; Springer International Publishing: Cham, Switzerland, 2021; pp. 174–189. [Google Scholar]
- Tavares, G.M.; Oyamada, R.S.; Junior, S.B.; Ceravolo, P. Trace encoding in process mining: A survey and benchmarking. Eng. Appl. Artif. Intell. 2023, 126, 107028. [Google Scholar] [CrossRef]
- Weiss, S.M.; Indurkhya, N.; Zhang, T. Fundamentals of Predictive Text Mining, 2nd ed.; Texts in Computer Science; Springer: Berlin/Heidelberg, Germany, 2015. [Google Scholar] [CrossRef]
- Rozinat, A.; van der Aalst, W. Conformance checking of processes based on monitoring real behavior. Inf. Syst. 2008, 33, 64–95. [Google Scholar] [CrossRef]
- Grover, A.; Leskovec, J. Node2vec: Scalable Feature Learning for Networks. In Proceedings of the 22nd ACM SIGKDD International Conference on Knowledge Discovery and Data Mining, New York, NY, USA, 13–17 August 2016; pp. 855–864. [Google Scholar] [CrossRef]
- Buitinck, L.; Louppe, G.; Blondel, M.; Pedregosa, F.; Mueller, A.; Grisel, O.; Niculae, V.; Prettenhofer, P.; Gramfort, A.; Grobler, J.; et al. API design for machine learning software: Experiences from the scikit-learn project. In Proceedings of the ECML PKDD Workshop: Languages for Data Mining and Machine Learning, Prague, Czech Republic, 23–27 September 2013; pp. 108–122. [Google Scholar]
- Xu, R.; Wunsch, D. Survey of clustering algorithms. IEEE Trans. Neural Netw. 2005, 16, 645–678. [Google Scholar] [CrossRef] [PubMed]
- Rousseeuw, P.J. Silhouettes: A graphical aid to the interpretation and validation of cluster analysis. J. Comput. Appl. Math. 1987, 20, 53–65. [Google Scholar] [CrossRef]
- Augusto, A.; Mendling, J.; Vidgof, M.; Wurm, B. The connection between process complexity of event sequences and models discovered by process mining. Inf. Sci. 2022, 598, 196–215. [Google Scholar] [CrossRef]


| Logs | #Cases | #Events | #Activities | Trace Length | #Variants |
|---|---|---|---|---|---|
| BPI12 | 1854 | 39,330 | 24 | 3–130 | 834 |
| BPI13CP | 1487 | 6660 | 4 | 1–35 | 183 |
| BPI13I | 7554 | 65,533 | 4 | 1–123 | 1551 |
| Helpdesk | 4580 | 21,348 | 14 | 2–15 | 226 |
| Log | BPI12 | BPI13CP | BPI13I | Helpdesk |
|---|---|---|---|---|
| Fitness | 0.93 | 0.99 | 0.99 | 0.73 |
| Precision | 0.37 | 0.93 | 0.94 | 0.94 |
| Entropy | 0.44 | 0.31 | 0.40 | 0.25 |
| Number of Clusters | 98 | 25 | 92 | 226 |
| Clustered Fitness (I) | 0.95 (2%) | 0.96 (−3%) | 0.68 (−30%) | 0.99 (26%) |
| Clustered Precision (I) | 0.66 (29%) | 0.86 (−6%) | 0.55 (−39%) | 0.95 (1%) |
| Clustered Entropy (I) | 0.18 (26%) | 0.15 (16%) | 0.14 (27%) | 0.02 (24%) |
Disclaimer/Publisher’s Note: The statements, opinions and data contained in all publications are solely those of the individual author(s) and contributor(s) and not of MDPI and/or the editor(s). MDPI and/or the editor(s) disclaim responsibility for any injury to people or property resulting from any ideas, methods, instructions or products referred to in the content. |
© 2024 by the authors. Licensee MDPI, Basel, Switzerland. This article is an open access article distributed under the terms and conditions of the Creative Commons Attribution (CC BY) license (https://creativecommons.org/licenses/by/4.0/).
Share and Cite
Grigore, I.M.; Tavares, G.M.; Silva, M.C.d.; Ceravolo, P.; Barbon Junior, S. Automated Trace Clustering Pipeline Synthesis in Process Mining. Information 2024, 15, 241. https://doi.org/10.3390/info15040241
Grigore IM, Tavares GM, Silva MCd, Ceravolo P, Barbon Junior S. Automated Trace Clustering Pipeline Synthesis in Process Mining. Information. 2024; 15(4):241. https://doi.org/10.3390/info15040241
Chicago/Turabian StyleGrigore, Iuliana Malina, Gabriel Marques Tavares, Matheus Camilo da Silva, Paolo Ceravolo, and Sylvio Barbon Junior. 2024. "Automated Trace Clustering Pipeline Synthesis in Process Mining" Information 15, no. 4: 241. https://doi.org/10.3390/info15040241
APA StyleGrigore, I. M., Tavares, G. M., Silva, M. C. d., Ceravolo, P., & Barbon Junior, S. (2024). Automated Trace Clustering Pipeline Synthesis in Process Mining. Information, 15(4), 241. https://doi.org/10.3390/info15040241