Abstract
The increase in the size and complexity of large knowledge graphs now available online has resulted in the emergence of many approaches focusing on enabling the quick exploration of the content of those data sources. Structural non-quotient semantic summaries have been proposed in this direction that involve first selecting the most important nodes and then linking them, trying to extract the most useful subgraph out of the original graph. However, the current state of the art systems use costly centrality measures for identifying the most important nodes, whereas even costlier procedures have been devised for linking the selected nodes. In this paper, we address both those deficiencies by first exploiting embeddings for node selection, and then by meticulously selecting approximate algorithms for node linking. Experiments performed over two real-world big KGs demonstrate that the summaries constructed using our method enjoy better quality. Specifically, the coverage scores obtained were 0.8, 0.81, and 0.81 for DBpedia v3.9 and 0.94 for Wikidata dump 2018, across 20%, 25%, and 30% summary sizes, respectively. Additionally, our method can compute orders of magnitude faster than the state of the art.
1. Introduction
The proliferation of the semantic web has led to the creation of vast and complex RDF knowledge graphs (KGs), posing new requirements for their exploration and understanding. Summarizing semantic knowledge graphs is widely acknowledged as a potent technique for enhancing understanding, facilitating exploration, and reusing the information contained within. Structural techniques rely on the structure of the graph to produce a summary and can be further classified into quotient (where sets of nodes are grouped using equivalence relations) and non-quotient (where subgraphs are extracted out of the original graph) [1]. A structural, non-quotient semantic summary serves the purpose of capturing the essence of the original graph by highlighting its most important elements while concurrently reducing the graph’s size and complexity.
The Problem. Previous approaches in the domain of structural non-quotient semantic summaries [2,3,4,5,6,7,8], in order to generate a summary, first exploited a single or a combination of centrality measures (e.g., betweenness, HITS, PageRank) for selecting the most significant nodes and then employed shortest-path or Steiner Tree approximation procedures in order to link them. However, both computing those centrality measures and linking the selected nodes is costly and infeasible for graphs with millions or even billions of nodes and edges. Existing solutions carefully try to avoid tackling this problem by focusing on summarizing only the schema/ontology part of a KG, limiting, in most cases, the problem to at most 1000 nodes. To the best of our knowledge, no structural non-quotient semantic summarization solution is currently able to work directly on the entire KG.
Motivating Example. Consider, for example, Wikidata, a large RDF KG that includes millions of entities and billions of statements. Understanding and exploring such a complex graph raises several challenges, as the graph is complex and contains numerous nodes and edges. One approach that could help users is identifying the most important nodes and edges in the form of graphical summaries, providing users with a quick understanding of the graph’s main points. Additionally, users could fine-tune the size of the summary based on a desired percentage, such as 20%, 25%, and 30%, of the original Wikidata graph (see Figure 1), thereby enabling them to explore various granularities of the returned summaries.
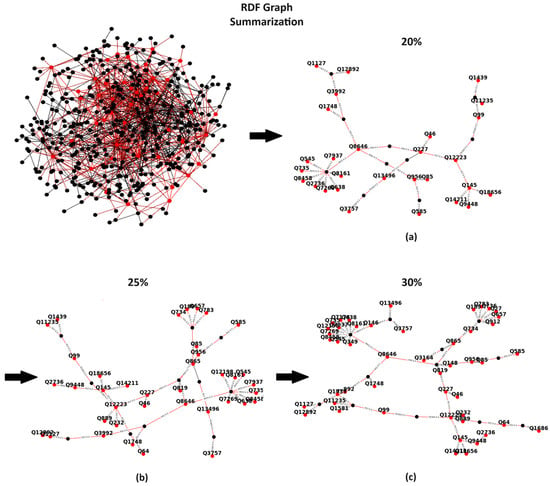
Figure 1.
The Wikidata dump 2018 graph and the corresponding summaries of 20% (a), 25% (b), and 30% (c) of the original graph.
Our solution. In this paper, we focus on optimizing both efficiency and effectiveness for generating high-quality semantic summaries out of a KG. We argue that using node and property embeddings, beyond being more efficient than calculating centralities, has the potential to provide a more objective view of characterizing the nodes and edges that should be selected as the most important ones. In this direction, we explore machine learning (ML) models, which can be trained to assign weights to the various nodes, identifying as such the most important nodes through their embedding vectors. Using the same process, we also add weights to the various edges. Then, having selected the most important nodes, we attempt to capture the optimal paths for connecting the important nodes. Similar to previous approaches in the domain, we encounter the challenge of connecting significant nodes, akin to a Steiner Tree Problem. However, we carefully select the corresponding approximate algorithm, adopting a more efficient Steiner Tree approximate algorithm. Further, we consider also the weights in the edges, ignored in previous approaches, in order to be more effective. More specifically, our contributions in this paper are the following:
- We use RDF2Vec [9,10], a prominent approach for efficiently generating embeddings for the nodes and edges of a KG. We explore several walking strategies for generating embeddings (Random, Anonymous, Walklet, HALK, N-Grams) to identify the optimal one for our problem.
- Then, we model the problem of selecting the top-k most important nodes as a regression problem. For each node, we use the low-dimensional vector representation generated by RDF2VEC to train models that maximize the quality of the generated summary. We examine five ML regressors (i.e., Adaboost, Gradient Boosting, SVR, Random Forests, and Decision Trees), identifying the best performances.
- We show that the problem for linking the selected nodes is NP-hard and explore Steiner Tree approximations. We identify that little details make a difference in practice and adopt the SDISTG, a previously ignored approximation algorithm. In addition, instead of being oblivious in the selection of the importance of the edges for linking the top-k nodes, assuming that they all have the same value, we use the same process (identifying embeddings and adding weights to the using ML-models) in order to select the most prominent ones.
- Furthermore, we present a detailed experimental analysis using two real-world KGs, DBpedia and Wikidata, verifying that selecting the most important nodes using embeddings is both more effective and more efficient, whereas this holds also for our Steiner Tree optimizations, overall constructing summaries of better quality and being more efficient than the existing state-of-the-art systems.
To the best of our knowledge, our approach is the first to adopt embeddings for generating scalable, high-quality, structural non-quotient semantic summaries that are directly applicable to big KGs. The remainder of the paper is structured as follows: Section 2 presents related work, Section 3 introduces preliminaries, Section 4 presents the methodology and the various algorithms generated for the creation of our structural semantic summaries, and, in Section 5, we experimentally evaluate our solution. Finally, Section 6 concludes this paper and reports directions for the future.
2. Related Work
Embeddings in KGs. In graph-based knowledge representation, embeddings have already been widely used. For example, they have been used for predicting entity types [11], for entity classification [12], for question answering on top of KGs [13], and for selecting consistent subsets out of inconsistent ontologies [14]. In the summarization field, embeddings have also been used for generating summaries for specific entities in a KG [15], as well as for generating quotient summaries that are exploited for lossy query answering through similarity-embedding-based similarity searches [16]. However, all those approaches differ in both the objectives and approach to our work. To the best of our knowledge, we are the first to exploit embeddings for generating structural, non-quotient semantic summaries that extract a subgraph with the most important nodes and edges out of the whole KG.
Structural, non-quotient semantic summaries. In our work, we focus on non-quotient structural-semantic summaries, where we extract subgraphs from the original graph to highlight its most important elements (nodes and properties), making it more suitable for exploration and understanding. Quotient summaries [17], on the other hand, involve grouping nodes in the original graph based on an equivalence relation and then constructing a new graph where each node represents an equivalence class. The edges in the quotient graph connect these equivalence classes based on the relationships between the original nodes. In the domain of structural, non-quotient semantic summarization, there are already multiple approaches available.
Early approaches in the domain include Peroni et al. [3] and Wu et al. [7], who only focused on selecting the top-k nodes. Subsequently, Zhang et al. [8] utilized various centrality measures, like eigenvectors, betweenness, and degrees, attempting to capture the most vital sentences in a KG. Then, Queiroz-Sousa et al. [18], in order to assess the node significance, exploited user preferences along with closeness and degree centrality measures. Following this, for the construction of the final graph, an algorithm is employed that contains the dominant nodes in order to link them. However, the developed algorithm chooses to give precedence to direct neighbors, disregarding the fact that other nodes which are not direct neighbors might be more important and could produce a summary with an overall greater importance.
WBSum [19] and iSummary [20] attempt to detect the more frequent nodes through user queries exploiting the query workloads. Afterward, the Steiner Tree approximation is exploited to link these nodes. The GLIMPSE [21] approach concentrates on the personalized summary generation of a KG that includes only the facts more related to individuals’ interests. However, for the summary construction, the user needs to supply a related set of queries with corresponding information that they would like to be included. Furthermore, WBSum, iSummar, and GLIMPSE rely on an existing workload to produce a summary, which restrains their applicability.
The most recent works in the domain include RDFDigest+ [2,6] and SumMER [4,5], outperforming previous approaches in the domain. RDFDigest+ exploits the betweenness centrality combined with the number of instances for the selection of schema nodes and then links them with an approximation of the Steiner Tree. SumMER, on the other hand, employs several centrality measures (i.e., betweenness, degree, radiality, etc.) and combines them, exploiting machine learning techniques to improve the quality of the selected nodes. As computing centralities measures is costly, both RDFDigest+ and SumMER provide schema summaries focusing only on the schema/ontology part of the KG. Furthermore, both these approaches ignore the importance of the edges to be used for linking the selected nodes and adopt Steiner Tree approximations focusing on introducing as few as possible additional nodes for linking the selected top-k nodes. In this paper, we argue that embeddings have the potential to better-characterize KG nodes and provide a more efficient alternative than centralities with better quality as well. Further, we also consider the importance of the edges that are being selected for linking the top-k nodes, whereas we carefully select the optimal Steiner Tree approximation that makes our solution applicable to large KGs with billions of triples.
3. Preliminaries
In our work, we emphasize RDF KGs, as RDF is considered as one of the most prevalent standards for publishing and representing data on the Web, being endorsed by the W3C for semantic web applications. An RDF KG includes triples in the form (s, p, o). Each triple asserts a relationship where a subject s connects with a property p, with the value of that property represented by the object o. We exclusively examine triples that adhere to the specifications outlined in the RDF standard by the W3C. Let U represent a set of Uniform Resource Identifiers (URIs), L denote a set of typed/untyped literals (constants), and B signify a set of blank nodes (unknown URIs/literals) (U, B, and L are mutually disjointed). Blank nodes comprise vital elements in RDF, facilitating the support of unknown URI or literal tokens. Furthermore, let T denote the set of RDF terms, defined as T = U ∪ B ∪ L. An RDF triple (s, p, o) belongs to (U ∪ B) × U × T. In addition, an RDF KG can be alternatively seen as a graph G = (V, E), where V are the nodes of the graph (including s and o) and E is the edges (including p).
Unfortunately, given the large size and complexity of a KG, users face considerable difficulties in understanding the contents of the KG and exploring it. A condensed view of the KG presenting the most important nodes and edges of the whole graph would be rather useful for the end users, and, as already explained in the related work section, several works have already focused on this important problem.
Example. Consider now an RDF KG like the Wikidata (dump 2018), which is presented in Figure 1. Comprehending the graph’s contents is a challenge given the abundance of nodes and edges within the Wikidata knowledge graph. Nevertheless, having a mechanism that assists us in concentrating on the most crucial subgraph, which includes a specific percentage of important nodes (indicatively we list the percentages of 20%, 25%, and 30%), would enable us to obtain a quick overview of the contents of the KG.
4. Semantic Summaries
As shown in the example of Figure 1, to generate a summary with the most important nodes, we need a method to be able to assess the nodes’ and edges’ importance in order to select the top-k nodes and then to link them, selecting the edges with the maximum weight. As such, without loss of generality, we can assume a weighting function w that returns a non-negative weight assignment to the nodes and edges of a KG G. Then, a structural non-quotient semantic summary of size k (referred to as a semantic summary from here on) can be defined as follows:
Definition 1.
(Semantic Summary of size k). Given an input KG G = (V, E) and a positive weight applied to all nodes and edges, a semantic summary of size k, i.e., SGk, is the smallest maximum-weight tree SGk = (SV, SE), including the k nodes with the maximum weight.
Note that our definition differs from previous approaches by considering weighted edges as well. A semantic summary of size k is not necessarily unique, as there can exist multiple maximum-weight trees of minimal size. Further, it is easy to demonstrate that the aforementioned problem is NP-complete.
Theorem 1.
The construction of a semantic summary is NP-complete.
Proof.
The Steiner Tree problem [22] involves connecting specific nodes within a weighted graph while minimizing the overall cost. In our work, we transform weight application to a range from 0 to 1 and subtract them from 1. Thus, instead of seeking a maximum-weight tree, our objective becomes identifying a minimum-weight tree. Consequently, our problem mirrors the NP-completeness of the Steiner Tree problem. □
A positive characteristic of the semantic summaries is that their quality shows a consistently increasing pattern as κ, the summary size, increases. In other words, as the size of the summary increases, so does the total weight of the summary.
Lemma 1.
Let SGk and SGk+1 be two semantic summaries of size k and k + 1, respectively. Then, W(SGk+1) ≥ W(SGk), where W(SG) is the sum of all node and edge weights in SG.
Proof.
As SGk represents a maximum-weight tree of size k, the introduction of a new node to the summary, as well as the subsequent search for the maximum-weight tree along with this node, ensures that the total weight of SGk+1 will be either equal to or greater than the total weight of SGk. □
Next, we focus on presenting how we approach node selection and linking. An overview is shown in Figure 2. In the first step, we extract numeric vectors (embed-dings) for all nodes and edges of the graph. We input these embeddings as features in ML models for regression, and the ML models can predict the weights of the edges and the nodes in the graph. In the second step, we select the top-k nodes with the highest weights. The third step focuses on linking the selected nodes using an appropriate approximation algorithm for resolving the Steiner Tree problem. In the sequel, we describe each one of these steps in detail.
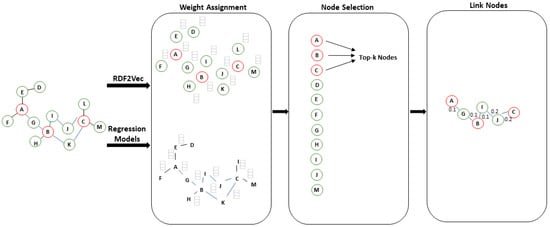
Figure 2.
Procedure for constructing embeddings-based summaries.
4.1. Weight Assignment and Node Selection
Past approaches for selecting the most important nodes of a KG exploit a single centrality measure (e.g., RDFDigest+ [2,6]) or a combination of several of them (e.g., SumMER [4,5]) in order to rank the graph nodes and to select the most important ones. However, as we shall show, in the experimental section, that even if approximations algorithms are used, computing centrality measures do not scale and more efficient approaches are required.
While traditional centrality measures, such as betweenness centrality, are commonly used for node weight assignment in graphs, our proposed approach adopts a regression task based on embeddings, offering an alternative perspective on identifying node importance. The rationale behind selecting this method is its capability to capture both the structural and semantic information of nodes. By training machine learning models on these embeddings, we can effectively predict and rank nodes and edges based on their scores (weights) within the graph. Unlike centrality measures, which focus solely on structural positioning, our approach enables us to identify nodes that hold key semantic relationships and have pivotal roles within the graph structure.
In our approach, we choose the RDF2vec [9,10], an unsupervised technique for feature extraction (embeddings), for nodes as well for edges, that has been proposed in several domains (e.g., Semantic Web, Bioinformatics, Social Net-works) and for various purposes (e.g., Semantic Similarity, Link Prediction, Recommendation Systems, Entity Classification) for RDF graphs. Embeddings aim to encode the semantic information mainly for entities; however, in our case, RDF2Vec is applied for properties too. Based on RDF2Vec, our main assumption is that resources with similar embeddings are semantically correlated as well. Therefore, we assume that resources of a “similar importance” are placed close to each other in the numerical space. RDF2Vec imitates the Word2Vec model, but instead of word sequences, it trains the neural network with entities. In this paper, the skip-gram model is selected, which aims to predict the context words based on a single target word. In a sequence of words, w1, w2, ..., wT, this objective can be defined as the average log probability:
where c is the size of a training context window and P(wt+j|wt) is computed by the softmax formula:
where is the word target vector, is the word context vector, and W is the size of the vocabulary.
In order to extract the sequences (of nodes/properties) for a neural network, and to generate our embeddings, we tested different walking strategies, such as the Random, Hierarchical Walking, Walklet, N-Grams, and Anonymous Walk [10]. The complexities of all aforementioned walking strategies are shown in Table 1.

Table 1.
The complexity of the various walking strategies, where W(n) is the number of walks per node, WL is the length of each walk, E is the total number of edges, MaxL(HO) represents the maximum length of higher-order transitions, and C is the number of different context sizes.
Having an embedding for all nodes and edges of the KG, we model next the problem of identifying their weights as a regression problem. The features of each node/edge is a numerical vector of various values that contain semantic information, such as the relationships between entities, neighborhood information, dimensionality, etc. In the domain, neural networks for graphs with embeddings as features, such as Graph Neural Networks (GNNs), have been extensively utilized to compute edge, vertex, or triple scores. However, we employ various regressors to compute nodes and edge scores. The rationale behind this choice lies in that regressors, like Decision Trees, which were identified as the best performers for nodes score in our approach offer transparent decision-making processes, enabling a clear understanding of the factors influencing the ranking of entities and properties. Furthermore, the current approach produces simplicity, notable computational efficacy, and minimum requirement of hyperparameter tuning compared to neural networks on graphs. We examine the following five ML regression algorithms for this purpose: Adaboost (AB), Gradient Boosting (GB), Support Vector Regressor (SVR), Random Forests (RF), and Decision Trees (DT). All algorithms demonstrate high efficiency during testing. The complexities of these algorithms are outlined in Table 2. It’s important to note that these complexities vary based on several factors, including the number of features, samples, number of trees, and tree depth, e.g., for Random Forest), the number of support vectors (SVR), etc.

Table 2.
The complexity of algorithms (n the number of samples, p the number of features, ntrees the number of trees).
4.2. Linking Selected Nodes
As we have shown in Theorem 1, linking the top-k nodes with the highest weight is equivalent to resolving the Steiner Tree problem, which is NP-complete. Hakimi [22] and Levin [23] proposed optimal algorithm; however, they have an exponential running time. As such, various approximations have been proposed, with the most known ones being MST, SDISTG, and CHINS [24], which we re-implemented from scratch for this work.
The first method identifies a minimum spanning tree (MST) within the graph. It links the selected nodes using paths derived from the MST and subsequently removes leaf nodes that are not in use. Well-known algorithms for identifying the MST include Kruskal and Prim, which we explore in this paper. The MST effectively identifies the tree within the entire graph that contains the minimum weights, incorporating the top-k nodes. This approach aims to minimize the total weight of the subgraph by including the essential nodes and edges.
The next method (SDIST) begins implementing MST, identifying the minimum spanning tree (applying Prim or Kruskal) for linking the top-k nodes considering the weighted edges. Subsequently, each edge of the MST is replaced by its shortest path (using Dijkstra), to have an as-much-as-minimum-weight weighted tree.
The last method (CHINS) is an incremental method that starts with a single node in the solution and gradually adds the nearest nodes in the top-k. An overview of the three algorithms is shown in the following:
MST (Improvement procedure over the minimum spanning tree)
- Let T = (Vt, Et) be a feasible solution for the GSTP. The subgraph of G, induced by Vt, will be defined as Gt.
- Construct a minimum spanning tree T = (Vt′, Et′) of Gt.
- While there exists a leaf of T′ being a terminal, do delete that leaf and its incident edge.
SDIST (Shortest distance graph)
- Construct a complete graph G′ for the top-k node set, with each edge having the weight of a shortest path between the corresponding nodes in G.
- Construct a minimum spanning tree T′ of G′.
- Replace each edge of the tree T′ with its corresponding shortest path in G.
CHINS (Cheapest insertion)
- Start with a partial solution T = (w, 0) consisting of a single node w in top-k.
- While T does not contain all, terminal nodes do.
- Find the nearest nodes u∗ ∈ Vt and p∗ being a terminal node not in Vt.
Complexities. Table 3 presents the worst-case complexities of those algorithms for weighted graphs. Note that, although the table shows the worst-case complexities for the various approximations, when looking at the average-case complexities, we can identify that it is for CHINS and for MST and SDIGST, which in essence tells us that the latter two approximations are faster on average.

Table 3.
Worst-case complexities for linking the most important nodes in a graph.
5. Evaluation
Our approach has been implemented in Python and is available online (https://anonymous.4open.science/r/embedding_based_summaries-2743 (accessed on 26 March 2024)). Next, we present, in detail, the methodology for our experimental evaluation and the datasets used.
Datasets. For our experiments, we use two versions of two real-world KGs, DBpedia and Wikidata. We use the first version of each dataset for training and we evaluate summary generation on the second version of each dataset.
DBpedia v3.8 contains 3.77 million entities with 400 million facts, and DBpedia v3.9, contains 4 million entities with 470 million facts. The dataset requires 103 GB of storage for v3.8 and 114 GB for v3.9. The v3.9 of DBpedia lacks samples from v3.8 because it underwent a major update, resulting in various modifications, such as the deletion of existing triples or updates, as well as the addition of new ones.
Wikidata is a free and open knowledge base that can be read and edited by both humans and machines. Wikidata dump 2017 contains 35 million items and 2.6 billion statements. The dataset occupies 139 GB. Wikidata dump 2018 contains 47 million items and 4 billion statements. The dataset occupies 313 GB.
Despite the aforementioned DBpedia and Wikidata not being the latest versions, they have demonstrated their efficacy in numerous benchmarks and experiments (e.g., [25]). This provides us with a valuable dataset for experimentation, particularly considering those specific versions and the thousands of queries that we can exploit for training our models and evaluating the quality of the generated summaries. More specifically, we had available a query log with 50 K user queries for v3.8 and 110 K user queries for v3.9, as provided by the DBpedia SPARQL end-point. For Wikidata, we utilized a query log including 268 K user queries for Wikidata Dump 2017 and 313 K user queries for Wikidata 2018, provided online [26]. The detailed characteristics of the various versions are shown in Table 4.

Table 4.
Characteristics of the KGs used for experimental evaluation.
Ground Truth. To produce the “golden standard weights” utilized for training and evaluating the generated summaries, we leverage the associated query logs. Through utilizing the available query logs, we compute the normalized frequencies of both the nodes and edges within user queries that we use as their objective weight for each KG version. Using these frequencies, we posit that the most frequently resources queried are inherently more significant. This assertion is grounded, as the nodes/edges involved in numerous user queries inherently possess greater importance.
Competitors. We contrast our findings against the state-of-the-art systems for structural semantic summaries, i.e., SumMER and RDFDigest+. As already mentioned, SumMER employs a combination of various centralities, while RDFDigest+ uses an adaptation of the betweenness centrality measure. Further, they both use the CHINS approximation algorithm in order to link the most important nodes. Each scenario demonstrates the average time across 10 iterations. All experiments ran on an 11th Gen Intel(R) CPU running 2.80GHz, with 8 GB RAM, on Windows 11 Pro.
5.1. Machine Learning for Node/Edge Selection
First, we emphasize evaluating the embeddings using various walking strategies for selecting nodes. To assess the performance of our machine learning algorithms, we employed Mean Absolute Error (MAE), a widely known metric for regression problems. Nevertheless, since we are solely interested in the top-k nodes, we apply these metrics solely on the specified k nodes. Further, in assessing the node selection process across different machine learning algorithms, we aim to predict the top 20%, 25%, and 30% of significant nodes within the dataset’s total nodes. For all the experiments, we use the DBpedia v3.8 and Wikidata (dump 2017) as the training datasets and the DBpedia v3.9 and Wikidata (dump 2018) as the test datasets.
DBpedia (Nodes): The performance of DBpedia v3.9 is presented in Figure 3. Furthermore, Table 5 displays a section of the confusion matrix of the different Walking Strategies for the selection of the 20%, 25%, and 30% top nodes—omitting the Anonymous walking strategy from all confusion matrices, as it was consistently the worst.
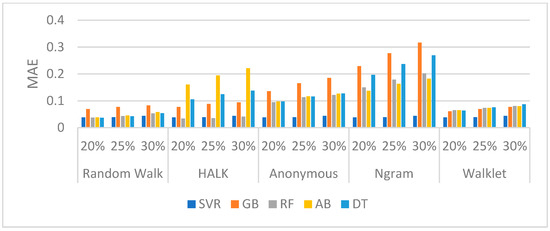
Figure 3.
MAE evaluation measure for each algorithm per walking strategy for DBpedia v3.9.

Table 5.
TP per walking strategy for test results of DBpedia v3.9 (Predicted/Actual nodes).
As shown, Random Walk and Walklet walking strategies have better performances in comparison with the other walkers, while, by combining their performance with TP scores (Table 5), we identify that, by using a Random Walk strategy with a DT regressor, we have a very good performance in most of the cases. DT consistently has a high number of correct predictions (Table 5) in all cases (20%, 25%, 30%), in almost all walkers. The RF regressor also achieves a remarkable achievement on the TPs selection in all cases (20%, 25%, 30%) using the HALK walking strategy; however, it is not the best performer overall, as seen in Figure 3.
Wikidata (Nodes): The outcomes of Wikidata dump 2018 are illustrated in Figure 4, while Table 6 consists of a confusion matrix part for the algorithms utilized in selecting the top 20%, 25%, and 30% nodes. In this experiment, all walking strategies have a good performance in terms of MAE, whereas, looking at Table 6, we can identify that the DT regressor performs best in detecting the TPs in the Random Walk and Walklet walking strategies.
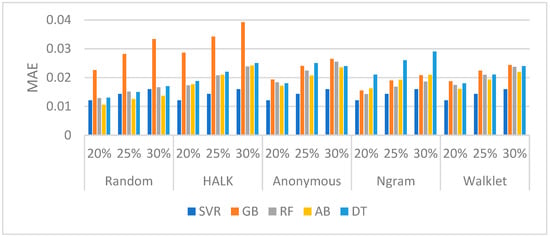
Figure 4.
MAE for each algorithm per walking strategy for Wikidata dump 2018.

Table 6.
TP per walking strategy for test outcomes of Wikidata dump 2018 (Predicted/Actual nodes).
DBpedia (Edges): In Figure 5 the results of the edge prediction task are reported for DBpedia v3.9. Table 7 presents the confusion matrix part of the various algorithms for the selection of the 20%, 25%, and 30% top edges. As shown, all walking strategies have good performances, while, by combining this performance with the TP scores (Table 7), we can identify that, by using SVR, we have a very good performance in all cases.
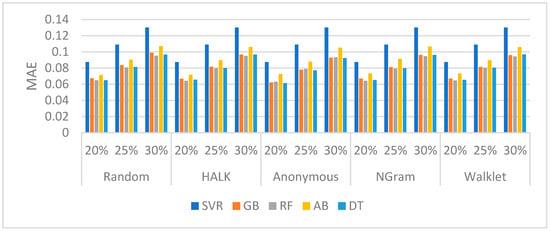
Figure 5.
MAE for each algorithm per walking strategy for DBpedia v3.9 (edges).

Table 7.
TP per walking strategy for test outcomes of DBpedia v3.9 (Predicted/Actual edges).
Based on the confusion matrix, the SVR is the best performer, as it possesses the best performance in all cases (20%, 25%, 30%), in all walkers.
Wikidata (Edges): Observing the performance of Wikidata dump 2018, based on Figure 6, it seems that all regressors trained well in all walking strategies. However, in Table 8, between various walking strategies and different regressors, SVR is optimal in regard to the embeddings returned from the Random Walk strategy, predicting the properties better, while the DT regression follows.
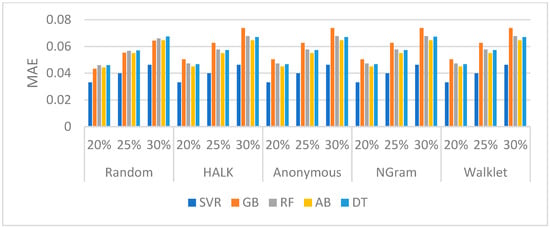
Figure 6.
MAE for each algorithm per walking strategy for Wikidata dump 2018 (properties).

Table 8.
TP per walking strategy for Wikidata dump 2018 (Predicted/Actual Properties).
Overall, Random Walk seems to be the best walking strategy for both nodes and edges. Concerning entities, the DT regressor appears as the best predictor in both the DBpedia and Wikidata nodes for predicting a ranking of the nodes related to user queries. On the other hand, for property prediction, SVR stands out as the top-performing ML algorithm in both DBpedia and Wikidata. As such for the rest of the paper, we will keep random walks for the walking strategy and DT and SVR for selecting nodes and edges, respectively.
5.2. Evaluating Summary Quality
Furthermore, evaluating the assigned weights of the nodes and the edges separately, we next generate the summaries and use coverage to evaluate its overall quality. Coverage is specified as follows:
Coverage takes into account both the nodes and the edges of the generated summary graph, trying to identify how much is in the total weight of the constructed summary from a summary that would be constructed if we knew beforehand the correct (golden) weights for the node and the edges of the graph (i.e., GoldenNodes and GoldenEdges). For calculating coverage, we take into consideration both the weights of the nodes and the weights of the edges of the generated summary (i.e., SummaryNodes, SummaryEdges), whereas we penalize the resulting coverage by the weight of the extra nodes/edges that are added in the summary by the node linking algorithm (i.e., ExtraNodes, ExtraEdges).
In this experiment, we also calculate the coverage of the summaries generated by our competitors, SumMER and RDFDigest+. Both the aforementioned approaches work only on the ontology part of the KGs, and, when applied to the entire KGs, they face scalability problems and the algorithms do not terminate. As such, to be able to compare our approach with those competitors, we sampled 1548 nodes from the DBpedia 3.9 and 276 nodes from Wikidata (dump 2018) to use for our comparisons. We selected a smaller number of nodes from Wikidata, as Wikidata is significantly larger than DBpedia, requiring more calculations for considering the entire graph in the linking phase.
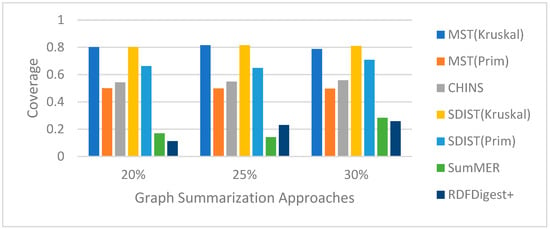
Figure 7.
Coverage per linking method for DBpedia v3.9 summaries.
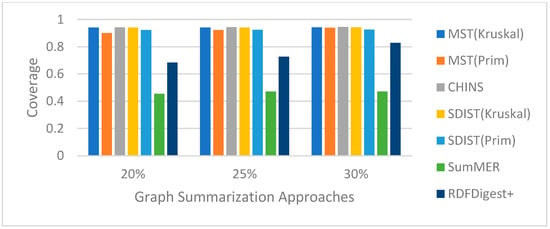
Figure 8.
Coverage per linking method for Wikidata dump 2018 summaries.
As shown, in both datasets, our approach, with all linking algorithms, achieves a higher coverage than SumMER and RDFDigest+, leading us to adopt the SDIST(Kruskal) for generating our summaries. Examining the TP confusion matrix party shown in Table 9, it should be noted that approaches based on embeddings consistently yield the best predictions of the nodes across all sizes of summary, outperforming both competitors in all cases.

Table 9.
TP values for our embeddings-based approach for constructing a summary, SumMER and RDFDigest+ for DBpedia v3.9 and Wikidata dump 2018.
Note that, although CHINS is used by both SumMER and RDFDigest+, our approach not only selects the best nodes but also predicts the weights of the edges to be used and uses them for node linking, further boosting the quality of the summary.
5.3. Execution Time
Subsequently, we assess the effectiveness of the different components within our system.
Computational complexities of walking strategies (see Table 1) and centrality measures [5] differ and are influenced by specific factors. Walking strategies, in principle, have lower complexities due to their parameter-dependent nature, whereas traditional graph metrics’ complexities are primarily determined by the size of the graph. As in our case, we utilize the whole KG, and computing the centrality measures is computationally expensive; as such, walking strategies dominate in terms of execution time.
Node selection. The average processing time for identifying the most significant nodes in the two datasets is shown in Table 10. RDFDigest+ and SumMER rely on centrality measures and, as such, although they also use approximation algorithms, they are one order of magnitude slower than our method. In the table, we also added the time to identify the weights of the properties additionally spent in our case, which is minimal—both SumMER and RDFDigest+ are assumed to have the same weight for all edges.

Table 10.
Execution Time for selecting top-k nodes (sec).
Node Linking. Beyond node selection, linking the top-k nodes is faster in our method. The results are shown in Figure 9 (log scale) only for DBpedia 3.9 due to lack of space, but they are similar for Wikidata as well. Both SumMER and RDFDigest+ rely on CHINS; however, although the worst-case complexities of CHINS are the same with MST and SDIST, the average complexities as already explained are better for MST and SDIST, and, as such, in practice they are two orders of magnitude faster in our experiments.
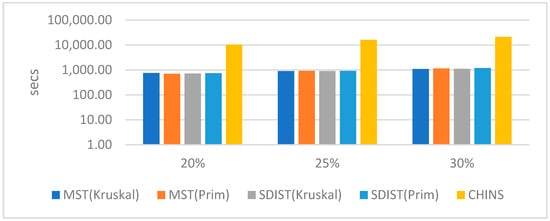
Figure 9.
Execution times (secs) of the linking nodes algorithms in DBpedia 3.9.
This verifies that, in node linking, the devil is in the details, and our approach not only provides summaries of better quality but also of more efficiency, being now able to work on big KGs using a commodity computer.
Limitations. Undoubtedly, with a plethora of user queries accessible for all knowledge graphs, ideal summaries could be generated for each that would be straightforward, focusing precisely on the nodes/edges most commonly queried. However, these query logs are only accessible for a restricted number of scenarios, necessitating methodologies such as the one advocated in this paper to construct high-quality summaries, even in the absence of such logs. However, in order to train our algorithm, we still require at least one version of the knowledge graph with enough queries in order to train our models, which might not be available.
6. Conclusions
In this paper, we present our embeddings-based approach for generating high-quality structural non-quotient semantic summaries, answering the following two key questions: (a) what methods can be utilized to identify the most significant nodes, and (b) how could these nodes be linked to generate a subgraph of the original graph? To answer the first question, we exploit embeddings and, specifically, explore various walking strategies selecting Random Walks. Then, we use machine learning algorithms for capturing importance, converting the selection of the k most important nodes into a regression problem and selecting the DT regressor. Being one order of magnitude faster in regard to computing node importance, we are also able to compute the importance of the edges (using SVR), taking their weight into consideration when linking the top-k nodes. Further, we carefully select the optimal Steiner Tree approximation for our problem, the SDISTG, with it being two orders of magnitude faster than competitors. Our approach achieved coverage scores of 0.8, 0.81, and 0.81 for 20%, 25%, and 30% summaries, respectively, on DBpedia v3.9. Similarly, with Wikidata dump 2018, our method achieved coverage scores of 0.94 across all summary sizes. However, our approach faces the problem of the availability of golden-standard data, such as query logs, that produce the frequencies of entities and properties, and are therefore the criterion for the most important elements. Therefore, future efforts should focus on identifying such data collection methods to enhance the robustness and reliability of our summarization technique. For future work, our methodology will be expanded to include the evaluation of RDF2Vec alongside other embedders like TransE, TransR, RotatE, etc. [11,27]. Furthermore, we aim to investigate additional ML methodologies, such as techniques for learning to rank [28] and deep neural networks.
Author Contributions
Methodology, G.E.T.; Software, G.E.T.; Validation, H.K.; Writing—review & editing, N.P. and H.K.; Visualization, G.E.T.; Supervision, N.P. and H.K. All authors have read and agreed to the published version of the manuscript.
Funding
This research received no external funding.
Institutional Review Board Statement
Not applicable.
Informed Consent Statement
Informed consent was obtained from all subjects involved in the study.
Data Availability Statement
The data presented in this study are available on request from the corresponding author.
Conflicts of Interest
The authors declare no conflict of interest.
References
- Čebirić, Š.; Goasdoué, F.; Kondylakis, H.; Kotzinos, D.; Manolescu, I.; Troullinou, G.; Zneika, M. Summarizing semantic graphs: A survey. VLDB J. 2019, 28, 295–327. [Google Scholar] [CrossRef]
- Pappas, A.; Troullinou, G.; Roussakis, G.; Kondylakis, H.; Plexousakis, D. Exploring importance measures for summarizing RDF/S KBs. In Proceedings of the 14th International Conference, ESWC 2017, Portorož, Slovenia, 28 May–1 June 2017; pp. 387–403. [Google Scholar]
- Peroni, S.; Motta, E.; d’Aquin, M. Identifying key concepts in an ontology, through the integration of cognitive principles with statistical and topological measures. In Proceedings of the 3rd Asian Semantic Web Conference, ASWC 2008, Bangkok, Thailand, 8–11 December 2008; Springer: Berlin/Heidelberg, Germany, 2008; pp. 242–256. [Google Scholar]
- Trouli, G.E.; Troullinou, G.; Koumakis, L.; Papadakis, N.; Kondylakis, H. SumMER: Summarizing RDF/S KBs using machine learning. In Proceedings of the ISWC 2021: Posters, Demos and Industry Tracks, Virtual Conference, 24–28 October 2021. [Google Scholar]
- Trouli, G.E.; Pappas, A.; Troullinou, G.; Koumakis, L.; Papadakis, N.; Kondylakis, H. SumMER: Structural summarization for RDF/S KGs. Algorithms 2023, 16, 18. [Google Scholar] [CrossRef]
- Troullinou, G.; Kondylakis, H.; Stefanidis, K.; Plexousakis, D. Exploring RDFS KBs Using Summaries. In Proceedings of the 17th International Semantic Web Conference, Monterey, CA, USA, 8–12 October 2018; pp. 268–284. [Google Scholar]
- Wu, G.; Li, J.; Feng, L.; Wang, K. Identifying potentially important concepts and relations in an ontology. In Proceedings of the 7th International Semantic Web Conference, ISWC 2008, Karlsruhe, Germany, 26–30 October 2008; Springer: Berlin/Heidelberg, Germany, 2008; pp. 33–49. [Google Scholar]
- Zhang, X.; Cheng, G.; Qu, Y. Ontology summarization based on rdf sentence graph. In Proceedings of the 16th International Conference on World Wide Web, Banff, AB, Canada, 8–12 May 2007; pp. 707–716. [Google Scholar]
- Ristoski, P.; Rosati, J.; Di Noia, T.; De Leone, R.; Paulheim, H. RDF2Vec: RDF Graph Embeddings and Their Applications. Semant. Web 2018, 10, 721–752. [Google Scholar] [CrossRef]
- Steenwinckel, B.; Vandewiele, G.; Bonte, P.; Weyns, M.; Paulheim, H.; Ristoski, P.; De Turck, F.; Ongenae, F. Walk Extraction Strategies for Node Embeddings with RDF2Vec in Knowledge Graphs. In Proceedings of the Database and Expert Systems Applications-DEXA 2021 Workshops: BIOKDD, IWCFS, MLKgraphs, AI-CARES, ProTime, AISys 2021, Virtual Event, 27–30 September 2021. [Google Scholar]
- Biswas, R. Embedding-Based Link Prediction for Knowledge Graph Completion. In Proceedings of the 29th ACM International Conference on Information & Knowledge Management, Virtual Event, 19–23 October 2020. [Google Scholar] [CrossRef]
- Ababio, I.B.; Chen, J.; Chen, Y.; Xiao, L. Link Prediction Based on Heuristics and Graph Attention. In Proceedings of the IEEE International Conference on Big Data (Big Data), Atlanta, GA, USA, 10–13 December 2020; pp. 5428–5434. [Google Scholar] [CrossRef]
- Setty, V. Extreme Classification for Answer Type Prediction in Question Answering. arXiv 2023, arXiv:2304.12395. [Google Scholar]
- Wang, K.; Li, S.; Li, J.; Qi, G.; Ji, Q. An Embedding-based Approach to Inconsistency-tolerant Reasoning with Inconsistent Ontologies. arXiv 2023, arXiv:2304.01664. [Google Scholar]
- Gunaratna, K.; Yazdavar, A.H.; Thirunarayan, K.; Sheth, A.; Cheng, G. Relatedness-Based Multi-Entity Summarization. In Proceedings of the Twenty-Sixth International Joint Conference on Artificial Intelligence (IJCAI-17), Melbourne, Australia, 19–25 August 2017. [Google Scholar] [CrossRef] [PubMed] [PubMed Central]
- Niazmand, E.; Sejdiu, G.; Graux, D.; Vidal, M.E. Efficient Semantic Summary Graphs for Querying Large Knowledge Graphs. Int. J. Inf. Manag. Data Insights 2022, 2, 100082. [Google Scholar] [CrossRef]
- Scherp, A.; Richerby, D.; Blume, T.; Cochez, M.; Rau, J. Structural summarization of semantic graphs using quotients. Trans. Graph Data Knowl. 2023, 1, 12. [Google Scholar]
- Queiroz-Sousa, P.O.; Salgado, A.; Pires, C. A method for building personalized ontology summaries. J. Inf. Data Manag. 2013, 4, 236. [Google Scholar]
- Vassiliou, G.; Troullinou, G.; Papadakis, N.; Kondylakis, H. WBSum: Workload-based summaries for RDF/S KBs. In Proceedings of the 33rd International Conference on Scientific and Statistical Database Management (SSDBM), Tampa, FL, USA, 6–7 July 2021; pp. 248–252. [Google Scholar]
- Vassiliou, G.; Alevizakis, F.; Papadakis, N.; Kondylakis, H. iSummary: Workload-Based, Personalized Summaries for Knowledge Graphs. In Proceedings of the 20th International Conference, ESWC 2023, Hersonissos, Greece, 28 May–1 June 2023. [Google Scholar] [CrossRef]
- Safavi, T.; Belth, C.; Faber, L.; Mottin, D.; Müller, E.; Koutra, D. Personalized Knowledge Graph Summarization: From the Cloud to Your Pocket. In Proceedings of the 2019 IEEE International Conference on Data Mining (ICDM), Beijing, China, 8–11 November 2019; pp. 528–537. [Google Scholar]
- Hakimi, S.L. Steiner’s problem in graphs and its implications. Networks 1971, 1, 113–133. [Google Scholar] [CrossRef]
- Levin, Y. Algorithm for the Shortest Connection of a Group of Graph Vertices. Sov. Math. Dokl. 1971, 12, 1477–1481. [Google Scholar]
- Voß, S. Steiner’s problem in graphs: Heuristic methods. Discret. Appl. Math. 1992, 40, 45–72. [Google Scholar] [CrossRef]
- Akhter, A.; Ngomo, A.N.; Saleem, M. An Empirical Evaluation of RDF Graph Partitioning Techniques. In Proceedings of the European Knowledge Acquisition Workshop, Nancy, France, 12–16 November 2018; Springer: Cham, Switzerland, 2018; pp. 3–18. [Google Scholar]
- Wikidata SPARQL Log. Available online: https://iccl.inf.tu-dresden.de/web/Wikidata_SPARQL_Logs (accessed on 12 December 2023).
- Shi, Y.; Cheng, G.; Tran, T.K.; Kharlamov, E.; Shen, Y. Efficient Computation of Semantically Cohesive Subgraphs for Keyword-Based Knowledge Graph Exploration. In Proceedings of the Web Conference (WWW), Ljubljana, Slovenia, 19–23 April 2021; pp. 1410–1421. [Google Scholar] [CrossRef]
- Ibrahim, O.A.S.; Younis, E.M.G. Combining variable neighborhood with gradient ascent for learning to rank problem. Neural Comput. Appl. 2023, 35, 12599–12610. [Google Scholar] [CrossRef]
Disclaimer/Publisher’s Note: The statements, opinions and data contained in all publications are solely those of the individual author(s) and contributor(s) and not of MDPI and/or the editor(s). MDPI and/or the editor(s) disclaim responsibility for any injury to people or property resulting from any ideas, methods, instructions or products referred to in the content. |
© 2024 by the authors. Licensee MDPI, Basel, Switzerland. This article is an open access article distributed under the terms and conditions of the Creative Commons Attribution (CC BY) license (https://creativecommons.org/licenses/by/4.0/).