Article

A Scalable and Automated Framework for Tracking the Likely Adoption of Emerging Technologies

School of Computer Science & Informatics, Cardiff University, Cardiff CF24 4AG, UK
*
Author to whom correspondence should be addressed.
Information 2024, 15(4), 237; https://doi.org/10.3390/info15040237
Submission received: 25 March 2024 / Revised: 17 April 2024 / Accepted: 18 April 2024 / Published: 19 April 2024
(This article belongs to the Section Information Processes)

Abstract

:
While new technologies are expected to revolutionise and become game-changers in improving the efficiency and practices of our daily lives, it is also critical to investigate and understand the barriers and opportunities faced by their adopters. Such findings can serve as an additional feature in the decisionmaking process when analysing the risks, costs, and benefits of adopting an emerging technology in a particular setting. Although several studies have attempted to perform such investigations, these approaches adopt a qualitative data collection methodology, which is limited in terms of the size of the targeted participant group and is associated with a significant manual overhead when transcribing and inferring results. This paper presents a scalable and automated framework for tracking the likely adoption and/or rejection of new technologies from a large landscape of adopters. In particular, a large corpus of social media texts containing references to emerging technologies was compiled. Text mining techniques were applied to extract the sentiments expressed towards technology aspects. In the context of the problem definition herein, we hypothesise that the expression of positive sentiment implies an increase in the likelihood of impacting a technology user’s acceptance to adopt, integrate, and/or use the technology, and negative sentiment implies an increase in the likelihood of impacting the rejection of emerging technologies by adopters. To quantitatively test our hypothesis, a ground truth analysis was performed to validate that the sentiments captured by the text mining approach were comparable to the results provided by human annotators when asked to label whether such texts positively or negatively impact their outlook towards adopting an emerging technology. The collected annotations demonstrated comparable results to those of the text mining approach, illustrating that the automatically extracted sentiments expressed towards technologies are useful features in understanding the landscape faced by technology adopters, as well as serving as an important decisionmaking component when, for example, recognising shifts in user behaviours, new demands, and emerging uncertainties.

1. Introduction

Technological change is revolutionising the way we lead our daily lives. From the way we work to our own homes, the integration of new technologies, such as 5G, Internet of Things (IoT) devices, and Artificial Intelligence (AI), enhances our productivity and efficiency [1]. However, while new technologies evolve and are expected to revolutionise practices, the industry is facing various barriers in terms of their adoption and implementation. The technology adoption process is affected by aspects such as the availability and quality of hardware/software, organisational role models, available financial resources and funding, organisational support, staff development, attitudes, technical support, and time to learn new technology [2].
Understanding the barriers and advantages faced by technology adopters can be a key feature that impacts essential business decisionmaking components, such as recognising shifts in user behaviours, new demands, and emerging uncertainties. As such, this information can significantly aid in the development of an adequate response, such as developing a technology for addressing the new requirements in an efficient way [3] or developing new organisational strategies.
Several studies have focused on investigating the current positive experiences and barriers of adopting emerging technologies in various settings, such as in educational institutions (e.g., [4]), healthcare (e.g., [5]), smart-medium enterprises (e.g., [6]), and by older adults (e.g., [7]). Such studies often rely on qualitative data collection methods, such as focus groups and interviews. However, this approach is associated with several limitations, including collecting data from a small and targeted sample size, which limits the variance and bias in responses, and the significant overhead associated with recruiting participants, organising interviews, and manually transcribing and inferring results. To gain an understanding of the landscape surrounding emerging technologies from a larger sample of adopters and across different settings, a wider scope of analysis is necessary.
To extract such data at scale, automated techniques are needed to collect and programmatically extract relevant information from publicly available sources. Such sources may include online social media platforms (e.g., Twitter), in which users can publish their content, presenting a wealth of information surrounding their opinions and experiences [8]. To automatically extract and process large volumes of texts originating from diverse sources, text mining techniques may be used [9]. In particular, sentiment analysis, often referred to as opinion mining, aims to automatically extract and classify the sentiments and/or emotions expressed in text [10,11]. In the context of the aforementioned problem definition, we hypothesise that the expression of positive sentiment implies opportunities and positive experiences surrounding emerging technologies, which, therefore, increases the likelihood of impacting a technology user’s acceptance to adopt, integrate, and/or use the technology. Conversely, we hypothesise that the expression of negative sentiment implies the obstacles and barriers caused and faced by such technologies, which, therefore, increases the likelihood of impacting the rejection of emerging technologies by adopters.
To the best of our knowledge, this paper presents the first scalable and automated framework towards tracking the likely adoption of emerging technologies. Such a framework is powered by the automatic collection and analysis of social media discourse containing references to emerging technologies from a large landscape of adopters. The main contributions of the work presented herein are as follows:
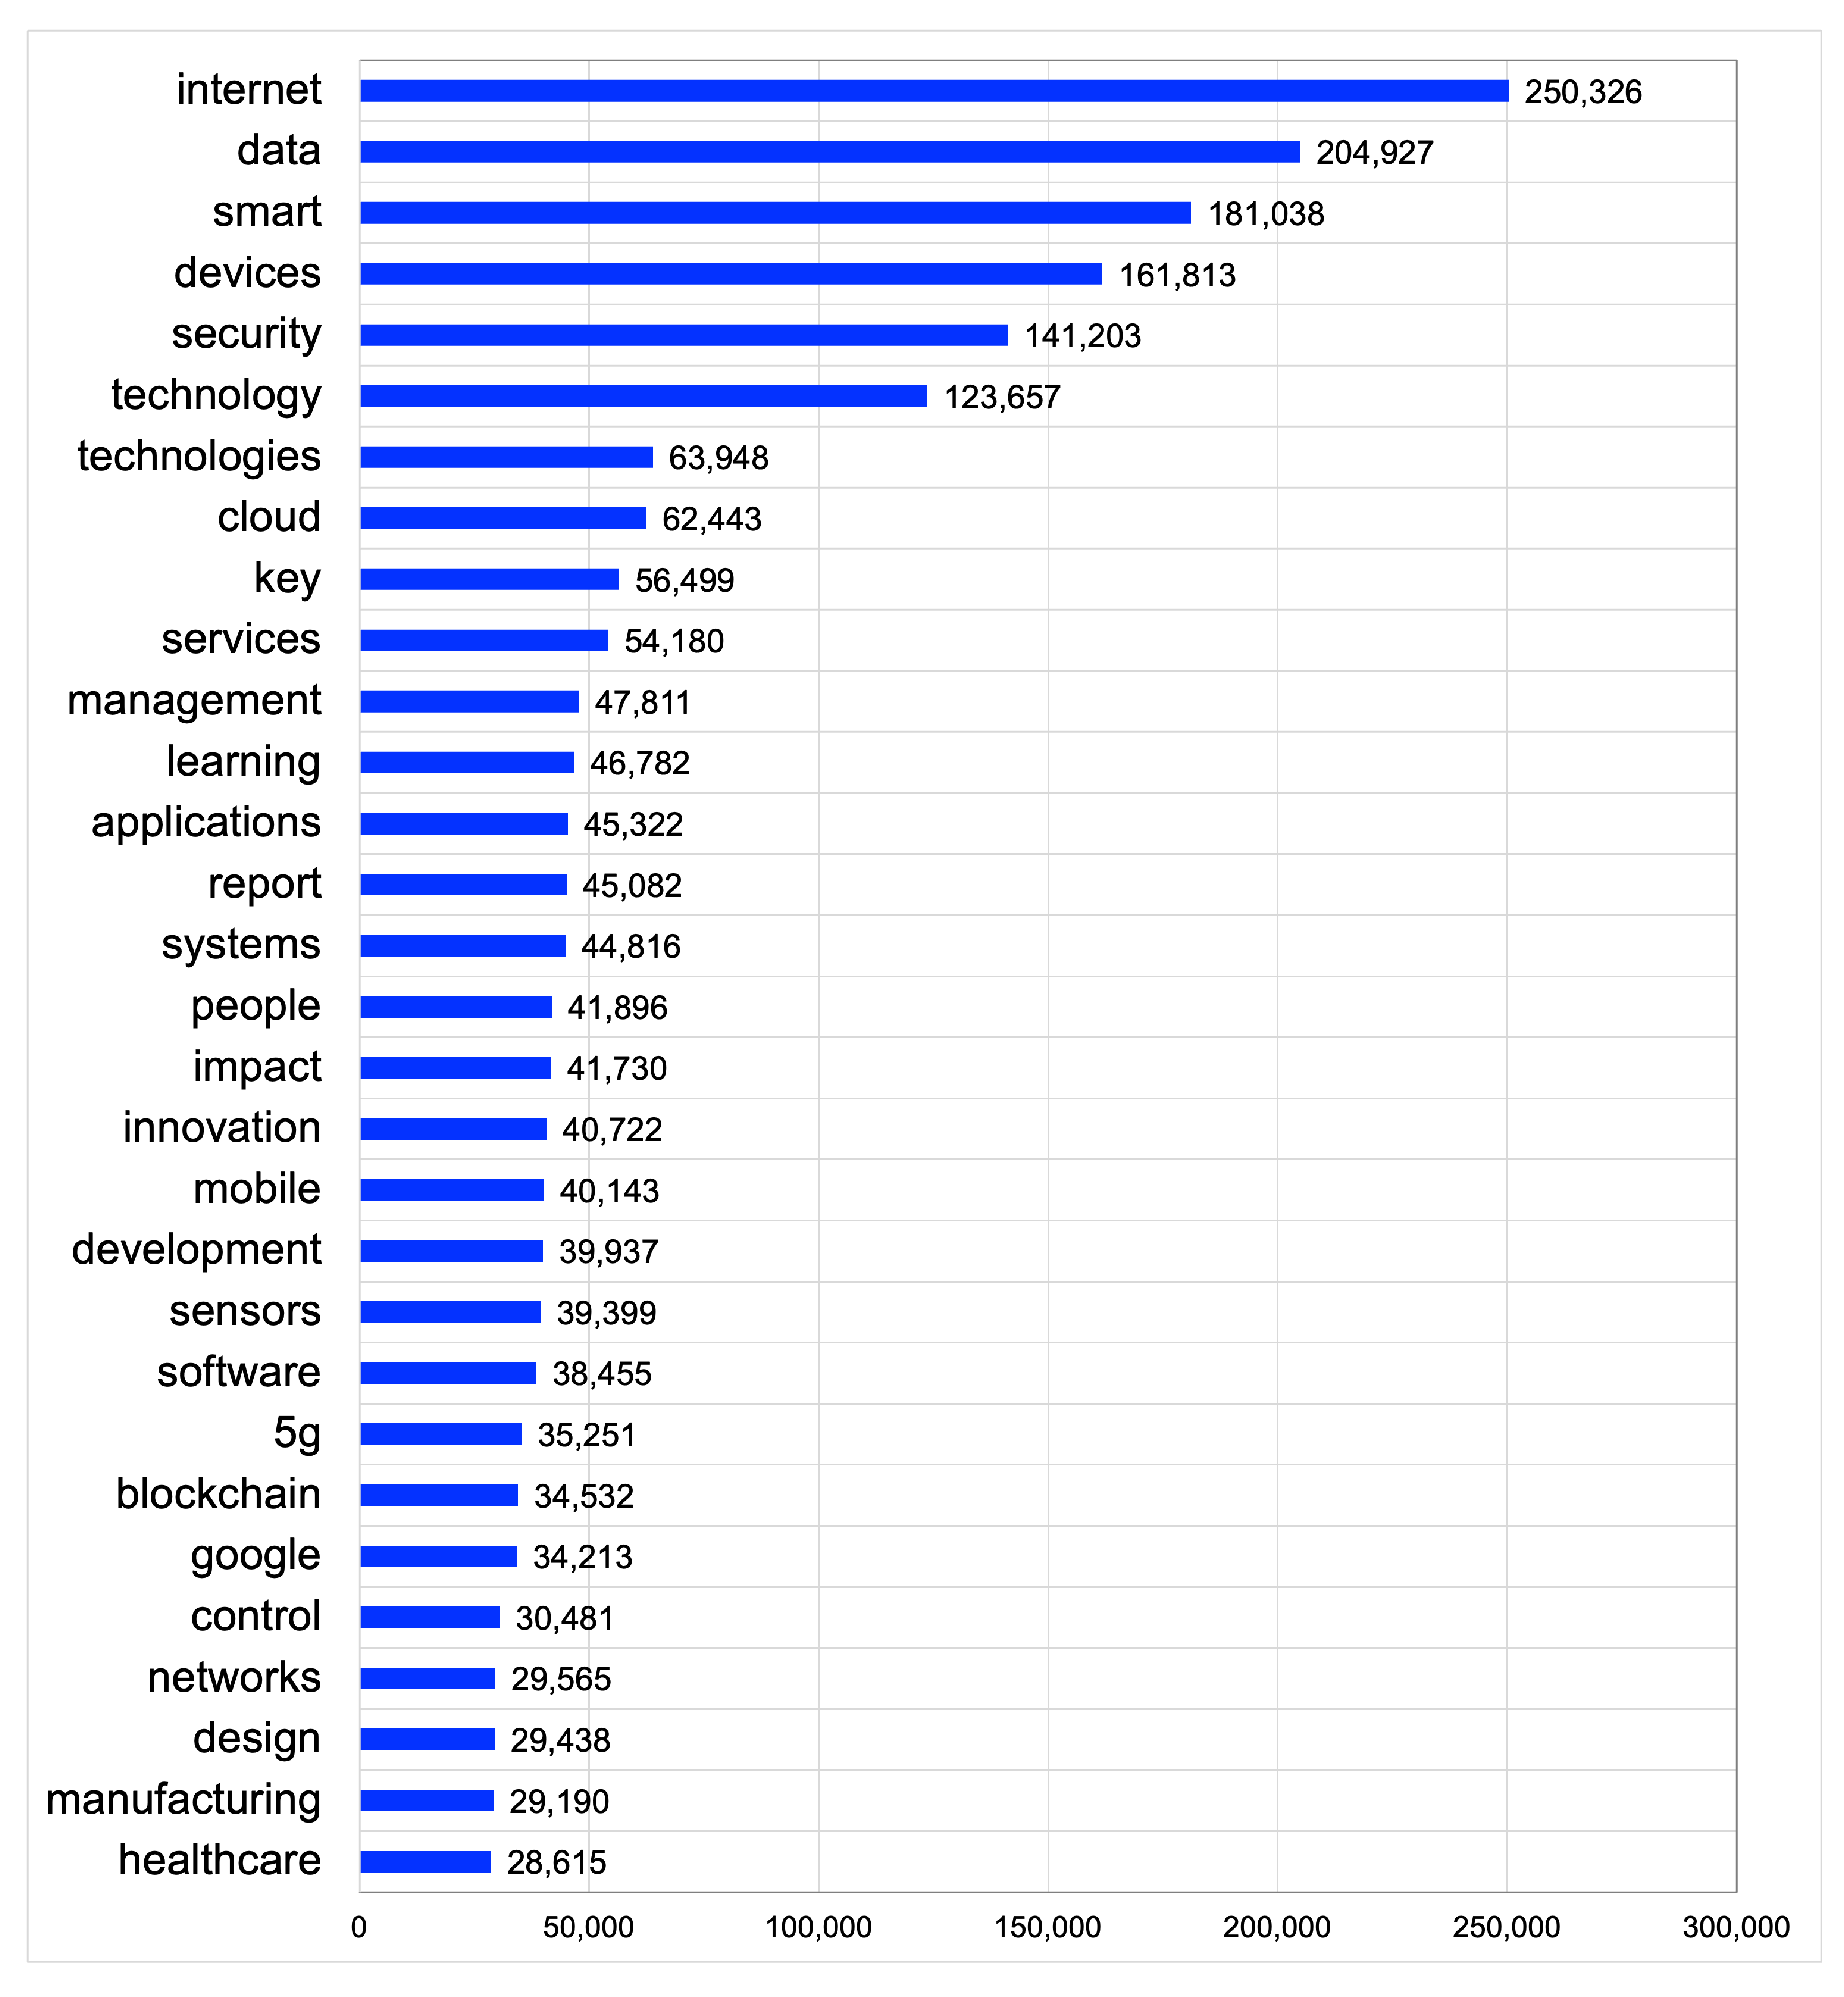
  • The extraction of aspects relating to a range of emerging technologies from social media discourse over a period of time.
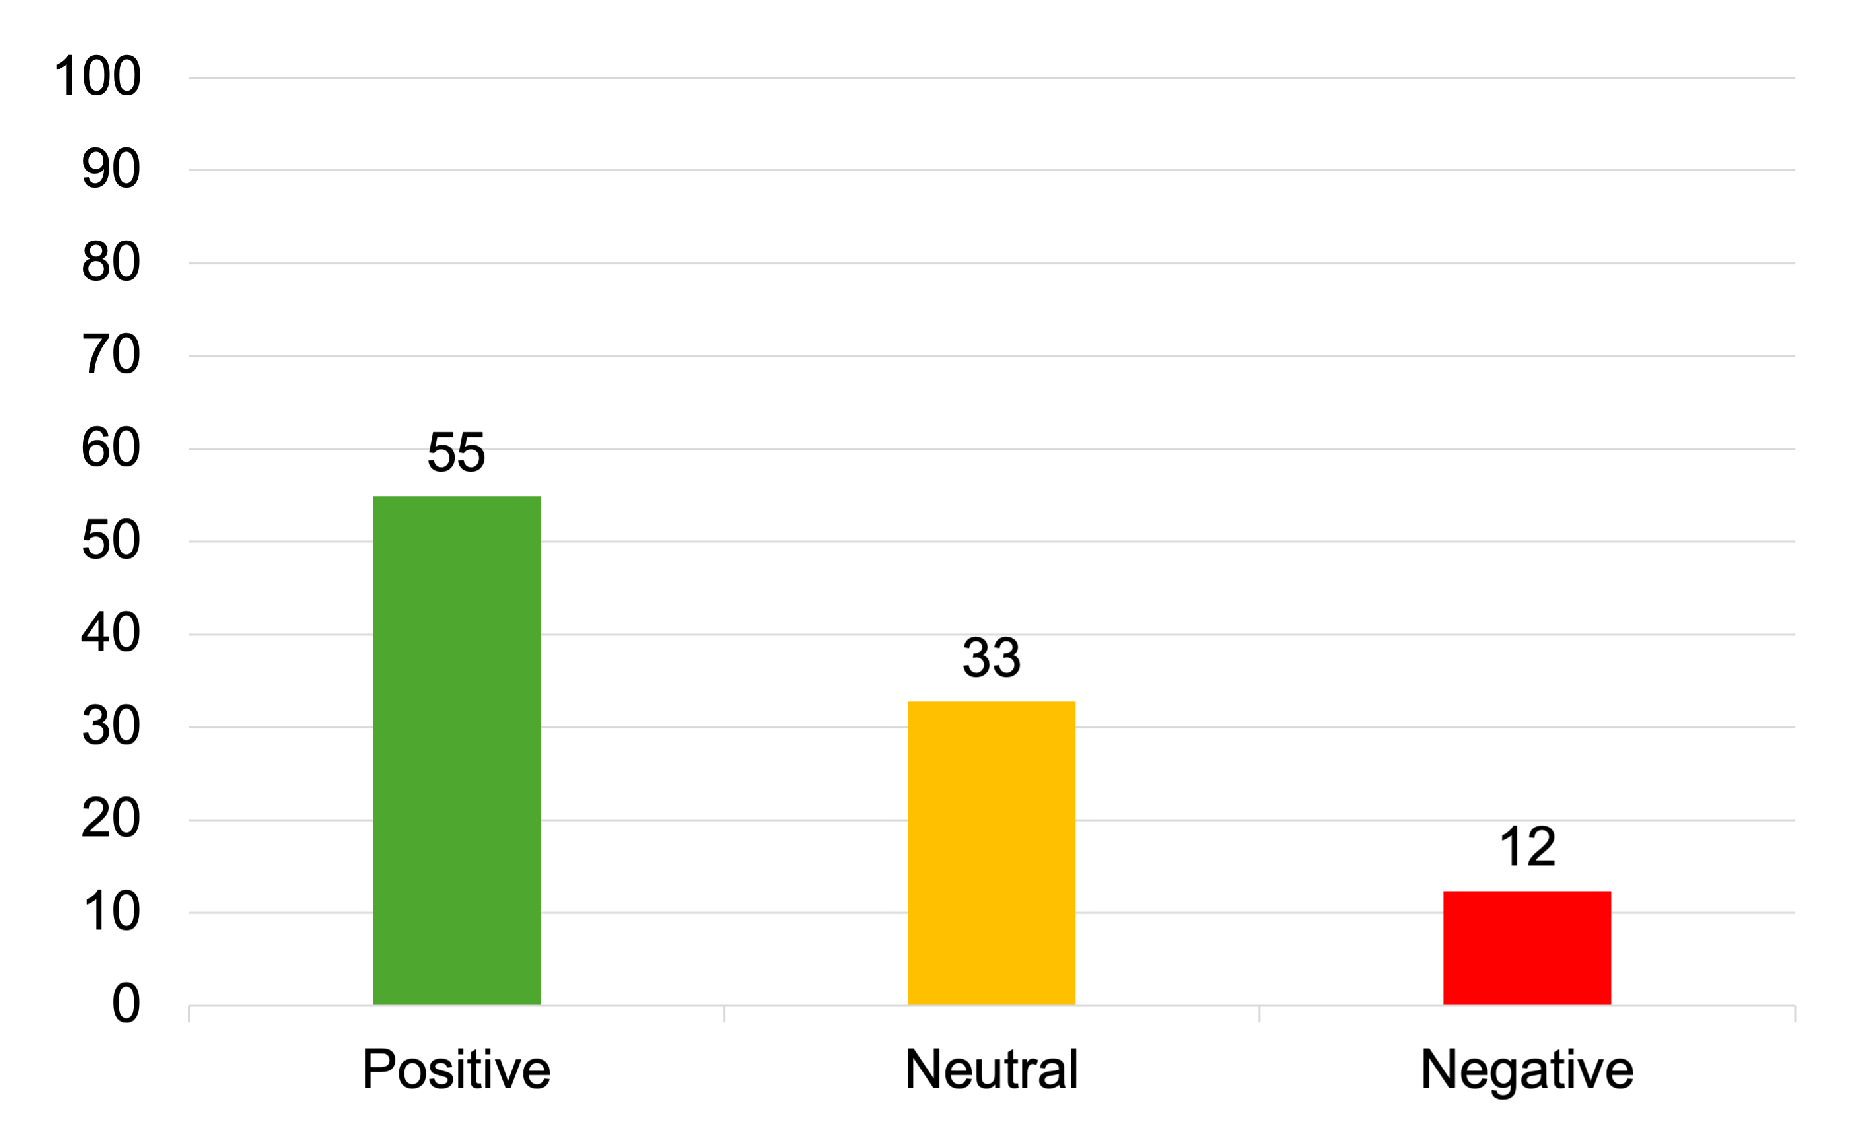
  • The classification of the sentiments expressed towards such technologies, indicating the positive and negative outlooks of users towards adopting them.
  • A ground truth analysis to validate the hypothesis that the sentiments captured by the text mining approach are comparable to the results provided by human annotators when asked to label whether such texts positively or negatively impact their outlook towards adopting an emerging technology.
  • A scalable and automated framework for tracking the likely adoption and/or rejection of new technologies. This information serves as an important decisionmaking component when, for example, recognising shifts in user behaviours, new demands, and emerging uncertainties.
  • Resources that can further support research, such as a large corpus of social media discourse covering five years worth of data that provide recent organic expressions of sentiment towards emerging technologies. This distinguishes our work from prior research that often relies on smaller manually curated datasets or datasets generated under controlled experimental conditions.
The study was designed as shown in Figure 1: (1) compile a corpus of texts containing references to emerging technologies over a time period, (2) pre-process the text responses using traditional Natural Language Processing (NLP) techniques, (3) divide the texts based on their publication date, (4) for each dataset in (3), automatically extract the technology aspects from the text segments, (5) for each dataset in (3), apply a sentiment analysis approach to automatically extract the sentiment expressed towards the identified aspects, and (6) visualise and analyse the results.
The remainder of this paper is structured as follows: Section 2 presents the related work, Section 3 discusses the collection of the texts used to support the experiments herein and the techniques used to prepare the data for such experiments, Section 4 discusses aspect-based sentiment analysis and how it was applied to the datasets, Section 5 presents and discusses the results, Section 6 quantitatively evaluates our hypothesis by comparing the automated text mining method against the impact such texts have on technology adopters, Section 7 concludes the paper, and, finally, Section 8 discusses future work.

2. Related Work

Several studies have explored the factors influencing technology adoption in several different settings, such as healthcare, education, smart-medium enterprises, and by older adults. Such studies have often adopted theoretical frameworks, such as the Technology Acceptance Model (TAM) [12] and the Unified Theory of Acceptance and Use of Technology (UTAUT) [13], to understand and predict the acceptance and adoption of new technologies based on factors such as their perceived usefulness and ease of use. For example, by using such frameworks, Alalwan et al. [14] and Oliveira et al. [15] explore factors that influence mobile banking uptake and customer uptake and adoption of mobile payment technologies, respectively. Likewise, Bhattacherjee and Park [16] investigate the factors that influence the end-user migration to cloud computing services. To collect customer and user data, the aforementioned studies use survey-based methodologies.
To derive the barriers faced within a healthcare setting, Sun and Medaglia [17] investigate the perceived challenges of AI adoption in the public healthcare sector in China. Their study relies on data collected from semi-structured interviews asking a sample group of seven key stakeholder groups open-ended questions focusing on the challenges of AI adoption in healthcare. Similarly, Al-Hadban et al. [18] explore the opinions of healthcare professionals using semi-structured interviews to highlight the important factors and issues that influence the adoption of new technologies in the public healthcare sector in Iraq. Their study relies on data collected from a sample group of eight interviewees. They describe their data collection approach, which includes producing transcriptions of the audio recordings, interpreting and understanding the general sense of the text to form themes, and validating the accuracy of their findings, as a time-consuming process. Poon et al. [19] assess the level of healthcare information technology adoption in the United States by also implementing semi-structured interviews with 52 participants from eight key stakeholder groups. They describe that one of the key limitations of their study involves the responder biases caused by selecting participants based on their access to contacts.
To derive the barriers and positive experiences of adopting emerging technologies in an educational setting, Jin et al. [20] also implement their data collection methods by conducting semi-structured interviews with nine instructors and nine students to understand their perceptions of educational Virtual Reality (VR) technologies. Dequanter et al. [21] examine the factors underlying technology use in older adults with mild cognitive impairments. In their study, over the course of two years, they conduct semi-structured interviews with 16 adults aged 60 and over from a single area in Belgium. Similar to Poon et al. [19], both Jin et al. [20] and Dequanter et al. [21] describe that one of the key limitations of their study involves the responder biases as they believe they recruited participants that are more interested in using VR or novel technologies and from one specific geographical area, which limits the transferability of the results.
The aforementioned works focus on applying qualitative approaches towards understanding factors that surround emerging technology adopters in several different settings. However, it is evident that such approaches are faced with significant limitations, such as recruiting few participants to partake in their studies and the bias in their responses. As a response to such limitations, recent studies have turned to text mining approaches to automatically analyse, and ultimately help understand, the factors influencing consumer adoption or rejection of emerging technologies from a large landscape of adopters. For example, Kwarteng et al. [22] investigate applying sentiment analysis to Twitter data to provide insights into consumer perceptions, emotions, and attitudes towards autonomous vehicles. Efuwape et al. [23] investigate the acceptance and adoption of digital collaborative tools for academic planning using a sentiment analysis of the responses gathered in a poll. Hizam et al. [24] employ sentiment analysis to examine the correlations between numerous factors of technology adoption behaviour, such as perceived ease of use, perceived utility, and social impact. The research aims to understand the underlying variables driving Web 3.0 adoption and offers insights regarding how these factors influence users’ decisions to accept or reject these emerging technologies by analysing user-generated content on social media sites. Mardjo and Choksuchat [25] and Caviggioli et al. [26] investigate using sentiment analysis to examine the public’s perception of adopting Bitcoin. The goal of such studies is to forecast the sentiment of Bitcoin-related tweets, which could influence the cryptocurrency’s market behaviour, as well as providing insights into how the public reacts to the adoption of Bitcoin, and how it affects the perception of the adopting companies. Ikram et al. [27] investigate how potential adopters perceive the specific features of open-source software by examining the sentiments expressed on Twitter (San Francisco, CA, USA).
While the aforementioned studies involve investigating sentiment analysis as an approach towards understanding the factors influencing consumer adoption or rejection of emerging technologies, such studies have primarily focused on specific technologies. Additionally, they lack ground truth analyses to corroborate the sentiments gathered by the text mining approach, raising concerns about the robustness of their findings. As a result, there is an opportunity to expand on the existing research by creating a framework that allows for the examination of a greater range of technologies, resulting in more comprehensive knowledge regarding the factors influencing their adoption. Furthermore, this framework can be customised to focus on specific sectors or technologies, supporting decisionmaking processes by identifying shifts in user behaviour, new expectations, and growing uncertainties. This study will not only add to the existing body of knowledge by broadening the scope of analysis and allowing for greater customisation but will also provide valuable insights that can inform strategic decisions across industries as they navigate the challenges and opportunities associated with technology adoption.

3. Data Collection and Preparation

To explore online narratives surrounding emerging technologies, textual data were collected from Twitter, a social networking service that enables users to send and read tweets—text messages consisting of up to 280 characters. Snscrape (version 0.7.0.20230622, https://github.com/JustAnotherArchivist/snscrape, accessed on 24 March 2024), a Python scraperfor social networking services, was used to scrape English tweets. To facilitate the concept of the framework presented herein, five years worth of tweets published between 1 January 2016 and 31 December 2021 were collected as this aligns with the increase in the adoption of one of the most popular emerging technologies, the Internet of Things (IoT) [28].
The IoT refers to the collection of smart devices that have ubiquitous connectivity, allowing them to communicate and exchange information with other technologies [29]. As more devices connect to the internet and to one another, the IoT is an emerging technology that is considered as being among the largest disruptors, particularly for companies across industries, due to their ability to innovate and develop new products and services, increase productivity with higher levels of performance, improve inventory management, and allow greater access to consumer data to observe patterns and behaviours for continued product and service enhancements [30]. In this case, in this paper, tweets published between the aforementioned dates were collected based on the presence of the hashtags “IoT” or “Internet of Things”. A total of 4,520,934 tweets containing the aforementioned keywords were collected and divided into datasets based on the month and year they were published. The dataset with the most tweets (92,290) was reported in November 2017, with December 2021 reporting the fewest tweets (29,793). No retweets or quote retweets were collected; only self-authored tweets were compiled to avoid duplicated data.
The dataset is available on GitHub and is released in compliance with Twitter’s Terms and Conditions, under which we are unable to publicly release the text of the collected tweets. We are, therefore, releasing the tweet IDs, which are unique identifiers tied to specific tweets. The tweet IDs can be used by researchers to query Twitter’s API and obtain the complete tweet object, including the tweet content (text, URLs, hashtags, etc.) and the authors’ metadata.
The data preparation and analysis in this study were conducted using Python (version 3.7.2). For text pre-processing, the following standard NLP techniques were applied:
  • Converting text to lowercase.
  • Removing mentioned usernames, hashtags, and URLs using Python’s regular expression package, RegEx (version 2020.9.27).
  • To remove bias from the analysis, the keywords (i.e., “IoT” and “Internet of Things”) used to scrape tweets were also removed.

4. Aspect-Based Sentiment Analysis

Aspect-based sentiment analysis is a text mining technique that aims to identify aspects (e.g., foods, sports, or countries) and the sentiment (the subjective part of an opinion) and/or emotion (the projections or display of a feeling) expressed towards them. This technique is often achieved by performing
  • Aspect extraction—aims to automatically identify and extract the specific entities and/or properties of entities in text [31].
  • Sentiment analysis—often referred to as opinion mining, sentiment analysis aims to automatically extract and classify the sentiments and/or emotions expressed in text [10,11].
The following sections further present how aspects relating to emerging technologies and the sentiments expressed towards them were extracted from texts in more detail, as well as the results following the application of such techniques on the dataset presented in Section 3.

4.1. Aspect Extraction

There are various methods by which aspects can be extracted from text. For example, aspect extraction may be achieved using topic modelling, a text mining technique used to identify and extract salient concepts or themes referred to as “topics” distributed across a collection of texts [32]. The output from applying topic modelling is commonly a set of the top most co-occurring terms appearing in each topic [33,34]. However, some of the issues with applying topic modelling methods (e.g., spaCy [35] and Gensim [36]) to achieve aspect extraction are that the pre-trained models provided by these libraries are not specific to emerging technologies and may not be able to recognise or accurately identify new or specialised terms related to this field. In addition, there is often manual overhead associated with interpreting aspects extracted by such methods. For example, “car, power, light, drive, engine, turn” may imply topics surrounding Vehicles, and “game, team, play, win, run, score” may imply Sports. Another similar method for extracting aspects is named entity recognition, a technique for extracting named entities, such as names, geographic locations, ages, addresses, phone numbers, etc., from the text. However, both topic modelling and named entity recognition methods may over-generalise the aspects extracted from texts, in turn losing finer-grained entities. In addition, challenges may occur when topic modelling outputs present irrelevant terms, such as “car, power, light, cake, baking, chocolate” where the overall aspect cannot be defined.
In this case, for each pre-processed dataset described in Section 3, a simple direct string-matching approach was applied to automatically extract aspects that could be mapped against the mapping reference of the Cybersecurity Body of Knowledge (CyBOK) [37], a resource that provides an index of cybersecurity-referenced terms, including emerging technology terms. Of the 13,037 terms available in CyBOK v1.3.0, 3,911 were extracted from the corpus, with one tweet containing a maximum of 20 terms, 514,458 tweets containing a minimum of 1 term, and 3,472,358 tweets containing no terms. Table 1 reports examples of the CyBOK aspects extracted from tweets.
Having removed the keywords used to scrape the tweets, Figure 2 reports the distribution of extracted terms from CyBOK across the dataset.

4.2. Sentiment Analysis

Sentiment analysis, often referred to as opinion mining, aims to automatically extract and classify sentiments and/or emotions expressed in text [10,11]. Most research activities focus on sentiment classification, which classifies a text segment (e.g., phrase, sentence, or paragraph) in terms of its polarity: positive, negative, or neutral. Various techniques and methodologies have been developed to address the automatic identification and extraction of sentiment expressed within free text. The two main approaches are the rule-based approach, which relies on predefined lexicons of opinionated words and calculates a sentiment score based on the number of positive or negative words in the text, and automated sentiment analysis, which relies on training a machine learning algorithm to classify sentiment based on both the words in the text and their order.
While a variety of sentiment analysis methods exist, in the work herein, Valence Aware Dictionary and Sentiment Reasoner (VADER) [38], a lexicon-based sentiment analysis tool, was employed. VADER not only aligns with other relevant studies in the field (e.g., [22,23,24,25]) and therefore ensures consistency and comparability with existing research but is also specifically tuned to classify sentiment expressed in social media language, such as the dataset collated in Section 3. VADER takes into account various features of social media language, such as the use of exclamation marks, capitalisation, degree modifiers, conjunctions, emojis, slang words, and acronyms, which can all impact the sentiment intensity and polarity of a tweet. For example, the use of an exclamation mark increases the magnitude of the sentiment intensity without modifying the semantic orientation, while capitalising a sentiment-relevant word in the presence of non-capitalised words increases the magnitude of the sentiment intensity. Given the complexity of social media language and the various features that can impact sentiment analysis, using VADER to extract the sentiment expressed in the dataset collated herein allows for more accurate and nuanced sentiment analysis of the tweets.
VADER provides a percentage score, which represents the proportion of the text that falls in the positive, negative, or neutral categories. To represent a single uni-dimensional measure of sentiment, VADER also provides a compound score that is computed by summing the valence scores of each word in the lexicon and then normalising the scores to be between −1 (most extreme negative) and 1 (most extreme positive). In the work herein, text segments with a compound score ≤−0.05 were considered as expressing a negative sentiment, those with scores >−0.05 and <0.05 were considered as expressing neutral sentiment, and those with a score ≥0.05 were considered to express positive sentiment. For example, the tweet ‘No fear that a hacker can get access to your camera or thermostat or other electronic devices. Your privacy is 100% protected because the technology is inside your electronics and not located on any server across the world’. achieved a compound score of 0.6734 and was therefore assigned a positive sentiment. Figure 3 reports the distribution of tweets across each sentiment category, with 55% of the dataset being assigned the positive sentiment category, 33% neutral sentiment, and 12% negative sentiment.
In this analysis, a median-based approach was employed to mitigate the influence of outliers in sentiment scores. For each timestamped dataset, text segments were grouped by the technology term that they included. The median of the sentiment scores for that technology term was then calculated, which, unlike calculating the mean, is not swayed by extreme values and thus provides a more representative sentiment score for that time period. After obtaining the median sentiment score, we applied the predefined threshold to categorise the overall sentiment: scores ≤−0.05 were classified as negative, scores >−0.05 and <0.05 were classified as neutral, and scores ≥0.05 were considered positive. This methodology ensures a balanced assessment of sentiment trends and their temporal dynamics with respect to various technologies. Table 2 illustrates how, for October 2020, the technology term YAML was assigned the overall positive sentiment category after achieving a median sentiment score of 0.1366.

5. Results and Discussion

Figure 4 reports the chronological aspect-based analysis results across an excerpt of the emerging technologies across the whole dataset. The figure depicts the chronological monthly data, presenting the changes in sentiment over the timeline. However, it is possible to refine the data to show the daily results to gain more granular information. Despite this, the monthly data are still useful for monitoring the outputs from a broader perspective. While the figure may not capture every detail, it provides an overview of the trends and changes over time that can be used to inform decisionmaking and identify potential areas for improvement.
By observing the sentiments expressed towards emerging technologies alongside the stages of technology adoption presented by Rogers [39] and the various adopter categories (i.e., innovators, early adopters, early majority, late majority, and laggards) presented by Moore [40], it is possible to gain a better understanding of how shifts in sentiment may influence the adoption or rejection of emerging technologies. During the early stages of 5G network adoption in April 2020, for instance, negative sentiment was expressed in the form of conspiracy theories and misinformation (e.g., ‘Rumours of 5G as the true cause behind COVID-19, communication towers burned…’). Such data may have a greater effect on laggards, who are typically more risk-averse and resistant to new technologies [39]. In contrast, early consumers, who are typically more receptive to innovation and risk [40], may be more interested in the potential advantages and opportunities of the 5G network. For example, in November 2021, several tweets (e.g., ‘5G network compatibility will make IoT devices better suited for the future as the industry continues to see how the speed 5G provides can make IoT devices preform better’ and ‘Microsoft and AT&T are accelerating the enterprise customer’s journey to the edge with 5G’) expressed an overall positive sentiment. As the 5G network matures and progresses through the adoption stages, the users in the early and late majority stages may become more familiar with the benefits of the technology and their attitudes may change. This change may be indicative of a broader acceptance of the technology, resulting in its increased adoption.
Similarly, when analysing cybersecurity issues such as cyber attacks, various adopter categories may be influenced differently by the sentiment conveyed. In the case of malware, regarding the negative sentiment expressed in July 2017 regarding the WORM-RETADUP attack (e.g., ‘Information-stealing malware discovered targeting Israeli hospitals’), innovators and early adopters may view this as a learning opportunity and work to develop more robust security measures. In contrast, the late majority and laggards may be discouraged from adopting these technologies due to cybersecurity concerns. Likewise, the negative sentiment expressed in June 2016 related to the Distributed Denial-of-Service (DDoS) attack involving compromised CCTV cameras could impact the adoption patterns across the adopter categories in a similar manner (e.g., ‘25,000 CCTV cameras hacked to launch #DDoS attack’ and ‘What a way to cause a distraction—25,000 CCTV cameras hacked to launch DDoS attack’).
By refining the data, the framework can be customised to concentrate on specific industries, which enhances its flexibility and makes it a dynamic solution that can adapt to the unique needs of different sectors. For example, Figure 5 and Figure 6 report the chronological aspect-based analysis results across an excerpt of the emerging technologies from discourses relating to healthcare and education, respectively.
In the health sector, in August 2017, an overall negative sentiment was expressed towards Siemens’ medical molecular imaging systems (e.g., ‘This type of vulnerability in healthcare is not unique to Siemens’) as an alert warning was issued when publicly available exploits were identified that could allow an attacker to remotely execute damaging code or compromise the safety of their systems [41]. Innovators and early adopters might view the security vulnerability as an opportunity to improve upon the existing systems and develop more secure solutions. In contrast, the late majority and laggards may perceive the security vulnerability as a reason to delay or reject the adoption of such technology in healthcare. An interesting observation is the variation in technological aspects in each sector, as well as the expression of sentiment towards them. The differences in sentiment between industries may be useful in highlighting the distinct adoption patterns prevalent in each sector. By analysing these patterns, valuable insights into the factors that influence the adoption of new technologies can be obtained and used to tailor strategies accordingly. Understanding the nuances of sector-specific adoption patterns enables stakeholders to make better-informed decisions, thereby facilitating the successful integration of emerging technologies across multiple domains.

6. Evaluation

To quantitatively test our hypothesis, a ground truth analysis was performed to validate that the sentiments captured by the text mining approach are comparable to the results provided by independent human annotators when asked to label whether such texts positively or negatively impact their outlook towards adopting an emerging technology. We measured the impact using three metrics:
  • Positive—The text has a positive impact on the reader. Given this information, they are now more likely to accept, integrate, and/or use the technology in their business or personal life.
  • Negative—The text has a negative impact on the reader. Given this information, they now feel against integrating and using the technology in their business or personal life.
  • Neutral—The text has no impact on the reader and they feel indifferent about the technology.
To facilitate the annotation task, a bespoke web-based annotation platform accessible via a web browser was implemented. This eliminated any installation overhead and widened the reach of annotators. The annotators were presented with instructions explaining the task’s requirements and then with the platform’s interface, consisting of two panes. The first pane contained a randomly selected tweet to be annotated, as well as the referenced technology discussed in the tweet. The second pane contained the annotation choices for the aforementioned metrics.
The crowdsourcing of labelling natural language often uses a limited number of annotators with the expectation that they are perceived to be experts [42]. However, annotation is a highly subjective task that varies with age, gender, experience, cultural location, and individual psychological differences [43]. For example, Snow et al. [44] investigate collecting annotations from a broad base of non-expert annotators over the internet. They show high agreement between the annotations provided by non-experts found on social media and those provided by experts. In this case, in this study, a crowdsourcing approach was adopted to annotate a randomly sampled set of 150 tweets (50 samples of positive, negative, and neutral tweets) by developing and disseminating an annotation platform on Twitter, enabling users to participate in the annotation process and contribute to the assessment of sentiment in the dataset. A total of 750 annotations were collected with five annotations per sample. A total of 20 independent annotators participated in the study.
To quantitatively measure the reliability of the collected annotations, we measured inter-annotator agreement using Krippendorff’s alpha coefficient [45]. As a generalisation of known reliability indices, it was used as it applies to (1) any number of annotators, not just two, (2) any number of categories, and (3) corrects for chance expected agreement. Krippendorff’s alpha coefficient of 1 indicates perfect agreement, 0 indicates no agreement beyond chance, and −1 indicates disagreement. The values for Krippendorff’s alpha coefficient were obtained using Python’s computation of Krippendorff’s alpha measure [46].
Krippendorff suggests α = 0.667 as the lowest acceptable value when considering the reliability of a dataset [47]. The inter-annotator agreement of the annotated dataset in this study was calculated as α = 0.769, with a total of 89 samples out of 150 (59.3%) achieving full agreement. The relatively high agreement ( α = 0.769) illustrates the relative reliability of the annotations that delineate the impact of the presented texts on technology users.
To evaluate our proposed text mining approach against a human annotator perspective, annotated tweets were used to create a gold standard. For each tweet in the sample, an annotation agreed on by the relative majority of at least 50% was assumed to be the ground truth. For example, the tweet ‘Cyber attacks on the rise how secure is your router network’ was annotated with negative four times and once with neutral; thus, negative was accepted as the ground truth. When no majority annotation could be identified, a new independent annotator resolved the disagreement. For example, the tweet ‘We may have soon pills or grain size sensors in US reporting in real time’ was annotated twice with positive, twice with neutral, and once with negative sentiment. Thus, the independent annotator accepted neutral as the ground truth. A total of three samples suffered from disagreement and were resolved by the independent annotator.
The confusion matrix provided in Table 3 shows how the sentiment categories are re-distributed when comparing the sampled dataset generated by the text mining approach with the gold standard formed using the collected annotations. Overall, 123 out of the 150 samples (82%) were in agreement. When considering the aspect of positive sentiment, 37 of the samples in the gold standard were in agreement with the text mining approach. Some instances were in disagreement, where 13 samples were categorised as neutral. No positive instance was in disagreement with the negative category. Of the fifty samples of negative tweets, forty-five samples of the gold standard agreed, with two and three samples being in disagreement and annotated as positive and neutral, respectively. Likewise, for the neutral tweets, forty-one samples were in agreement, with eight and one instances being annotated as positive and negative, respectively. Such disagreements illustrate the natural subjective nature of the task. Overall, the relatively high agreement between the impact of such texts on human annotators and the results generated by the text mining approach imply that the proposed automated method generates reliable results regarding understanding the barriers and opportunities faced by technology adopters from large online corpora.

7. Conclusions

This paper presents a scalable and automated framework towards tracking the likely adoption of emerging technologies. This framework is powered by the automatic collection and analysis of social media discourse containing references to emerging technologies from a large landscape of adopters. In particular, to support the experiments presented herein and subsequently remove the dependence on manual qualitative data collection and analysis, an automated text mining approach was adopted to compile a large corpus of over four million tweets covering five years worth of data. Once pre-processed, the corpus was divided into datasets based on their publication month and year. To extract the references to emerging technologies from the text, a simple string-matching approach was applied to automatically identify tweets containing references to technologies that could be mapped to CyBOK’s cybersecurity index. Under the hypothesis that the expression of positive sentiment implies an increase in the likelihood of impacting a technology user’s acceptance to adopt, integrate, and/or use the technology, and negative sentiment implies an increase in the likelihood of impacting the rejection of emerging technologies by adopters, sentiment analysis was applied to extract the sentiment expressed towards the identified technology. For each technology, the sentiment polarity with the highest average score was used to determine the overall sentiment expressed during the specific month and year.
Notably, this study reports that instances of negative sentiment disclose the obstacles faced by technologies as a result of the dissemination of false information or their participation in malicious activities. In the context of risk assessment, a crucial aspect of a company’s decisionmaking process, this information can serve as an additional factor in assessing the risks, costs, and benefits an organisation may face upon deploying such technologies, including the overall security of their technology systems and data. In the context of the stages of technology adoption, these obstacles may contribute to delays in progressing through the adoption stages or even lead to the rejection of the technology altogether. On the other hand, the expression of positive sentiment is useful for recognising the benefits and advantages of adopting particular technologies as it provides insight into how other organisations with similar structures have successfully integrated them. By refining the data, the framework can also be customised to concentrate on specific industries, such as education and healthcare, which enhances its flexibility and makes it a dynamic solution that can adapt to the unique needs of different sectors.
To quantitatively test our hypothesis, a ground truth analysis was performed to validate that the sentiments captured by the text mining approach were comparable with the results provided by human annotators when asked to label whether such texts positively or negatively impact their outlook towards adopting an emerging technology. The collected annotations demonstrated comparable results to those of the text mining approach, illustrating that automatically extracted sentiments expressed towards technologies are useful features in understanding the landscape faced by technology adopters across various stages of adoption.

8. Future Work

The intersection of sentiment analysis and real-world technological adoption is an interesting area for future research. Building on the foundational work presented in this paper, where automated sentiment estimation is compared with human evaluators, there is significant potential in exploring the predictive power of sentiment analysis concerning technology uptake. As part of potential future work, the next step would involve correlating the sentiments expressed in digital media with the actual adoption rates of emerging technologies. By doing so, the analysis would uncover potential patterns that may allow the rate of technology adoption to be predicted, providing valuable insights into the societal readiness and market potential for new technological advancements. Such predictive modeling could serve as a strategic tool for stakeholders, offering a data-driven basis for decisionmaking in technology development and marketing strategies.
Given the positive results of this preliminary study, another interesting research area is the investigation of context-aware sentiment extractors to reduce false positives in emerging technology sentiment analysis. While the current method has presented useful insights, it may occasionally misinterpret sentiments due to a lack of context awareness. For example, whereas one would classify the tweet ‘cyber attack quick response guide’ as expressing a neutral sentiment, VADER’s results report that the tweet expresses a negative one due to the presence of the word ‘attack’. By employing advanced techniques, such as sentiment analysis models based on deep learning, the accuracy and reliability of the findings presented here can be enhanced, allowing for a more nuanced comprehension of the factors influencing technology adoption.

Author Contributions

Conceptualization, L.W.; Methodology, L.W. and P.B.; Validation, L.W.; Investigation, L.W.; Data curation, L.W.; Writing—original draft, L.W. and E.A.; Writing—review & editing, L.W. and E.A.; Funding acquisition, P.B. All authors have read and agreed to the published version of the manuscript.

Funding

For the purpose of open access, the author has applied a CC BY public copyright licence (where permitted by UKRI, ‘Open Government Licence’ or ‘CC BY-ND public copyright licence’ may be stated instead) to any Author Accepted Manuscript version arising. This work was funded by the Economic and Social Research Council (ESRC), grant ‘Discribe - Digital Security by Design (DSbD) Programme’. REF ES/V003666/1.

Institutional Review Board Statement

The study was conducted in accordance with Cardiff University’s research ethics policy, and approved by the Cardiff University’s School of Computer Science & Informatics Ethics Committee (SREC reference: COMSC/Ethics/2022/074, approved on 9 September 2022).

Informed Consent Statement

Informed consent was obtained from all subjects involved in the study.

Data Availability Statement

The dataset is available from GitHub (https://github.com/LowriWilliams/IoT_referenced_tweets, accessed on 24 March 2024) and is released in compliance with Twitter’s Terms and Conditions, under which we are unable to publicly release the text of the collected tweets. We are, therefore, releasing the tweet IDs, which are unique identifiers tied to specific tweets. The tweet IDs can be used by researchers to query Twitter’s API and obtain the complete tweet object, including the tweet content (text, URLs, hashtags, etc.) and the authors’ metadata. As part of this repository, the scripting developed to process the text segments collected as part of the dataset and the performance of sentiment analysis are included. In addition, whereas the figures in this paper report an excerpt of the emerging technologies, the repository contains the results produced for all 3911 CyBOK technology terms extracted from the text segments.

Conflicts of Interest

The authors declare no conflicts of interest.

References

  1. Jackson, D.; Allen, C.; Michelson, G.; Munir, R. Strategies for Managing Barriers and Challenges to Adopting New Technologies; CPA Australia: Southbank, MEL, Australia, 2022. [Google Scholar]
  2. Rogers, P.L. Barriers to adopting emerging technologies in education. J. Educ. Comput. Res. 2000, 22, 455–472. [Google Scholar] [CrossRef]
  3. Kucharavy, D.; De Guio, R. Technological forecasting and assessment of barriers for emerging technologies. In Proceedings of the 17th International Conference on Management of Technology (IAMOT 2008), Dubai, United Arab Emirates, 6–10 April 2008; p. 14.2. [Google Scholar]
  4. Bacow, L.S.; Bowen, W.G.; Guthrie, K.M.; Long, M.P.; Lack, K.A. Barriers to Adoption of Online Learning Systems in US Higher Education; Ithaka: New York, NY, USA, 2012. [Google Scholar]
  5. Christodoulakis, C.; Asgarian, A.; Easterbrook, S. Barriers to adoption of information technology in healthcare. In Proceedings of the 27th Annual International Conference on Computer Science and Software Engineering, Markham, ON, Canada, 6–8 November 2017; pp. 66–75. [Google Scholar]
  6. Kapurubandara, M.; Lawson, R. Barriers to Adopting ICT and E-Commerce with SMEs in Developing Countries: An Exploratory Study in Sri Lanka; University of Western Sydney: Sydney, Australia, 2006; Volume 82, pp. 2005–2016. [Google Scholar]
  7. Yusif, S.; Soar, J.; Hafeez-Baig, A. Older people, assistive technologies, and the barriers to adoption: A systematic review. Int. J. Med. Inform. 2016, 94, 112–116. [Google Scholar] [CrossRef]
  8. Burnap, P.; Williams, M.L. Us and them: Identifying cyber hate on Twitter across multiple protected characteristics. EPJ Data Sci. 2016, 5, 1–15. [Google Scholar] [CrossRef]
  9. Williams, L.; Bannister, C.; Arribas-Ayllon, M.; Preece, A.; Spasić, I. The role of idioms in sentiment analysis. Expert Syst. Appl. 2015, 42, 7375–7385. [Google Scholar] [CrossRef]
  10. Liu, B. Sentiment Analysis and Subjectivity. In Handbook of Natural Language Processing; Department of Computer Science, University of Illinois at Chicago: Chicago, IL, USA, 2010; Volume 2, pp. 627–666. [Google Scholar]
  11. Munezero, M.; Montero, C.S.; Sutinen, E.; Pajunen, J. Are they different? Affect, feeling, emotion, sentiment, and opinion detection in text. IEEE Trans. Affect. Comput. 2014, 5, 101–111. [Google Scholar] [CrossRef]
  12. Davis, F.D. Perceived usefulness, perceived ease of use, and user acceptance of information technology. MIS Q. 1989, 13, 319–340. [Google Scholar] [CrossRef]
  13. Venkatesh, V.; Morris, M.G.; Davis, G.B.; Davis, F.D. User acceptance of information technology: Toward a unified view. MIS Q. 2003, 27, 425–478. [Google Scholar] [CrossRef]
  14. Alalwan, A.A.; Dwivedi, Y.K.; Rana, N.P. Factors influencing adoption of mobile banking by Jordanian bank customers: Extending UTAUT2 with trust. Int. J. Inf. Manag. 2017, 37, 99–110. [Google Scholar] [CrossRef]
  15. Oliveira, T.; Thomas, M.; Baptista, G.; Campos, F. Mobile payment: Understanding the determinants of customer adoption and intention to recommend the technology. Comput. Hum. Behav. 2016, 61, 404–414. [Google Scholar] [CrossRef]
  16. Bhattacherjee, A.; Park, S.C. Why end-users move to the cloud: A migration-theoretic analysis. Eur. J. Inf. Syst. 2014, 23, 357–372. [Google Scholar] [CrossRef]
  17. Sun, T.Q.; Medaglia, R. Mapping the challenges of Artificial Intelligence in the public sector: Evidence from public healthcare. Gov. Inf. Q. 2019, 36, 368–383. [Google Scholar] [CrossRef]
  18. AL-Hadban, W.; Yusof, S.A.M.; Hashim, K.F. The barriers and facilitators to the adoption of new technologies in public healthcare sector: A qualitative investigation. Int. J. Bus. Manag. 2017, 12, 159–168. [Google Scholar] [CrossRef]
  19. Poon, E.G.; Jha, A.K.; Christino, M.; Honour, M.M.; Fernandopulle, R.; Middleton, B.; Newhouse, J.; Leape, L.; Bates, D.W.; Blumenthal, D.; et al. Assessing the level of healthcare information technology adoption in the United States: A snapshot. BMC Med. Inform. Decis. Mak. 2006, 6, 1–9. [Google Scholar] [CrossRef]
  20. Jin, Q.; Liu, Y.; Yarosh, S.; Han, B.; Qian, F. How Will VR Enter University Classrooms? Multi-stakeholders Investigation of VR in Higher Education. In Proceedings of the CHI Conference on Human Factors in Computing Systems, New Orleans, LA, USA, 30 April–5 May 2022; pp. 1–17. [Google Scholar]
  21. Dequanter, S.; Fobelets, M.; Steenhout, I.; Gagnon, M.P.; Bourbonnais, A.; Rahimi, S.; Buyl, R.; Gorus, E. Determinants of technology adoption and continued use among cognitively impaired older adults: A qualitative study. BMC Geriatr. 2022, 22, 1–16. [Google Scholar] [CrossRef]
  22. Kwarteng, M.A.; Ntsiful, A.; Botchway, R.K.; Pilik, M.; Oplatková, Z.K. Consumer Insight on Driverless Automobile Technology Adoption via Twitter Data: A Sentiment Analytic Approach. In Proceedings of the Re-imagining Diffusion and Adoption of Information Technology and Systems: A Continuing Conversation: IFIP WG 8.6 International Conference on Transfer and Diffusion of IT, TDIT 2020, Tiruchirappalli, India, 18–19 December 2020; Springer: Berlin/Heidelberg, Germany, 2020. Part I. pp. 463–473. [Google Scholar]
  23. Efuwape, T.O.; Abioye, T.E.; Abdullah, A.K. Text Analytics of Opinion-Poll On Adoption of Digital Collaborative Tools for Academic Planning using Vader-Based Lexicon Sentiment Analysis. FUDMA J. Sci. 2022, 6, 152–159. [Google Scholar] [CrossRef]
  24. Hizam, S.M.; Ahmed, W.; Akter, H.; Sentosa, I.; Masrek, M.N. Web 3.0 Adoption Behavior: PLS-SEM and Sentiment Analysis. arXiv 2022, arXiv:2209.04900. [Google Scholar]
  25. Mardjo, A.; Choksuchat, C. HyVADRF: Hybrid VADER–Random Forest and GWO for Bitcoin Tweet Sentiment Analysis. IEEE Access 2022, 10, 101889–101897. [Google Scholar] [CrossRef]
  26. Caviggioli, F.; Lamberti, L.; Landoni, P.; Meola, P. Technology adoption news and corporate reputation: Sentiment analysis about the introduction of Bitcoin. J. Prod. Brand Manag. 2020, 29, 877–897. [Google Scholar] [CrossRef]
  27. Ikram, M.T.; Butt, N.A.; Afzal, M.T. Open source software adoption evaluation through feature level sentiment analysis using Twitter data. Turk. J. Electr. Eng. Comput. Sci. 2016, 24, 4481–4496. [Google Scholar] [CrossRef]
  28. Lueth, K.L. IoT 2016 in Review: The 8 Most Relevant IoT Developments of the Year. Available online: https://iot-analytics.com/iot-2016-in-review-10-most-relevant-developments/. (accessed on 13 July 2022).
  29. Anthi, E.; Williams, L.; Słowińska, M.; Theodorakopoulos, G.; Burnap, P. A supervised intrusion detection system for smart home IoT devices. IEEE Internet Things J. 2019, 6, 9042–9053. [Google Scholar] [CrossRef]
  30. The Essential Eight Technologies Board Byte: The internet of Things. Available online: https://www.pwc.com.au/pdf/essential-8-emerging-technologies-internet-of-things.pdf. (accessed on 2 June 2022).
  31. Thet, T.T.; Na, J.C.; Khoo, C.S. Aspect-based sentiment analysis of movie reviews on discussion boards. J. Inf. Sci. 2010, 36, 823–848. [Google Scholar] [CrossRef]
  32. Kang, H.J.; Kim, C.; Kang, K. Analysis of the trends in biochemical research using Latent Dirichlet Allocation (LDA). Processes 2019, 7, 379. [Google Scholar] [CrossRef]
  33. Jacobi, C.; Van Atteveldt, W.; Welbers, K. Quantitative analysis of large amounts of journalistic texts using topic modelling. Digit. J. 2016, 4, 89–106. [Google Scholar] [CrossRef]
  34. Greene, D.; O’Callaghan, D.; Cunningham, P. How many topics? Stability analysis for topic models. In Proceedings of the Joint European Conference on Machine Learning and Knowledge Discovery in Databases, Turin, Italy, 18–22 September 2023; Springer: Berlin/Heidelberg, Germany, 2014; pp. 498–513. [Google Scholar]
  35. spaCy: Industrial-Strength NLP. Available online: https://spacy.io/ (accessed on 5 March 2021).
  36. Gensim: Topic Modelling for Human. Available online: https://radimrehurek.com/gensim/ (accessed on 5 March 2021).
  37. The Cybersecurity Body of Knowledge (CyBOK)—CyBOK Mapping Reference Version 1.1. Available online: https://www.cybok.org/media/downloads/CyBOk-mapping-reference-v1.1.pdf (accessed on 10 April 2022).
  38. Hutto, C.; Gilbert, E. Vader: A parsimonious rule-based model for sentiment analysis of social media text. In Proceedings of the International AAAI Conference on Web and Social Media, Ann Arbor, MI, USA, 1–4 June 2014; Volume 8, pp. 216–225. [Google Scholar]
  39. Rogers, E.M. Diffusion of Innovations; Simon and Schuster: New York, NY, USA, 2003; p. 576. [Google Scholar]
  40. Moore, G. Crossing the Chasm: Marketing and Selling High-Tech Products to Mainstream Customers; Harper Business Essentials; Harper Business: New York, NY, USA, 1991. [Google Scholar]
  41. Gallagher, S. Siemens, DHS Warn of “Low Skill” Exploits against Medical Scanners. Available online: https://arstechnica.com/gadgets/2017/08/siemens-dhs-warn-of-low-skill-exploits-against-ct-and-pet-scanners/ (accessed on 12 July 2022).
  42. Tarasov, A.; Delany, S.J.; Cullen, C. Using crowdsourcing for labelling emotional speech assets. In Proceedings of the W3C Workshop on Emotion ML, Paris, France, 5–6 October 2010. [Google Scholar]
  43. Passonneau, R.J.; Yano, T.; Lippincott, T.; Klavans, J. Relation between agreement measures on human labeling and machine learning performance: Results from an art history image indexing domain. In Proceedings of the Sixth International Conference on Language Resources and Evaluation (LREC), Marrakech, Morocco, 28–30 May 2008; pp. 2841–2848. [Google Scholar]
  44. Snow, R.; O’connor, B.; Jurafsky, D.; Ng, A.Y. Cheap and fast–but is it good? Evaluating non-expert annotations for natural language tasks. In Proceedings of the 2008 Conference on Empirical Methods in Natural Language Processing, Honolulu, HI, USA, 25–27 October 2008; pp. 254–263. [Google Scholar]
  45. Krippendorff, K. Content Analysis: An Introduction to Its Methodology; Sage Publications: Thousand Oaks, CA, USA, 2018. [Google Scholar]
  46. A Python Computation of the Krippendorff’s Alpha Measure. Available online: https://pypi.org/project/krippendorff/ (accessed on 5 March 2021).
  47. Krippendorff, K. Reliability in Content Analysis: Some Common Misconceptions and Recommendations. Hum. Commun. Res. 2004, 30, 411–433. [Google Scholar] [CrossRef]
Figure 1. An overview of the study design.
Information 15 00237 g001
Figure 2. Top 30 most frequently referenced CyBOK terms used across the dataset.
Information 15 00237 g002
Figure 3. Distribution (percentage) of tweets across sentiment categories.
Information 15 00237 g003
Figure 4. Chronological aspect-based analysis results across an excerpt of emerging technologies from the whole dataset (positive sentiment = green; neutral sentiment = orange; negative sentiment = red).
Information 15 00237 g004
Figure 5. Chronological aspect-based analysis results across an excerpt of emerging technologies from discourse relating to healthcare (positive sentiment = green; neutral sentiment = orange; negative sentiment = red).
Information 15 00237 g005
Figure 6. Chronological aspect-based analysis results across an excerpt of emerging technologies from discourse relating to education (positive sentiment = green; neutral sentiment = orange; negative sentiment = red).
Information 15 00237 g006
Table 1. Examples of tweets mapped to CyBOK terms.
TweetExtracted Aspect
One of our engineers was at the Google Cloud On-Board
roadshow this morning. It’s great to hear we’re being described
as an industry leader in cloud native platform delivery!
[‘google’, ‘cloud’, ‘cloud native’]
5 of the best Alexa-enabled devices for automation.[‘devices’, ‘automation’]
How the growth of IoT is changing data management.[‘data management’]
Challenge in talent part of implementing: marrying domain
knowledge of software and hardware engineers; finding people
who can wear many hats; competitiveness of the data science
space; realize what’s possible is changing all the time.
[‘software’, ‘hardware’,
‘data science’]
Mobile re-emerges as revolutionizing tech behind virtual
reality, machine learning.
[‘mobile’, ‘machine learning’]
Table 2. Determining overall sentiment.
TweetSentimentSentiment Score
My Home Assistant has 11,498 lines
of YAML code tested.
Neutral0
Bear Stone Smart home currently
runs on 11,409 lines of YAML code.
Check it all out.
Positive0.4019
vCloudInfo—Simple Example of using
YAML Node Anchors in Home Assistant.
Neutral0
instead of writing automations for
#HomeAssistant in Yaml, you can create
them visually using NodeRed.
Positive0.2732
Table 3. Confusion matrix comparing text mining outputs with human annotations.
Human Annotations
PositiveNegativeNeutral
Positive37013
Text MiningNegative2453
Neutral8141
Disclaimer/Publisher’s Note: The statements, opinions and data contained in all publications are solely those of the individual author(s) and contributor(s) and not of MDPI and/or the editor(s). MDPI and/or the editor(s) disclaim responsibility for any injury to people or property resulting from any ideas, methods, instructions or products referred to in the content.

