Article

An Overview on the Advancements of Support Vector Machine Models in Healthcare Applications: A Review

deHealth Lab—Laboratory of Decision Engineering for Healthcare Services, Department of Mechanical, Energetic and Management Engineering, University of Calabria, Via P. Bucci, Cubo 41C, 87036 Rende, Italy
*
Author to whom correspondence should be addressed.
Information 2024, 15(4), 235; https://doi.org/10.3390/info15040235
Submission received: 21 March 2024 / Revised: 15 April 2024 / Accepted: 16 April 2024 / Published: 19 April 2024
(This article belongs to the Special Issue Computer Vision, Pattern Recognition and Machine Learning in Italy)

Abstract

:
Support vector machines (SVMs) are well-known machine learning algorithms for classification and regression applications. In the healthcare domain, they have been used for a variety of tasks including diagnosis, prognosis, and prediction of disease outcomes. This review is an extensive survey on the current state-of-the-art of SVMs developed and applied in the medical field over the years. Many variants of SVM-based approaches have been developed to enhance their generalisation capabilities. We illustrate the most interesting SVM-based models that have been developed and applied in healthcare to improve performance metrics on benchmark datasets, including hybrid classification methods that combine, for instance, optimization algorithms with SVMs. We even report interesting results found in medical applications related to real-world data. Several issues around SVMs, such as selection of hyperparameters and learning from data of questionable quality, are discussed as well. The several variants developed and introduced over the years could be useful in designing new methods to improve performance in critical fields such as healthcare, where accuracy, specificity, and other metrics are crucial. Finally, current research trends and future directions are underlined.

1. Introduction

In the healthcare industry, a well-known adage is “Quality care is the right care, at the right time, every time” [1]. Modern healthcare is more often personalized, evidence-driven, and model-assisted. Large amounts of existing data allow for the creation of the data-driven approaches that have emerged to enhance decision-making processes. In the era of big data, the healthcare domain is an active area of research where various problems are addressed using machine learning (ML) approaches. For instance, experts are supported in disease diagnosis by ML algorithms, often employing classification techniques to determine the presence or absence of of a particular disease based on medical examination results and symptoms. Traditional medical diagnosis relies on a doctor’s judgment and years of experience to make a diagnosis based on the patient’s symptoms. However, ML approaches can replicate decision-making capabilities for disease diagnosis, as reported in a recent review paper on ML techniques for classifying and detecting breast cancer from medical images [2].
Support Vector Machines (SVMs) are commonly used for classification and regression problems. The performance of SVM algorithms has been found to be comparable or superior to other ML algorithms, making them a valuable tool for healthcare practitioners.
SVMs find applications in several fields within healthcare, including:
  • Diagnosis and prognosis to predict the progression of diseases such as cancer, cardiovascular disease, and neurological disorders. One significant limitation is the inability to address class imbalance effectively in real-life datasets. Most algorithms are designed with the assumption of a balanced class, including classical SVM; however, this can result in poor performance when predicting the minority target class, which is often the focus in prediction processes.
  • Predictive modelling can be used in healthcare services to predict patient outcomes, such as complications and survival rates. In the clinical environment, decisions based on predicting risks and positive outcomes should ideally be supported by statistical learning models. ML techniques are commonly used in the diagnosis of diseases to enhance domain expert decision-making procedures. The diagnosis process relies heavily on objective data from patients and expert decisions. Classification systems can reduce errors caused by lack of expertise and provide medical data for examination in a shorter time. The effectiveness of a predictive model depends on the selection of appropriate predictors.
  • Personalized medicine, where SVMs can help to develop personalized treatment plans based on a patient’s genomic, demographic, and clinical data.
  • Risk stratification allows patients to be stratified based on their risk of developing a particular disease or condition. Interesting recent papers addressing the stratification of patient populations based on prognostic or predictive biomarkers include [3,4], while issues related to cancer genomics such as the discovery of new biomarkers, new drug targets, and a better understanding of genes that act as drivers of cancer have been addressed in [5].
  • In gene expression analysis, SVMs can be applied to identify key genes that are associated with particular diseases, such as leukemia, colon cancer, and lymphoma [6,7]. Microarray data are used to record the expression values of thousands of genes. These datasets are characterized by a small sample size and numerous features.
  • In image analysis, SVMs can be applied to detect and diagnose various diseases and conditions in medical imaging, such as PET-CT images for patients with lung cancer [8], breast magnetic resonance imaging [9,10], X-rays for infectious diseases such as pneumonia [11,12], and neuroimaging for Alzheimer’s Disease, as reported in a structured review [13] (adni.loni.usc.edu, accessed on 15 February 2024).
Recently, there has been growing interest among researchers in using electronic health records to improve various aspects of healthcare. These include improving the outcomes of medical procedures, reducing healthcare costs, evaluating the effectiveness of newly developed drugs, and predicting health trends or adverse events. Survival analysis plays a key role in predicting health trends or adverse events. It is used to investigate how a given set of factors, known as covariates, affect the time to a particular event of interest, such as death or reaching a particular stage of disease progression. The primary objective of survival analysis is to establish a relationship between these covariates and the time from baseline to the occurrence of an event. What distinguishes survival analysis from traditional ML methods is its handling of partially observed data, commonly referred to as censoring. For example, in clinical trials patients are typically followed for a period of time during which events are recorded. If a patient experiences an event such as disease progression or death, the exact timing of the event is known and the patient’s record is considered uncensored. However, for patients who do not experience the event by the end of the study period, their records are considered censored, either because the event has not yet occurred or because they were lost to follow-up. This aspect of survival analysis presents unique challenges and requires specialised techniques for analysis and interpretation. The use of SVMs for regression problems is known as Support Vector Regression (SVR). A regression model can predict the exact time of an event.
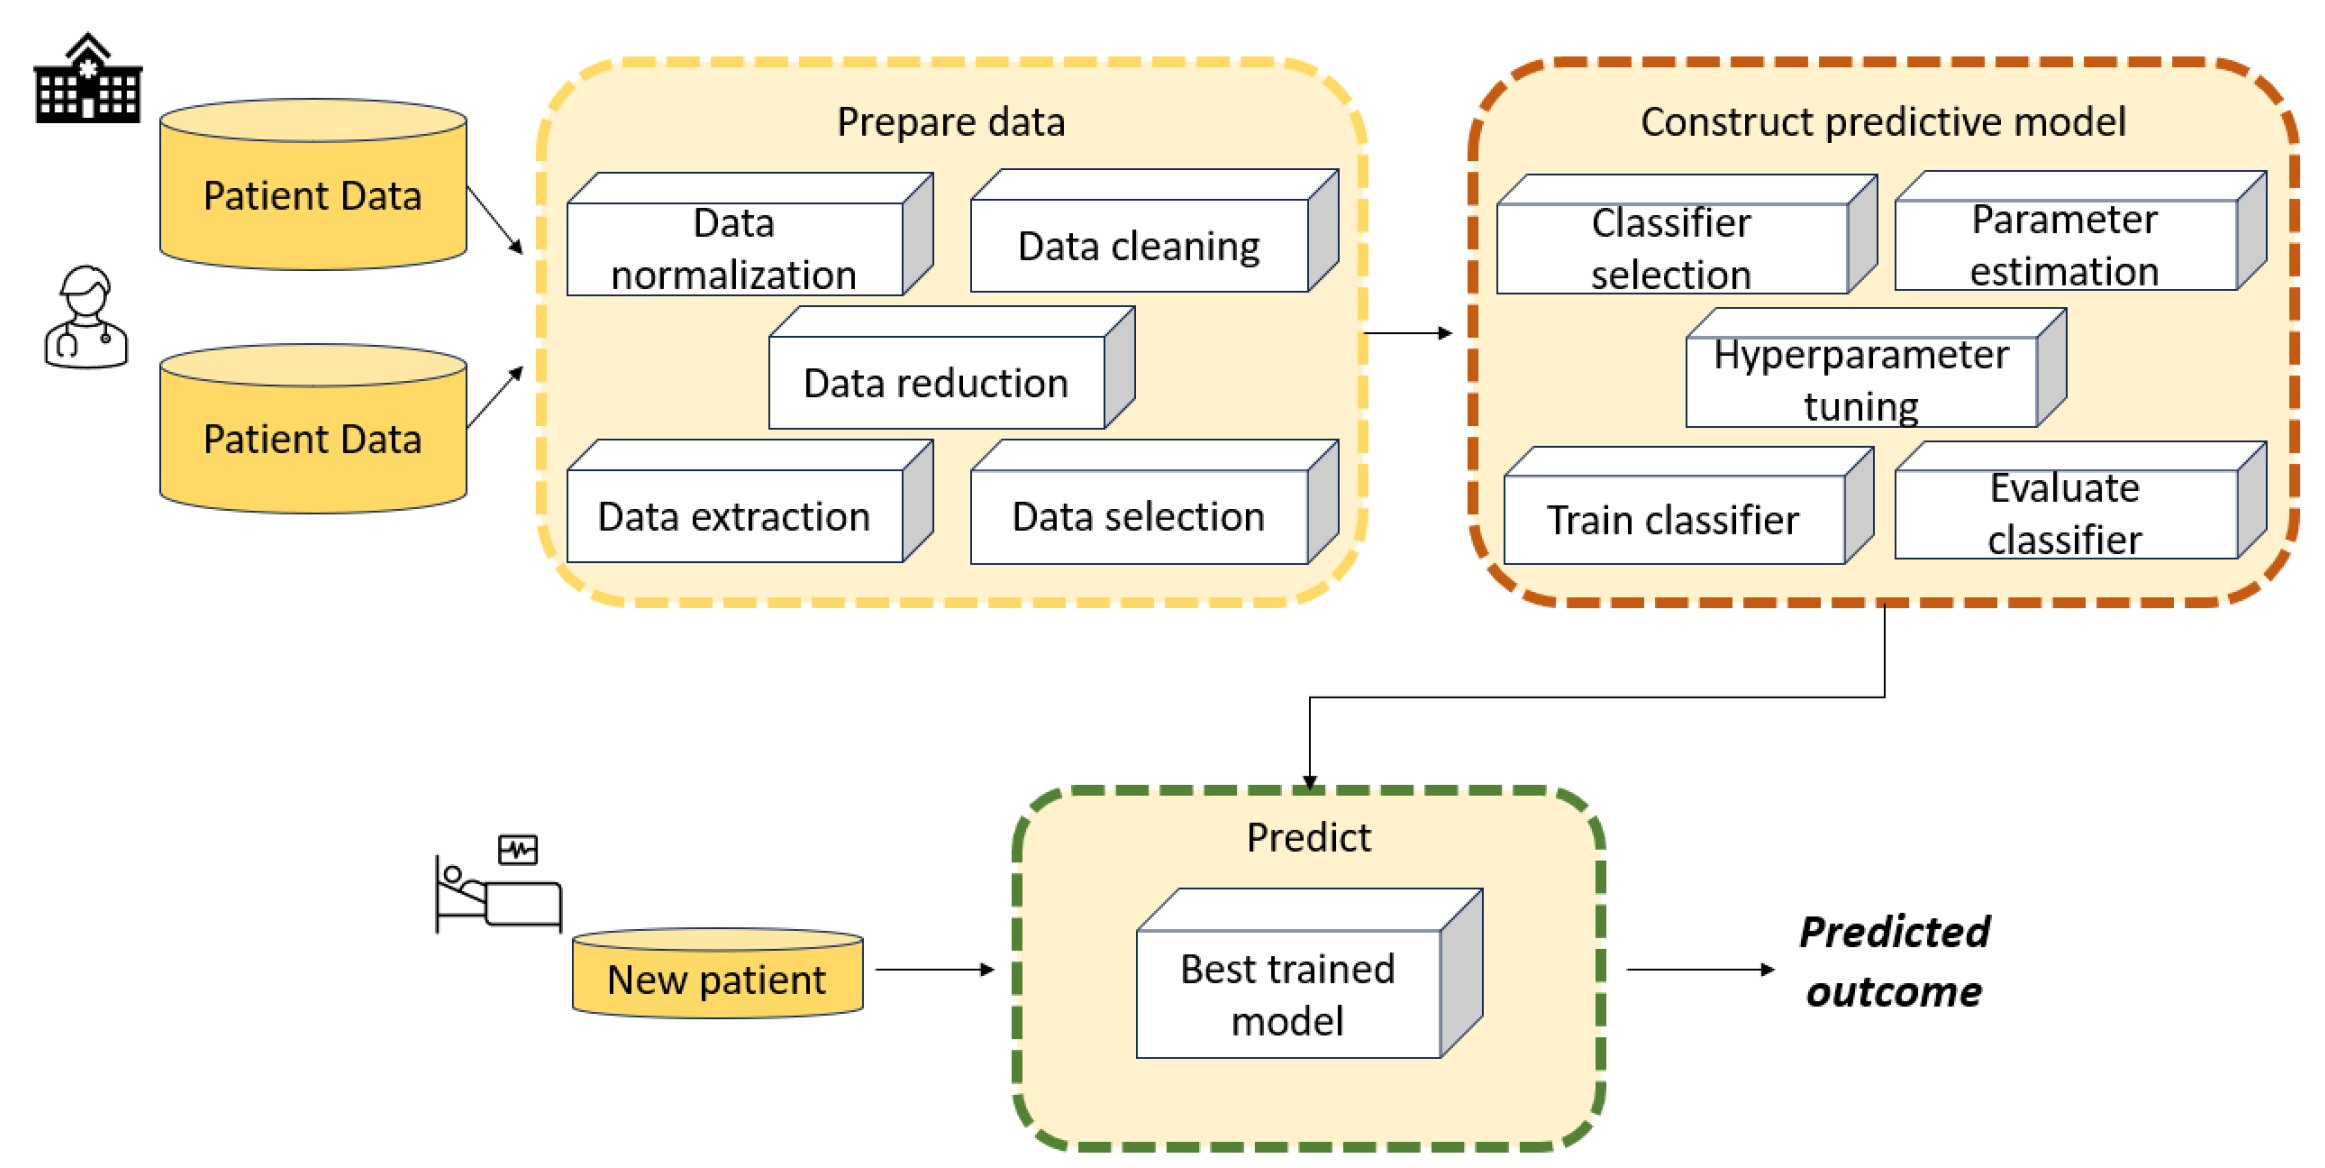
Figure 1 illustrates the main stages involved in developing an ML model such as an SVM to solve a diagnostic or regression problem. Data collection is not an issue when benchmark datasets are used to train and test SVM models; however, it becomes a fundamental phase when addressing real-world case studies.
  • Data collection is the first stage, and involves collecting relevant data from various sources such as databases or sensors. These data consist of case scenarios organized and grouped according to specific criteria that are relevant to decision-making.
  • The data processing phase aims to handle missing values, outliers, noise, and inconsistencies. Data preprocessing techniques may include data cleaning, normalisation, feature scaling, encoding categorical variables, and dimensionality reduction.
  • Feature engineering involves selecting, transforming, and creating new features from raw data to enhance the performance of SVM models. This may include extracting meaningful features from raw data, combining multiple features, or generating new features using domain knowledge.
  • Data modelling is a crucial component of the architecture, as it aims to build a model capable of learning patterns and relationships between input features and output labels. Effective data modelling requires careful consideration of data preprocessing, feature engineering, model selection, and evaluation techniques to build accurate and robust machine learning systems.
  • Model evaluation is the final stage. After a model has been trained, it is evaluated using a validation set in order to assess its performance on unseen data. The best model is then chosen from among those that have been evaluated.
Retrieving accurately labelled datasets can be a costly and challenging process. It often requires repeated experiments or time-consuming annotation procedures, especially in fields such as medical imaging. Therefore, learning from weakly labelled data has become crucial. Weak-label problems are categorised based on label characteristics, including partially-known labels (where most training vectors are unlabeled), implicitly-known labels (where training vectors are grouped into labelled bags), and unknown labels. Data quality issues such as label and feature noise can complicate matters, especially in medical applications, where diagnostic tests may lack perfect accuracy. Label noise can severely impact classifier performance, leading to deteriorated performance and increased learning requirements. Additionally, label noise can skew the observed frequencies of medical test results, potentially resulting in incorrect conclusions about population characteristics.

Motivations and Goals

Disease diagnosis and prognosis is crucial when determining treatment strategies and is closely linked to patient safety. In recent years, new modelling approaches based on SVMs have shown good performance, either as hybrid approaches combining various ML techniques or by utilising optimization approaches. The aim of this paper is to provide an overview of the main SVM models that have been developed over the years for use in the healthcare domain to improve medical knowledge and support experts. Due to the large number of such papers, this paper represents a non-exhaustive literature review. Indeed, the following simple query of the Scopus database yielded 1764 documents from 1996 to 2023:
TITLE-ABS-KEY (“support vector machines” AND medical) AND PUBYEAR < 2024 AND (LIMIT-TO (SUBJAREA, “MATH”)) AND (LIMIT-TO (LANGUAGE, “English”)) AND (LIMIT-TO (EXACTKEYWORD, “Support Vector Machines”) OR LIMIT-TO (EXACTKEYWORD, “Support Vector Machine”) OR LIMIT-TO (EXACTKEYWORD, “Support Vectors Machine”) OR LIMIT-TO (EXACTKEYWORD, “SVM”) OR LIMIT-TO (EXACTKEYWORD, “Support Vector Machine (SVMs)”)).
Figure 2 shows the publication years of the resulting 1764 papers. A significant increase can be observed over the past five years.
The literature in this field is extensive. Thus, the purpose of this review is threefold:
  • First, to provide an examination of the literature in order to investigate the evolution of SVM models used in medical data and the incorporation of new techniques, for example, the novel fuzzy least squares projection twin support vector machines for class imbalance learning in [14]. Our focus is on research introducing innovative SVM-based models and methods aimed at enhancing existing approaches or reporting novel improvements in results. Our analysis firstly focused on selecting papers that proposed innovative SVM models or reported interesting medical results in the areas of disease diagnosis, disease prognosis, or healthcare management. The primary focus was on three areas: disease diagnosis, including gene expression and image analysis; disease prognosis; and healthcare management. In addition, we discuss the underlying ideas, strengths, and weaknesses, allowing for better understanding of how to address real-life case studies and how to develop appropriate methods for specific problems. We excluded papers in which the main focus was not on SVM models.
  • Second, to consider real case studies selected based on the contribution of ML models including SVM for assisting clinicians in diagnosing chronic diseases (for instance, glaucoma). These papers can provide insights into a specific medical applications, such as the diagnosis and prognosis of certain cancers and chronic diseases such as glaucoma and sleep apnea, as well as the estimation of brain age from neuroimaging data. It emerged that when several ML methods were tested, SVM was not always the most effective.
  • Third, we believe that this review can help in developing new approaches based on SVM models. The presented taxonomy should be useful for identifying potential pitfalls and in determining which approaches could be combined into hybrid algorithms to further improve results.
The rest of this paper is organised as follows. Section 2 provides a brief theoretical background on basic SVM models and contemporary SVM-based approaches. This section describes several challenging issues, such as methods for enhancing SVM performance with large-scale datasets and tackling imbalanced data classification problems. Section 3 reviews relevant papers that have proposed new ML models based on SVMs and evaluated their effectiveness on medical/biomedical benchmark datasets. Typically, these studies include comparisons with state-of-the-art methods to validate the novel approaches. Here, we report only some of the compared ML models. Section 4 surveys papers that utilized real-life data to measure the impact of their findings on patient outcomes, for example, to develop clinical decision support systems in order to facilitate self-disease management and aid healthcare professionals in decision-making. Section 5 surveys papers that employed SVM models to predict various healthcare aspects, such as hospital readmissions, patient length of stay, mortality rates, and negative outcomes in home health care. These predictions encompass a range of diseases, including the notable case of COVID-19. Finally, Section 6 presents several interesting future directions.
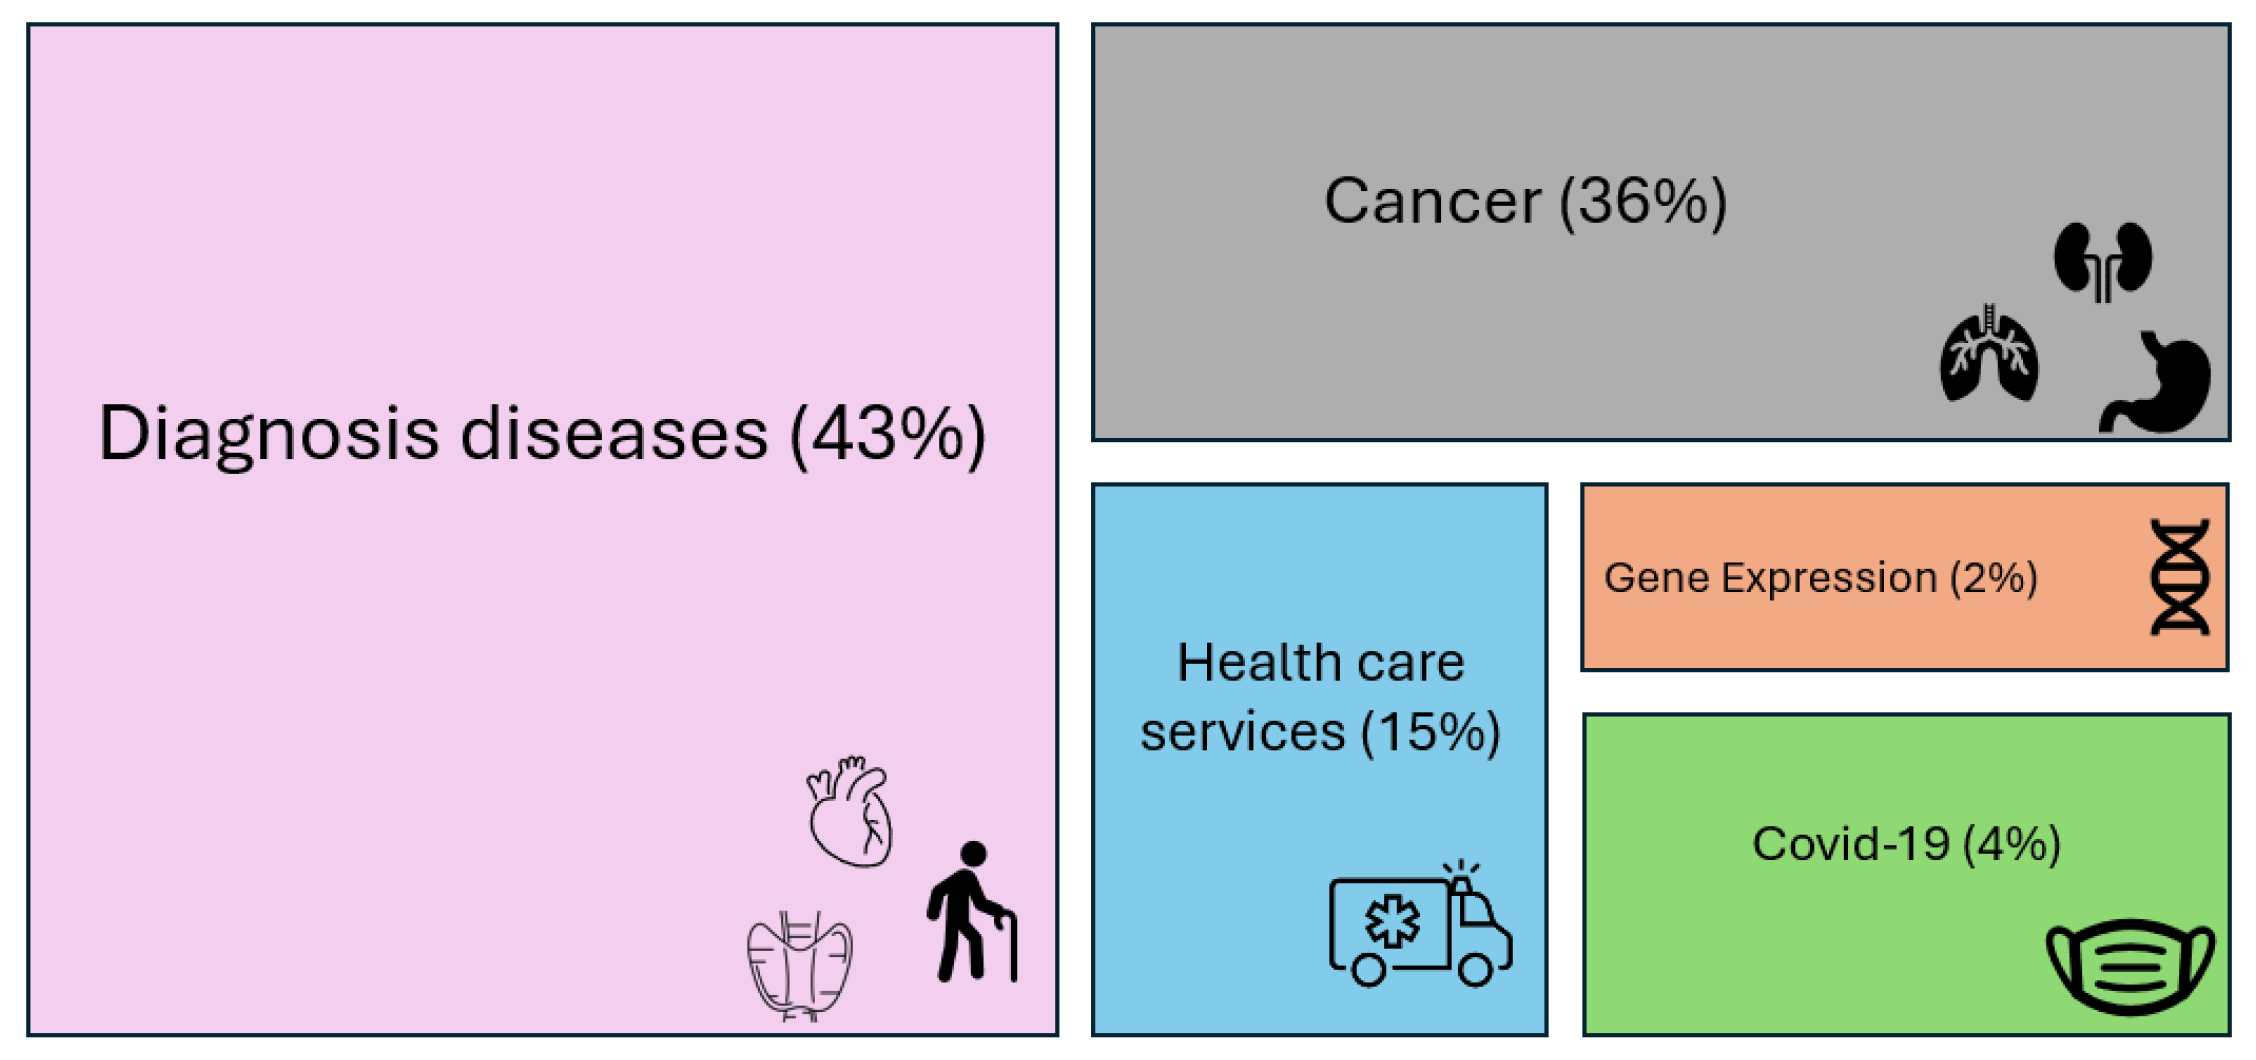
The 92 papers reviewed in the following sections are distributed as reported in Figure 3.

2. Background on Classical SVM and Overview of SVM Model Developments

SVM is one of the most widely used ML algorithms, and is based on statistical learning theory [15,16,17,18]. It was originally designed for binary classification problems, then extended for multi-class problems. Figure 4 shows a simplified graphical representation of a binary classification problem solved by SVM.
In the healthcare domain, binary classification problems involve diagnosing a disease, while multi-class classification deals with predicting disease progression. SVMs have proven particularly adept at handling complex medical data due to their ability to address nonlinear relationships between features and classes.
The key strength of an SVM classifier lies in its ability to identify an optimized decision boundary representing the largest separation (maximum margin) between classes. The creation of the optimal hyperplane is influenced by only a small subset of training samples, known as support vectors (SVs), which are the pivotal data structure in an SVM. This means that the training samples that are not relevant to the SVs can be removed without affecting the construction of the SVM’s decision function, that is, the optimal hyperplane. SVMs were initially used to tackle linearly separable problems, with their capabilities later extended to handle nonlinear ones. For nonlinear problems, samples are mapped from a finite-dimensional space to a higher-dimension space.
In a classification problem, let D be a dataset, represented as pairs of patterns D = { ( x 1 , y 1 ) , ( x 2 , y 2 ) , , ( x l , y l ) } , where x i n is an instance with n features and y i is the related class label. A pattern (also called a data point or vector) is an example, which in a binary classification problem can be either positive (denoted by a label y = 1 ) or negative (denoted by y = 1 ); the goal of a binary classifier is to map the feature vectors x X to the class labels y { 1 , 1 } . In terms of functions, a binary classifier can be written as h ( x ) = s i g n [ p ( x ) ] , where the function p : X R is denoted as the classifier predictor. It searches for an optimal hyperplane that separates the patterns of two classes by maximizing the margin. In a dataset that is not linearly separable, the SVM essentially maps the inputs into higher-dimensional feature spaces using so-called kernel functions. A possible separating hyperplane in the transformed higher-dimensional feature space can be represented as
w T ϕ ( x i ) + b = 0
where w n is the weight vector normal to the hyperplane and b .
Often, datasets may not be completely linearly separable even when mapped into a higher dimensional feature space; therefore, a set of slack variables ξ i is introduced. Each slack variable ξ i 0 corresponds to a misclassified example i, i.e., it measures the violation of a constraint corresponding to the training point x i . The classical SVM classifiers are known as “maximum margin” classifiers, as they attempt to reduce the generalisation error by maximizing the margin between two disjoint half-planes. Finding the optimal hyperplane means solving the quadratic programming model (1)–(3), called a soft margin optimization problem:
m i n 1 2 | | w | | 2 + C i = 1 l ξ i
y i ( w T ϕ ( x i ) + b ) 1 + ξ i 0 i = 1 , , l
ξ i 0 i = 1 , , l
where the penalty parameter C is a user-specified parameter and represents a trade-off between the two objectives, that is, maximum size of the margin and minimum sum of the slack variables. This is called the regularization term.
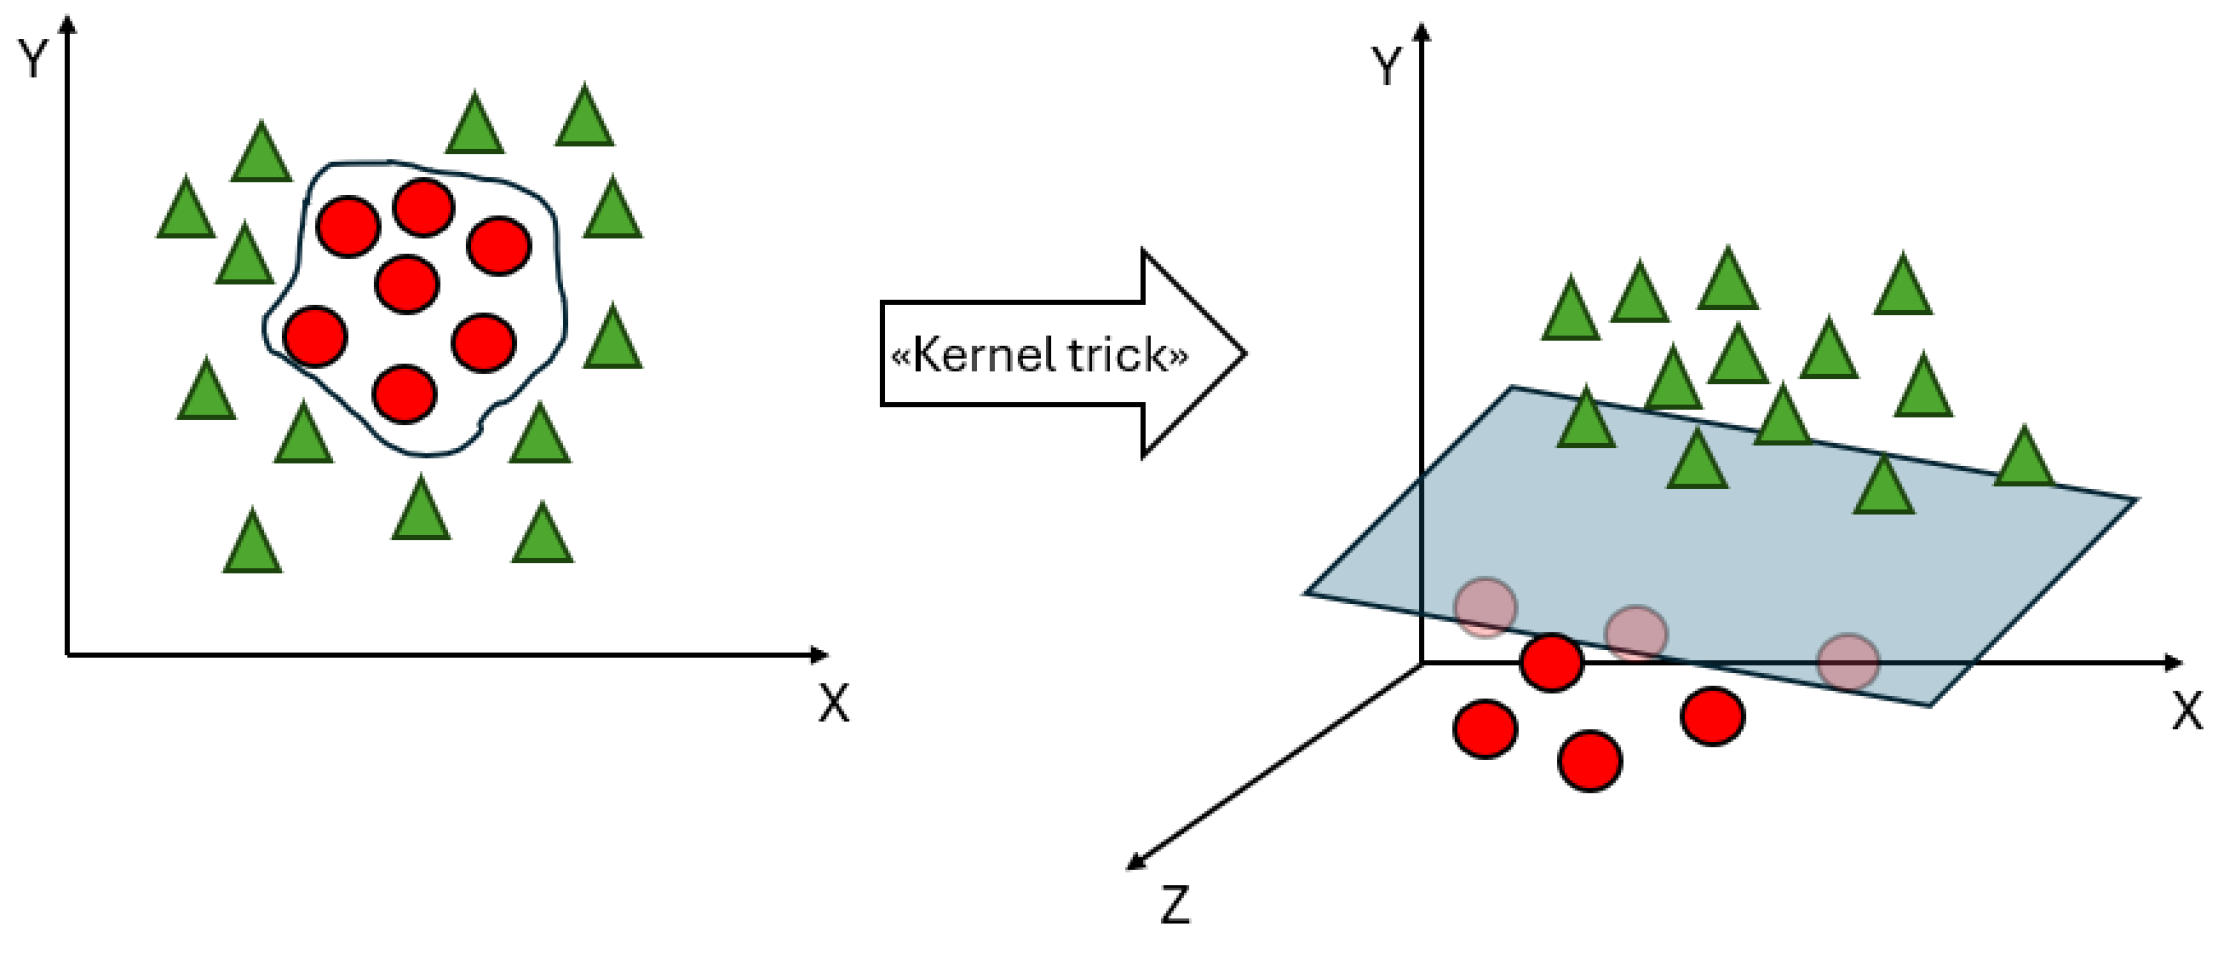
To deal with datasets that are not linearly separable, kernel functions are introduced in the SVM. Figure 5 shows an example of the introduction of a kernel function, denoted as the “kernel trick”, which can make a dataset linearly separable in a feature space of a higher dimension than the input space. A kernel function denotes an inner product in a feature space; it measures the similarity between any pair of inputs x i and x j , and is usually denoted as K ( x i , x j ) = ϕ ( x i ) , ϕ ( x j ) [19]. Classical kernel functions include polynomial kernel K ( x i , x j ) = ( x i , x j + 1 ) d , radial basis function (RBF) kernel K ( x i , x j ) = e x p ( γ | | x i x j | | 2 ) , and sigmoid function K ( x i , x j ) = t a n h ( γ x i , x j + c ) . Linear kernels are a special case of polynomial kernels; the degree d is set to 1, and they compute the similarity in the input space, whereas other kernel functions compute the similarity in the feature space. The choice of a suitable kernel function depends on both the specific problem and the characteristics of the data. The choice of an appropriate kernel function can significantly impact the performance of SVMs.
As mentioned earlier, a conventional SVM solves a complex Quadratic Programming Problem (QPP) with inequality constraints in order to construct an optimal separating hyperplane that maximizes the margin between two classes; however, obtaining the solution to such a QPP poses a significant challenge. The dual formulation of SVM relies on the size of the training dataset, with all data points contributing constraints to the QPP. One major drawback of SVMs is their rapid growth in training time as the number of data points increases. The computational complexity of an SVM is O ( l 3 ) for a training dataset of size l, making it computationally expensive. Another important issue is that SVMs are based on the minimization of a symmetric loss function (the hinge loss), which is cost-insensitive. This means that it is assumed that all misclassifications have the same cost. In addition, the performance of an SVM is greatly influenced by the choice of the kernel functions and the associated parameters.
In the following sections, we review different developments involving SVMs that have aimed to improve performance metrics by addressing the aforementioned drawbacks. Specifically, we underline how SVMs can address multi-class classification problems and identify SVM-based models that have been developed to solve important issues around training time, identification of redundant data points, and classifying imbalanced datasets.

2.1. SVM Model Developments

A new SVM model called ν -SVM was introduced in [20], with the following form:
min w , b , ρ , ξ 1 2 w 2 ν ρ + 1 l i = 1 l ξ i ,
y i w x i + b ρ ξ i ,
ξ i 0 , ρ 0 , i = 1 , , l ,
where the parameter ν controls the number of SVs and the variable ρ is the parameter to be optimised.

2.1.1. Multi-Class Classification Problems

For multi-class classification problems, there are several approaches. One approach to address an m-class problem with a conventional SVM involves converting it into n two-class problems, i.e., the One-to-Rest approach, while another involves finding k ( k 1 ) / 2 classifiers, also known as pairwise classification. For the k-th two-class problem, class k is separated from the remaining classes. To resolve unclassifiable regions, fuzzy SVMs (FSVMs) have been developed for conventional one-to-( k 1 ) formulation [21]. The superiority of this method over conventional SVM has even been tested on two medical benchmark datasets consisting of thyroid data and blood cell data.

2.1.2. Speed Improvement

The major drawback of standard SVMs is the large amount of training time required. In the case of very large datasets, learning with a classical SVM cannot be accomplished in a reasonable time due to the dimension of kernel matrix. To solve this issue, two SVM-based models proposed in the literature are the least-squares SVM (LS-SVM), introduced in [22], and Proximal SVM (PSVM), introduced in [23]. LS-SVM seeks to minimize the least square error and maximize the margin. The objective function of the PSVM has an additional proximal term that promotes sparsity in the solution. This term can be interpreted as regularized least squares. The algorithm assigns datasets to the corresponding class of the hyperplane closest to them. The PSVM formulation employs strong convex objective functions, resulting in a more interpretable model and potentially better generalisation performance, particularly in high-dimensional or sparse feature spaces. Additionally, the algorithm is fast and straightforward, requiring only a single system of linear equations to be solved.

2.1.3. Identification of Redundant Data Points

One of the primary challenges faced by SVMs is the accurate and efficient identification of redundant data points within a given training dataset. Several approaches have been proposed to reduce the amount of computation overhead involved in training an SVM, as there are increased computational costs in solving QPPs when dealing with complex data. Birzhandi et al. [24] conducted a survey of state-of-the-art methods for reducing the number of training data points and increasing the speed of an SVM. According to the approach used for data reduction, existing methods can be categorized into five types: clustering-based, geometrical, distance-based, random sampling, and evolutionary approaches. For instance, one of these models is the generalized eigenvalue proximal SVM (GEP-SVM) proposed by Mangasarian and Wild [25] as a non-parallel plane classifier for binary data classification. Data points from each class are in close proximity to one of two non-parallel planes. These non-parallel planes represent eigenvectors associated with the smallest eigenvalues of two interconnected generalized eigenvalue problems. Yao et al. [26] introduced a novel approach that combines a clustering algorithm with SVM, effectively reducing its complexity. Birzhandi et al. [27] developed the concept of parallel hyperplanes to efficiently omit redundant data points, leading to a significant reduction in training time.

2.1.4. Twin SVM

Another method that generates two non-parallel planes is the twin SVM (TWSVM) proposed in [28]. A TWSVM classifier assigns the class of a given data point according to the distance from its corresponding hyperplane, classifying the data point into the closest class. TWSVMs has several advantages over traditional SVMs, including in terms of speed and generalisation performance, and has a different formulation from that of GEP-SVMs. TWSVM obtains non-parallel planes around which the data points of the corresponding class are grouped; these two pairs of nonparallel hyperplanes can be represented as follows:
w 1 T x + b 1 = 0 , a n d w 2 T x + b 2 = 0
where the first hyperplane is as close as possible to the positive-class data points, represented by a matrix A R m 1 x n , and as far as possible from the negative-class data points, represented by a matrix B R m 2 x n , while the opposite holds for the second hyperplane. The two QPPs to be solved have the same formulation as a typical SVM except that not all patterns appear simultaneously in the constraints of both problems. The formulations of these QPPs are as follows:
( T W S V M 1 ) M i n w 1 , b 1 , q 1 2 ( A w 1 + e 1 b 1 ) T ( A w 1 + e 1 b 1 ) + C 1 e 2 T ξ 1 s u b j e c t t o ( B w 1 + e 2 b 1 ) + ξ 1 e 2 , ξ 1 0 ,
( T W S V M 2 ) M i n w 2 , b 2 , q 1 2 ( B w 2 + e 2 b 2 ) T ( B w 2 + e 2 b 2 ) + C 2 e 1 T ξ 2 s u b j e c t t o ( A w 2 + e 1 b 2 ) + ξ 2 e 1 , ξ 2 0 ,
where C 1 , C 2 > 0 are parameters and e 1 and e 2 are vectors of ones with appropriate dimensions. A graphical representation of a TWSVM is shown in Figure 6.
Recent review papers have reported the latest research progress on the theory of TWSVMs, including their evolution, eleven different variants, and their respective properties, limitations, and advantages [29,30,31]. Furthermore, although still in a primitive stage of development, the main applications of the variants of TWSVM lie in the medical field. Most papers have dealt with classification problems involving electroencephalograms (EEG) and Alzheimer’s disease (AD) prediction, as reported in the next section. A new approach called multi-task least-squares twin support vector machine (MTLS-TWSVM) has been proposed as a least squares variant of the direct multi-task TWSVM (DM-TWSVM) [32].

2.2. Imbalanced Datasets and Cost-Sensitive SVMs

In the healthcare field, there are a very large number of imbalanced datasets. A simple example is the large number of patients with no rare disease. Most real-life datasets have classes that are not evenly distributed, that is, they are imbalanced. This topic is known in the literature as class imbalance learning [33]. The larger class is named the majority class, while the smaller class is the minority. How to obtain an accurate prediction from such a dataset is a subject of ongoing research, as most current classifiers tend to predict the majority class and ignore the minority class. This occurs because a classifier attempts to reduce the overall error, and the classification error does not take into account the underlying data distribution. As a consequence, there is usually a lack of accuracy for minor class. The misclassification of the minority target class has serious consequences in healthcare, such as when positive cases are erroneously predicted as not positive when attempting to detect chronic diseases. As an example, consider a dataset of 1000 patients in which 900 out of 1000 patients have no disease and the remaining 100 have disease. If a model has an accuracy of 90%, it is necessary to evaluate its sensitivity. If the sensitivity is 0, then all 100 patients with disease will be misclassified. The aim of the different approaches developed in the literature is to reduce the effects of the imbalance ratio in order to improve the sensitivity of ML approaches to the minority class. Useful in this regard is the recent review paper by Haixiang et al. [34], where 527 papers related to imbalanced learning and rare event detection typical of medical and biomedical datasets were analysed from both a technical and a practical perspective. Typically, higher costs are used to misclassify instances of a minority class than instances of a majority class. The commonly used approaches for handling imbalanced data can be divided in data-level approaches, which rely on preprocessing and are sometimes called external methods, and algorithmic-level approaches, also called internal methods. Data-level approaches modify the data distribution to produce a balanced dataset, whereas algorithmic-level approaches involve modifying the classical classification algorithms. An example of a sampling-based technique is the Synthetic Minority Over-sampling Technique (SMOTE) [35], an oversampling algorithm that employs the k-nearest neighbour (kNN) technique to over-sample the minority class by creating synthetic samples. Other data-level approaches for rebalancing class distributions include random over-sampling and random under-sampling. Random over-sampling replicates instances of the minority class, while random under-sampling eliminates instances of the majority class. However, it is important to note that both methods have disadvantages. Random over-sampling can lead to problems with overfitting due to the replication of instances, while random under-sampling may discard potentially useful information by removing instances. Algorithmic-level approaches involve modifications to algorithms and cost-sensitive approaches.
Standard methods such as SVM and TWSVM are sensitive to imbalanced datasets, potentially leading to suboptimal results. Regular SVMs do not perform well on imbalanced data, as the resulting models tend to be trained with respect to the majority class and technically ignore the minority class. Different methods have been developed in the literature to handle the class imbalance problem for SVMs, such as the multilevel weighted SVM (MLW-SVM) and Fuzzy SVM for Class Imbalance Learning (FSVM-CIL) settings. Results have shown that FSVM-CIL outperforms other standard SVM methods such as random oversampling, random undersampling, and SMOTE in terms of classification accuracy.
The biased penalties (B-SVM) method, also known as cost-sensitive SVM, was introduced in [36]. Two penalty weights C + and C are introduced for the positive and negative SVM slack variables during training. The basic SVM is
m i n 1 2 | | w | | 2 + C + i : y i = 1 ξ i + C i : y i = 1 ξ i ,
y i ( w T ϕ ( x i ) + b ) 1 + ξ i 0 i = 1 , , l ,
ξ i 0 i = 1 , , l .
Iranmehr et al. [37] proposed an alternative strategy for the design of SVMs, seeking to optimize the classifier with respect to class imbalance or class costs. In this approach, Bayesian consistency is guaranteed by drawing connections between risk minimization and probability elicitation. Moreover, by performing experimental analysis of class imbalance and cost-sensitive learning with given class and example costs, the results showed that the algorithm provides superior generalisation performance compared to conventional methods.
Universum has become a new research topic in ML [38]. It consists of a collection of non-examples that do not belong to any class of interest. To improve the abilities of TWSVMs on imbalanced datasets, universum learning has been incorporated with SVM to solve the problem of class imbalance. The resulting model is called reduced universum TWSVM for class imbalance learning (RUTWSVM-CIL) [39]. The universum data points are used to provide prior information about the data, while both oversampling and undersampling techniques are applied to remove the imbalance between the classes.
One of the drawbacks of all TWSVM-based models is that they need to invert a matrix; this operation is computationally expensive, and the matrix may not be invertible. RU-TWSVM was improved in [40] (IRU-TWSVM) by reducing the size of the kernel matrix, thereby avoiding the computation of inverse matrices and reducing the computation time. IRU-TWSVM outperformed the TWSVM, U-TWSVM, and RU-TWSVM algorithms in terms of generalisation performance on benchmark datasets.

2.3. Multiclassifiers

Multiclassifier approaches involve combining the predictions of multiple classifiers to make a final prediction, by which the overall performance of a single model is increased. In healthcare, this approach is used mainly when there is not a single classifier that is best suited to make a prediction or when multiple classifiers can provide complementary information. The basic idea behind the multiclassifier approach is that the combination of multiple classifiers can lead to improved prediction accuracy compared to using a single classifier.
A common approach is ensemble learning, in which multiple classifiers are trained on the same data and their predictions are combined using methods such as majority voting [41], weighted voting or stacking. Another approach is to use multiple classifiers to make predictions about different aspects of the data and then combine these predictions to make a final prediction. There are six common types of ensemble learning models: Bayesian optimal classification, boosting, bootstrap aggregation (bagging), Bayesian model averaging, Bayesian model combining, and stacking.

2.4. Performance Analysis

Standard performance metrics are based on confusion matrices, and usually on K-fold cross-validation (K-CV) techniques. The leave-one-out CV method is usually utilised for small datasets, with k equal to the number of instances of the dataset. It has been observed that papers sometimes fail to report the value of K when using a K-CV, which can hinder proper comparison of results. In classification problems, the confusion matrix results in true positives, true negatives, false positives, and false negatives. The number of true positives (TP) represents the number of instances that were predicted as positive and were actually positive. False positives (FP) are those examples that were predicted as positive but were actually negative. False negatives (FN) are the examples that were predicted as negative but were actually positive. Finally, true negatives (TN) are the examples that were predicted as negative and were actually negative.
The most widely used performance metrics are the classification accuracy, sensitivity (also known as recall), specificity, geometric mean, and Matthews correlation coefficient. The classification accuracy is the ratio of the number of instances that were correctly classified to the total number of instances. The sensitivity (or precision) measures the proportion of actual positives which were correctly identified as such. The specificity measures the proportion of negatives which were correctly identified. The geometric mean, Matthews Correlation Coefficient (MCC), and F 1 score are metrics specific to imbalanced learning. The MCC falls within the range 1 , 1 , and is an appropriate measure for evaluating the classification accuracy on imbalanced datasets. A higher the MCC value indicates better performance of the classifier. The F 1 score is calculated as the harmonic mean of the precision and recall, which is 1 S P ; it ranges from 0–100%, with a higher score denoting a better classifier.
Let y i be the actual value and let y ˜ i be the predicted value of the i-th instance in a regression problem. The most commonly metrics used for regression problems are the mean squared error (MSE), root mean squared error (RMSE), and mean absolute error (MAE). As error measures, smaller values indicate better model performance. The MSE measures the average squared difference between the actual and predicted values. It gives greater weight to larger errors. The RMSE is the square root of the MSE, and provides an interpretable measure in the same units as the target variable. The MAE measures the average absolute difference between the actual and predicted values, and provides a more interpretable measure than the MSE. The coefficient of determination R 2 measures how much of the variance of a dependent variable can be predicted from its independent variables. R 2 is computed considering the mean value y ¯ of the observed data. The regression curve is considered a good fit if R 2 is close to 1.
The formulations for these performance metrics are shown in Table 1.
A further important metric is the receiver operating characteristic (ROC) curve [42], which is a plot of the true positive rate against the false positive rate for different threshold values. Usually, the area under the curve (AUC) is used as the performance metric.

3. SVM-Based Models for Diagnosis and Prognosis of Diseases

This section surveys papers proposing new ML models based on SVMs and addresses specific questions related to benchmark datasets, real datasets, and imbalanced datasets. Efficient models for diseases diagnosis remain a challenge. This aspect explains the large number of variants of SVM-based models that have been developed over the years. In addition, it is necessary to compare the effectiveness of the proposed approaches with other ML models in order to evaluate them, as highlighted in the papers reviewed below. Researchers often aim to maximise classification accuracy, sensitivity, and specificity. The performance of each algorithm depends on various model configurations, parameter and hyperparameter settings, and the partition between the training and testing sets. Other factors that strongly affect model performance are feature selection and scaling techniques. Limiting the number of input features in a classifier is advantageous for improving predictive ability and reducing computational time. Several papers have reported that high levels of accuracy can be achieved through the use of feature selection techniques, scaling techniques, or optimization approaches.
In this section, we first present some results on benchmark datasets of SVM-based models. These datasets allow ML approaches to be tested and compared in order to evaluate their performance. Next, several twin SVM-based models are presented to cover the improvements that they offer in terms of computational time and performance. Finally, we review innovative approaches based on SVM that are useful in addressing imbalanced benchmark datasets.

3.1. Benchmark Datasets

The most popular benchmark datasets in the medical field are from the University of California at Irvine (UCI) ML repository [43] and the Knowledge Extraction based on Evolutionary Learning (KEEL-dataset) repository http://www.keel.es/, accessed on 15 February 2024 [44].
Table 2 gathers the characteristics of the benchmark datasets most frequently used in the papers reviewed in this section. The first seven datasets refer to cancers, with the first three being related to microarray gene expressions. The other datasets are used for diagnosis of other diseases.
Figure 7 depicts several kinds of benchmark datasets considering specific features, for instance, handwritten images for Parkinson’s disease. ML approaches are widely used to predict and diagnose diseases such as cancers. The diagnosis of breast cancer is crucial, as the classification results have a direct impact on the treatment and safety of patients. Achieving high accuracy, reliability, and robustness is a challenge for researchers. There are several cancer datasets in the literature. A common dataset used for breast cancer classification is the Wisconsin Breast Cancer Diagnostic (WBCD) dataset from UCI, which was introduced in [45]. The purpose of this classification is to distinguish between benign and malignant tumours by analysing features extracted from images of the cell nuclei of a fine needle aspirate of a breast mass. The dataset has 569 instances: 357 cases of benign tumours and 212 cases of malignant tumours. Sweilam et al. [46] conducted a comparative study to measure the effectiveness of different methods for SVM training. The methods were Particle Swarm Optimisation (PSO), which is a population-based heuristic search technique, Quantum Behaved Particle Swarm, Quadratic Program, and LS-SVM. The first two techniques showed slightly higher overall accuracy (93.52–93.06%) than the other two considering a 40–60% training test partition. Badr et al. [47] analysed the impact of scaling on SVMs by evaluating and comparing the de Buchet, Lp-norm, entropy, and normalization scaling techniques. The highest accuracy of 98.6% was achieved with de Buchet scaling, which outperformed to the standard normalization technique. A grid search to set the RBF kernel parameter and C was adopted. Similarly, Almotairi et al. [48] analysed the impact of four scaling techniques on a hybrid classifier that combined an SVM with Harris’s Hawk Optimisation (HHO), a metaheuristic algorithm. The HHO algorithm was used to search for the best SVM parameters. The hybrid classifier was tested on the WBCD and outperformed an SVM with parameter values found by a conventional grid search technique. Furthermore, the approach with normalization scaling achieved an accuracy rate of 98.24%, while the one with equilibration scaling outperformed ten results reported in the literature with an accuracy rate of 99.47%. Akay [49] achieved even higher accuracy with an SVM model that used only five features. The highest classification accuracy reported was 99.51%.
The Wisconsin Breast Cancer (WBC) original dataset from the UCI ML repository dataset is another common dataset for breast cancer classification differing from the WBCD. It comprises 699 instances, of which 458 cases are benign and 241 are malignant. Because 16 instances contain incomplete features, they are usually rejected and a dataset with 683 instances is considered. As the WBC is unbalanced, some authors have used the Matthews correlation coefficient as an appropriate measure for evaluating the classification accuracy of unbalanced positive and negative samples. Polat and Günes [50] observed that a great variety of methods have been used on this dataset and that high classification accuracy has been achieved. Nonetheless, they were able to improve the accuracy up to 98.53% using an LS-SVMs with a ten-fold CV. The lowest values were found with 50–50%, 70–30%, and 80–20% training–testing partitions. The main difference between SVMs and LS-SVMs, as described earlier in Section 2, is that LS-SVMs use a set of linear equations for training while SVMs use a quadratic optimisation problem. Interesting approaches were developed in [51,52,53,54,55]. Islam et al. [51] used an SVM and a K-NN, finding an MCC of 0.99 and an accuracy of 98.57% and 97.14% with SVM and K-NN, respectively. In [56], a high accuracy of 99.3% was achieved with a polynomial SVM. The authors developed data exploratory techniques (DET) and four different prediction models. The four layers of DET used to identify the robust feature classification into malignant and benign classes were feature distribution, correlation, elimination, and hyperparameter optimisation. Logistic regression, KNN, and ensemble classifier had lower accuracy than SVM. Azar and El-Said [52] summarised the main accuracy results reported in several papers related to this dataset. They tested and compared the standard SVM with a proximal SVM classifier, Lagrangian SVM (L-SVM), Finite Newton’s Method for L-SVM (NSVM), Linear Programming SVM (LP-SVM), and Smooth SVM (SSVM). The results suggested that the best classifier was LP-SVM, with an ROC value of 0.9938 and MCC of 0.9369, outperforming other classifiers. To improve accuracy, Kamel and Kheirabadi [53] combined an SVM with a feature selection method using Gray Wolf Optimization (GWO), which is a metaheuristic algorithm inspired by the hierarchical structure and social behaviour of hunting wolves. The accuracy, sensitivity, and specificity were 100% compared to other algorithms. Singh et al. [54] proposed a hybrid meta-heuristic swarm intelligence-based SVM called the Grey Wolf–Whale Optimization Algorithm (GWWOA) using SVM with an RBF kernel for early-stage detection of disease. The highest accuracy was 97.72%. Indraswari and Arifin [57] improved the accuracy on this dataset using a method that optimises the weight of the input data and the RBF kernel with PSO based on analysing the movement of the input data. This method has lower complexity compared to other SVM optimisation methods, resulting in faster run times. Elkorany et al. [55] introduced the Whale Optimization Algorithm combined with an SVM (WOA-SVM) and Dragonfly Algorithm (DA-SVM) techniques. These approaches were tested on both of the Wisconsin breast cancer datasets, and outperformed a traditional SVM classifier along with existing techniques such as PSO, GA-SVM, ACO-SVM, and other approaches considering the AUC, sensitivity, and specificity. They achieved an accuracy of 99.65% and 100% for the WBCD and WBC datasets, respectively, when selecting the optimal SVM parameters of the RBF kernel using optimization strategies with a 50–50 partition ratio. Lower accuracy was found with 10-CV, as reported in Table 3; however, as underlined by the authors, a long training time is required for larger datasets.
Table 3 summarises the developments of SVM methods and the results in terms of accuracy on the WBCD dataset and WBC original dataset.

3.1.1. Ensemble Methods

Among the papers developing ensemble methods, we have selected the following. Conforti and Guido [59] constructed an optimal kernel matrix for classification problems using a semidefinite programming approach. An improvement in accuracy over a single kernel matrix was found on tested benchmark datasets of diagnostic problems such as WBCD, heart disease, thyroid, and three microarray gene expression datasets for leukemia, colon cancer, and ovarian cancer. Wang et al. [60] developed an SVM-based ensemble model based on C-SVM, ν -SVM, and six types of kernel function. It was tested on three breast cancer datasets: WBCD, the original WBC dataset, and the SEER breast cancer dataset, which contains 800,000 instances and was collected by the National Cancer Institutes Surveillance, Epidemiology, and End Results (SEER) programme. A Weighted Area Under the ROC Curve Ensemble (WAUCE) mechanism was proposed for model hybridization. The approach outperformed existing ensemble models from the literature.
Blanco et al. [61] introduced an approach combining SVM with clustering analysis to identify incorrect labels, minimize misclassification errors, and penalize relabelling. When tested on various UCI datasets such as WBCD, Parkinson’s disease, and Heart disease, it outperformed both the Confident Learning approach, which is a specialized method designed to detect noisy labels, and classical SVM, particularly in cases involving corrupted training datasets. Furthermore, it effectively detected and relabelled outliers that could adversely affect the classifier’s performance.
The Pima Indian Diabetes Dataset, commonly used for predicting diabetes, comprises female patients aged 21 or older, including 500 without diabetes and 268 with diabetes. In their study on enhancing Type 2 Diabetes classification, Reza et al. [62] utilized an SVM with a combination of linear, RBF, and RBF city block kernels. They addressed missing values by imputing the median, removed outliers, and balanced the data using SMOTE. The integrated kernels outperformed others when tested on the Pima Indian dataset, achieving the highest accuracy (85.5%), F 1 score (85.2%), and AUC (85.5%). This performance surpassed approaches such as Decision Tree, SVM, and Naive Bayes applied by Sisodia and Sisodia [63].

3.1.2. Gene Expression Datasets

Gene expression datasets are characterised by thousands of features and a few instances, which are the number of individuals sampled. The aim is to identify the informative genes, i.e. those with expression levels that correlate strongly with the class distinction. Gene selection helps to reduce dimension of the gene expression data, thereby improving training time. In addition, gene selection improves the classification accuracy, as it removes a large number of irrelevant genes. SVM-based recursive feature elimination (SVM-RFE) is a method for gene selection proposed by Guyon et al. [64]. However, it suffers from a heavy computational burden and high computational complexity, as it requires training an SVM algorithm d times on l instances of d k + 1 -dimensions, where k is the k-th SVM trained. Ding et al. [65] improved SVM-RFE through the optimized extreme learning machine-based RFE (OELM-RFE) model, which requires only one tuning parameter, namely, the penalty constant C. This approach was evaluated on the publicly available colon tumor and leukemia binary datasets as well as on the Splice dataset to recognize two types of splice junctions in DNA sequences. The classification algorithms employed as the evaluated function were SVM, SVM without bias, and OELM. OELM-RFE had slightly lower performance than SVM-RFE on the two UCI datasets, though not on the gene expression datasets. However, in terms of predictive performance, OELM-RFE outperformed SVM-RFE.

3.1.3. Tuning of Parameters and Computational Time

Parameter tuning is a phase that affects model performance. The most commonly used approaches are grid search algorithms and SVM parameter optimisation based on swarm intelligence algorithms. The use of grid search algorithms is time consuming, and the performance of the resulting SVM depends on the grid size. In the literature, genetic algorithms (GAs) have been used as a swarm intelligence algorithm. The disadvantages of this approach are slow convergence and high computational cost.
Several approaches have been developed to reduce computational time and improve performance. These approaches are often based on combining SVM with other ML methods. Yao et al. [26] proposed building SVM classifiers using training samples selected through a K-means clustering algorithm. This approach, named K-SVM, reduces the size of the training set and the computational time considerably with respect to LIBSVM, as shown by computational experiments carried out on three benchmarks from the UCI repository, i.e., the WBCD, Heart, and BUPA Liver Disorders datasets (the latter of which is used to classify liver disorders caused by excessive daily use of alcohol via blood tests). Another interesting work applied a new version of the global relaxation cross-validation algorithm (GRCV) to select the hyperparameter C in L2-loss SVM, in which semi-smooth Newton algorithm was used [66]. From the numerical tests conducted on datasets in the LibSVM [67] collection such as Heart, Breast-Cancer, Colon-Cancer, and Diabetes, it turned out that the solution returned by the GRCV-l2 approach was significantly better than the inexact cross-validation method and the grid search method. Zheng et al. [58] used the K-means algorithm to recognize the hidden patterns of benign and malignant tumors separately in the WBCD. The resulting K-SVM reduced the number of features to six and reached an accuracy of 97.38%. Huong et al. [68] joined a convolutional neural network (CNN) and an SVM for a five-class classification of cervical pap smear images. They tested three different CNN models: AlexNet, VGG19, and ResNet50. The SVM was combined with the error-correcting output codes (ECOC) model to decompose the multiclass problem into several binary ones. Using a benchmark dataset containing 917 single cervical cell images downloaded from Herlev University, the AlexNet-SVM model demonstrated better estimation performance, showing high sensitivity and specificity, good reproducibility, and a fast training speed.
Ke et al. [69] proposed a general maximum margin hypersphere SVM classifier (MMHS-SVM) for binary classification problems. They formulated an optimization model to identify two hyperspheres simultaneously while maximizing the square of the difference between two class centers. An SMO-type algorithm was used to reduce the computing time and storage space. The model was the best classifier in terms of average accuracy on nine out of twelve benchmark medical datasets from the UCI repository, including Hepatitis, Bupa, WBCD, and Pima Indian, compared to other variants of SVM that considered hyperspheres. Yan and Li [70] proposed an augmented Lagrangian method to solve the primal form of the L1-loss model for support vector classification and the ϵ -L1-loss model for support vector regression. The resulting subproblem was solved using the semi-smooth Newton’s method. The method was tested on LIBLINEAR datasets, including Leukemia, Breast-Cancer, and Diabetes, and compared to the competitive solver Dual Coordinate Decrescent method (DCD). The authors’ approach exhibited superior performance in terms of both accuracy and speed, achieving equal or higher accuracy while outperforming the DCD method in terms of CPU time. Groccia et al. [71] developed a multiclassifier systems framework to support diagnostic activities in the medical field. To improve diagnostic accuracy, several classification algorithms, including SVMs, DTs, and NNs were combine, and the most competent classifier was selected. The approach was tested on benchmark datasets such as the WBC, WBCD, Mammography-Mass, Diabetic-Retinopathy, and Dermatology datasets using stratified ten-fold CV. The results outperformed the state of the art in dynamic classifier selection techniques. For example, the highest accuracy achieved on WBCD was 98.24%, which was achieved by a pool of classifiers that included an SVM.
Table 4 summarises the ensemble methods developed with SVM models.

3.2. Twin SVM-Based Models

In the last two decades, researchers have developed different approaches based on TWSVM, which is faster compared to SVM, although it requires solving two QPPs. Peng [72] developed the ν -TWSVM, which effectively reduces the number of SVs, along with a geometric algorithm for TWSVM (GA-TWSVM). The computational results on the Heart, Diabetes, Thyroid, WBCD, and Pima Indian benchmark datasets demonstrated better generalisation performance and a faster learning speed than the classical SVM and TWSVM. The highest accuracy on WBCD was 98.25 ± 1.43, which was reached by GA-TWSVM.
Arun Kumar and Gopal [73] formulated a least squares version of TWSVM (LS-TWSVM), which is faster than TWSVM because it finds two non-parallel hyperplanes by solving two linear equations instead of the two QPPs in TWSVM. In this study, LS-TWSVM showed better generalisation performance as well. Tomar and Agarwal [74] proposed four novel multiclassifiers obtained by extending the formulation of the LS-TWSVM. They performed a comparative analysis with existing multiclassification approaches based on SVM and TWSVM in terms of advantages, disadvantages, and computational complexity on twelve benchmark datasets from the KEEL repository, showing that their proposed classifiers obtained better results. A recent effective and efficient algorithm for a multiclass classification problems is the twin K-class SVM with pinball loss (Pin-TKSVC) from [75]. This method solves two smaller sized QPPs to save running times, and is a more robust classifier. Despite TWSVM attracting much attention for its good generalisation ability and computational performance, the conventional grid search method has turned out to be a very time consuming way to obtain the optimal regularization parameter. Zhou et al. [76] developed TWSVMPath, which is a novel fast regularization parameter tuning algorithm for TWSVM. The problem is first transformed into two sub-optimization problems, demonstrating that the Lagrangian multipliers of two sub-optimization problems are piecewise linear to the regularization parameters and no QPP needs to be solved. The method was tested on eight UCI datasets from the medical field, and appeared to be very effective.
Among the several variants of TWSVM are the following:
  • Intuitionistic fuzzy TWSVM (IF-TWSVM) [77] assigns an intuitionistic fuzzy number (IFN) to each sample in order to analyze the outliers, handle noise and outliers, and optimize the objective function via optimization of a pair of QQPs.
  • Improved IFTWSVM (IIF-TWSVM) [78] reduces the effects of noise and outliers and minimizes the structural risk, which improves the generalisation performance. For the nonlinear case, it solves the exact formulation of the kernel, while approximate functions are solved in the IF-TWSVM.
  • Conditional probability TWSVM (CP-TWSVM) [79] returns the discriminant projections and conditional probability estimations of each class.
Malik et al. [80] demonstrated that IF-TWSVM has worse performance for Alzheimer’s disease prediction than the intuitionistic fuzzy random vector functional link network (IFRVFLN) employing an intuitionistic fuzzy membership (IFM) scheme and optimizing a system of linear equations. Indeed, IFRVFLN achieved better accuracy on benchmark datasets from the UCI and KEEL repository, such as the Heart-statlog and WPBC datasets, compared to IF-TWSVM. Similarly, on the Alzheimer’s Disease Neuroimaging Initiative (ADNI) dataset, a standardised MRI dataset, the average AUC (75.19%) was greater than the value computed by IF-TWSVM (AUC = 72.12%). The ADNI database was launched in 2003 as a public–private partnership. The main goal of the project was to study the Alzheimer’s disease through nueroimaging techniques. These images include magnetic resonance imaging (MRI) and positron emission tomography (PET) of subjects with different stages of Alzheimer’s disease. From the use of these data, the goal is to develop models for improving early detection of Alzheimer’s disease, monitoring disease progression, and facilitating the development of new therapies.
Bai et al. [81] proposed an IF-TWSVM for semi-supervised problems, which they called SIF-TWSVM. In an iterative procedure, unlabelled samples are evaluated by the proposed plane IFN and gradually learned according to the current decision environment. The model was tested on several benchmark datasets from the UCI database, including datasets from the medical field, and performed better than other variants of TWSVM. From the experimental results, it emerged that SIF-TWSVM was more competitive than other semi-supervised methods and that the proposed fuzzy techniques can greatly improve the performance of TWSVM.
A novel parametric model called universum least squares twin parametric-margin SVM (ULS-TPMSVM) was introduced in [82]. The solution of ULS-TPMSVM involves a system of linear equations, making it more efficient in terms of training time than algorithms such as TWSVM and ULS-TWSVM. The algorithm was tested with the Gaussian kernel function on benchmark datasets from the UCI and KEEL repositories, and showed high generalisation performance with less training time compared to algorithms such as TWSVM, LS-TWSVM, LSTPMSVM, and ULS-TWSVM. The authors then considered three classes of Alzheimer’s disease data, namely, control normal (CN), AD, and mild cognitive impairment (MCI). ULS-TPMSVM outperformed the other algorithms on two of the three datasets, CN vs. MCI and MCI vs. AD.
Ganaie et al. [78] proposed IIF-TWSVM and evaluated its performance on an EEG dataset and twelve KEEL datasets. A Gaussian kernel and a grid search method with 5-CV for tuning the parameters were used. The authors demonstrated that IIF-TWSVM had better performance compared ot other variants of TWSVM, achieving an average accuracy of 95.86% on the twelve KEEL datasets.
Moosaei et al. [83] compared several classifier methods based on TWSVM with their proposed method, a multi-task TWSVM with universum data (UM-TWSVM). They provided two approaches for its solution, one based on the dual formulation and a second on a least squares version of the model. With the second approach, called LS-UMTWSVM, the solution of the model was simplified, resulting in a quick and efficient approach for medical data. To ensure the stability of the problem, some studies, such as (8) and (9), have introduced a Tikhonov regularization term to their models. To compute the minimizers of these models, Lyaqini et al. [84] proposed a primal dual algorithm. Results on several UCI benchmarks, medical images of the UlcerDB and CVC-ClinicDB datasets, and HandPD datasets showed the effectiveness of the proposed approach. In particular, the proposed TWSVM outperformed popular deep learning models such as DenseNet121 and MobileNet considering small datasets, but required more computational resources and memory when constructing models for larger datasets.

Probability Machine Combined with TWSVM

The minimax probability machine (MPM) was introduced in [85,86] as an excellent discriminant classifier based on prior knowledge. Yang et al. [87] combined an MPM with TWSVM to obtain a twin MPM, which they named TWMPM. The authors developed a simple and effective algorithm that transforms the problem into concave fractional programming by applying multivariate Chebyshev inequality. The TWMPM was reformulated as a pair of QPs by appropriate mathematical transformations, resulting in a problem with a global optimal solution. Experiments conducted on UCI datasets from the medical field, including cancer and diabetes datasets, demonstrated that TWMPM had comparable performance to TWSVM. Another variant is the regularised Twin Minimax Probability Machine Classification (TMPMC) [88], which takes advantage of statistical information (mean and covariance of the samples) and constructs two non-parallel hyperplanes for final classification by solving two smaller SOCPs.
Jain and Rastogi [89] proposed parametric non-parallel SVMs (PN-SVMs) for binary pattern classification, taking inspiration from TWSVM. A second term in the objective function forces the hyperplane to be close to one class; in this way, the mean of this class projection is minimized. This model is very similar to the Pinball loss SVM (Pin-SVM) model proposed by Huang et al. [90], in which the idea was to penalize the correctly classified samples by introducing a parameter 1 / τ that keeps the correctly classified samples close to the separating hyperplane while at the same time maximizing the margin. The addition of the class projections in the objective function of the PN-SVM makes the model more time-efficient than the Pin-SVM. The datasets used to validate the model were obtained from the UCI repository, and included Thyroid, Heart-statlog, Breast-Cancer, and other datasets from the medical field. PN-SVM achieved better performance than TWSVM and Pin-SVM.
Shao et al. [79] developed a CP-TWSVM model that solves the problem of measurement consistency in TWSVM by avoiding the need to consider it through the use of probability estimation. Experiments carried out on benchmark and real-world datasets, including many in the medical field, showed CP-TWSVM to have better generalisation and interpretability than TWSVMs for both binary and multi-class classification problems.
Table 5 summarises the development of TWSVM-based models tested on medical benchmark datasets. In addition, for a complete overview of SVM and TWSVM developments discussed here, Table 6 summarises the most important SVM-based models and TWSVM-based models.

3.3. Benchmark Imbalanced Datasets

Imbalanced learning is a significant emerging problem in many areas, including medical diagnosis. Although the over-sampling and under-sampling techniques are useful to increase the prediction accuracy of the minority class, they may result in the loss of important information or add trivial information for classification, thereby affecting the prediction accuracy of the minority class. Jian et al. [91] developed a new sampling method based on SVs and nonsupport vectors (NSVs). The B-SVM model (see Section 2) was used to identify the SVs and NSVs of imbalanced data. Computational experiments performed on medical imbalanced datasets from UCI, Statlog, and other repositories, such as the Cod-RNA dataset with 488,565 samples and eight features, showed that the method had better performance in terms of the ROC curve, G-mean, and AUC value compared to four other methods, including SMOTE. Sain and Purnami [92] combined SMOTE and Tomek links, which is an under sampling method, with an SVM using a Gaussian kernel. They tested the method on four imbalanced benchmark medical data, including PIMA. The positive cases in the datasets were between 2.5–34.9%. The combined sampling had better performance in terms of the ROC, G–Mean, and F-measure than SMOTE and Tomek links alone. Ebenuwa et al. [93] proposed the Variance Ranking Attributes (VRAS) selection technique based on the intrinsic properties of each attribute for handling class imbalance problems in a binary classification context. The technique was compared to two attribute selection techniques, namely, Pearson correlation and information gain. The results demonstrated that the VRAS technique has a direct impact on the general accuracy of classification models, including SVM, when targeting the minority in an imbalanced dataset. However, a limitation of the VRAS techniques is that the variables must be numeric. Núñez et al. [94] proposed a low-cost post-processing strategy that calculates a new bias to adjust the function learned by the SVM, which is useful in case of imbalanced data. The bias modification approach has two advantages: (a) it avoids the need to introduce and tune new parameters; and (b) it modifies the standard optimization problem for SVM training. Results on benchmark datasets showed that the performance of this approach is comparable to the well-known cost-sensitive and SMOTE schemes without adding complexity or computational cost. In addition, the proposed approach achieved superior performance in terms of sensitivity. In the pilot work of Dubey et al. [95], MRI and proteomics modalities were used to systematically investigate the data imbalance issue in the ADNI dataset. Random Forest (RF) and SVM were used as classification methods. Experiments demonstrated the dominance of undersampling approaches over oversampling techniques and showed that performance metrics based on majority voting dominated the corresponding averaged metrics. SVM had better classification measures than RF in most cases.
Zhang and Zhong [96] proposed the weighted within-class scatter biased SVM (WWCS-BSVM) algorithm to better cluster the minority class with respect to the majority class in the feature space. Experimental results, including on healthcare benchmark datasets, demonstrated the effectiveness of the proposed algorithm. In addition, the authors transformed the problem into a balanced problem by removing samples in the majority class which have only small effects on the decision hyperplane. Five algorithms (BSVM, over-sampling, under-sampling, WCS-BSVM, and WWCS-BSVM) were tested on the Haberman dataset, which contains cases from a study conducted between 1958 and 1970 at the University of Chicago’s Billings Hospital on the survival of patients who had undergone surgery for breast cancer. The experimental results showed that WWCS-BSVM performed the best. Razzaghi et al. [97] proposed a multilevel SVM and tested it on large-scale imbalanced public benchmark datasets. This method produced fast, accurate, and robust classification results.
Hyperparameter tuning with class weight optimization is an efficient way to handle imbalanced data [98,99,100,101]. Zhang et al. [99] proposed an SVM hyperparameter tuning model with high computing performance. The computational time on imbalanced Alzheimer’s disease data was strongly reduced and the cross-validation performance was improved. The hyperparameters of a cost-sensitive SVM were optimized using a genetic algorithm in [100,101]. A multi-objective approach was used to optimized the model’s hyperparameters, and a solution approach based on genetic algorithms combined with decision trees was developed. Both serial and parallel version were tested on benchmark datasets, finding savings in terms of computational time [101]. The improved model performance showed the best values reported in the literature.
Ganaie et al. [102] proposed a KNN weighted reduced universum TWSVM for class imbalance learning (KWRUTWSVM-CIL) that reduced the complexity of the Universum Twin SVM (UTWSVM) model [103] by implementing the structural risk minimization principle and considering local neighbourhood information through the incorporation of a weight matrix. Compared to other existing models, the model demonstrated superior performance on real-world KEEL and UCI datasets. Furthermore, the proposed model obtained the highest average classification performance in terms of accuracy on Alzheimer’s disease and breast cancer datasets. To improved the effectiveness of the TWSVM on imbalanced data, Cai et al. [104] proposed a new three-way fuzzy membership function that increases the certainty of uncertain data by assigning higher fuzzy membership to minority samples. Their fuzzy twin support vector machine with three-way membership (TWFTWSVM) was constructed and tested on 47 imbalanced dataset, outperforming other traditional SVM-based models.
Table 7 summarises the papers that have addressed imbalanced datasets.

4. Classification and Prediction Problems in Real-World Case Studies

This section reviews papers that have used ML approaches including SVM-based models to address several real-world case studies, ranging from the prediction of chronic diseases such as diabetes [105,106,107] and sleep apnea [108,109] to the diagnosis of glaucoma [110] and acute myocardial infarction [111]. The selected papers consider that the increasing prevalence of chronic diseases such as Type 2 diabetes mellitus places a heavy burden on healthcare systems. Furthermore, the selection of the most relevant variables to include in an ML model is a significant challenge and is crucial from a clinical perspective, as it supports an increased focus on potentially causative factors. Table 8 lists the healthcare problems addressed in the papers reviewed in this section.
Typical issues that researchers have encountered when dealing with real-world data concern imbalanced datasets, missing values, nanostructured data, and high dimensionality.

4.1. Diabetes

Many ML models have been developed for envisaging diabetic complications; however, the classification and prediction accuracy is not very high. Hegde et al. [105] developed a predictive model using medical and dental data from integrated electronic health records (iEHR) to identify individuals with undiagnosed diabetes mellitus in a dental setting. Their study used retrospective data retrieved from the Marshfield Clinic Health System data repository. Future directions mentioned by the authors involved integrating their predictive model into the iEHR as a clinical decision support tool for screening and identifying patients at risk of diabetes mellitus. This could trigger follow-up and referral for integrated dentist–physician care. The model could additionally be used to develop additional decision support tools for other systemic diseases with oral health associations, such as cardiovascular and cognitive disorders. To predict chronic disease risk in Type 2 diabetes (T2D) mellitus, Lu et al. [106] used graph theory to discover underlying relationships between health outcomes for a group of patients diagnosed with the same disease; in this approach, if two people have the same disease, both patients have a latent relationship. They used eight ML models, including SVM, to predict the risk of chronic disease. The RF model outperformed the other models, and the authors found that the latent characteristics of patients were effective in predicting risk. According to Vidhya and Shanmugalakshmi [107], existing methods have lower classification and prediction accuracy; therefore, they proposed a model centered on deep learning for predicting complications of T2D mellitus. Data from various diabetes repositories were used to develop an effective feature extraction system. They tested various ML techniques, and the results showed that their approach achieved slightly better results than SVM in recognizing the complications of T2D disease.

4.2. Sleep Apnea

Sleep apnea (SA) is a condition in which a person experiences pauses in breathing or has very shallow breaths while asleep. These pauses can vary in frequency and duration. The most common form of SA is obstructive sleep apnea (OSA), which is typically diagnosed through polysomnography (PSG) at a sleep laboratory. PSG can be both expensive and inconvenient, as it requires an expert human observer to work overnight. ML models can provide valid support to improve the detection of SA. In one study, Almazaydeh et al. [108] used an SVM to process short duration epochs of electrocardiogram (ECG) data from subjects with and without OSA. Their automated classification system was based on an IoT device that extracts ECG data from the user and evaluates the results using an SVM-based system, which they named ‘Apnea MedAssist Service’. A high accuracy of 96.5% was achieved in recognizing epochs of sleep disorders. Stretch et al. [109] employed ML models such as SVM and RF to diagnose OSA. Their study considered home sleep apnea testing (HSAT) as an efficient and cost-effective diagnostic method; however, HSAT frequently requires additional tests, which can delay diagnosis and increase costs. Their study aimed to optimize the diagnostic pathway by using predictive modelling to identify patients who should be referred directly to PSG due to their high probability of having a nondiagnostic HSAT. The RF approach performed better, and the findings suggested that HSAT alone may not be enough for a significant number of patients (ranging from 9% to 35%), which could result in the need for a second sleep test and potentially lead to delayed or missed diagnosis.

4.3. Glaucoma

Traditional techniques for glaucoma detection require skilled medical practitioners and take a significant amount of time, and a scarcity of professionals exacerbates the situation. Ophthalmologists can use fundus images or optical coherence tomography (OCT) images for analysis. A systematic review by [122] on ML methods for glaucoma detection and prediction briefly explains the main contributions and findings by reviewing 128 papers. Thet found that 68% of the papers dealt with glaucoma prediction. Maheshwari et al. [112] proposed a method for diagnosis of glaucoma based on an LS-SVM classifier that achieved a classification accuracy of 95.19%. Sharma et al. [113] extracted various fundus images and then extracted many features, which were then reduced in number through a reduction technique. An SVM was then tested with several kernels on two private and public databases for glaucoma detection, achieving accuracy of 98.8% and 95%, respectively, confirming that this approach can support diagnosis by ophthalmologists. According to Shuldiner et al. [114], while several studies have focused on applying ML models to identify glaucomatous damage and detect visual field (VF) progression over time, few studies have attempted to predict the risk of future VF progression. Therefore, several MLs have been developed using only a single initial VF test to predict eyes that subsequently show rapid progression. A retrospective analysis of longitudinal data was performed in order to test different ML methods. Performance was assessed by AUROC and the best model was SVM, which predicted rapid progression with an AUC of 0.72, while other ML methods performed similarly. Incorporating additional clinical data into the current model may provide opportunities to predict patients most likely to progress rapidly with even greater accuracy. Singh et al. [110] utilised ML models and IoT-based predictive modelling to classify and predict glaucoma disease from OCT images through continuous monitoring. Their study retrieved 45 critical characteristics from a combination of the public Mendeley dataset and private datasets using the Oriented fast and rotated brief feature extractor and custom algorithms. These features were fed into four well-known ML classifiers (SVM, KNN, XGBoost, and RF). The KNN model achieved the highest accuracy, and the results were improved by using a GA-KNN-based combination with nine input features.

4.4. Graft Survival

The application of SVMs in the context of graft survival prediction involves using historical data from previous transplant cases to train the SVM model to predict the likelihood of graft survival for new transplant recipients. Various features, such as donor and recipient demographics, immunological factors, pre-transplant health status, and post-transplant care protocols, can be used as input variables for the SVM model. This information can be invaluable to clinicians in making decisions about the care of their patients, such as adjusting immunosuppressive therapy or identifying patients at higher risk of graft failure who may require closer monitoring or alternative treatment strategies.
Predicting graft survival is crucial for transplant success, as it increases the utility of available organs and benefits healthcare resource utilisation. According to a recent review [123] on predicting graft outcomes among kidney transplant patients, ML approaches improve the prediction of kidney transplant outcomes and aid medical decision-making. Graft survival is the length of time during which a patient does not require dialysis or another transplant. In a retrospective analysis of a database with over 31,000 patients, Topuz et al. [115] introduced a comprehensive feature selection framework that considers medical literature, data analytics methods, and elastic net regression. They used SVM to identify potential predictors of survival; elastic nets were combined with ML approaches such as artificial neural network (ANN), bootstrap forest, and SVM to select essential predictors in the data. Nonlinear relationships were identified and the interactions between explanatory factors and risk levels for kidney graft survival were analyzed. The obtained predictor set outperformed all other alternative predictors.

4.5. Myocardial Infarction

To realise a more comprehensive understanding of the progression of patients’ condition and an accurate evaluation from multiple perspectives, Zhou et al. [111] considered several patients’ characteristics concerning acute myocardial infarction (MI), which is one of the major causes of cardiovascular disease. They compared six ML techniques, including SVM, based on information gleaned from electronic medical records in the Medical Information Marketplace for Intensive Care (MIMIC)-III database. The screening of patient characteristics included their physical condition, health insurance status, height, weight, age, ethnicity, length of time treated in the Intensive Care Unit, and dosage of injected drugs. SVM feature extraction from EMR data improved the prediction accuracy of patient prognostic risks. The predictive model constructed using SVM achieved an accuracy rate of 92.2% and an AUC value of 0.98. Furthermore, thirteen markers, including blood potassium, blood glucose, and total cholesterol, were strongly linked to the prognosis of MI patients. Dohare et al. [116] detected MI using 12-lead ECG data and reduced the number of features from 220 to 14 via PCA. The tested SVM achieved high MI detection, with a sensitivity of 96.66%, specificity of 96.66%, and accuracy of 96.66%.

4.6. Tumor

Tumor response to radiotherapy is a complex process due to the involvement of many intertwined microenvironmental, physical, and biological parameters that can change treatment outcomes from one case to another. The complexity of heterogeneous variable interactions constitutes a challenge for building predictive models for routine clinical practice. El Naqa et al. [117] described a data mining framework that can unravel the higher order relationships among dosimetric dose–volume prognostic variables. A dataset of non-small-cell lung cancer consisting of 56 patients with discrete primary lesions, complete dosimetric archives, and follow-up information was constructed. The best predictive results in terms of tumor control probability with respect to logistic regression were achieved by an SVM with a Gaussian kernel.
SVM has found important applications in the early differential diagnosis of prostate cancer (PCa). This is because PCa can be easily confused with benign prostate hyperplasia in its early stages due to similarities in symptoms. In certain cases, PCa is underdiagnosed. Efforts to improve existing outcome prediction tools in PCa are always encouraged, as demonstrated by several ML methods reviewed in Li et al. [124] for PCa detection based on MRI. Wang et al. [119] found that zonal specific information and radiomic features could significantly improve the prediction of aggressive scores for prostate lesions with an SVM-RFE model. Akinnuwesi et al. [118] used a PCa dataset from the Kaggle Healthcare repository consisting of 250 features to develop and validate an SVM model for classification. The dataset was preprocessed to remove class imbalance, incompleteness, noise, and other inconsistencies. Preprocessing included data cleaning, resampling, discretization, and normalization. Relevant features were then identified using the SelectKBest and chi-squared methods.

4.7. Brain Health

Estimating brain age from neuroimaging data is important for assessing brain health, predicting cognitive decline, and identifying individuals who are at risk of neurodegenerative disease. Zhang et al. [120] proposed a nonlinear age-adaptive ensemble method for brain age estimation from MRI images. They first investigated four ML models, including an SVR, over different age groups and established an ensemble model based on these independent models. They then built a nonlinear age-adaptive ensemble model. Unlike from the stacking strategy, this approach can adjust the weights of inside-independent models according to the ground truth label. A discussion of some interesting findings from medical perspectives evidenced that as age increases, the risk of people suffering from brain diseases increases as well. In their systematic review, Pellegrini et al. [13] claimed that ML approaches can help to identify dementia risk from neuroimaging; however, their accuracy remains unclear. They reported that out of 111 relevant studies, most assessed Alzheimer’s disease versus healthy controls using data from the AD Neuroimaging Initiative and used SVM.
Stress, social anxiety, depression, obsessive compulsive disorder, drug addiction, and personality disorders are just a few of the factors that contribute to mental health problems, including mental illness. Srividya et al. [121] carried out a pilot work for further in-depth study on different types of mental illness. A target population of two groups, high school/college students and working professionals with less than five years of experience from different organisations, was considered. Clustering algorithms were used to identify the number of clusters and validate the obtained class labels. Several ML approaches were developed, including logistic regression, naive Bayes, SVM, DT, KNN with the ensemble bagging method, and a tree ensemble using RF. SVM, KNN, and RF performed almost equally well. The authors concluded that certain physiological parameters, such as electrocardiogram and respiratory rate, could be included as features to better predict the mental state of an individual.

4.8. Internet of Things

Finally, we briefly review some papers that underline the crucial role that the Internet of Things (IoT) is playing in solving healthcare problems. One of the most important objectives today is identifying the efficiency and cost impact of healthcare diagnoses. Understanding chronic disease progression and identifying patients at risk of developing comorbidities are crucial. Real-time identification based on patients’ health data can be achieved remotely. IoT sensors enable remote collection of patient data, aiding physicians in identifying the most effective treatment processes in advance. In their review, Zhang et al. [125] examined the use of noninvasive biosensors and how ML algorithms can enhance applications in disease screening, diagnosis, therapy determination, health monitoring, and food safety. They noted SVM as one of the most utilized ML techniques, with particular effectiveness in food safety and blood glucose level measurement. Furthermore, Zhang et al. [126] highlighted the advantages of integrating ML techniques into healthcare biosensors, leading to the development of smartphone-based biosensing systems. SVM has emerged as a prominent algorithm demonstrating high accuracy in various biosensor applications, including monitoring the status of COVID-19 patients. Fortunati et al. [127] incorporated an SVM classifier into an IoT-WiFi smart and portable electrochemical immunosensor for quantifying SARS-CoV-2 spike protein. The SVM classifier efficiently processes the immunosensor’s signal output to classify SARS-CoV-2 as positive or negative. Bayesian optimization is employed to determine the best SVM parameters, with the linear kernel achieving an accuracy of 97.3%.

5. Predictive Modelling for Health Care Services

Measuring the quality of patient care and other health outcomes is a challenging task that is necessary in order to identify appropriate improvement actions around purchasing and healthcare management. Various health outcomes, such as Length of Stay (LOS) and re-admissions to hospital within 30 days after previous discharge or mortality, can be assessed to measure quality. These factors allow quality to be assessed, and have a significant impact on healthcare costs. ML techniques have proved to be efficient tools for predicting quality indicators of health care services.
Tremblay et al. [128] conducted research to develop predictive models for LOS using NN and SVM. Their study focused on data preparation within a restricted surgical domain, namely, the digestive system. This phase involved selecting and transforming relevant features from the dataset, as often not all attributes are useful for prediction in large datasets. In this research, DT and LR techniques were used for feature selection, resulting in very similar outcomes. Among the various models applied, SVM demonstrated better performance in predicting LOS. Alturki et al. [129] built a predictive model for LOS of the diabetic patients, addressing the problem as a classification problem. The continuous variable “time in hospital” was discretized as follows: short (<5 days), medium (5 to 8 days), and long (>8 days) stays. Among several ML techniques, an SVM with the RBF kernel function and intermediate values for C and γ parameters turned out to be the best for the problem under investigation.
Zheng et al. [130] built a high-performance risk prediction model. They solved a binary problem, in which the two class labels were low-risk and high-risk. The best model, with better generalisation ability and higher sensitivity in classifying readmitted patients, turned out to be an SVM with the Radial Basic Function (RBF) kernel on which the Particle Swarm Optimization (PSO) swarm intelligence technique was applied for the parameter search. Higher prediction performance was obtained by combining GA and SVM for the re-admission prediction problem considering diabetic patients [131,132]. Turgeman and May [133] developed an ensemble hospital readmission predictive model able to control the trade off between transparency and prediction accuracy. The boosted C5.0 tree and the SVM were used as the base and second classifier, respectively. When tested on a real-world dataset, good prediction performance was achieved.
Liu et al. [134] proposed an ICU mortality prediction model that addresses the challenges of high dimensionality and imbalanced distribution in digital health data, which can result in reduced classifier performance. Their model used modified cost-sensitive principal component analysis (MCSPCA) to improve the imbalanced distribution of the data and obtain low-dimensional features. An SVM with the RBF kernel was chosen as the classifier, with a chaos particle swarm optimization (CPSO) algorithm used to optimize the parameters. The proposed MCSPCA + CPSO + SVM achieved results in a shorter elapsed time (814 s) and showed good performance on the problem. Ghorbani et al. [135] introduced a new hybrid predictive model for ICU mortality that addresses the data imbalance problem using the SVM-SMOTE technique. A Genetic Algorithm (GA) based on Wrapper Feature Selection (GAWFS) was used to determine the optimal subset of features, and a new ensemble model based on the combination of Stacking and Boosting ensemble methods was proposed. After testing different combinations of ML models to build a stacking ensemble model, the authors selected the Multilayer Perceptron Neural Network (MLP), kNN, and Extra Tree Classifier as the base classifiers and a Boosted SVM with adaptive boosting using 57 SVMs with the RBF kernel as the meta-classifier. The testing phase of the proposed model on a real-world MIMIIC-III health care dataset showed that it outperformed all the state-of-art models in terms of both accuracy and AUC measures. Barsasella et al. [136] predicted the mortality risk for T2D and HTN patients in a tertiary hospital in Indonesia, testing several ML techniques. Their results showed that the SVM was able to achieve an accuracy performance close to the efficient MLP with backpropagation. For the prediction of mortality in adult patients with sepsis, the SVM obtained an accuracy prediction equal to the ANN method, demonstrating its ability to elaborate big medical data [137]. To predict in-hospital mortality in patients with acute ST-segment elevation myocardial infarction, Gong et al. [138] proposed a combination of a variant algorithm based on the original sine–cosine optimization algorithm and an SVM, resulting in a predictive framework that they called AGCOSCA-SVM. Superior accuracy, sensitivity, and specificity were achieved by the proposed framework compared to traditional ML methods, demonstrating its promise as a model framework for supporting the diagnostic process of MI. SVM showed great potential in the prediction of neonatal mortality considering four groups of categories: demographics, pregnancy, neonatal, and delivery factors. The method was tested on a real-world dataset and outperformed five other ML models (DT, Gaussian process, MLP, ensemble RF, and bagging) [139].
Another application of ML techniques concerns the prediction of negative outcomes such as hospitalizations and emergency department visits in Home Health Care (HHC). Identifying at-risk patients allows for timely risk mitigation interventions and optimal allocation of hospital resources. Utilizing clinical notes is crucial for improving risk prediction in HHC contexts. Song et al. [140] demonstrated that clinical notes play a crucial role in determining the optimal risk predictive model by combining standardized data with information extracted from clinical notes. They achieved high risk prediction ability considering a predictor set with an SVM. Previously, Ghassemi et al. [141] demonstrated that clinical notes have an impact on ICU mortality prediction by applying an SVM model to predict ICU mortality in-hospital, 30 days post-discharge, and 1 year post-discharge.

COVID-19

With the outbreak of the COVID-19 pandemic, better defining the allocation of scarce healthcare resources became a major challenge for the entire world. Therefore, an urgent need arose to apply ML techniques for the construction of risk prediction models that could predict peoples’ needs in order to optimize limited clinical resources.
Afrash et al. [142] conducted research to construct a model for predicting the LOS of patients who tested positive for COVID-19. The selected model was an SVM with a Gaussian kernel function, which proved to be the model with the highest accuracy and the lowest running time. Among the limitations of this study is the dimension of the dataset, which was based on a single center. Song et al. [143] conducted a study on predicting hospitalizations of elderly people who tested positive for COVID-19, with the goal to identifying severe risk factors. Four hospitalization prediction models were developed, including regularized LR, SVM, RF, and NN. The final input variable list for models counted 44 characteristics based on a literature review, an online survey of clinicians treating COVID-19 patients, and an interview with a group of physicians. All four models obtained good prediction results, especially random forest and SVM (AUC = 0.83). Gao et al. [144] proposed an ensemble method combining SVM, Gradient Boosted Decision Tree (GSBT), and Neural Network (NN) to predict the occurrence of critical illness in patients with COVID-19 based on immune–inflammatory parameters. The proposed model obtained better performance compared to five traditional models (LR, SVM, GBDT, KNN, and NN) considering a total of 450 patients from two hospitals in China.
Other studies conducted following the outbreak of the pandemic concerned the suitability of rapid antigen tests (RAT) for diagnosing COVID-19. Amer et al. [145] used an SVM model to investigate whether the predictive accuracy of RAT for diagnosing COVID-19 could be improved by considering different measured laboratory parameters in participants’ blood. The SVM model with Monte Carlo cross-validation and the combination of the top two features, revealed to be HB and urea, obtained the highest prediction accuracy (59.3%). From this research, it emerged that combining the RAT results with laboratory measurements did not enhance the predictive accuracy of RAT.

6. Conclusions and Future Work

The main objective of this review is to provide an overview of the potential of SVMs in healthcare along with a summary of the most recent developments. SVM has proven to be a powerful machine learning tool, especially in the medical field, due to its solid theoretical foundations and advantages. Our analysis shows that there are general advantages of applying specialized SVMs to healthcare data. It is worth noting that many models based on SVMs are often more effective than other machine learning approaches. SVMs are suitable for dealing with higher-dimensional data as they are able to automatically regularise such data, helping to avoid issues around overfitting.
A number of extensions of SVM have been defined in order to face specific issues. One variant of SVM is TWSVM and its further extensions, which have shown to better prediction performance, including in the medical field. Despite countless developments, research on applications of TWSVM to big data remains limited.
It is important to point out that SVM performance is largely dependent on the selection of kernel functions and their parameters, which affects the results of the prediction to an extent, as well as the choice of the optimal input feature subset that influences the appropriate kernel parameters. There is currently not enough research on this topic to guide researchers in choosing the most appropriate kernel for different applications to achieve the desired performance. In addition, healthcare datasets are often characterised by high dimensionality and class imbalance, which can negatively impact SVM accuracy, especially in cases where the minority class is the target. Techniques such as cost-sensitive learning can help to address this issue. Another issue, especially in healthcare, is that while interpretability is paramount, SVMs produce complex decision boundaries that can make it difficult to interpret results. Furthermore, effective feature engineering is often necessary to improve the performance of SVM when dealing with heterogeneous medical data.
A critical factor for improving SVM performance in healthcare is the extraction of relevant features from heterogeneous medical data, including both structured data such as demographics and lab results and unstructured data such as medical images. Another important issue concerns missing values due to incomplete records or measurement errors. SVMs require complete datasets; thus, developing robust approaches to deal with missing values could be a future research direction. Feature selection is an important issue in the construction of prediction systems. It is advantageous to limit the number of input features in order to ensure a good predictive model that is less computationally demanding. The construction of a model that can handle this obstacle is very important, and despite the developments recorded in the literature, further research is required.
Another future direction concerns the application and development of cost-sensitive SVMs, which have been extensively tested in the laboratory but only rarely applied in real-world settings. Although the cost-sensitive SVMs have demonstrated good predictive performance in medical settings, their performance may be affected by factors characteristic of real-world scenarios, such as missing data, unbalanced datasets, and the presence of confounding variables. Future research could address the gaps in the literature on cost-sensitive SVMs in healthcare settings. This research should focus on evaluating the performance of these algorithms in real-world healthcare settings and comparing them with other learning algorithms. Such research would provide valuable insights into the practical application of these algorithms in clinical practice. Additionally, it is important to note that the number of papers reporting useful information for replicating their results is very small. Researchers should pay more attention to the information that they provide in order to facilitate the continued progress of SVMs and improve their applicability. In conclusion, results and applications on both real and benchmark data have demonstrated the superiority of SVMs over most alternative algorithms, providing motivation for their future developments.

Author Contributions

R.G. and S.F. Conception and Design, Literature Review, Analysis, Writing and Drafting, Critical Revision, Editing; D.L. and D.C. Drafting, Critical Revision. All authors have read and agreed to the published version of the manuscript.

Funding

This research received no external funding.

Data Availability Statement

No new data were created or analyzed in this study. Data sharing is not applicable to this article.

Conflicts of Interest

The authors declare no conflicts of interest.

Abbreviations

The following abbreviations are used in this manuscript:
ADAlzheimer diseaseLOSlength of stay
AdaBoostadaptive boostingLRlinear regression
ADNIAlzheimer’s Disease Neuroimaging InitiativeLS-SVMleast-squares support vector machine
ANNartificial neural networksMCCMatthews correlation coefficient
BMABayesian model averagingMCImild cognitive impairment
BMCBayesian model combinationMImyocardial infarction
BFbootstrap forestMIMICMedical Information Marketplace for Intensive Care
CDDsclinical decision support systemsMLmachine learning
CNcontrol normalMLPmultilayer perceptron
CNNconvolutional neural networksMLRmultiple linear regression
CPSOchaos particle swarm optimizationMCSPCAmodified cost-sensitive principal component analysis
CVcroos validationNLPnatural language processing
DBNdeep belief networkNNneural network
DCDDual Coordinate Decrescent methodNSVnonsupport vectors
DLdeep learningOCToptical coherence tomography
DTdecision treePMAprecise matching analysis
EDemergency departmentPSOparticle swarm optimization
ECOCerror-correcting output codesQPPpuadratic programming problem
EEGelectroencephalogramRATrapid antigen test
GAgenetic algorithmRBFradial basis function
GAWFSGA based Wrapper Feature SelectionRFrandom forest
GBMGeneralized Boosted modellingROCreceiver operating characteristic
GRCVglobal relaxation cross-validation algorithmSGBstochastic gradient boosting
GSBTGradient Boosted Decision TreeSMOTESynthetic Minority Oversampling Technique
HBhemoglobinSVssupport vectors
HHCHome Health CareSVMsupport vector machine
HTNhypertensionSVRsupport vector regression
ICUintensive care unitTWSVMtwin support vector machine
iEHRintegrated electronic health recordT2Dtype 2 diabetes
IFMintuitionistic fuzzy membershipXGBoostextreme gradient boosting
IFNintuitionistic fuzzy numberVRASvariance ranking attributes
iOtInternet of ThingsWBCDWisconsin Breast Cancer Dataset
kNNk-nearest neighborUCIUniversity of California at Irvine

References

  1. Andel, C.; Davidow, S.L.; Hollander, M.; Moreno, D.A. The economics of health care quality and medical errors. J. Health Care Financ. 2012, 39, 39–50. [Google Scholar]
  2. Jalloul, R.; Chethan, H.K.; Alkhatib, R. A Review of Machine Learning Techniques for the Classification and Detection of Breast Cancer from Medical Images. Diagnostics 2023, 13, 2460. [Google Scholar] [CrossRef]
  3. Ozer, M.; Sarica, P.; Arga, K. New Machine Learning Applications to Accelerate Personalized Medicine in Breast Cancer: Rise of the Support Vector Machines. OMICS 2020, 24, 241–246. [Google Scholar] [CrossRef] [PubMed]
  4. Lanza, B.; Parashar, D. Do Support Vector Machines Play a Role in Stratifying Patient Population Based on Cancer Biomarkers? Ann. Proteom. Bioinform. 2021, 2, 20–38. [Google Scholar]
  5. Huang, S.; Cai, N.; Penzuti Pacheco, P.; Narrandes, S.; Wang, Y.; Xu, W. Applications of Support Vector Machine (SVM) Learning in Cancer Genomics. Cancer Genom. Proteom. 2018, 15, 41–51. Available online: https://cgp.iiarjournals.org/content/15/1/41.full.pdf (accessed on 15 February 2024).
  6. Chen, Z.; Li, J.; Wei, L. A multiple kernel support vector machine scheme for feature selection and rule extraction from gene expression data of cancer tissue. Artif. Intell. Med. 2007, 41, 161–175. [Google Scholar] [CrossRef] [PubMed]
  7. Vanitha, C.D.A.; Devaraj, D.; Venkatesulu, M. Gene Expression Data Classification Using Support Vector Machine and Mutual Information-based Gene Selection. Procedia Comput. Sci. 2015, 47, 13–21. [Google Scholar] [CrossRef]
  8. Gao, X.; Chu, C.; Li, Y.; Lu, P.; Wang, W.; Liu, W.; Yu, L. The method and efficacy of support vector machine classifiers based on texture features and multi-resolution histogram from 18F-FDG PET-CT images for the evaluation of mediastinal lymph nodes in patients with lung cancer. Eur. J. Radiol. 2015, 84, 312–317. [Google Scholar] [CrossRef] [PubMed]
  9. Lo, C.S.; Wang, C.M. Support vector machine for breast MR image classification. Comput. Math. Appl. 2012, 64, 1153–1162. [Google Scholar] [CrossRef]
  10. Chandra, M.; Bedi, S. Survey on SVM and their application in image classification. Int. J. Inf. Tecnol. 2021, 13, 1–11. [Google Scholar] [CrossRef]
  11. Nagashree, S.; Mahanand, B.S. Pneumonia Chest X-ray Classification Using Support Vector Machine. In Proceedings of the International Conference on Data Science and Applications, Santiago, Chile, 8–10 November 2023; Saraswat, M., Chowdhury, C., Kumar Mandal, C., Gandomi, A.H., Eds.; Springer: Singapore, 2023; pp. 417–425. [Google Scholar]
  12. Orrú, G.; Pettersson-Yeo, W.; Marquand, A.; Sartori, G.; Mechelli, A. Using Support Vector Machine to identify imaging biomarkers of neurological and psychiatric disease: A critical review. Neurosci. Biobehav. Rev. 2012, 36, 1140–1152. [Google Scholar] [CrossRef] [PubMed]
  13. Pellegrini, E.; Ballerini, L.; Hernandez, M.D.C.V.; Chappell, F.M.; Gonzalez-Castro, V.; Anblagan, D.; Danso, S.; Munoz-Maniega, S.; Job, D.; Pernet, C.; et al. Machine learning of neuroimaging for assisted diagnosis of cognitive impairment and dementia: A systematic review. Alzheimer’s Dementia Diagn. Assess. Dis. Monit. 2018, 10, 519–535. [Google Scholar] [CrossRef]
  14. Ganaie, M.; Tanveer, M. Fuzzy least squares projection twin support vector machines for class imbalance learning. Appl. Soft Comput. 2021, 113, 107933. [Google Scholar] [CrossRef]
  15. Boser, B.E.; Guyon, I.M.; Vapnik, V.N. A training algorithm for optimal margin classifiers. In Proceedings of the Fifth Annual Workshop on Computational Learning Theory, New York, NY, USA, 27–29 July 1992; COLT’92. pp. 144–152. [Google Scholar] [CrossRef]
  16. Cortes, C.; Vapnik, V. Support-vector networks. Mach. Learn. 1995, 20, 273–297. [Google Scholar] [CrossRef]
  17. Vapnik, V. An overview of statistical learning theory. IEEE Trans. Neural Netw. 1999, 10, 988–999. [Google Scholar] [CrossRef] [PubMed]
  18. Burges, C. A Tutorial on Support Vector Machines for Pattern Recognition. Data Min. Knowl. Discov. 1998, 2, 121–167. [Google Scholar] [CrossRef]
  19. Hofmann, T.; Schölkopf, B.; Smola, A.J. Kernel methods in machine learning. Ann. Stat. 2008, 36, 1171–1220. [Google Scholar] [CrossRef]
  20. Schölkopf, B.; Smola, A.J.; Williamson, R.C.; Bartlett, P.L. New Support Vector Algorithms. Neural Comput. 2000, 12, 1207–1245. [Google Scholar] [CrossRef] [PubMed]
  21. Inoue, T.; Abe, S. Fuzzy support vector machines for pattern classification. In Proceedings of the IJCNN’01. International Joint Conference on Neural Networks. Proceedings (Cat. No.01CH37222), Washington, DC, USA, 15–19 July 2001; Volume 2, pp. 1449–1454. [Google Scholar] [CrossRef]
  22. Suykens, J.A.K.; Van Gestel, T.; De Brabanter, J.; De Moor, B.; Vandewalle, J. Least Squares Support Vector Machines; World Scientific: Hackensack, NJ, USA, 2002. [Google Scholar] [CrossRef]
  23. Fung, G.; Mangasarian, O.L. Proximal support vector machine classifiers. In Proceedings of the Seventh ACM SIGKDD International Conference on Knowledge Discovery and Data Mining, San Francisco, CA, USA, 26–29 August 2001; KDD’01. ACM: New York, NY, USA, 2001; pp. 77–86. [Google Scholar] [CrossRef]
  24. Birzhandi, P.; Kim, K.; Youn, H. Reduction of training data for support vector machine: A survey. Soft Comput. 2022, 26, 3729–3742. [Google Scholar] [CrossRef]
  25. Mangasarian, O.; Wild, E. Multisurface proximal support vector machine classification via generalized eigenvalues. IEEE Trans. Pattern Anal. Mach. Intell. 2006, 28, 69–74. [Google Scholar] [CrossRef]
  26. Yao, Y.; Liu, Y.; Yu, Y.; Xu, H.; Lv, W.; Li, Z.; Chen, X. K-SVM: An effective SVM algorithm based on K-means clustering. J. Comput. 2013, 8, 2632–2639. [Google Scholar] [CrossRef]
  27. Birzhandi, P.; Kim, K.T.; Lee, B.; Youn, H.Y. Reduction of Training Data Using Parallel Hyperplane for Support Vector Machine. Appl. Artif. Intell. 2019, 33, 497–516. [Google Scholar] [CrossRef]
  28. Jayadeva; Khemchandani, R.; Chandra, S. Twin Support Vector Machines for Pattern Classification. IEEE Trans. Pattern Anal. Mach. Intell. 2007, 29, 905–910. [Google Scholar] [CrossRef] [PubMed]
  29. Ding, S.; Yu, J.; Qi, B.; Huang, H. An overview on twin support vector machines. Artif. Intell. Rev. 2014, 42, 245–252. [Google Scholar] [CrossRef]
  30. Huang, H.; Wei, X. Twin Support Vector Machines: A Survey. Neurocomputing 2018, 300, 34–43. [Google Scholar] [CrossRef]
  31. Tanveer, M.; Rajani, T.; Rastogi, R.; Shao, Y.; Ganaie, M. Comprehensive review on twin support vector machines. Ann. Oper. Res. 2022. [Google Scholar] [CrossRef]
  32. Moosaei, H.; Bazikar, F.; Pardalos, P. An improved multi-task least squares twin support vector machine. In Annals of Mathematics and Artificial Intelligence; Springer: Berlin/Heidelberg, Germany, 2023; pp. 1–21. [Google Scholar] [CrossRef]
  33. He, H.; Ma, Y. Class Imbalance Learning Methods for Support Vector Machines. In Imbalanced Learning: Foundations, Algorithms, and Applications; Wiley: Hoboken, NJ, USA, 2013; pp. 83–99. [Google Scholar] [CrossRef]
  34. Haixiang, G.; Yijing, L.; Shang, J.; Yuanyue, G.M.H.; Bing, G. Learning from class-imbalanced data: Review of methods andapplications. Expert Syst. Appl. 2017, 73, 220–239. [Google Scholar] [CrossRef]
  35. Chawla, N.V.; Bowyer, K.W.; Hall, L.O.; Kegelmeyer, W.P. SMOTE: Synthetic minority over-sampling technique. J. Artif. Intell. Res. 2002, 16, 321–357. [Google Scholar] [CrossRef]
  36. Veropoulos, K.; Campbell, C.; Cristianini, N. Controlling the sensitivity of support vector machines. In Proceedings of the International Joint Conference on AI1999, Stockholm, Sweden, 31 July–6 August 1999; pp. 55–60. [Google Scholar]
  37. Iranmehr, A.; Masnadi-Shirazi, H.; Vasconcelos, N. Cost-sensitive support vector machines. Neurocomputing 2019, 343, 50–64. [Google Scholar] [CrossRef]
  38. Vapnik, V.N. Estimation of Dependences Based on Empirical Data; Springer: Berlin/Heidelberg, Germany, 2006. [Google Scholar]
  39. Richhariya, B.; Tanveer, M. A reduced universum twin support vector machine for class imbalance learning. Pattern Recognit. 2020, 102, 107150. [Google Scholar] [CrossRef]
  40. Moosaei, H.; Ganaie, M.; Hladik, M.; Tanveer, M. Inverse free reduced universum twin support vector machine for imbalanced data classification. Neural Netw. 2023, 157, 125–135. [Google Scholar] [CrossRef] [PubMed]
  41. Lam, L.; Suen, S. Application of majority voting to pattern recognition: An analysis of its behavior and performance. IEEE Trans. Syst. Man, Cybern.—Part A Syst. Humans 1997, 27, 553–568. [Google Scholar] [CrossRef]
  42. Bradley, A.P. The use of the area under the ROC curve in the evaluation of machine learning algorithms. Pattern Recognit. 1997, 30, 1145–1159. [Google Scholar] [CrossRef]
  43. Kelly, M.; Longjohn, R.; Nottingham, K. UCI Machine Learning Repository. Available online: https://archive.ics.uci.edu (accessed on 15 February 2024).
  44. Alcala-Fdez, J.; Fernandez, A.; Luengo, J.; Derrac, J.; Garcia, S.; Sanchez, L.; Herrera, F. KEEL Data-Mining Software Tool: Data Set Repository, Integration of Algorithms and Experimental Analysis Framework. J. -Mult.-Valued Log. Soft Comput. 2011, 17, 255–287. [Google Scholar]
  45. Street, W.N.; Wolberg, W.H.; Mangasarian, O.L. Nuclear feature extraction for breast tumor diagnosis. In Proceedings of the Electronic Imaging, San Jose, CA, USA, 31 January–5 February 1993. [Google Scholar]
  46. Sweilam, N.H.; Tharwat, A.; Abdel Moniem, N. Support vector machine for diagnosis cancer disease: A comparative study. Egypt. Inform. J. 2010, 11, 81–92. [Google Scholar] [CrossRef]
  47. Badr, E.S.; Abdul Salam, M.; Ahmed, H. The impact of scaling on Support Vector Machine in Breast Cancer Diagnosis. Int. J. Comput. Appl. 2020, 175, 15–19. [Google Scholar] [CrossRef]
  48. Almotairi, S.; Badr, E.; Abdul Salam, M.; Ahmed, H. Breast Cancer Diagnosis Using a Novel Parallel Support Vector Machine with Harris Hawks Optimization. Mathematics 2023, 11, 3251. [Google Scholar] [CrossRef]
  49. Akay, M.F. Support vector machines combined with feature selection for breast cancer diagnosis. Expert Syst. Appl. 2009, 36, 3240–3247. [Google Scholar] [CrossRef]
  50. Polat, K.; Günes, S. Breast cancer diagnosis using least square support vector machine. Digit. Signal Process. 2007, 17, 694–701. [Google Scholar] [CrossRef]
  51. Islam, M.M.; Iqbal, H.; Haque, M.R.; Hasan, M.K. Prediction of breast cancer using support vector machine and K-Nearest neighbors. In Proceedings of the 2017 IEEE Region 10 Humanitarian Technology Conference (R10-HTC), Dhaka, Bangladesh, 21–23 December 2017; pp. 226–229. [Google Scholar]
  52. Azar, A.T.; El-Said, S.A. Performance analysis of support vector machines classifiers in breast cancer mammography recognition. Neural Comput. Appl. 2014, 24, 1163–1177. [Google Scholar] [CrossRef]
  53. Kamel, S.R.; YaghoubZadeh, R.; Kheirabadi, M. Improving the performance of support-vector machine by selecting the best features by Gray Wolf algorithm to increase the accuracy of diagnosis of breast cancer. J. Big Data 2019, 6, 90. [Google Scholar] [CrossRef]
  54. Singh, I.; Bansal, R.; Gupta, A.; Singh, A. A Hybrid Grey Wolf-Whale Optimization Algorithm for Optimizing SVM in Breast Cancer Diagnosis. In Proceedings of the 2020 Sixth International Conference on Parallel, Distributed and Grid Computing (PDGC), Waknaghat, India, 6–8 November 2020; pp. 286–290. [Google Scholar] [CrossRef]
  55. Elkorany, A.S.; Marey, M.; Almustafa, K.M.; Elsharkawy, Z.F. Breast Cancer Diagnosis Using Support Vector Machines Optimized by Whale Optimization and Dragonfly Algorithms. IEEE Access 2022, 10, 69688–69699. [Google Scholar] [CrossRef]
  56. Rasool, A.; Bunterngchit, C.; Tiejian, L.; Islam, M.R.; Qu, Q.; Jiang, Q. Improved Machine Learning-Based Predictive Models for Breast Cancer Diagnosis. Int. J. Environ. Res. Public Health 2022, 19, 3211. [Google Scholar] [CrossRef] [PubMed]
  57. Indraswari, R.; Arifin, A.Z. RBF kernel optimization method with particle swarm optimization on SVM using the analysis of input data’s movement. J. Ilmu Komput. Dan Inf. 2017, 10, 36–42. [Google Scholar] [CrossRef]
  58. Zheng, B.; Yoon, S.W.; Lam, S.S. Breast cancer diagnosis based on feature extraction using a hybrid of K-means and support vector machine algorithms. Expert Syst. Appl. 2014, 41, 1476–1482. [Google Scholar] [CrossRef]
  59. Conforti, D.; Guido, R. Kernel based support vector machine via semidefinite programming: Application to medical diagnosis. Comput. Oper. Res. 2010, 37, 1389–1394. [Google Scholar] [CrossRef]
  60. Wang, H.; Zheng, B.; Yoon, S.W.; Ko, H.S. A support vector machine-based ensemble algorithm for breast cancer diagnosis. Eur. J. Oper. Res. 2018, 267, 687–699. [Google Scholar] [CrossRef]
  61. Blanco, V.; Japón, A.; Puerto, J. A mathematical programming approach to SVM-based classification with label noise. Comput. Ind. Eng. 2022, 172, 108611. [Google Scholar] [CrossRef]
  62. Reza, M.; Hafsha, U.; Amin, R.; Yasmin, R.; Ruhi, S. Improving SVM performance for type II diabetes prediction with an improved non-linear kernel: Insights from the PIMA dataset. Comput. Methods Programs Biomed. Update 2023, 4, 100118. [Google Scholar] [CrossRef]
  63. Sisodia, D.; Sisodia, D.S. Prediction of Diabetes using Classification Algorithms. Procedia Comput. Sci. 2018, 132, 1578–1585. [Google Scholar] [CrossRef]
  64. Guyon, I.; Weston, J.; Barnhill, S.; Vapnik, V. Gene selection for cancer classification using support vector machines. Mach. Learn. 2002, 46, 389–422. [Google Scholar] [CrossRef]
  65. Ding, X.; Yang, F.; Jin, S.; Cao, J. An efficient alpha seeding method for optimized extreme learning machine-based feature selection algorithm. Comput. Biol. Med. 2021, 134, 104505. [Google Scholar] [CrossRef] [PubMed]
  66. Li, Z.; Qian, Y.; Li, Q. A Unified Framework and a Case Study for Hyperparameter Selection in Machine Learning via Bilevel Optimization. In Proceedings of the 2022 5th International Conference on Data Science and Information Technology (DSIT), Shanghai, China, 22–24 July 2022. [Google Scholar] [CrossRef]
  67. Chang, C.C.; Lin, C.J. LIBSVM: A library for support vector machines. Acm Trans. Intell. Syst. Technol. (Tist) 2011, 2, 1–27. [Google Scholar] [CrossRef]
  68. Huong, A.; Tay, K.; Ngu, X. Five-class classification of cervical pap smear images: A study of CNN-error-correcting SVM models. Healthc. Inform. Res. 2021, 27, 298–306. [Google Scholar] [CrossRef]
  69. Ke, T.; Liao, Y.; Wu, M.; Ge, X.; Huang, X.; Zhang, C.; Li, J. Maximal margin hyper-sphere SVM for binary pattern classification. Eng. Appl. Artif. Intell. 2023, 117, 105615. [Google Scholar] [CrossRef]
  70. Yan, Y.; Li, Q. An efficient augmented Lagrangian method for support vector machine. Optim. Methods Softw. 2020, 35, 855–883. [Google Scholar] [CrossRef]
  71. Groccia, M.C.; Guido, R.; Conforti, D. Multi-Classifier Approaches for Supporting Clinical Decision Making. Symmetry 2020, 12, 699. [Google Scholar] [CrossRef]
  72. Peng, X. A ν-twin support vector machine (ν-TSVM) classifier and its geometric algorithms. Inf. Sci. 2010, 180, 3863–3875. [Google Scholar] [CrossRef]
  73. Arun Kumar, M.; Gopal, M. Least squares twin support vector machines for pattern classification. Expert Syst. Appl. 2009, 36, 7535–7543. [Google Scholar] [CrossRef]
  74. Tomar, D.; Agarwal, S. A comparison on multi-class classification methods based on least squares twin support vector machine. Knowl.-Based Syst. 2015, 81, 131–147. [Google Scholar] [CrossRef]
  75. Wang, H.; Zhang, Q. Twin K-class support vector classification with pinball loss. Appl. Soft Comput. 2021, 113, 107929. [Google Scholar] [CrossRef]
  76. Zhou, K.; Zhang, Q.; Li, J. TSVMPath: Fast Regularization Parameter Tuning Algorithm for Twin Support Vector Machine. Neural Process. Lett. 2022, 54, 5457–5482. [Google Scholar] [CrossRef]
  77. Rezvani, S.; Wang, X.; Pourpanah, F. Intuitionistic Fuzzy Twin Support Vector Machines. IEEE Trans. Fuzzy Syst. 2019, 27, 2140–2151. [Google Scholar] [CrossRef]
  78. Ganaie, M.; Kumari, A.; Malik, A.; Tanveer, M. EEG signal classification using improved intuitionistic fuzzy twin support vector machines. Neural Comput. Appl. 2022, 36, 163–179. [Google Scholar] [CrossRef]
  79. Shao, Y.H.; Lv, X.J.; Huang, L.W.; Bai, L. Twin SVM for conditional probability estimation in binary and multiclass classification. Pattern Recognit. 2023, 136, 109253. [Google Scholar] [CrossRef]
  80. Malik, A.; Ganaie, M.; Tanveer, M.; Suganthan, P.; Initiative, A.D.N.I. Alzheimer’s Disease Diagnosis via Intuitionistic Fuzzy Random Vector Functional Link Network. IEEE Trans. Comput. Soc. Syst. 2022. [Google Scholar] [CrossRef]
  81. Bai, L.; Chen, X.; Wang, Z.; Shao, Y.H. Safe intuitionistic fuzzy twin support vector machine for semi-supervised learning[Formula presented]. Appl. Soft Comput. 2022, 123, 108906. [Google Scholar] [CrossRef]
  82. Richhariya, B.; Tanveer, M. Universum least squares twin parametric-margin support vector machine. In Proceedings of the 2020 International Joint Conference on Neural Networks (IJCNN), Glasgow, UK, 19–24 July 2020; pp. 1–8. [Google Scholar]
  83. Moosaei, H.; Bazikar, F.; Hladík, M. Multi-task twin support vector machine with Universum data. Eng. Appl. Artif. Intell. 2024, 132, 107951. [Google Scholar] [CrossRef]
  84. Lyaqini, S.; Hadri, A.; Ellahyani, A.; Nachaoui, M. Primal dual algorithm for solving the nonsmooth Twin SVM. Eng. Appl. Artif. Intell. 2024, 128, 107567. [Google Scholar] [CrossRef]
  85. Lanckriet, G.; Ghaoui, L.; Bhattacharyya, C.; Jordan, M. Minimax probability machine. Adv. Neural Inf. Process. Syst. 2001, 14. [Google Scholar]
  86. Lanckriet, G.R.G.; El Ghaoui, L.; Bhattacharyya, C.; Jordan, M.I. A robust minimax approach to classification. J. Mach. Learn. Res. 2003, 3, 555–582. [Google Scholar] [CrossRef]
  87. Yang, L.; Wen, Y.; Zhang, M.; Wang, X. Twin minimax probability machine for pattern classification. Neural Netw. 2020, 131, 201–214. [Google Scholar] [CrossRef] [PubMed]
  88. Ma, J.; Yu, G. Regularized twin minimax probability machine for pattern classification and regression. Eng. Appl. Artif. Intell. 2022, 107, 104550. [Google Scholar] [CrossRef]
  89. Jain, S.; Rastogi, R. Parametric non-parallel support vector machines for pattern classification. Mach. Learn. 2022, 113, 1567–1594. [Google Scholar] [CrossRef]
  90. Huang, X.; Shi, L.; Suykens, J. Support vector machine classifier with pinball loss. IEEE Trans. Pattern Anal. Mach. Intell. 2014, 36, 984–997. [Google Scholar] [CrossRef] [PubMed]
  91. Jian, C.; Gao, J.; Ao, Y. A New Sampling Method for Classifying Imbalanced Data Based on Support Vector Machine Ensemble. Neurocomputing 2016, 193, 115–122. [Google Scholar] [CrossRef]
  92. Sain, H.; Purnami, S.W. Combine Sampling Support Vector Machine for Imbalanced Data Classification. Procedia Comput. Sci. 2015, 72, 59–66. [Google Scholar] [CrossRef]
  93. Ebenuwa, S.; Sharif, M.; Alazab, M.; Al-Nemrat, A. Variance Ranking Attributes Selection Techniques for Binary Classification Problem in Imbalance Data. IEEE Access 2019, 7, 24649–24666. [Google Scholar] [CrossRef]
  94. Núñez, H.; Gonzalez-Abril, L.; Angulo, C. Improving SVM Classification on Imbalanced Datasets by Introducing a New Bias. J. Classif. 2017, 34, 427–443. [Google Scholar] [CrossRef]
  95. Dubey, R.; Zhou, J.; Wang, Y.; Thompson, P.M.; Ye, J. Analysis of sampling techniques for imbalanced data: An n=648 ADNI study. NeuroImage 2014, 87, 220–241. [Google Scholar] [CrossRef]
  96. Zhang, J.J.; Zhong, P. Learning Biased SVM with Weighted Within-Class Scatter for Imbalanced Classification. Neural Process. Lett. 2020, 51, 797–817. [Google Scholar] [CrossRef]
  97. Razzaghi, T.; Roderick, O.; Safro, I.; Marko, N. Multilevel weighted support vector machine for classification on healthcare data with missing values. PLoS ONE 2016, 11, 0155119. [Google Scholar] [CrossRef]
  98. Zhang, F.; Petersen, M.; Johnson, L.; Hall, J.; O’Bryant, S. Accelerating Hyperparameter Tuning in Machine Learning for Alzheimer’s Disease With High Performance Computing. Front. Artif. Intell. 2021, 4, 798962. [Google Scholar] [CrossRef] [PubMed]
  99. Zhang, F.; Petersen, M.; Johnson, L.; Hall, J.; O’ Bryant, S.E. Hyperparameter Tuning with High Performance Computing Machine Learning for Imbalanced Alzheimer’s Disease Data. Appl. Sci. 2022, 12, 6670. [Google Scholar] [CrossRef] [PubMed]
  100. Guido, R.; Groccia, M.C.; Conforti, D. Hyper-Parameter Optimization in Support Vector Machine on Unbalanced Datasets Using Genetic Algorithms. AIRO Springer Ser. 2022, 8, 37–47. [Google Scholar]
  101. Guido, R.; Groccia, M.C.; Conforti, D. A hyper-parameter tuning approach for cost-sensitive support vector machine classifiers. Soft Comput. 2023, 27, 12863–12881. [Google Scholar] [CrossRef]
  102. Ganaie, M.; Tanveer, M.; Initiative, A.D.N. KNN weighted reduced universum twin SVM for class imbalance learning. Knowl.-Based Syst. 2022, 245, 108578. [Google Scholar] [CrossRef]
  103. Qi, Z.; Tian, Y.; Shi, Y. Twin support vector machine with Universum data. Neural Netw. 2012, 36, 112–119. [Google Scholar] [CrossRef] [PubMed]
  104. Cai, W.; Cai, M.; Li, Q.; Liu, Q. Three-way imbalanced learning based on fuzzy twin SVM. Appl. Soft Comput. 2024, 150, 111066. [Google Scholar] [CrossRef]
  105. Hegde, H.; Shimpi, N.; Panny, A.; Glurich, I.; Christie, P.; Acharya, A. Development of non-invasive diabetes risk prediction models as decision support tools designed for application in the dental clinical environment. Inform. Med. Unlocked 2019, 17, 100254. [Google Scholar] [CrossRef]
  106. Lu, H.; Uddin, S.; Hajati, F.; Moni, M.; Khushi, M. A patient network-based machine learning model for disease prediction: The case of type 2 diabetes mellitus. Appl. Intell. 2022, 52, 2411–2422. [Google Scholar] [CrossRef]
  107. Vidhya, K.; Shanmugalakshmi, R. Deep learning based big medical data analytic model for diabetes complication prediction. J. Ambient. Intell. Humaniz. Comput. 2020, 11, 5691–5702. [Google Scholar] [CrossRef]
  108. Almazaydeh, L.; Elleithy, K.; Faezipour, M. Obstructive sleep apnea detection using SVM-based classification of ECG signal features. IEEE Eng. Med. Biol. Soc. 2012, 2012, 4938–4941. [Google Scholar] [CrossRef]
  109. Stretch, R.; Ryden, A.; Fung, C.; Martires, J.; Liu, S.; Balasubramanian, V.; Saedi, B.; Hwang, D.; Martin, J.; Penna, N.; et al. Predicting nondiagnostic home sleep apnea tests using machine learning. J. Clin. Sleep Med. 2019, 15, 1599–1608. [Google Scholar] [CrossRef] [PubMed]
  110. Singh, L.; Pooja; Garg, H.; Khanna, M. An IoT based predictive modeling for Glaucoma detection in optical coherence tomography images using hybrid genetic algorithm. Multimed. Tools Appl. 2022, 81, 37203–37242. [Google Scholar] [CrossRef]
  111. Zhou, X.; Li, X.; Zhang, Z.; Han, Q.; Deng, H.; Jiang, Y.; Tang, C.; Yang, L. Support vector machine deep mining of electronic medical records to predict the prognosis of severe acute myocardial infarction. Front. Physiol. 2022, 13, 991990. [Google Scholar] [CrossRef] [PubMed]
  112. Maheshwari, S.; Pachori, R.B.; Kanhangad, V.; Bhandary, S.V.; Acharya, U.R. Iterative variational mode decomposition based automated detection of glaucoma using fundus images. Comput. Biol. Med. 2017, 88, 142–149. [Google Scholar] [CrossRef] [PubMed]
  113. Sharma, R.; Sircar, P.; Pachori, R.; Bhandary, S.; Acharya, U.R. Automated glaucoma detection using center slice of higher order statistics. J. Mech. Med. Biol. 2019, 19, 19400116. [Google Scholar] [CrossRef]
  114. Shuldiner, S.; Boland, M.; Ramulu, P.; Moraes, C.; Elze, T.; Myers, J.; Pasquale, L.; Wellik, S.; Yohannan, J. Predicting eyes at risk for rapid glaucoma progression based on an initial visual field test using machine learning. PLoS ONE 2021, 16, e0249856. [Google Scholar] [CrossRef]
  115. Topuz, K.; Zengul, F.; Dag, A.; Almehmi, A.; Yildirim, M. Predicting graft survival among kidney transplant recipients: A Bayesian decision support model. Decis. Support Syst. 2018, 106, 97–109. [Google Scholar] [CrossRef]
  116. Dohare, A.K.; Kumar, V.; Kumar, R. Detection of myocardial infarction in 12 lead ECG using support vector machine. Appl. Soft Comput. 2018, 64, 138–147. [Google Scholar] [CrossRef]
  117. El Naqa, I.; Deasy, J.; Mu, Y.; Huang, E.; Hope, A.; Lindsay, P.; Apte, A.; Alaly, J.; Bradley, J. Datamining approaches for modeling tumor control probability. Acta Oncol. 2010, 49, 1363–1373. [Google Scholar] [CrossRef] [PubMed]
  118. Akinnuwesi, B.A.; Olayanju, K.A.; Aribisala, B.S.; Fashoto, S.G.; Mbunge, E.; Okpeku, M.; Owate, P. Application of support vector machine algorithm for early differential diagnosis of prostate cancer. Data Sci. Manag. 2023, 6, 1–12. [Google Scholar] [CrossRef]
  119. Wang, J.; Wu, C.j.; Bao, M.L.; Zhang, J.; Wang, X.N.; Zhang, Y. Machine learning-based analysis of MR radiomics can help to improve the diagnostic performance of PI-RADS v2 in clinically relevant prostate cancer. Eur. Radiol. 2017, 27, 4082–4090. [Google Scholar] [CrossRef] [PubMed]
  120. Zhang, Z.; Jiang, R.; Zhang, C.; Williams, B.; Jiang, Z.; Li, C.T.; Chazot, P.; Pavese, N.; Bouridane, A.; Beghdadi, A. Robust Brain Age Estimation Based on sMRI via Nonlinear Age-Adaptive Ensemble Learning. IEEE Trans. Neural Syst. Rehabil. Eng. 2022, 30, 2146–2156. [Google Scholar] [CrossRef] [PubMed]
  121. Srividya, M.; Mohanavalli, S.; Bhalaji, N. Behavioral Modeling for Mental Health using Machine Learning Algorithms. J. Med. Syst. 2018, 42, 88. [Google Scholar] [CrossRef] [PubMed]
  122. Mathew, J.; Ilango, V.; Asha, V. Machine Learning Techniques, Detection and Prediction of Glaucoma? A Systematic Review. Int. J. Recent Innov. Trends Comput. Commun. 2023, 11, 283–309. [Google Scholar] [CrossRef]
  123. Senanayake, S.; White, N.; Graves, N.; Healy, H.; Baboolal, K.; Kularatna, S. Machine learning in predicting graft failure following kidney transplantation: A systematic review of published predictive models. Int. J. Med. Inform. 2019, 130, 103957. [Google Scholar] [CrossRef] [PubMed]
  124. Li, H.; Lee, C.H.; Chia, D.; Lin, Z.; Huang, W.; Tan, C.H. Machine Learning in Prostate MRI for Prostate Cancer: Current Status and Future Opportunities. Diagnostics 2022, 12, 289. [Google Scholar] [CrossRef]
  125. Zhang, K.; Wang, J.; Liu, T.; Luo, Y.; Loh, X.; Chen, X. Machine Learning-Reinforced Noninvasive Biosensors for Healthcare. Adv. Healthc. Mater. 2021, 10, 734. [Google Scholar] [CrossRef]
  126. Zhang, Y.; Hu, Y.; Jiang, N.; Yetisen, A. Wearable artificial intelligence biosensor networks. Biosens. Bioelectron. 2023, 219, 114825. [Google Scholar] [CrossRef] [PubMed]
  127. Fortunati, S.; Giliberti, C.; Giannetto, M.; Bolchi, A.; Ferrari, D.; Donofrio, G.; Bianchi, V.; Boni, A.; De Munari, I.; Careri, M. Rapid Quantification of SARS-CoV-2 Spike Protein Enhanced with a Machine Learning Technique Integrated in a Smart and Portable Immunosensor. Biosensors 2022, 12, 426. [Google Scholar] [CrossRef]
  128. Tremblay, M.; Berndt, D.; Studnicki, J. Feature selection for predicting surgical outcomes. In Proceedings of the 39th Annual Hawaii International Conference on System Sciences (HICSS’06), Kauai, HI, USA, 4–7 January 2006; Volume 5, p. 93a. [Google Scholar] [CrossRef]
  129. Alturki, L.; Aloraini, K.; Aldughayshim, A.; Albahli, S. Predictors of readmissions and length of stay for diabetes related patients. In Proceedings of the 2019 IEEE/ACS 16th International Conference on Computer Systems and Applications (AICCSA), Abu Dhabi, United Arab Emirates, 3–7 November 2019; Volume 2019. [Google Scholar] [CrossRef]
  130. Zheng, B.; Zhang, J.; Yoon, S.; Lam, S.; Khasawneh, M.; Poranki, S. Predictive modeling of hospital readmissions using metaheuristics and data mining. Expert Syst. Appl. 2015, 42, 7110–7120. [Google Scholar] [CrossRef]
  131. Cui, S.; Wang, D.; Wang, Y.; Yu, P.W.; Jin, Y. An improved support vector machine-based diabetic readmission prediction. Comput. Methods Programs Biomed. 2018, 166, 123–135. [Google Scholar] [CrossRef] [PubMed]
  132. Zeinalnezhad, M.; Shishehchi, S. An integrated data mining algorithms and meta-heuristic technique to predict the readmission risk of diabetic patients. Healthc. Anal. 2024, 5, 100292. [Google Scholar] [CrossRef]
  133. Turgeman, L.; May, J.H. A mixed-ensemble model for hospital readmission. Artif. Intell. Med. 2016, 72, 72–82. [Google Scholar] [CrossRef] [PubMed]
  134. Liu, J.; Chen, X.; Fang, L.; Li, J.; Yang, T.; Zhan, Q.; Tong, K.; Fang, Z. Mortality prediction based on imbalanced high-dimensional ICU big data. Comput. Ind. 2018, 98, 218–225. [Google Scholar] [CrossRef]
  135. Ghorbani, R.; Ghousi, R.; Makui, A.; Atashi, A. A New Hybrid Predictive Model to Predict the Early Mortality Risk in Intensive Care Units on a Highly Imbalanced Dataset. IEEE Access 2020, 8, 141066–141079. [Google Scholar] [CrossRef]
  136. Barsasella, D.; Gupta, S.; Malwade, S.; Aminin; Susanti, Y.; Tirmadi, B.; Mutamakin, A.; Jonnagaddala, J.; Syed-Abdul, S. Predicting length of stay and mortality among hospitalized patients with type 2 diabetes mellitus and hypertension. Int. J. Med. Inform. 2021, 154, 104569. [Google Scholar] [CrossRef]
  137. Rodríguez, A.; Mendoza, D.; Ascuntar, J.; Jaimes, F. Supervised classification techniques for prediction of mortality in adult patients with sepsis. Am. J. Emerg. Med. 2021, 45, 392–397. [Google Scholar] [CrossRef]
  138. Gong, M.; Liang, D.; Xu, D.; Jin, Y.; Wang, G.; Shan, P. Analyzing predictors of in-hospital mortality in patients with acute ST-segment elevation myocardial infarction using an evolved machine learning approach. Comput. Biol. Med. 2024, 170, 107950. [Google Scholar] [CrossRef] [PubMed]
  139. Tashakkori, R.; Mozdgir, A.; Karimi, A.; BozorgzadehVostaKolaei, S. The prediction of NICU admission and identifying influential factors in four different categories leveraging machine learning approaches. Biomed. Signal Process. Control 2024, 90, 105844. [Google Scholar] [CrossRef]
  140. Song, J.; Hobensack, M.; Bowles, K.; McDonald, M.; Cato, K.; Rossetti, S.; Chae, S.; Kennedy, E.; Barron, Y.; Sridharan, S.; et al. Clinical notes: An untapped opportunity for improving risk prediction for hospitalization and emergency department visit during home health care. J. Biomed. Inform. 2022, 128, 104039. [Google Scholar] [CrossRef] [PubMed]
  141. Ghassemi, M.; Naumann, T.; Doshi-Velez, F.; Brimmer, N.; Joshi, R.; Rumshisky, A.; Szolovits, P. Unfolding physiological state: Mortality modelling in intensive care units. In Proceedings of the 20th ACM SIGKDD International Conference on Knowledge Discovery and Data Mining, New York, NY, USA, 24–27 August 2014; pp. 75–84. [Google Scholar] [CrossRef]
  142. Afrash, M.; Kazemi-Arpanahi, H.; Ranjbar, P.; Nopour, R.; Amraei, M.; Saki, M.; Shanbehzadeh, M. Predictive modeling of hospital length of stay in COVID-19 patients using machine learning algorithms. J. Med. Chem. Sci. 2021, 4, 525–537. [Google Scholar] [CrossRef]
  143. Song, W.; Zhang, L.; Liu, L.; Sainlaire, M.; Karvar, M.; Kang, M.J.; Pullman, A.; Lipsitz, S.; Massaro, A.; Patil, N.; et al. Predicting hospitalization of COVID-19 positive patients using clinician-guided machine learning methods. J. Am. Med. Inform. Assoc. 2022, 29, 1661–1667. [Google Scholar] [CrossRef] [PubMed]
  144. Gao, Y.; Chen, L.; Chi, J.; Zeng, S.; Feng, X.; Li, H.; Liu, D.; Feng, X.; Wang, S.; Wang, Y.; et al. Development and validation of an online model to predict critical COVID-19 with immune-inflammatory parameters. J. Intensive Care 2021, 9, 19. [Google Scholar] [CrossRef]
  145. Amer, R.; Samir, M.; Gaber, O.; EL-Deeb, N.; Abdelmoaty, A.; Ahmed, A.; Samy, W.; Atta, A.; Walaa, M.; Anis, R. Diagnostic performance of rapid antigen test for COVID-19 and the effect of viral load, sampling time, subject’s clinical and laboratory parameters on test accuracy. J. Infect. Public Health 2021, 14, 1446–1453. [Google Scholar] [CrossRef]
Figure 1. Typical stages in the development of an ML model such as an SVM to solve a classification or regression problem.
Information 15 00235 g001
Figure 2. Number of papers on “Support Vector Machines” AND “medical” in the subject area “MATH”.
Information 15 00235 g002
Figure 3. Percentage distribution of the reviewed papers.
Information 15 00235 g003
Figure 4. A schematic flowchart for the diagnosis of a disease with an SVM.
Information 15 00235 g004
Figure 5. An example of the “kernel trick”.
Information 15 00235 g005
Figure 6. A graphical example of a Twin Support Vector Machine.
Information 15 00235 g006
Figure 7. Several features characterising benchmark datasets.
Information 15 00235 g007
Table 1. Common performance metrics for classification and regression problems.
Evaluation MetricAcronymFormula
AccuracyAcc ( T P + T N ) ( T P + T N + F P + P N )
SensitivitySN T P ( T P + F N )
SpecificitySP T N ( T N + F P )
Geometric meanG-mean S N × S P
Matthews Correlation CoefficientMCC ( T P × T N ) ( F P × F N ) ( T P + F P ) ( T P + F N ) ( T N + F P ) ( T N + F N )
F1-scoreF1 T P T P + 1 2 ( F P + F N )
Mean Squared ErrorMSE i = 1 D ( y i y ˜ i ) 2
Root Mean Squared ErrorRMSE M S E
Mean Absolute ErrorMAE i = 1 D | y i y ˜ i |
Coefficient of Determination R 2 R 2 = 1 i = 1 D ( y i y ˜ i ) 2 i = 1 D ( y i y ¯ ) 2
Table 2. Common medical benchmark datasets.
DatasetNumber of InstancesNumber of FeaturesNumber of Classes
Colon cancer6220002
Leukemia7271292
Ovarian cancer21640002
Breast Cancer Coimbra11693
Ljubljana Breast Cancer28695
Wisconsin Breast Cancer Diagnostic (WBCD)569302
Wisconsin Breast Cancer Original (WBC)69992
BUPA liver disorder34572
Heart270132
Pima Indian76882
Parkinson197222
Hand Parkinson Disease (HandPD)736132
Thyroid21552
Table 3. SVM models developed and tested on the Wisconsin breast cancer benchmark datasets.
DatasetPaperMain ContributionApproachAccuracy (%)
WBCDSweilam et al. [46]Compared different methodsPSO + SVM93.52
QPSO + SVM93.06
Elkorany et al. [55]10-fold CVWOA-SVM97.89
Zheng et al. [58]Six featuresK-SVM97.38
Badr et al. [47]Compared scaling techniquesde Buchet and SVM98.60
Almotairi et al. [48]Compared scaling techniquesEquilibration scaling technique and HHO-SVM99.47
Akay [49]Five features selected based on F-scoreSVM99.51
WBCPolat and Günes [50]10-fold CVLS-SVM98.53
Azar and El-Said [52]SVM with an RBF kernelLP-SVM97.14
Singh et al. [54]SVM with an RBF kernelGWWOA-SVM97.72
Islam et al. [51]10-fold CVSVM98.57
Elkorany et al. [55]10-fold CVDA-SVM99.27
Rasool et al. [56]5-fold CVDET + PolySVM99.30
Kamel and Kheirabadi [53]Selected featuresSVM + GWO100
Table 4. Ensemble methods with SVMs tested on benchmark datasets in the medical fields.
PaperSVM ModelCharacteristics and FindingsBenchmark Datasets
Yao et al. [26]K-SVMReduced training set and computational time w.r.t. LibSVMWBCD, Heart, Liver disorders
Conforti and Guido [59]SVM-SDPOptimal kernel matrix using a semidefinite programming approachWBCD, Heart dataset, Thyroid, Leukemia, Colon cancer, Ovarian cancer
Wang et al. [60]WAUCE-SVMHigh accuracy and low varianceWBC, WBCD, SEER
Blanco et al. [61]Clustering-SVMIdentify incorrect labels, minimise misclassification errors, penalise relabellingUCI
Reza et al. [62]Integrated Kernel-SVMLinear combination of RBF and RBF city block kernelsPIMA diabetes
Ding et al. [65]OELM-RFEFaster on gene expression datasets than SVM-RFEThree gene expression datasets
Chang and Lin [67]GRCV-l2SVMBetter results than inexact CV and grid search methodsHeart dataset, Breast-cancer, Colon-cancer, Diabetes
Huong et al. [68]SVM with CNNHigh sensitivity and specificity, good reproducibility, and fast training timeCervical cell
Ke et al. [69]MMHS-SVMRBF kernel. Best classifier on 11 out of 15 datasetsUCI
Yan and Li [70]Augumented Lagrangian methodHigher accuracy and speed than DCDseveral LIBLINEAR datasets
Groccia et al. [71]MCS frameworkHigh performance by dynamic classifier selection techniquesWBCD, WBC, Mammographic mass, Diabetic retinopathy, Dermatology
Table 5. TWSVM models developed and tested on benchmark datasets in the medical field.
PaperTWSVM ModelCharacteristics and FindingsBenchmark Datasets
Arun Kumar and Gopal [73]LS-TWSVMFaster than TWSVMUCI
Yang et al. [87]TWMPMPerformances close to TWSVMUCI
Ma and Yu [88]TMPMCSolves two smaller SOCPsUCI
Zhou et al. [76]TWSVMPathNovel fast regularization parameter tuning algorithmUCI
Rezvani et al. [77]IF-TWSVMReduced influence of noise and outliersUCI
Bai et al. [81]SIF-TWSVMMore competitive than other semi-supervised methodsUCI
Tomar and Agarwal [74]Extended LS-TWSVMbetter results than existing multi-classification approaches12 datasets KEEL
Richhariya and Tanveer [82]ULS-TPMSVMBetter performance than TWSVM, LSTWSVM, LSTPMSVM and ULSTWSVMUCI, KEEL
Ganaie et al. [78]IIF-TWSVMminimizes the structural risk improving the generalization performanceKEEL and EEG dataset
Lyaqini et al. [84]Primal-dual algorithm for nonsmooth TWSVMOutperformed popular deep learning modelsUCI, UlcerDB, CVC-ClinicDB, HandPD
Moosaei et al. [83]LS-UMTWSVMQuick and efficient approach for medical dataImmunotherapy, Ljubljana Breast Cancer, Breast Cancer Coimbra, Caesarian
Peng [72] ν -TWSVMBetter generalization and faster learning than classical SVM and TWSVMHeart, Thyroid, WBCD, PIMA
Wang and Zhang [75]Pin-TKSVCA more robust classifier with two smaller sized QPPs to save running timesDermatology, Thyroid
Shao et al. [79]CP-TWSVMBetter generalization and interpretability than TWSVMsEEG
Table 6. SVM-based models and TWSVM-based models.
SVM-BasedTWSVM-Based
B-SVMBiased SVMCP-TWSVMConditional probability twin SVM
F-SVMFuzzy SVMsIF-TWSVMIntuitionistic fuzzy TWSVM
FSVM-CILFuzzy SVMs for Class Imbalance LearningIIF-TWSVMImproved IF-TWSVM
GEP-SVMGeneralized Eigenvalue Proximal SVMIRU-TWSVMInverse reduced universum TWSVM
IFRVFLNIntuitionistic Fuzzy Random VectorKWRU-TWSVM-CILKNN Weighted Reduced Universum TWSVM
functional link network for Class Imbalance Learning
K-SVMK-means SVMLS-TPMSVMLeast squares Twin Parametric-Margin SVM
LP-SVMLinear Programming SVMLS-TWSVMLeast Squares TWSVM
LS-SVMLeast Squares SVMsPin-TKSVCTwin K-class SVM with Pinball loss
LSVMLagrangian SVMSIF-TWSVMSemi-supervised IF-TWSVM
MLW-SVMMultiLevel Weighted SVMsTWSVMPathFast regularization parameter tuning
MMHS-SVMMaximum Margin Hyper-Sphere SVM algorithm for TWSVM
N-SVMNewton method for LSVMTWFTWSVMFuzzy TWSVM with Three-Way membership
OELM-RFEOptimized Extreme LearningTWMPMTwin Minimax Probability Machine
 machine-based RFETWMPMCTwin Minimax Probability Machine
P-FSVMPairwise-fuzzy SVM Classification
Pin-SVMPinball loss SVMULS-TWSVMUniversum Least Squares TWSVM
PN-SVMParametric non-parallel SVMULS-TPMSVMUniversum Least Squares Twin
P-SVMProximal SVM Parametric-margin SVM
S-SVMSmooth SVMU-TWSVMUniversum TWSVM
SVM-RFESVM-based Recursive Feature EliminationUM-TWSVMUniversum Multi-task TWSVM
WCS-BSVMWithin-class scatter biased SVMLS-UMTWSVMLeast-Square UM-TWSVM
WWCS-BSVMWeighted Within-Class Scatter Biased SVMRU-TWSVMReduced Universum TWSVM
U-SVMUniversum SVMRU-TWSVM-CILReduced Universum TWSVM for CIL
ν -SVM ν -TWBSVM ν -Twin Bounded SVM
I ν -TWBSVMImproved ν -Twin Bounded SVM
Table 7. Main characteristics of the SVM-based models developed and tested on imbalanced datasets in the medical fields.
PaperSVM ModelOther TechniquesCharacteristics and Finding
Sain and Purnami [92]Gaussian SVMSMOTE, Tomek linksPIMA: G-Mean = 1; F 1 = 0.998; ROC = 0.868.
Jian et al. [91]B-SVMNew sampling method for SVs and NSVsImproved ROC, G-mean and AUC value
Ebenuwa et al. [93]SVMVRASWBCD and Bupa liver disorder: improved ROC, F1 and ACC
Núñez et al. [94]SVMLow cost post-processing strategy based on biasImproved sensitivity
Dubey et al. [95]SVMRandom, K_Medoids, SMOTEADNI: balanced sensitivity and specificity with K_Medoids undersampling technique
Zhang and Zhong [96]WWCS-BSVM Haberman dataset: better results than other SVM models
Razzaghi et al. [97]Multilevel SVM Fast and accurate results
Zhang et al. [98], Zhang et al. [99]SVM hyperparameter tuning model High-performance computing
Guido et al. [100], Guido et al. [101]Cost-sensitive SVMGenetic algorithmShort computational time for the best hyper-parameter values
Ganaie et al. [102]KWRUTWSVM-CILStructural risk minimization principle, local neighbourhood informationADNI and WBCD: improved average accuracy
Cai et al. [104]TWFTWSVM UCI: improved G-Mean
Table 8. SVM-based models used in real case studies.
Healthcare ProblemPapers
Diabetes[105,106,107]
Sleep apnea[108,109]
Glaucoma[110,112,113,114]
Graft survival[115]
Myocardial infarction[111,116]
Tumor[117,118,119]
Brain health[120,121]
Disclaimer/Publisher’s Note: The statements, opinions and data contained in all publications are solely those of the individual author(s) and contributor(s) and not of MDPI and/or the editor(s). MDPI and/or the editor(s) disclaim responsibility for any injury to people or property resulting from any ideas, methods, instructions or products referred to in the content.

