
An Agent-Based Model for Disease Epidemics in Greece


Abstract
1. Introduction
- We present a framework for creating synthetic populations in the Greek territory, utilizing statistical distributions derived from census data from various public sources. These synthetic populations serve as the foundation for a data-driven, multi-layer agent-based model specifically designed to simulate the dynamics of infectious diseases in Greece;
- We apply an SEIR virus propagation model to simulate the dynamics of the virus on the synthetic population.
2. Preliminaries
Related Work

| Country | Population Creation | Number of Agents | Model Type | Infection Model | Year | Reference |
|---|---|---|---|---|---|---|
| Australia | census, national data sources | 0.5 m | several mixing groups | SEIR | 2020 | [20] |
| France | previous work, papers | 0.5 m extrapolated to 67 m | stochastic microsimulation ABM | not defined | 2020 | [21] |
| Ireland | census mainly | 0.1 m | NetLogo User Community Models | SEIR | 2018 | [22] |
| Brazil | census | 10 m | multi-layer network | SIRD | 2020 | [23] |
| Switzerland | synthetic population from census | 9 m | ABM and a stochastic model that simulates, on a sub-hourly timescale, the different daily activities of all individuals | not defined | 2020 | [24] |
| Finland | census statistics | 1.6 m | random interactions | SEIR | 2020 | [25] |
| USA | synthetic population from census | 30 m | mixing patterns | SEIRS | 2013 | [26] |
| Italy | census | 57 m | multi-layer network | SEIR | 2008 | [27] |
| Canada | projections | not defined | multi-layer network | SEIR | 2020 | [28] |
| Hong Kong | synthetic population from census | 0.73 m | three-dimensional vertically expanded | not defined | 2022 | [29] |
| Shenzen, China | mobile phone records, census | 11.2 m | spatially explicit ABM | SLIR | 2021 | [30] |
| Urmia, Iran | census and spatial data | 0.75 m | mobile & static agents | SEIRD | 2020 | [31] |
| Bogotá, Colombia | synthetic population from census | 9 m | random network | SEIRMD | 2021 | [32] |
| Madrid, Spain | census and social network data | 5 m | multi-layer network | SEIR | 2021 | [33] |
| Austria | census | 9 m | multi-layer network | not defined | 2022 | [34] |
| Moscow oblast, Russia | census | 10 m | multi-layer network | SLIR | 2022 | [39] |
| American Samoa | census, questionnaires and land usage | 0.055 m | age and household distribution, population evolution | not defined | 2017 | [35] |
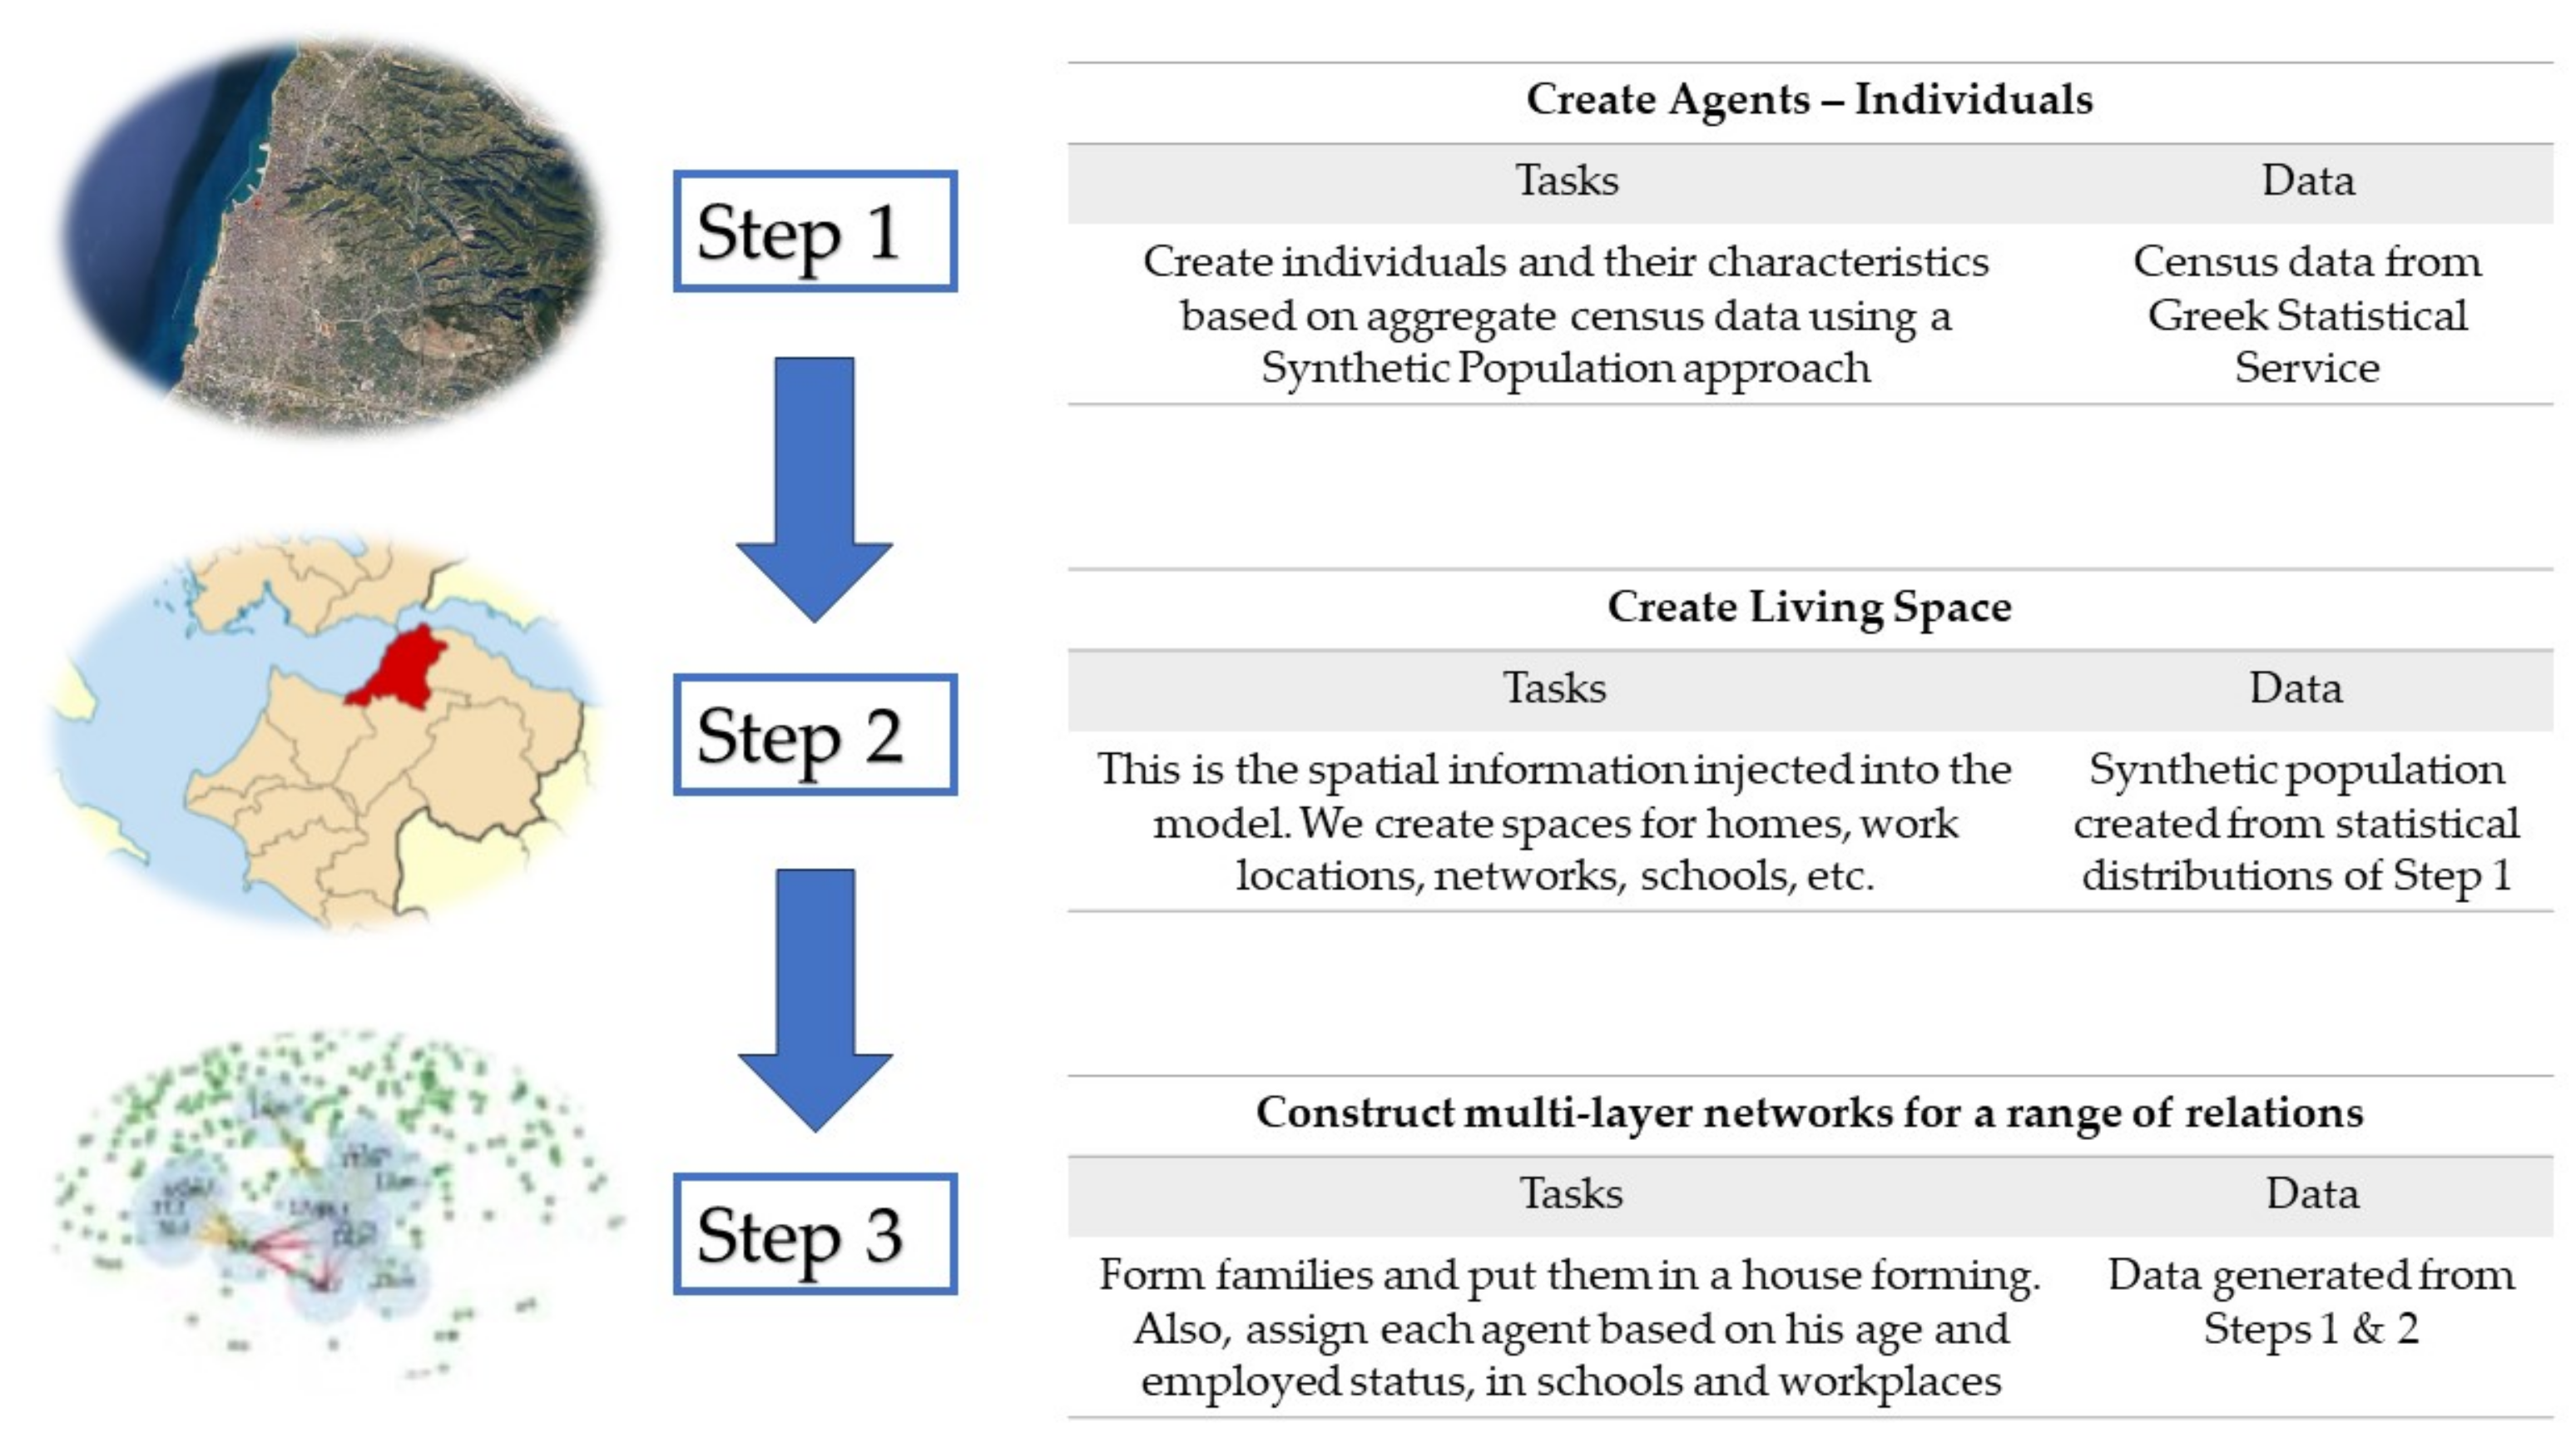
3. Methodology
- Create Agents—Individuals: Create individuals and their characteristics based on census data using an SR approach [50]. We adopt the SR approach since only aggregate data is available for Greece;
- Create Living Space: This is the spatial information injected into the model. We create space for representing relations within homes, work locations, and schools. We do not consider geographical information;
- Household: A set of cliques for the members of a family. This is the easiest task considering that families have already been formed from the first step. This network represents relations and as such, it is static within a limited time horizon;
- Work: A set of small-world networks between agents in the same workplace. This is a contact network. An open-source method for creating home/work/school networks that follow this methodology can be found in [54];
- Schools: A set of small-world networks corresponding to the interactions between students;
- Random-contact networks: These correspond to random interactions between agents within the world. Small-world networks are used and they change between successive steps;
- Friendship Networks: Strong ties in the form of friendships are represented by a static network that could further give rise to more regular contacts. This network is formed by a social-mixing matrix that measures the frequency of relationships between agents in the same or different age groups. We have adopted the social-mixing matrix approach that is inferred by publicly available data of physical contacts and interactions for a country with a similar socio-economic structure and mentality, specifically, Italy [55]. Indeed, there are strong similarities between the two neighboring Mediterranean countries of Greece and Italy. These similarities include a common history, shared cultural values, strong family ties, and a laid-back social atmosphere. Due to the unavailability of specific social interaction data for Greece, we utilized data from the Italian population, considering the numerous resemblances between the two nations. This practice is common in research, particularly when data for a specific region are not readily accessible, and a comparable region is considered representative. However, it is important to note that this approach is subject to future refinement as part of ongoing research to obtain dedicated social interaction data for Greece.
3.1. The Synthetic Population
- Collection and preprocessing of the data: We collected the real data on the demographics, education, employment, and other characteristics of the population from the Greek Statistic Service (ELSTAT) and the Greek Manpower Employment Organization (DYPA). These data are cleaned by removing missing and irrelevant values in order to ensure that they are accurate and consistent;
- Definition of agent attributes: Based on the data collected in the previous step and the assumptions about the characteristics of the population, we defined the attributes of the agents in the synthetic population, as shown in Table 2. We use a Python dictionary to store the attributes of each agent;
- Generation of the synthetic data: We used statistical model distributions to generate synthetic data. These data represent the characteristics of the individual members of the population. These are based on the real aggregated data and the assumptions about the distribution of these characteristics;.
- Assignment of the attributes to the agents: We iterated over the agents, and assigned the generated attributes to each agent, based on the synthetic data from the previous step. In other words, we “expanded” the aggregated data to agents representing members of the population by simulating the real distributions;
- Calculation and initialization of additional attributes: We calculated any additional attributes that were not included in the real data, such as the infection status of each agent. This was done by randomly initializing a small number of the agents as “Infected” and the rest as “Susceptible”.
3.2. Propagation Model
- : This is the transmission rate or contact rate, representing the probability of transmitting the disease from an infectious individual to a susceptible one. A higher generally leads to a faster spread of the disease;
- : This parameter represents the rate at which exposed individuals become infectious. The reciprocal of is the mean incubation period. It accounts for the time between exposure to the virus and the individual becoming infectious;
- : This is the recovery rate, indicating the fraction of infected individuals recovering per unit of time. The reciprocal of is the average infectious period. A shorter infectious period corresponds to a higher recovery rate.
3.3. Technical Description of the System
4. Experimental Results
Discussion
5. Conclusions
- Generalize our model to the whole Greek territory. In addition, we want to add more behaviors/traits in the population based on census and other publicly available data;
- Extend the propagation model to take into account various states for the agents. This will make the model more realistic but at the same time will make it harder to tune since the number of parameters will increase;
- Contact epidemiological research teams within Greece in order to further advance and tune the model and the system based on experts’ opinions;
- Extend the generator of the synthetic population towards other goals (e.g., transportation studies);
- Extend the model to look at social implications of interventions, like economic implications, e.g., what is the economic cost of imposing an upper bound on the number of customers as a function of the area of a shop?
Author Contributions
Funding
Institutional Review Board Statement
Informed Consent Statement
Data Availability Statement
Acknowledgments
Conflicts of Interest
References
- Bjørnstad, O.N.; Shea, K.; Krzywinski, M.; Altman, N. Modeling infectious epidemics. Nat. Methods 2020, 17, 455–456. [Google Scholar] [CrossRef] [PubMed]
- Barrett, C.; Bisset, K.; Leidig, J.; Marathe, A.; Marathe, M.V. An Integrated Modeling Environment to Study the Co-evolution of Networks, Individual Behavior and Epidemics. AI Mag. 2010, 31, 75–87. [Google Scholar] [CrossRef]
- Barrett, C.; Bisset, K.; Leidig, J.; Marathe, A.; Marathe, M. Economic and social impact of influenza mitigation strategies by demographic class. Epidemics 2011, 3, 19–31. [Google Scholar] [CrossRef]
- Bonabeau, E. Agent-based modeling: Methods and techniques for simulating human systems. Proc. Natl. Acad. Sci. USA 2002, 99, 7280–7287. [Google Scholar] [CrossRef] [PubMed]
- Rapti, A.; Tsichlas, K.; Sioutas, S.; Tzimas, G. Virus propagation: Threshold conditions for multiple profile networks. Knowl. Inf. Syst. 2018, 60, 807–836. [Google Scholar] [CrossRef]
- Yaméogo, B.F.; Gastineau, P.; Hankach, P.; Vandanjon, P.O. Comparing Methods for Generating a Two-Layered Synthetic Population. Transp. Res. Rec. 2021, 2675, 136–147. [Google Scholar] [CrossRef]
- Barthelemy, J.; Toint, P.L. Synthetic Population Generation Without a Sample. Transp. Sci. 2013, 47, 266–279. [Google Scholar] [CrossRef]
- Ma, L.; Srinivasan, S. Synthetic Population Generation with Multilevel Controls: A Fitness-Based Synthesis Approach and Validations. Comput.-Aided Civ. Infrastruct. Eng. 2015, 30, 135–150. [Google Scholar] [CrossRef]
- Sun, L.; Erath, A. A Bayesian network approach for population synthesis. Transp. Res. Part C Emerg. Technol. 2015, 61, 49–62. [Google Scholar] [CrossRef]
- Wu, H.; Ning, Y.; Chakraborty, P.; Vreeken, J.; Tatti, N.; Ramakrishnan, N. Generating Realistic Synthetic Population Datasets. ACM Trans. Knowl. Discov. Data 2018, 12, 1–22. [Google Scholar] [CrossRef]
- Borysov, S.S.; Rich, J.; Pereira, F.C. How to generate micro-agents? A deep generative modeling approach to population synthesis. Transp. Res. Part C Emerg. Technol. 2019, 106, 73–97. [Google Scholar] [CrossRef]
- Lenormand, M.; Deffuant, G. Generating a Synthetic Population of Individuals in Households: Sample-Free Vs Sample-Based Methods. J. Artif. Soc. Soc. Simul. 2013, 16, 12. [Google Scholar] [CrossRef]
- Fichera, A.; Pluchino, A.; Volpe, R. A multi-layer agent-based model for the analysis of energy distribution networks in urban areas. Phys. A Stat. Mech. Its Appl. 2018, 508, 710–725. [Google Scholar] [CrossRef]
- Interdonato, R.; Magnani, M.; Perna, D.; Tagarelli, A.; Vega, D. Multilayer network simplification: Approaches, models and methods. Comput. Sci. Rev. 2020, 36, 100246. [Google Scholar] [CrossRef]
- Beckman, R.J.; Baggerly, K.A.; McKay, M.D. Creating synthetic baseline populations. Transp. Res. Part A Policy Pract. 1996, 30, 415–429. [Google Scholar] [CrossRef]
- Müller, K.; Axhausen, K.W. Population Synthesis for Microsimulation: State of the Art. In Proceedings of the Transportation Research Board 90th Annual Meeting, Washington, DC, USA, 10–14 January 2010. [Google Scholar]
- Gallagher, S.; Richardson, L.; Ventura, S.; Eddy, W. SPEW: Synthetic Populations and Ecosystems of the World. J. Comput. Graph. Stat. 2017, 27, 773–784. [Google Scholar] [CrossRef]
- Center, M.P. Integrated Public Use Microdata Series, International: Version 7.2 [Dataset]; IPUMS: Minneapolis, MN, USA, 2019. [Google Scholar] [CrossRef]
- Lorig, F.; Johansson, E.; Davidsson, P. Agent-Based Social Simulation of the COVID-19 Pandemic: A Systematic Review. J. Artif. Soc. Soc. Simul. 2021, 24, 5. [Google Scholar] [CrossRef]
- Chang, S.L.; Harding, N.; Zachreson, C.; Cliff, O.M.; Prokopenko, M. Modelling transmission and control of the COVID-19 pandemic in Australia. Nat. Commun. 2020, 11, 5710. [Google Scholar] [CrossRef]
- Hoertel, N.; Blachier, M.; Blanco, C.; Olfson, M.; Massetti, M.; Rico, M.S.; Limosin, F.; Leleu, H. Lockdown exit strategies and risk of a second epidemic peak: A stochastic agent-based model of SARS-CoV-2 epidemic in France. Nat. Med. 2020, 26, 1417–1421. [Google Scholar] [CrossRef]
- Hunter, E.; Namee, B.M.; Kelleher, J. An open-data-driven agent-based model to simulate infectious disease outbreaks. PLoS ONE 2018, 13, e0208775. [Google Scholar] [CrossRef]
- Canabarro, A.; Tenório, E.; Martins, R.; Martins, L.; Brito, S.; Chaves, R. Data-driven study of the COVID-19 pandemic via age-structured modelling and prediction of the health system failure in Brazil amid diverse intervention strategies. PLoS ONE 2020, 15, e0236310. [Google Scholar] [CrossRef]
- Marini, M.; Chokani, N.; Abhari, R.S. COVID-19 Epidemic in Switzerland: Growth Prediction and Containment Strategy Using Artificial Intelligence and Big Data. medRxiv 2020, 20047472. [Google Scholar] [CrossRef]
- Tuomisto, J.T.; Yrjölä, J.; Kolehmainen, M.; Bonsdorff, J.; Pekkanen, J.; Tikkanen, T. An agent-based epidemic model REINA for COVID-19 to identify destructive policies. medRxiv 2020, 20047498. [Google Scholar] [CrossRef]
- Grefenstette, J.J.; Brown, S.T.; Rosenfeld, R.; DePasse, J.; Stone, N.T.; Cooley, P.C.; Wheaton, W.D.; Fyshe, A.; Galloway, D.D.; Sriram, A.; et al. FRED (A Framework for Reconstructing Epidemic Dynamics): An open-source software system for modeling infectious diseases and control strategies using census-based populations. BMC Public Health 2013, 13, 940. [Google Scholar] [CrossRef]
- degli Atti, M.L.C.; Merler, S.; Rizzo, C.; Ajelli, M.; Massari, M.; Manfredi, P.; Furlanello, C.; Tomba, G.S.; Iannelli, M. Mitigation Measures for Pandemic Influenza in Italy: An Individual Based Model Considering Different Scenarios. PLoS ONE 2008, 3, e1790. [Google Scholar] [CrossRef]
- Ng, V.; Fazil, A.; Waddell, L.A.; Bancej, C.; Turgeon, P.; Otten, A.; Atchessi, N.; Ogden, N.H. Projected effects of nonpharmaceutical public health interventions to prevent resurgence of SARS-CoV-2 transmission in Canada. Can. Med Assoc. J. 2020, 192, E1053–E1064. [Google Scholar] [CrossRef]
- Koh, K.; Tang, K.C.; Axhausen, K.; Loo, B.P. A metropolitan-scale, three-dimensional agent-based model to assess the effectiveness of the COVID-19 Omicron wave interventions in a hyperdense city: A case study of Hong Kong. Int. J. Infect. Dis. 2022, 122, 534–536. [Google Scholar] [CrossRef]
- Yin, L.; Zhang, H.; Li, Y.; Liu, K.; Chen, T.; Luo, W.; Lai, S.; Li, Y.; Tang, X.; Ning, L.; et al. A data driven agent-based model that recommends non-pharmaceutical interventions to suppress Coronavirus disease 2019 resurgence in megacities. J. R. Soc. Interface 2021, 18, 20210112. [Google Scholar] [CrossRef]
- Gharakhanlou, N.M.; Hooshangi, N. Spatio-temporal simulation of the novel coronavirus (COVID-19) outbreak using the agent-based modeling approach (case study: Urmia, Iran). Inform. Med. Unlocked 2020, 20, 100403. [Google Scholar] [CrossRef]
- Gomez, J.; Prieto, J.; Leon, E.; Rodríguez, A. INFEKTA—An agent-based model for transmission of infectious diseases: The COVID-19 case in Bogotá, Colombia. PLoS ONE 2021, 16, e0245787. [Google Scholar] [CrossRef]
- Singh, D.E.; Marinescu, M.C.; Guzmán-Merino, M.; Durán, C.; Delgado-Sanz, C.; Gomez-Barroso, D.; Carretero, J. Simulation of COVID-19 Propagation Scenarios in the Madrid Metropolitan Area. Front. Public Health 2021, 9, 636023. [Google Scholar] [CrossRef] [PubMed]
- Bicher, M.; Rippinger, C.; Schneckenreither, G.; Weibrecht, N.; Urach, C.; Zechmeister, M.; Brunmeir, D.; Huf, W.; Popper, N. Model based estimation of the SARS-CoV-2 immunization level in austria and consequences for herd immunity effects. Sci. Rep. 2022, 12, 2872. [Google Scholar] [CrossRef] [PubMed]
- Xu, Z.; Glass, K.; Lau, C.L.; Geard, N.; Graves, P.; Clements, A. A Synthetic Population for Modelling the Dynamics of Infectious Disease Transmission in American Samoa. Sci. Rep. 2017, 7, 16725. [Google Scholar] [CrossRef] [PubMed]
- Mossong, J.; Hens, N.; Jit, M.; Beutels, P.; Auranen, K.; Mikolajczyk, R.; Massari, M.; Salmaso, S.; Tomba, G.S.; Wallinga, J.; et al. Social Contacts and Mixing Patterns Relevant to the Spread of Infectious Diseases. PLoS Med. 2008, 5, e74. [Google Scholar] [CrossRef]
- Rodríguez, J.P.; Aleta, A.; Moreno, Y. Digital cities and the spread of COVID-19: Characterizing the impact of non-pharmaceutical interventions in five cities in Spain. Front. Public Health 2023, 11, 1122230. [Google Scholar] [CrossRef] [PubMed]
- Peng, Y.; Rodriguez Lopez, J.M.; Santos, A.P.; Mobeen, M.; Scheffran, J. Simulating exposure-related human mobility behavior at the neighborhood-level under COVID-19 in Porto Alegre, Brazil. Cities 2023, 134, 104161. [Google Scholar] [CrossRef]
- Rykovanov, G.N.; Lebedev, S.N.; Zatsepin, O.V.; Kaminskii, G.D.; Karamov, E.V.; Romanyukha, A.A.; Feigin, A.M.; Chetverushkin, B.N. Agent-Based Simulation of the COVID-19 Epidemic in Russia. Her. Russ. Acad. Sci. 2022, 92, 479–487. [Google Scholar] [CrossRef]
- Venkatramanan, S.; Lewis, B.; Chen, J.; Higdon, D.; Vullikanti, A.; Marathe, M. Using data-driven agent-based models for forecasting emerging infectious diseases. Epidemics 2018, 22, 43–49. [Google Scholar] [CrossRef]
- Parker, J.; Epstein, J.M. A Distributed Platform for Global-Scale Agent-Based Models of Disease Transmission. ACM Trans. Model. Comput. Simul. 2011, 22, 1–25. [Google Scholar] [CrossRef] [PubMed]
- Ferguson, N.; Laydon, D.; Nedjati Gilani, G.; Imai, N.; Ainslie, K.; Baguelin, M.; Bhatia, S.; Boonyasiri, A.; Cucunuba Perez, Z.; Cuomo-Dannenburg, G.; et al. Report 9: Impact of Non-Pharmaceutical Interventions (NPIs) to Reduce COVID19 Mortality and Healthcare Demand; Imperial College: London, UK, 2020. [Google Scholar] [CrossRef]
- Adam, D. Special report: The simulations driving the world’s response to COVID-19. Nature 2020, 580, 316–318. [Google Scholar] [CrossRef] [PubMed]
- Leung, K.; Wu, J.T. Quantifying the uncertainty of CovidSim. Nat. Comput. Sci. 2021, 1, 98–99. [Google Scholar] [CrossRef]
- North, M.J.; Collier, N.T.; Ozik, J.; Tatara, E.R.; Macal, C.M.; Bragen, M.; Sydelko, P. Complex adaptive systems modeling with Repast Simphony. Complex Adapt. Syst. Model. 2013, 1, 3. [Google Scholar] [CrossRef]
- Zhang, W.; Liu, S.; Osgood, N.; Zhu, H.; Qian, Y.; Jia, P. Using simulation modelling and systems science to help contain COVID-19: A systematic review. Syst. Res. Behav. Sci. 2022, 40, 207–234. [Google Scholar] [CrossRef]
- Morveit, H.; Reidys, C. An Introduction to Sequential Dynamical Systems; Springer International Publishing: Berlin/Heidelberg, Germany, 2007. [Google Scholar]
- Bissett, K.; Cadena, J.; Khan, M.; Kuhlman, C. Agent-Based Computational Epidemiological Modeling. J. Indian Inst. Sci. 2021, 101, 303–327. [Google Scholar] [CrossRef]
- Jiang, N.; Crooks, A.T.; Kavak, H.; Burger, A.; Kennedy, W.G. A method to create a synthetic population with social networks for geographically-explicit agent-based models. Comput. Urban Sci. 2022, 2, 7. [Google Scholar] [CrossRef]
- Chapuis, K.; Taillandier, P.; Drogoul, A. Generation of Synthetic Populations in Social Simulations: A Review of Methods and Practices. J. Artif. Soc. Soc. Simul. 2022, 25, 6. [Google Scholar] [CrossRef]
- Watthanasutthi, N.; Muangsin, V. Generating synthetic population at individual and household levels with aggregate data. In Proceedings of the 2016 13th International Joint Conference on Computer Science and Software Engineering (JCSSE), Khon Kaen, Thailand, 13–15 July 2016; pp. 1–6. [Google Scholar] [CrossRef]
- Wickramasinghe, B.N.; Singh, D.; Padgham, L. Building a large synthetic population from Australian census data. CoRR 2020, abs/2008.11660. Available online: http://xxx.lanl.gov/abs/2008.11660 (accessed on 31 December 2023).
- Murata, T.; Harada, T. Nation-wide synthetic reconstruction method. In Proceedings of the 2017 IEEE Symposium Series on Computational Intelligence (SSCI), Honolulu, HI, USA, 27 November–1 December 2017; pp. 1–6. [Google Scholar] [CrossRef]
- Burger, A.; Oz, T.; Crooks, A.; Kennedy, W.G. Generation of Realistic Mega-City Populations and Social Networks for Agent-Based Modeling. In Proceedings of the 2017 International Conference of The Computational Social Science Society of the Americas, Santa Fe, NM, USA, 19–22 October 2017; Association for Computing Machinery: New York, NY, USA, 2017. [Google Scholar] [CrossRef]
- Guarino, S.; Mastrostefano, E.; Bernaschi, M.; Celestini, A.; Cianfriglia, M.; Torre, D.; Zastrow, L.R. Inferring Urban Social Networks from Publicly Available Data. Future Internet 2021, 13, 108. [Google Scholar] [CrossRef]
- McGlashan, N. Uses of the Poisson Probability Model with Human Populations. Pac. Viewp. 1976, 17, 167–174. [Google Scholar] [CrossRef]
- Kawakami, S.; Iwata, T.; Matsuda, K.; Sekimoto, Y. Workplace Assignment to Workers in Synthetic Populations in Japan. IEEE Trans. Comput. Soc. Syst. 2022, 10, 1–10. [Google Scholar] [CrossRef]
- Kermack, W.O.; McKendrick, A.G. A contribution to the mathematical theory of epidemics. Proc. R. Soc. London. Ser. A Contain. Pap. Math. Phys. Character 1927, 115, 700–721. [Google Scholar]
- Heng, K.; Althaus, C.L. The approximately universal shapes of epidemic curves in the Susceptible-Exposed-Infectious-Recovered (SEIR) model. Sci. Rep. 2020, 10, 19365. [Google Scholar] [CrossRef]
- Li, M.Y.; Graef, J.R.; Wang, L.; Karsai, J. Global dynamics of a SEIR model with varying total population size. Math. Biosci. 1999, 160, 191–213. [Google Scholar] [CrossRef]
- Berger, D.; Herkenhoff, K.; Mongey, S. An SEIR Infectious Disease Model with Testing and Conditional Quarantine. Tech. Rep. 2020, 26901. [Google Scholar] [CrossRef]
- Purkayastha, S.; Bhattacharyya, R.; Bhaduri, R.; Kundu, R.; Gu, X.; Salvatore, M.; Ray, D.; Mishra, S.; Mukherjee, B. A comparison of five epidemiological models for transmission of SARS-CoV-2 in India. Bmc Infect. Dis. 2021, 21, 533. [Google Scholar] [CrossRef]
- Iranzo, V.; Pérez-González, S. Epidemiological models and COVID-19: A comparative view. Hist. Philos. Life Sci. 2021, 43, 104. [Google Scholar] [CrossRef]
- Wang, D.; Hu, B.; Hu, C.; Zhu, F.; Liu, X.; Zhang, J.; Wang, B.; Xiang, H.; Cheng, Z.; Xiong, Y.; et al. Clinical Characteristics of 138 Hospitalized Patients With 2019 Novel Coronavirus–Infected Pneumonia in Wuhan, China. JAMA 2020, 323, 1061. [Google Scholar] [CrossRef]
- Lauer, S.A.; Grantz, K.H.; Bi, Q.; Jones, F.K.; Zheng, Q.; Meredith, H.R.; Azman, A.S.; Reich, N.G.; Lessler, J. The Incubation Period of Coronavirus Disease 2019 (COVID-19) From Publicly Reported Confirmed Cases: Estimation and Application. Ann. Intern. Med. 2020, 172, 577–582. [Google Scholar] [CrossRef] [PubMed]
- Jayatilaka, R.; Patel, R.; Brar, M.; Tang, Y.; Jisrawi, N.; Chishtie, F.; Drozd, J.; Valluri, S. A mathematical model of COVID-19 transmission. Mater. Today Proc. 2022, 54, 101–112. [Google Scholar] [CrossRef] [PubMed]
- van Boven, M.; van Dorp, C.H.; Westerhof, I.; Jaddoe, V.; Heuvelman, V.; Duijts, L.; Fourie, E.; Sluiter-Post, J.; van Houten, M.A.; Badoux, P.; et al. Estimation of introduction and transmission rates of SARS-CoV-2 in a prospective household study. Plos Comput. Biol. 2024, 20, e1011832. [Google Scholar] [CrossRef] [PubMed]
- Crellen, T.; Pi, L.; Davis, E.L.; Pollington, T.M.; Lucas, T.C.D.; Ayabina, D.; Borlase, A.; Toor, J.; Prem, K.; Medley, G.F.; et al. Dynamics of SARS-CoV-2 with waning immunity in the UK population. Philos. Trans. R. Soc. B Biol. Sci. 2021, 376, 20200274. [Google Scholar] [CrossRef] [PubMed]
- Ukwishaka, J.; Ndayishimiye, Y.; Destine, E.; Danwang, C.; Kirakoya-Samadoulougou, F. Global prevalence of coronavirus disease 2019 reinfection: A systematic review and meta-analysis. BMC Public Health 2023, 23, 778. [Google Scholar] [CrossRef]
- McMahon, A.; Robb, N.C. Reinfection with SARS-CoV-2: Discrete SIR (Susceptible, Infected, Recovered) Modeling Using Empirical Infection Data. JMIR Public Health Surveill. 2020, 6, e21168. [Google Scholar] [CrossRef]
- Kazil, J.; Masad, D.; Crooks, A. Utilizing Python for Agent-Based Modeling: The Mesa Framework. In Social, Cultural, and Behavioral Modeling; Springer International Publishing: Berlin/Heidelberg, Germany, 2020; pp. 308–317. [Google Scholar] [CrossRef]
- Giral-Barajas, J.; Herrera-Nolasco, C.I.; Herrera-Valdez, M.A.; López, S.I. A probabilistic approach for the study of epidemiological dynamics of infectious diseases: Basic model and properties. J. Theor. Biol. 2023, 572, 111576. [Google Scholar] [CrossRef]
- Axtell, R.; Epstein, J. Agent-Based Modeling: Understanding Our Creations. Bull. Santa Inst. 1994, 9, 28–32. [Google Scholar]
- Platas-López, A.; Guerra-Hernández, A.; Quiroz-Castellanos, M.; Cruz-Ramírez, N. Agent-Based Models Assisted by Supervised Learning: A Proposal for Model Specification. Electronics 2023, 12, 495. [Google Scholar] [CrossRef]


| Attribute | Description |
|---|---|
| Agent_ID | Agent’s ID |
| Gender | Agent’s gender (Male/Female) |
| Age | Agent’s age from 0 to 100 |
| Family_size | Members of agent’s family |
| Family_ID | Determines families |
| Work_ID | Determines workplaces, if applicable |
| School_ID | Determines schools, if applicable |
| Infection Status | Suspectible/Exposed/Infected/Recovered |
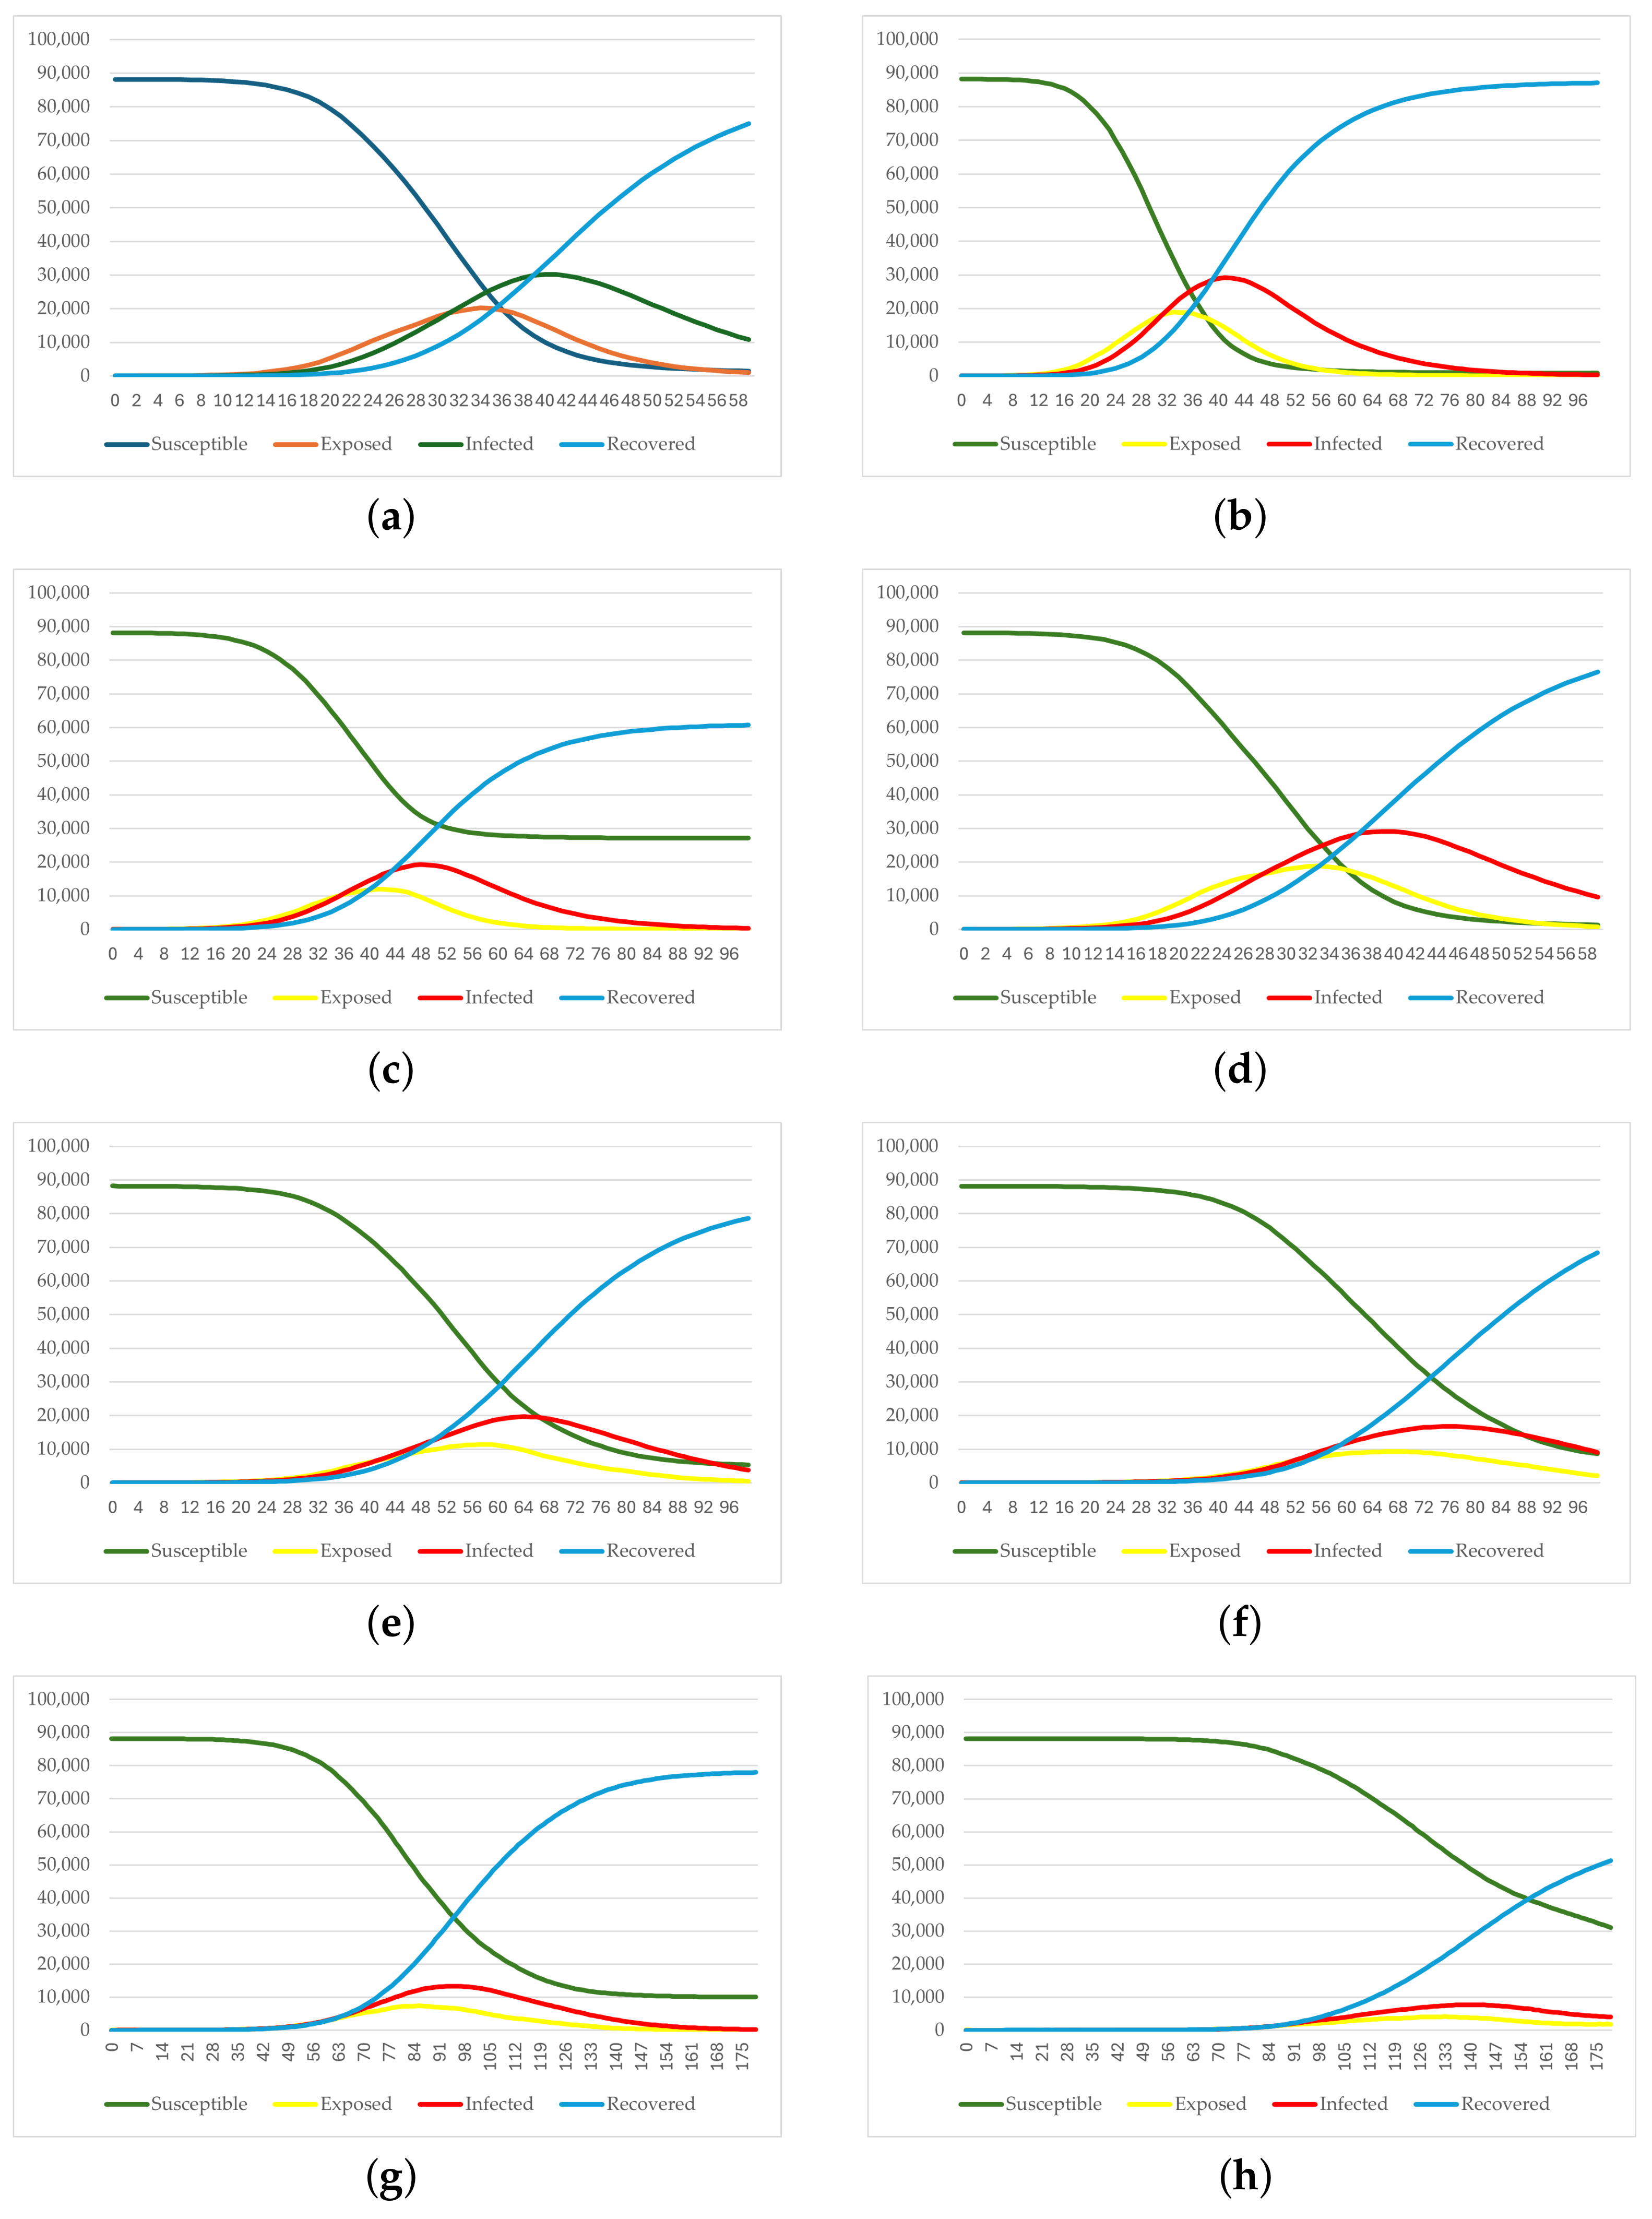
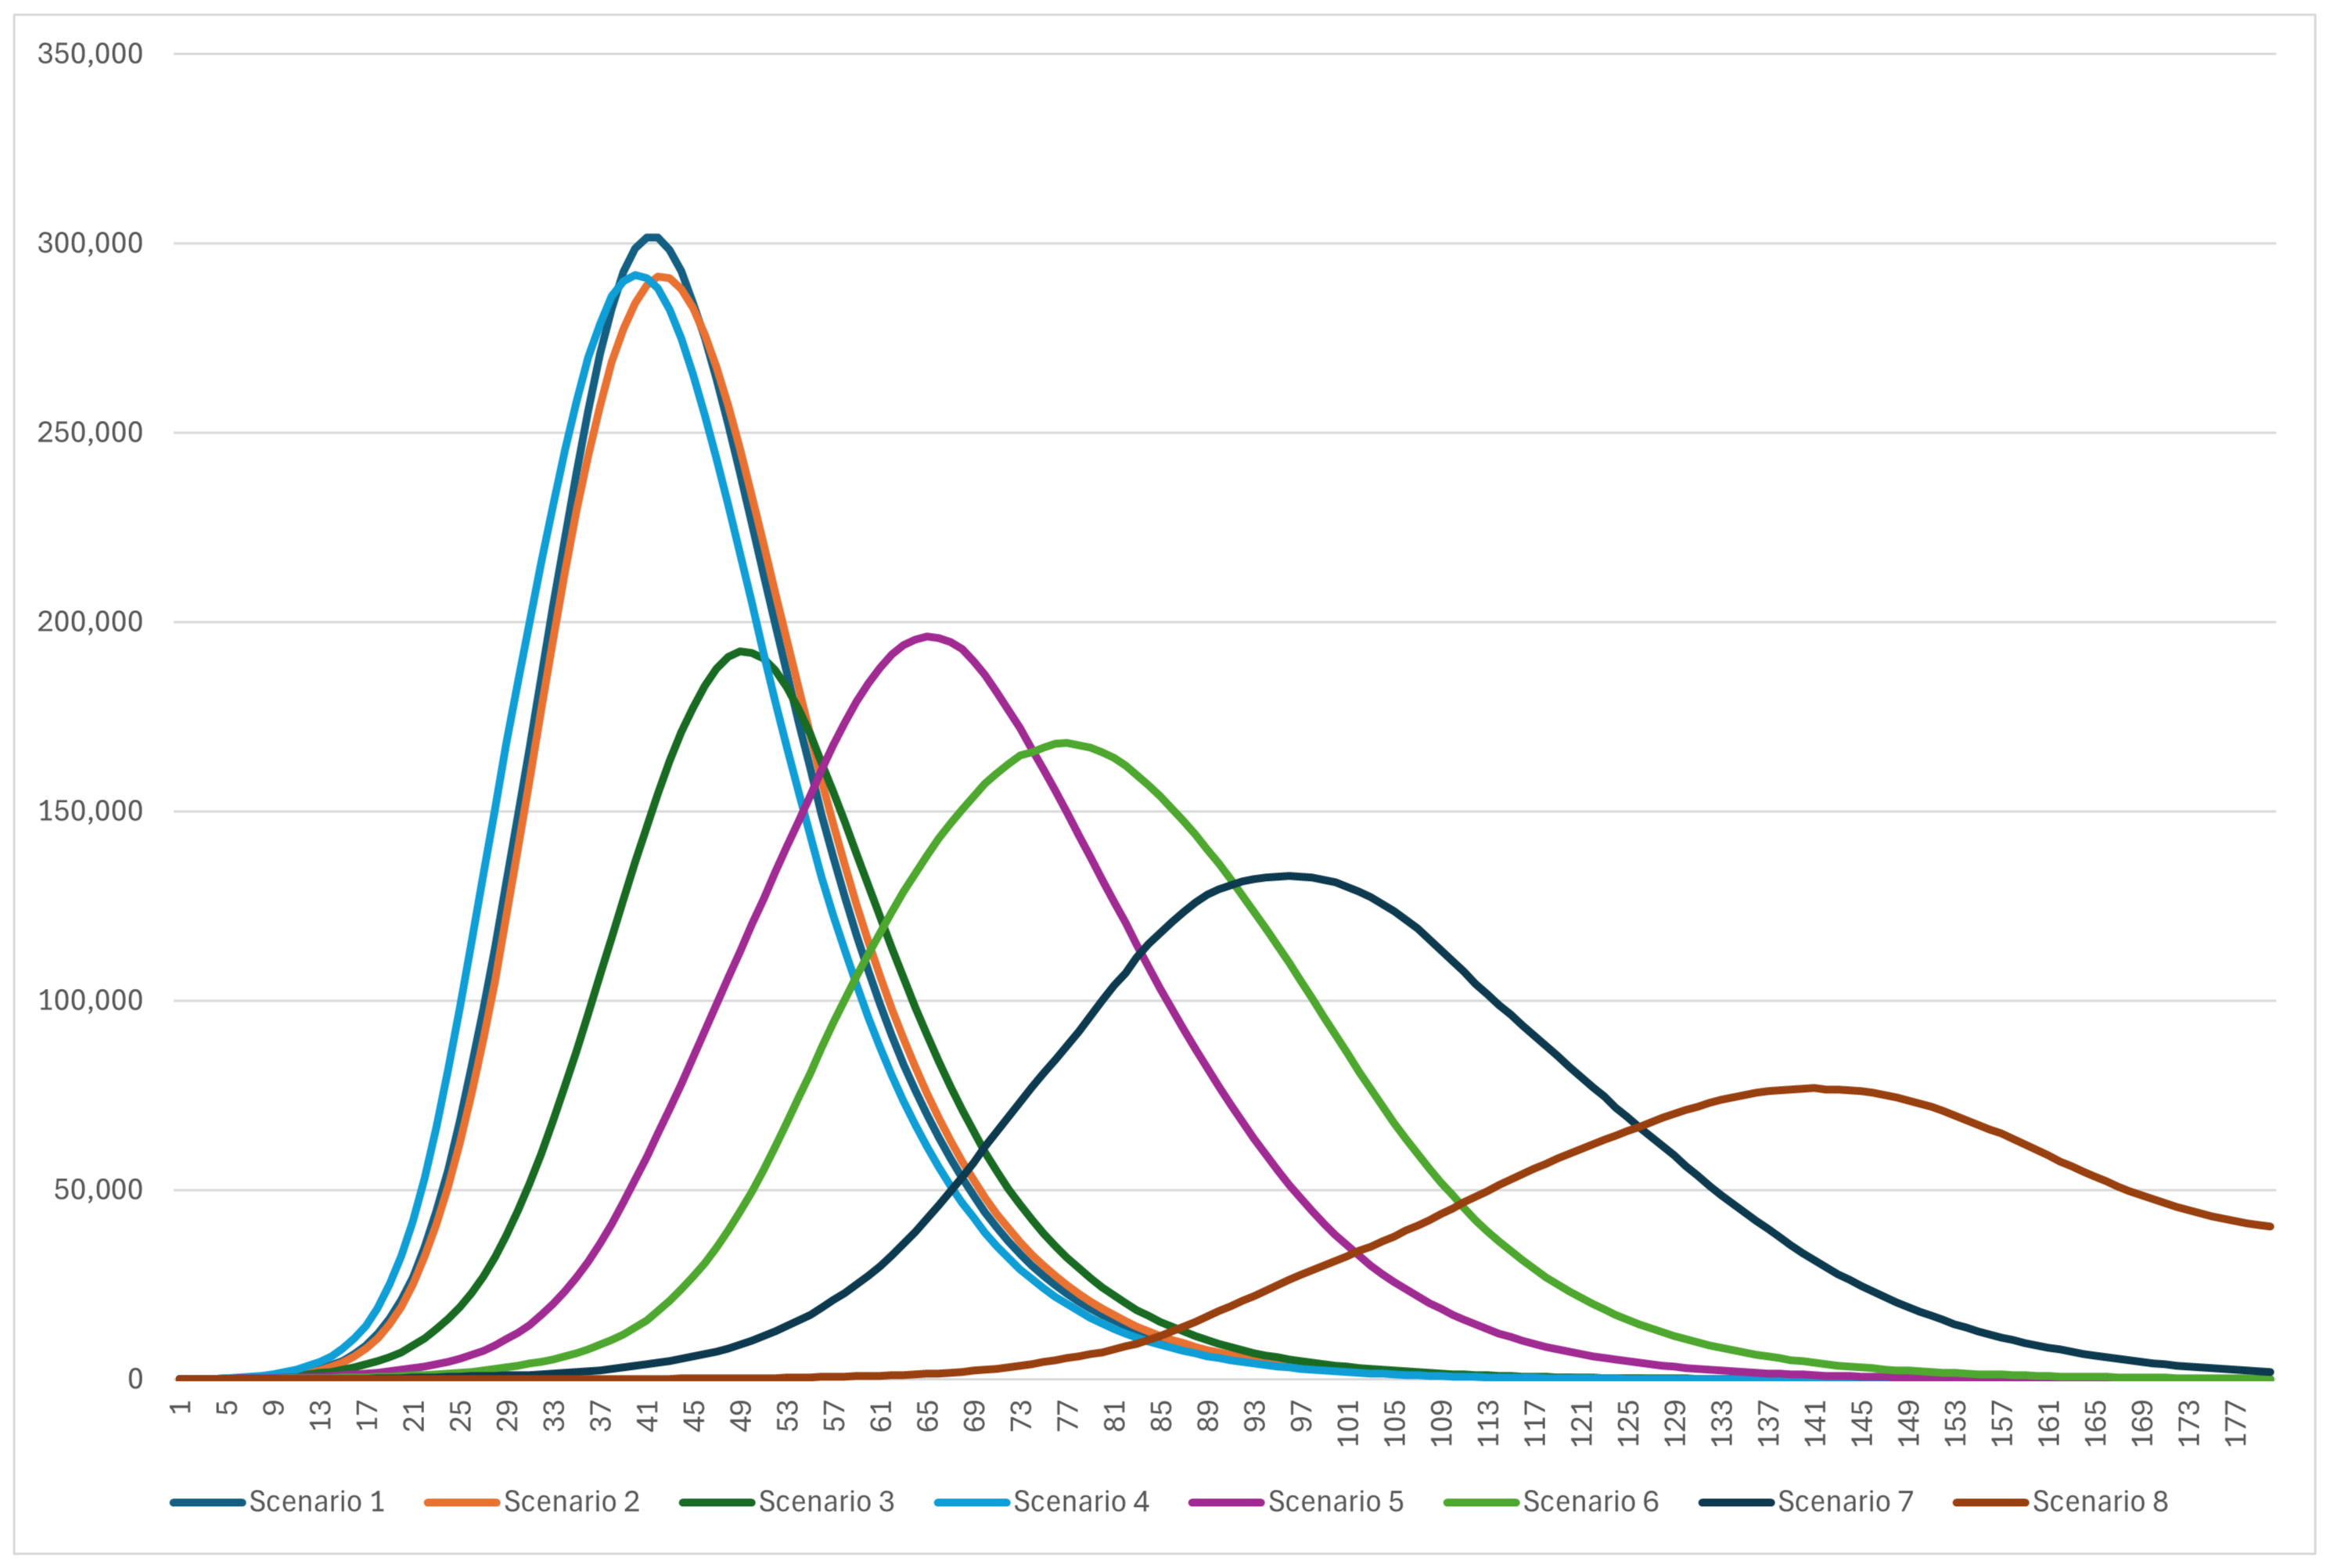
| Scenario | Description | |
|---|---|---|
| 1 | Base Case | The model runs without any interventional measures |
| 2 | School Closure | All schools are closed, all other layers remain |
| 3 | Workplace Closure | All workplaces are closed, all other layers remain |
| 4 | Targeted Age Group Interventions | All agents above 60 years old now get infected randomly with a tenth of the original possibility |
| 5 | Social Distancing & Mask usage | Possibility of Infection becomes a third of the original in all social interactions except inside families |
| 6 | Mild lockdown with (mostly) remote work | All schools are closed (tele-education), Workplace and random infection possibilities become a fourth of the original |
| 7 | Moderate lockdown with (mostly) remote work | All schools are closed (tele-education), Workplace and random infection possibilities become a sixth of the original |
| 8 | Strict lockdown with (mostly) remote work | All schools are closed (tele-education), Workplace and random infection possibilities become an eighth of the original |
| _FMLY | _WORK | _SCH | _RNDM | _SAME_AGE | |||
|---|---|---|---|---|---|---|---|
| 1 | 0.8 | 0.1 | 0.04 | 0.01 | 0.005 | 0.1 | 0.2 |
| 2 | 0.8 | 0.1 | 0 | 0.01 | 0.005 | 0.1 | 0.2 |
| 3 | 0.8 | 0 | 0.04 | 0.01 | 0.005 | 0.1 | 0.2 |
| 4 | 0.8 | 0.1 | 0.04 | 0.01 (<60 y) | 0.005 | 0.1 | 0.2 |
| 0.8 | 0.1 | 0.04 | 0.01/10 (>60 y) | 0.005/10 | 0.1 | 0.2 | |
| 5 | 0.8 | 0.1/3 | 0.04/3 | 0.01/3 | 0.005/3 | 0.1 | 0.2 |
| 6 | 0.8 | 0.1/4 | 0 | 0.01/4 | 0.005/4 | 0.1 | 0.2 |
| 7 | 0.8 | 0.1/6 | 0 | 0.01/6 | 0.005/6 | 0.1 | 0.2 |
| 8 | 0.8 | 0.1/8 | 0 | 0.01/8 | 0.005/8 | 0.1 | 0.2 |
Disclaimer/Publisher’s Note: The statements, opinions and data contained in all publications are solely those of the individual author(s) and contributor(s) and not of MDPI and/or the editor(s). MDPI and/or the editor(s) disclaim responsibility for any injury to people or property resulting from any ideas, methods, instructions or products referred to in the content. |
© 2024 by the authors. Licensee MDPI, Basel, Switzerland. This article is an open access article distributed under the terms and conditions of the Creative Commons Attribution (CC BY) license (https://creativecommons.org/licenses/by/4.0/).
Share and Cite
Thomopoulos, V.; Tsichlas, K. An Agent-Based Model for Disease Epidemics in Greece. Information 2024, 15, 150. https://doi.org/10.3390/info15030150
Thomopoulos V, Tsichlas K. An Agent-Based Model for Disease Epidemics in Greece. Information. 2024; 15(3):150. https://doi.org/10.3390/info15030150
Chicago/Turabian StyleThomopoulos, Vasileios, and Kostas Tsichlas. 2024. "An Agent-Based Model for Disease Epidemics in Greece" Information 15, no. 3: 150. https://doi.org/10.3390/info15030150
APA StyleThomopoulos, V., & Tsichlas, K. (2024). An Agent-Based Model for Disease Epidemics in Greece. Information, 15(3), 150. https://doi.org/10.3390/info15030150