
Autonomous Cycles of Data Analysis Tasks for the Automation of the Production Chain of MSMEs for the Agroindustrial Sector


Abstract
1. Introduction
- The specification of three ACODATs to manage agroindustrial automation to improve the productive chains. These three ACODATs automate the most relevant subprocesses to enable self-management of industrial automation for MSMEs in the agroindustrial sector.
- A multidimensional data model to manage industrial automation, which stores the necessary information of an organization and its context.
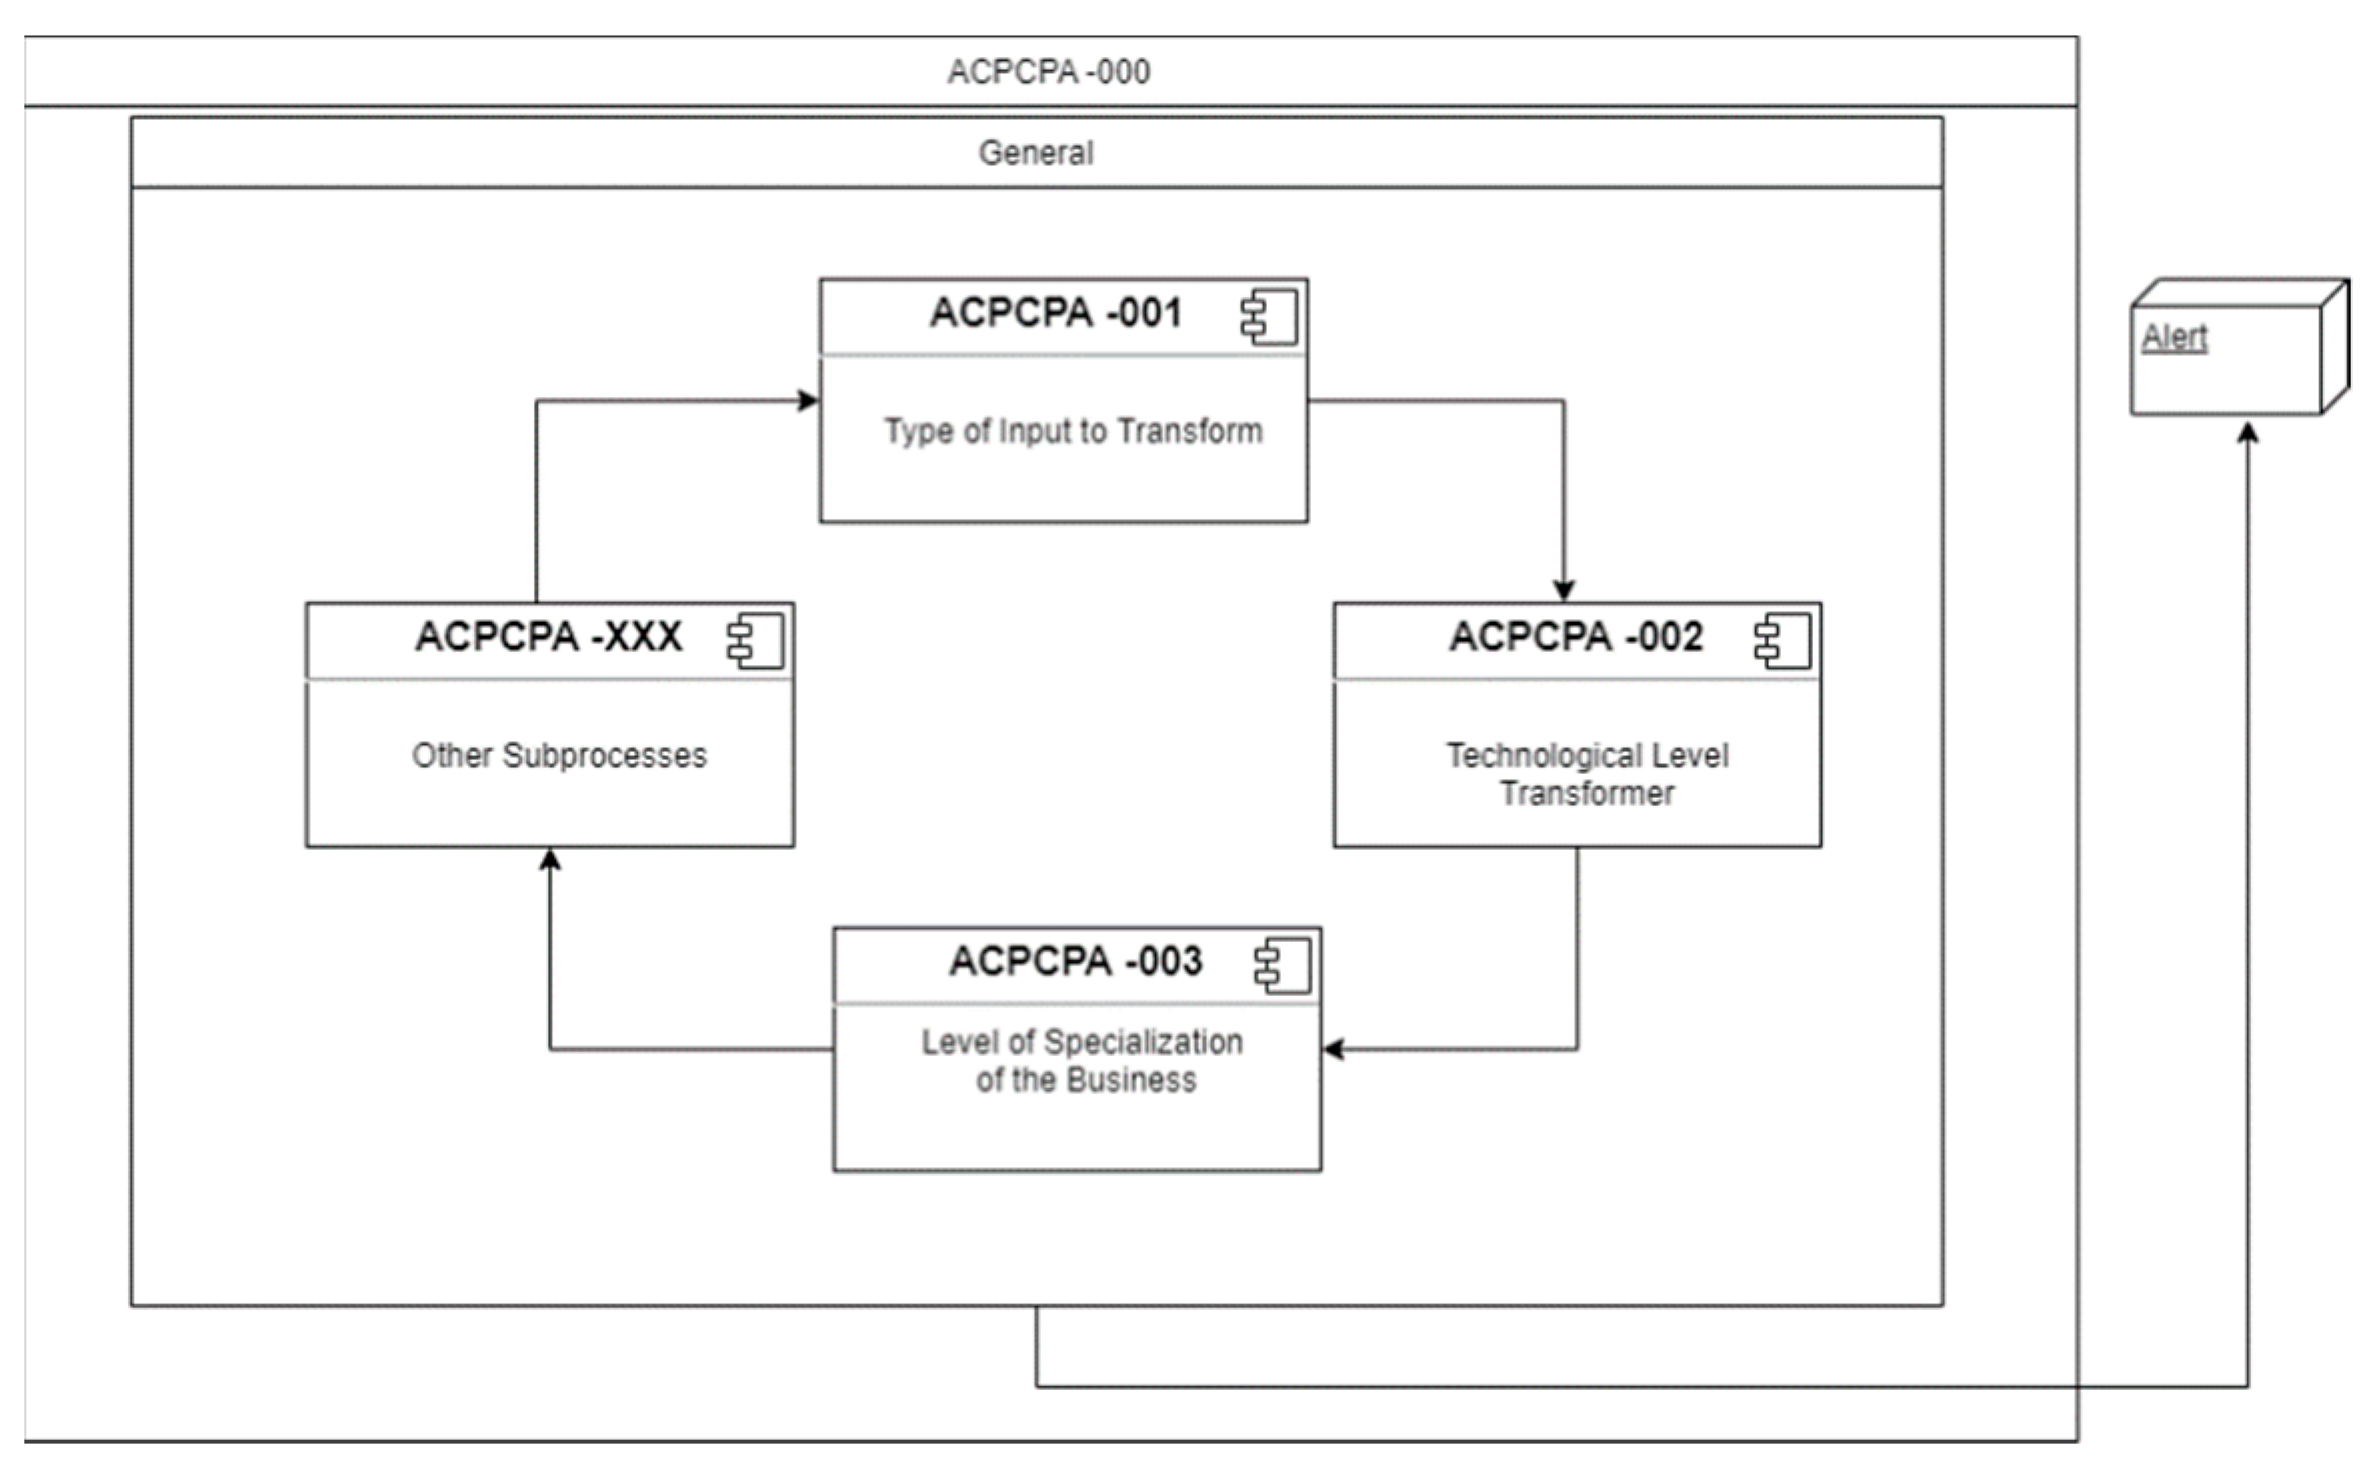
- A detailed description of the ACODAT to define the type of input to be transformed in a coffee factory.
2. Related Work
3. Background
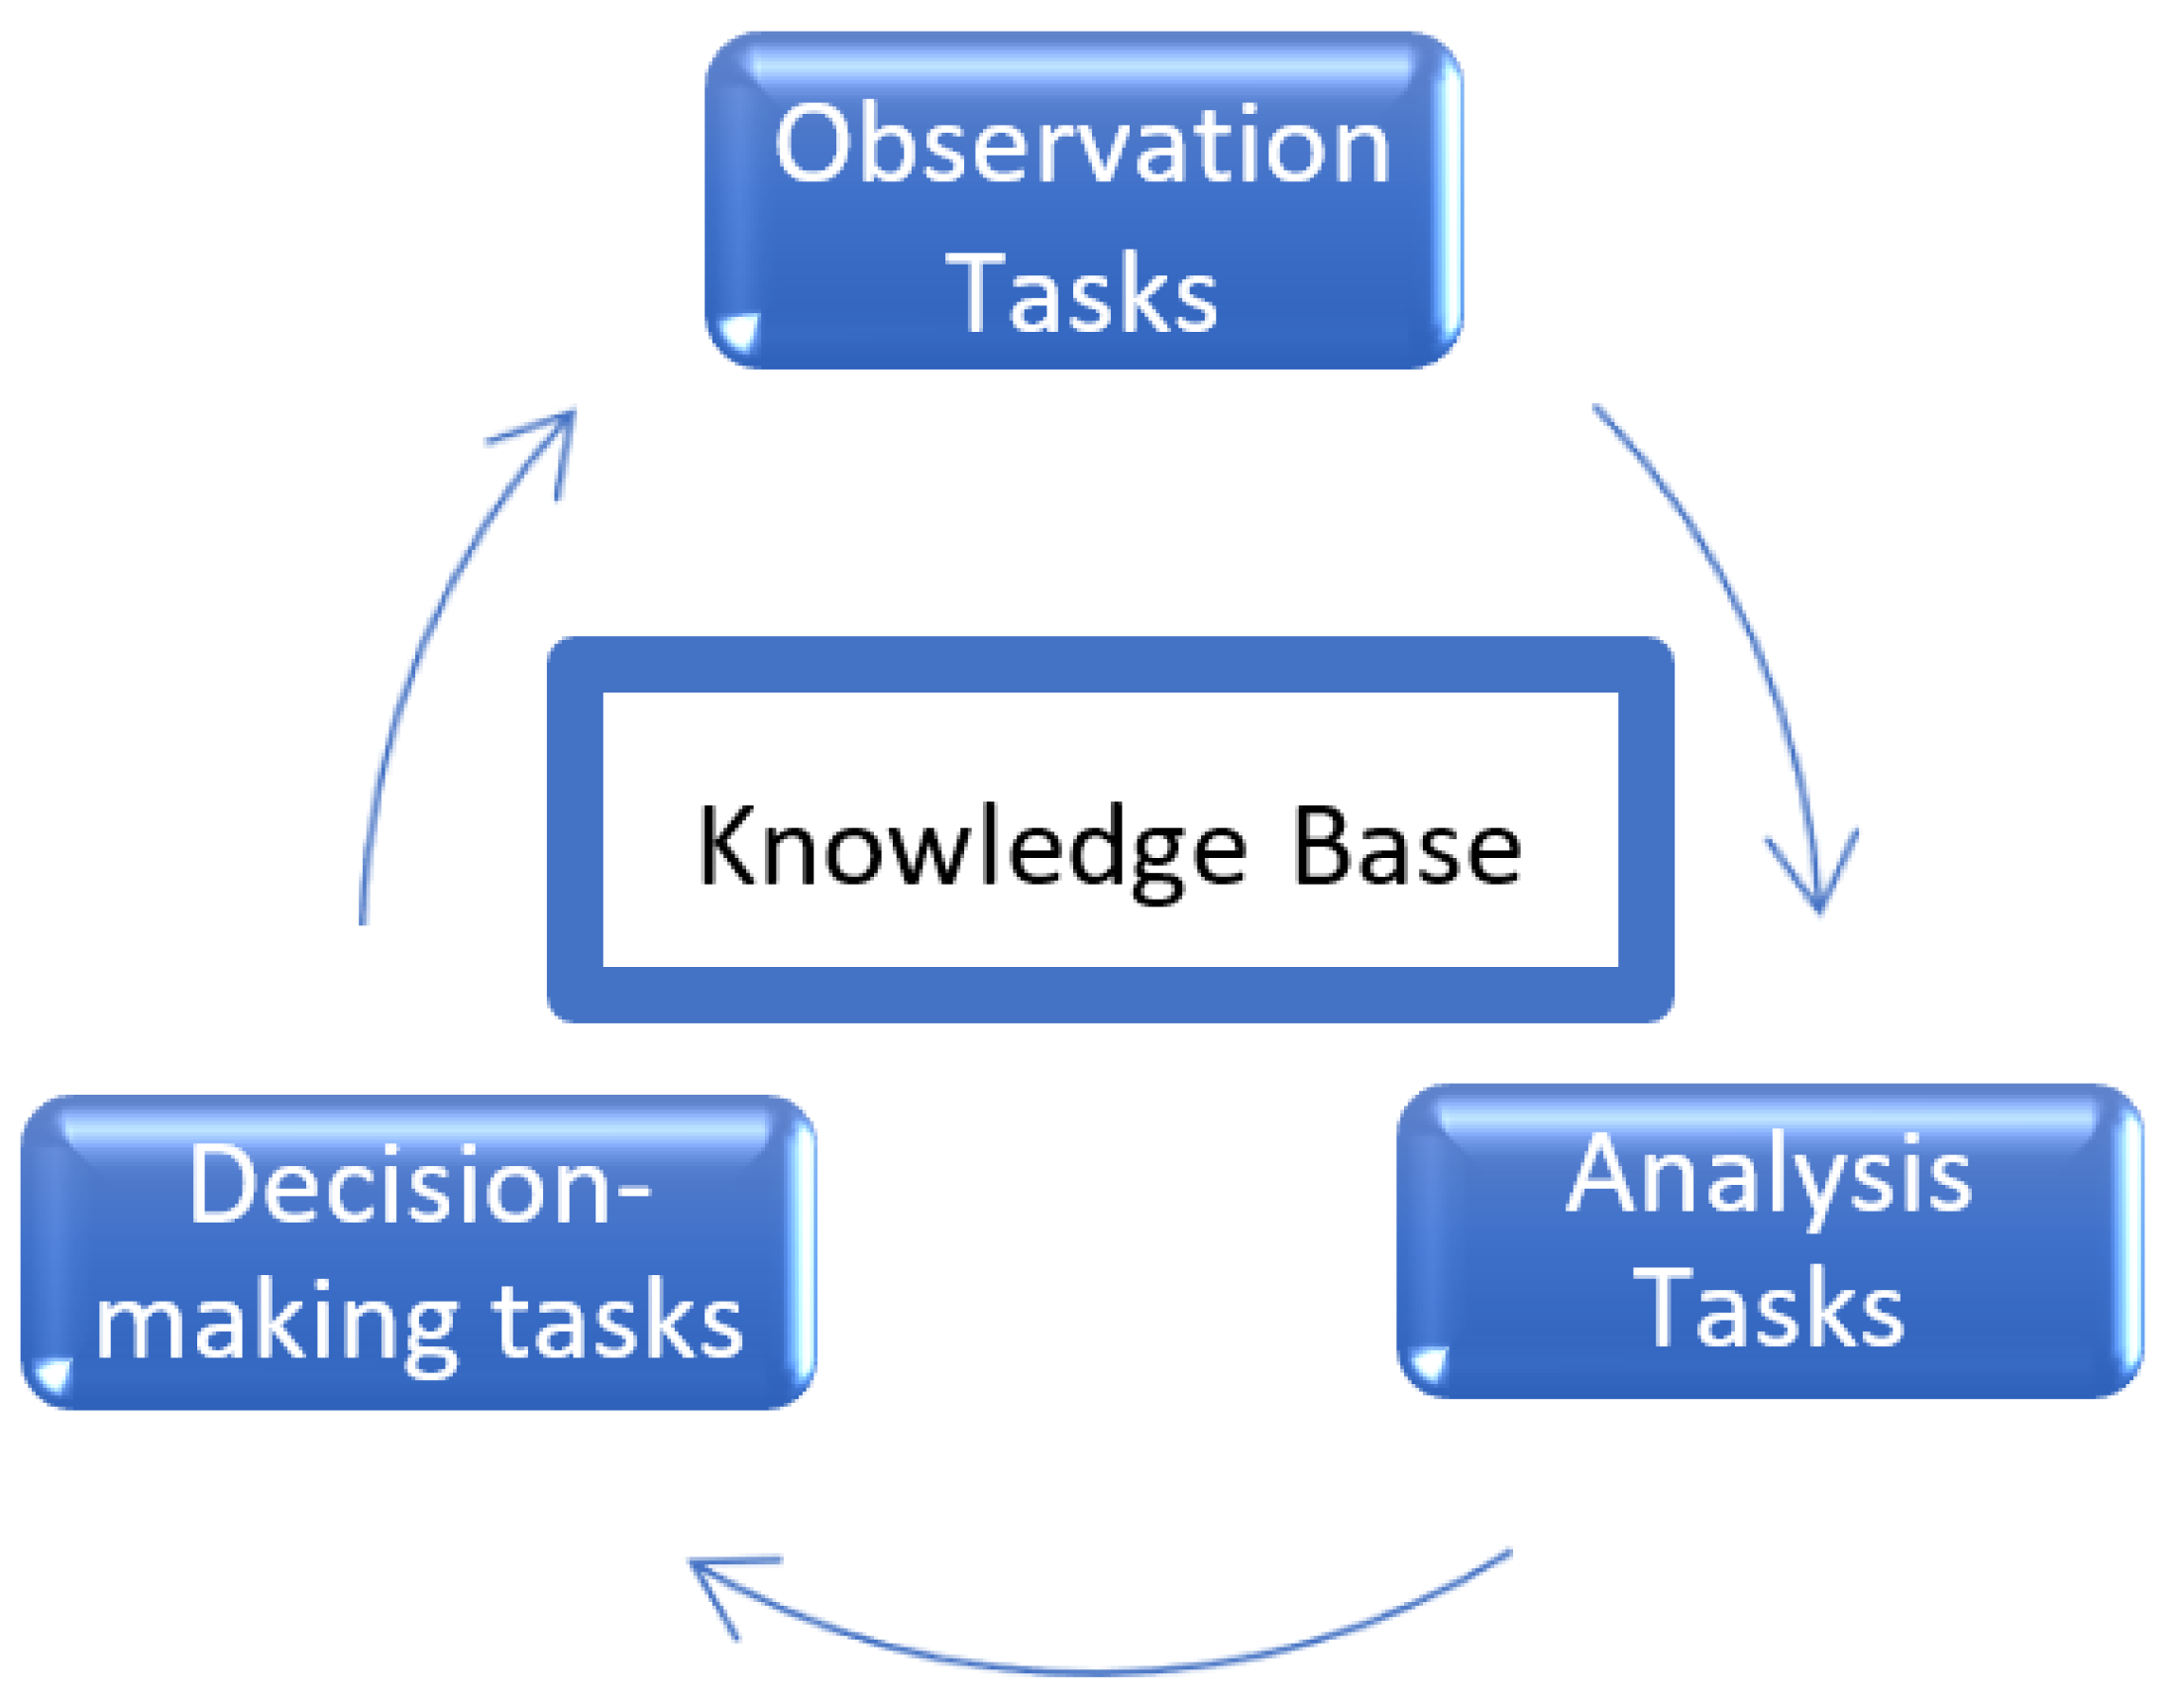
3.1. ACODAT
- A multidimensional data model to store the data collected to characterize the behavior of the context, which will be used by the different data analysis tasks.
- A platform to integrate the technological tools required by the data analysis tasks.
3.2. MIDANO
4. Definition of Autonomous Cycles for the Agroindustrial Sector
4.1. Application of MIDANO to the Agroindustrial Production Chain of MSMEs
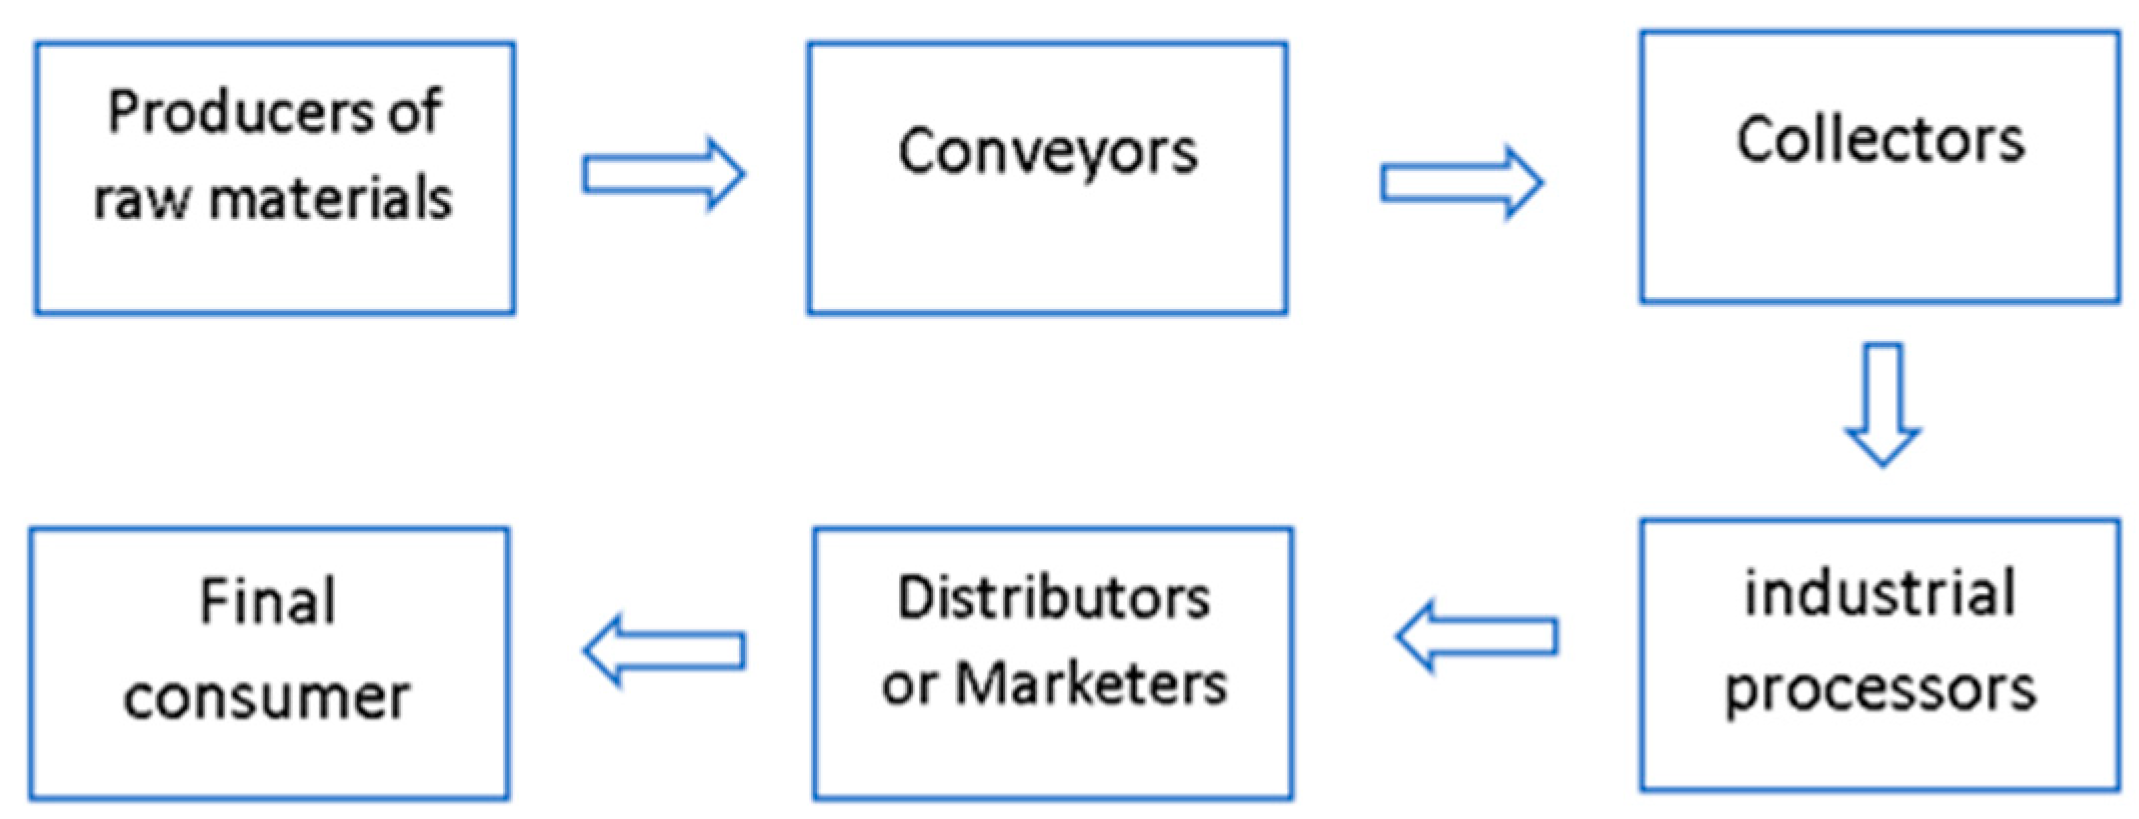
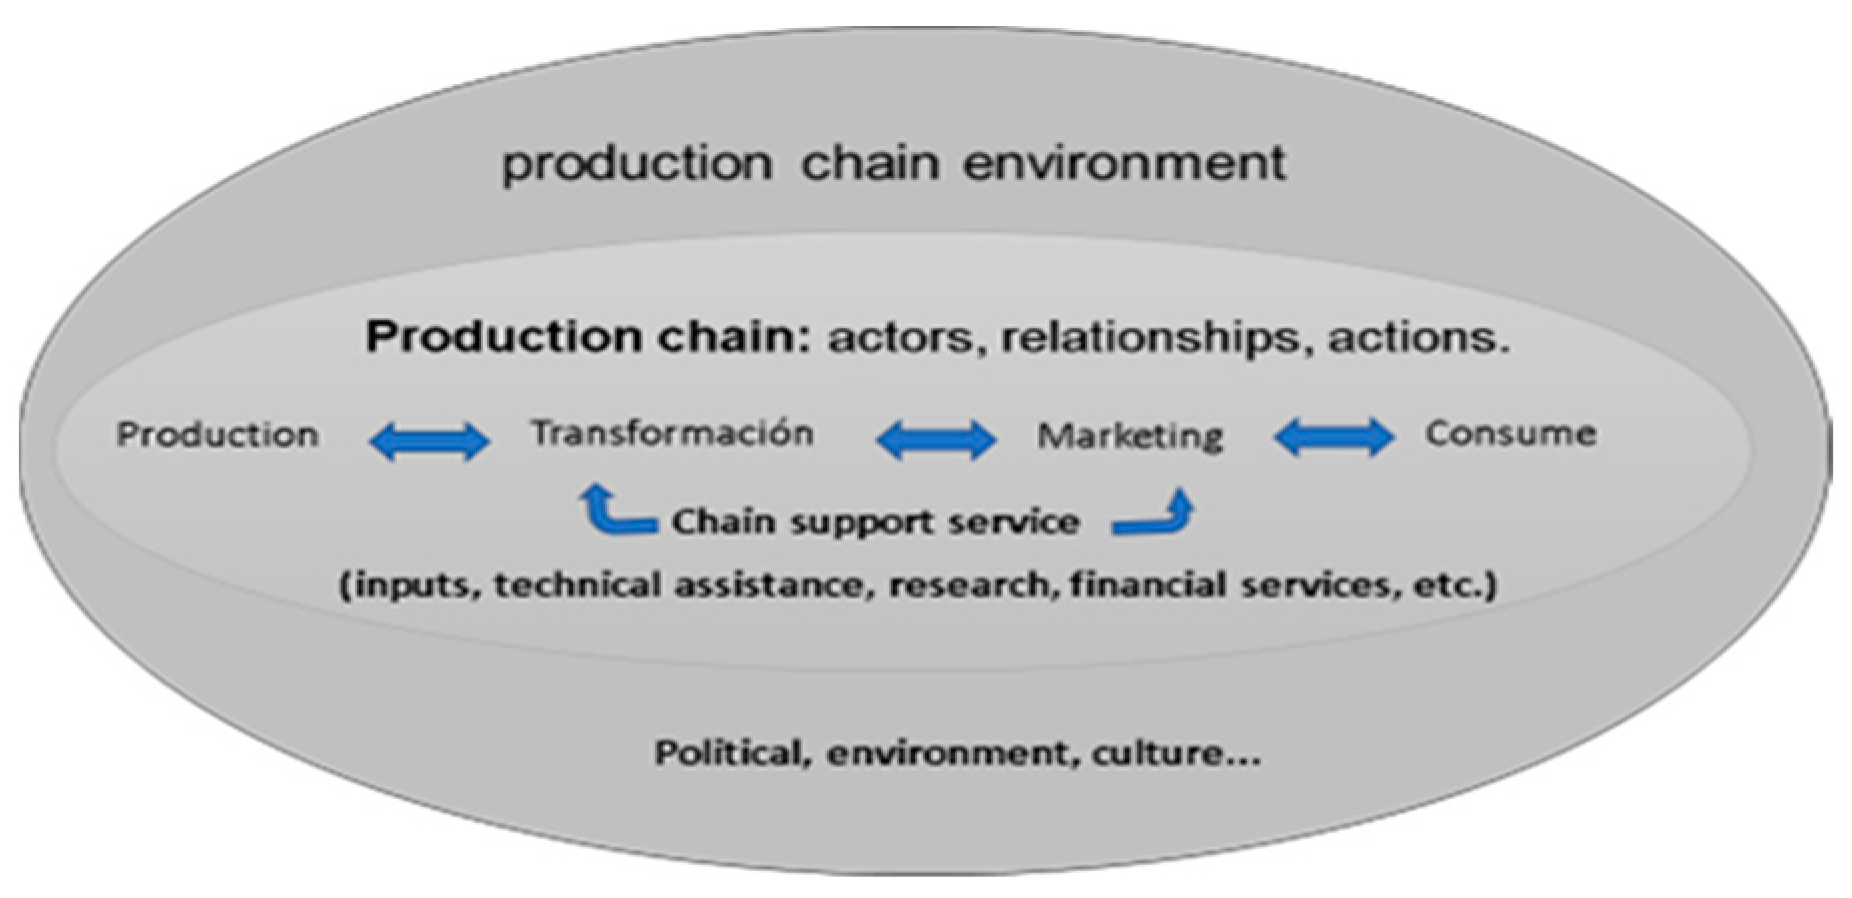
4.2. Agroindustrial Production Chain of MSMEs
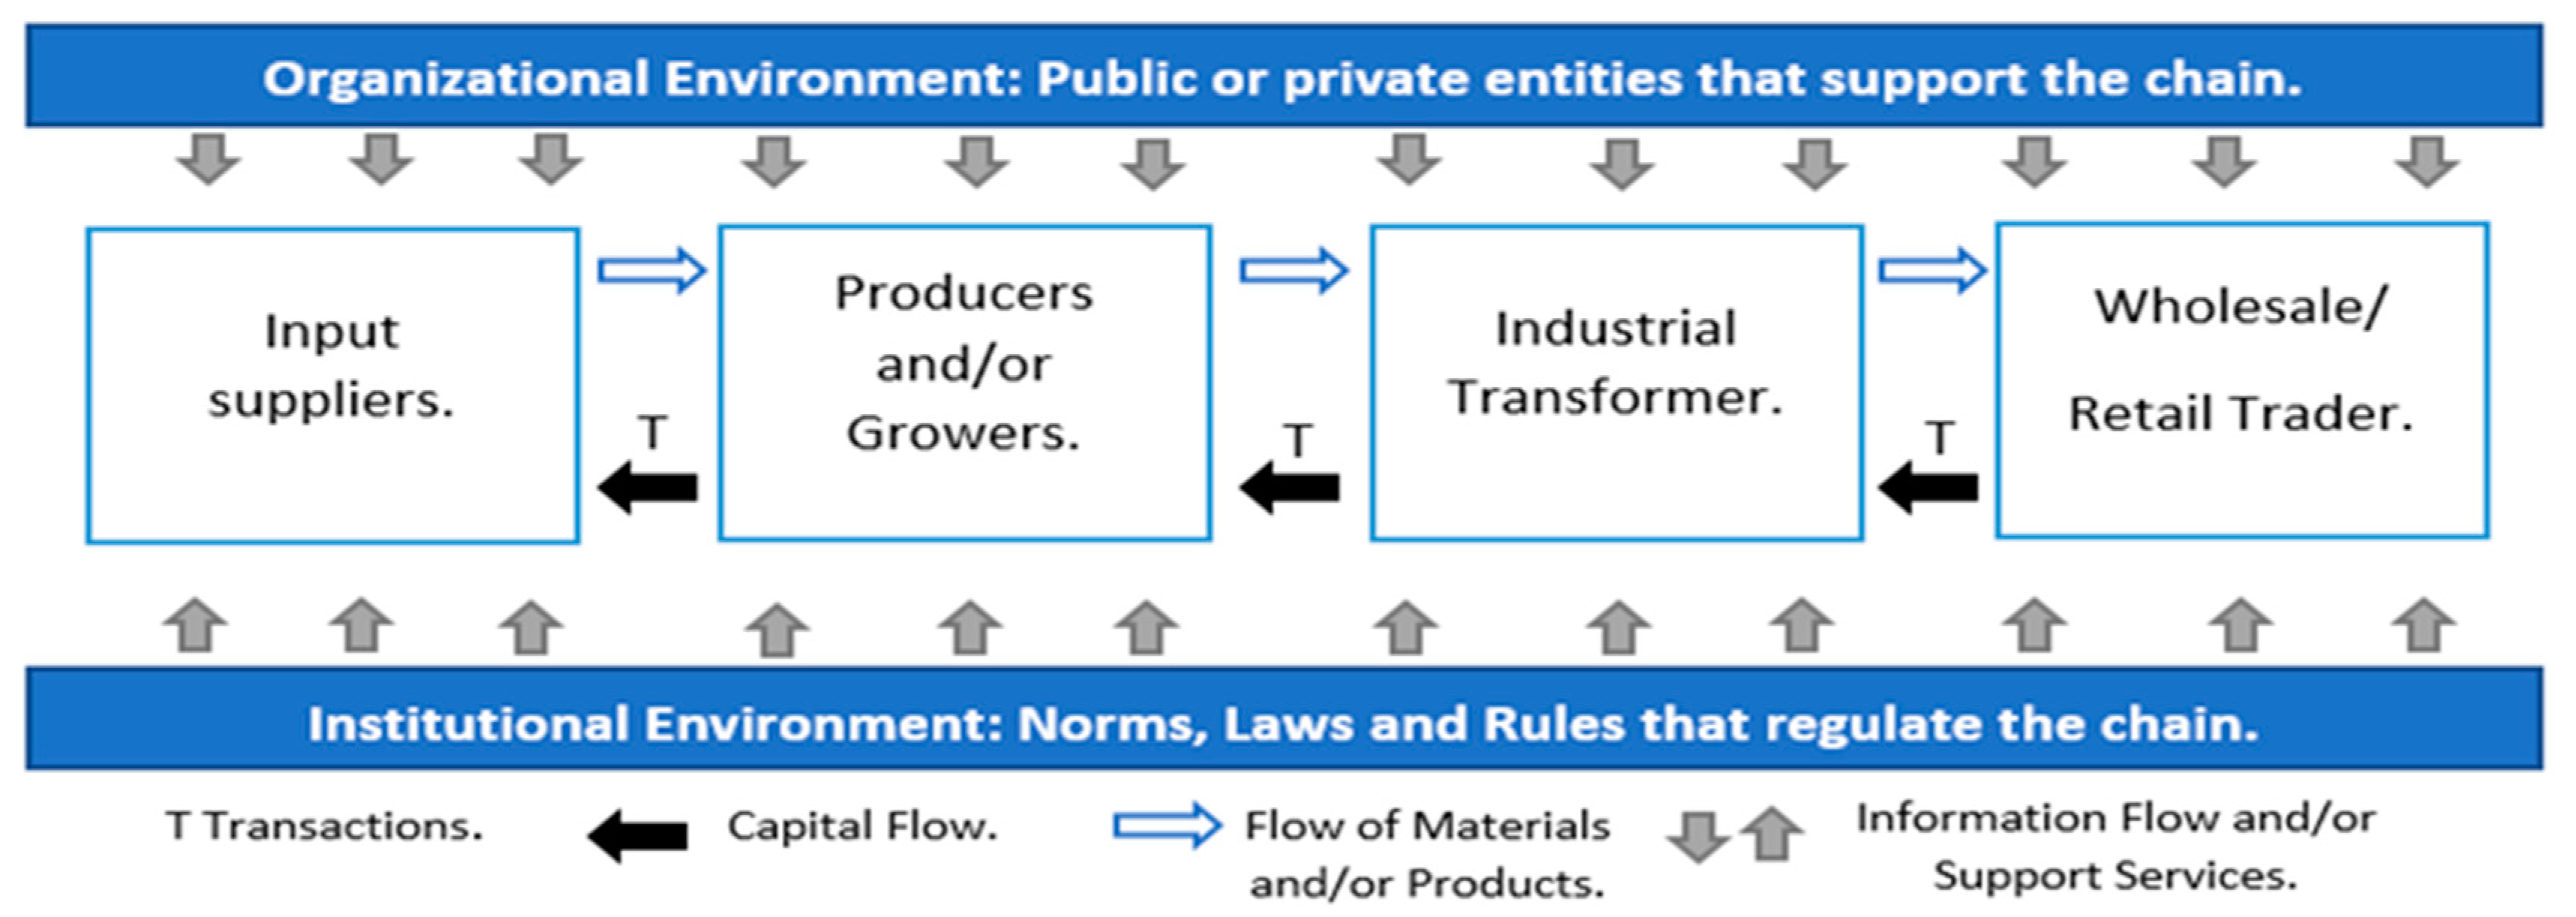
- Establish the links in the production chain (defined by the blue arrows in Figure 3).
- Determine the segments that make up each of the links in the production chain by using segmentation instruments and their corresponding variables.
- Represent the material and capital flows that take place in the chain.
- Establish the institutional and organizational environment of the chain.
- Input Suppliers: the entities that provide or supply certain products or services to companies for their use, for example, agrochemicals and packaging.
- Producers and/or Growers: this process is in charge of the harvest and post-harvest preparation. It must consider, among other things, the workmanship, the forestry support services and post-harvest activities.
- Industrial Transformer: this process transforms or adapts the inputs for the materialization of the intended products or services. It must consider, among other things, The type of input to be transformed, the technology required for the transformation, etc.
- Wholesaler/Retailer Commercialization: this process is the distribution of products or services to the market. It must consider, among other things, stockpiling and marketing.
4.3. Prioritization of Subprocesses of the Agroindustrial Production Chain of MSMEs
5. Definition of Autonomous Cycles of Data Analysis
5.1. Specification of the Autonomous Cycles for the Type of Input to Transform
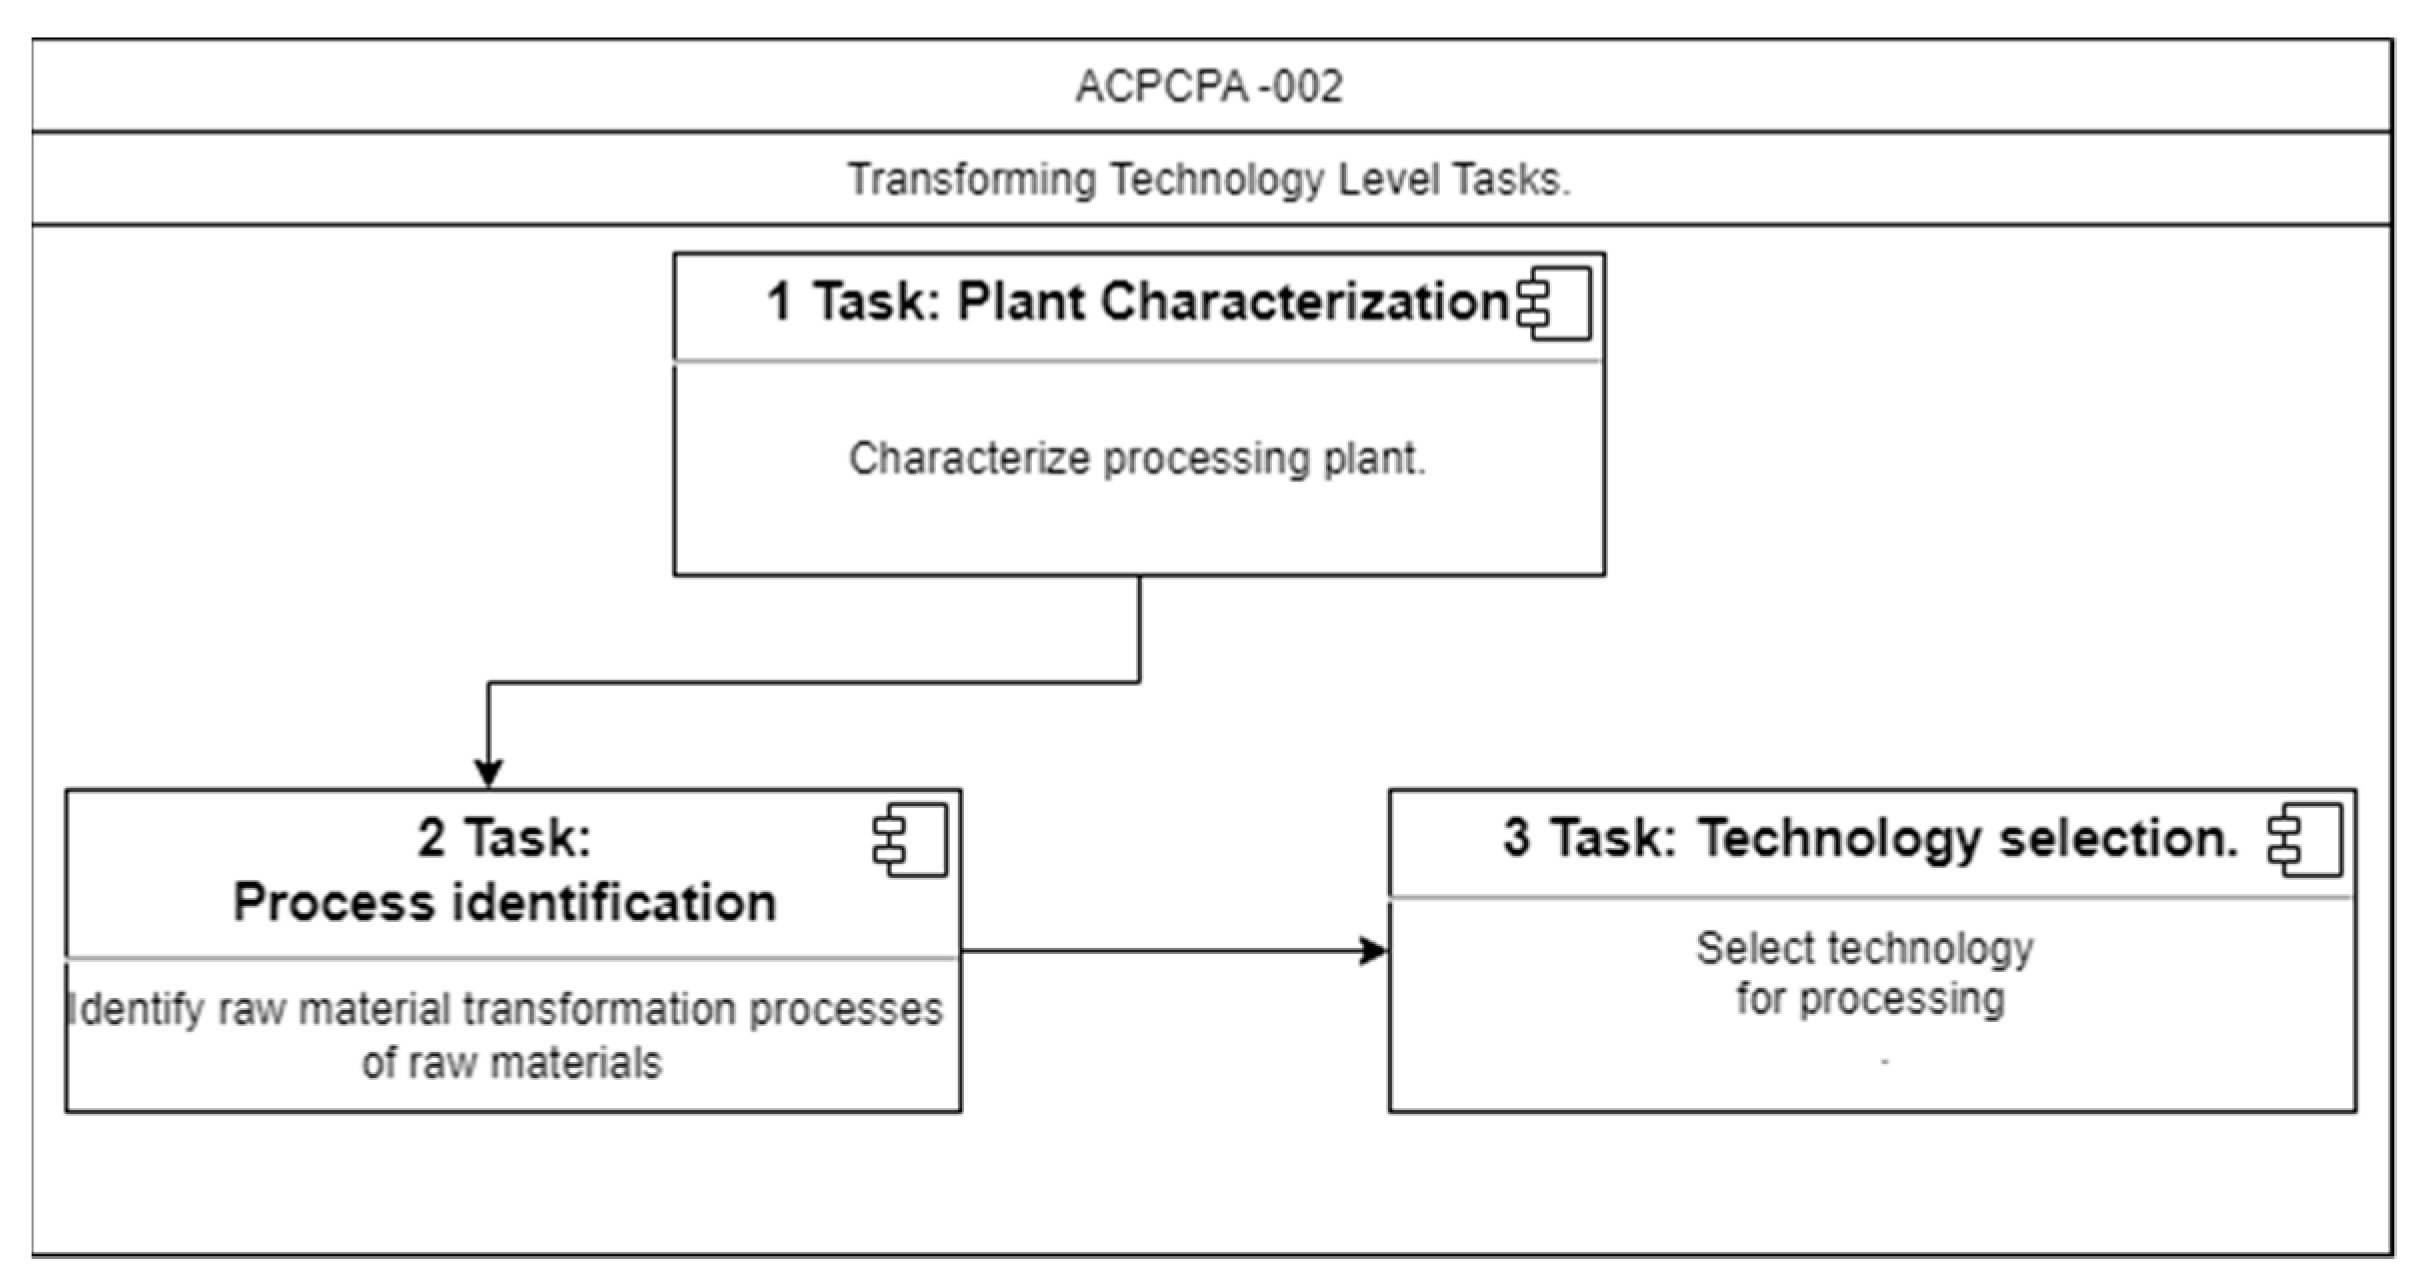
5.2. Specification of the Autonomous Cycles for the Transformer Technology Level
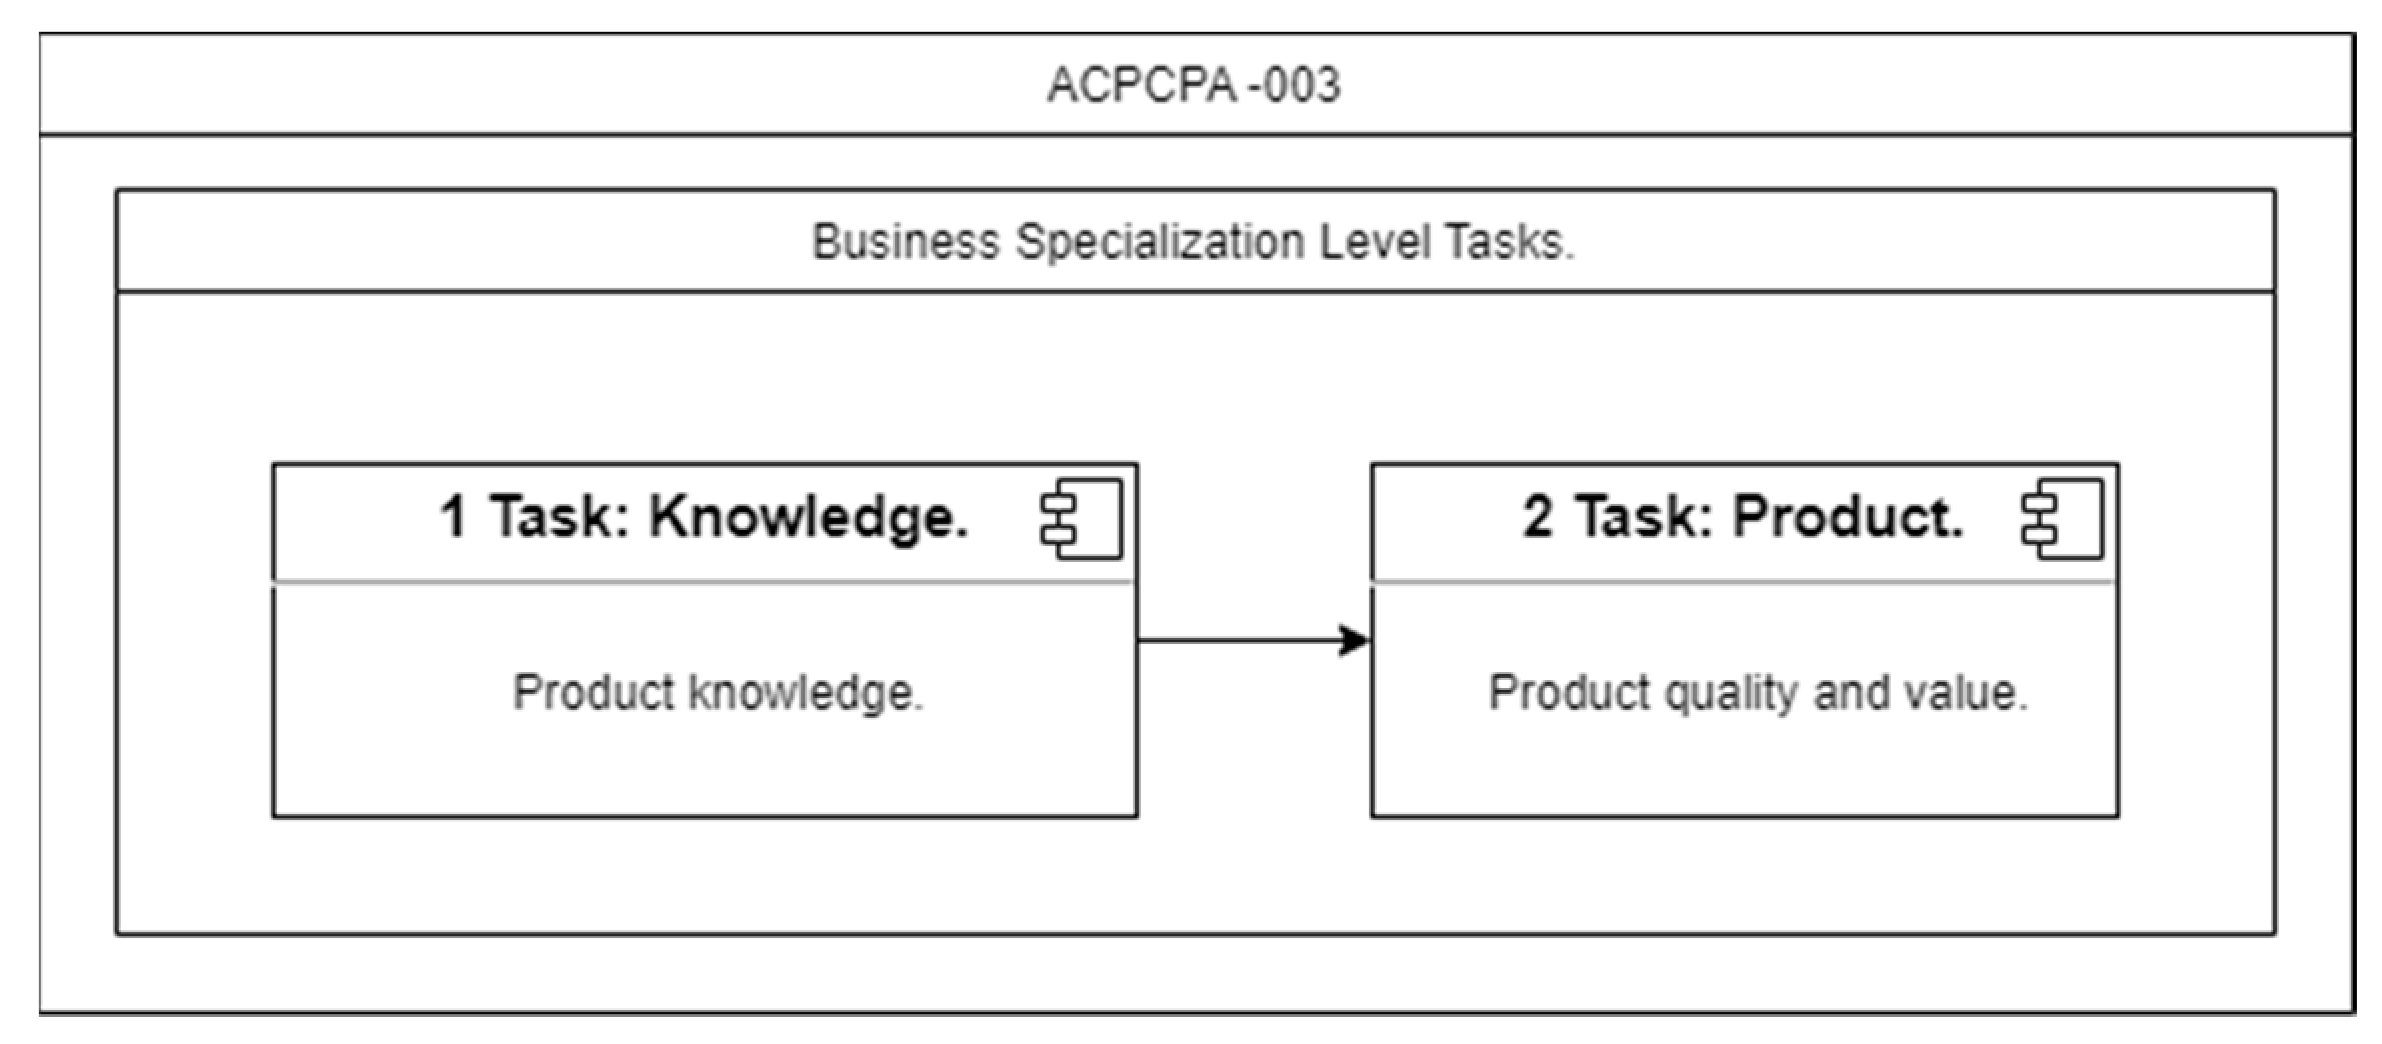
5.3. Specification of the Autonomous Cycles for the “Business-Specialization Level”
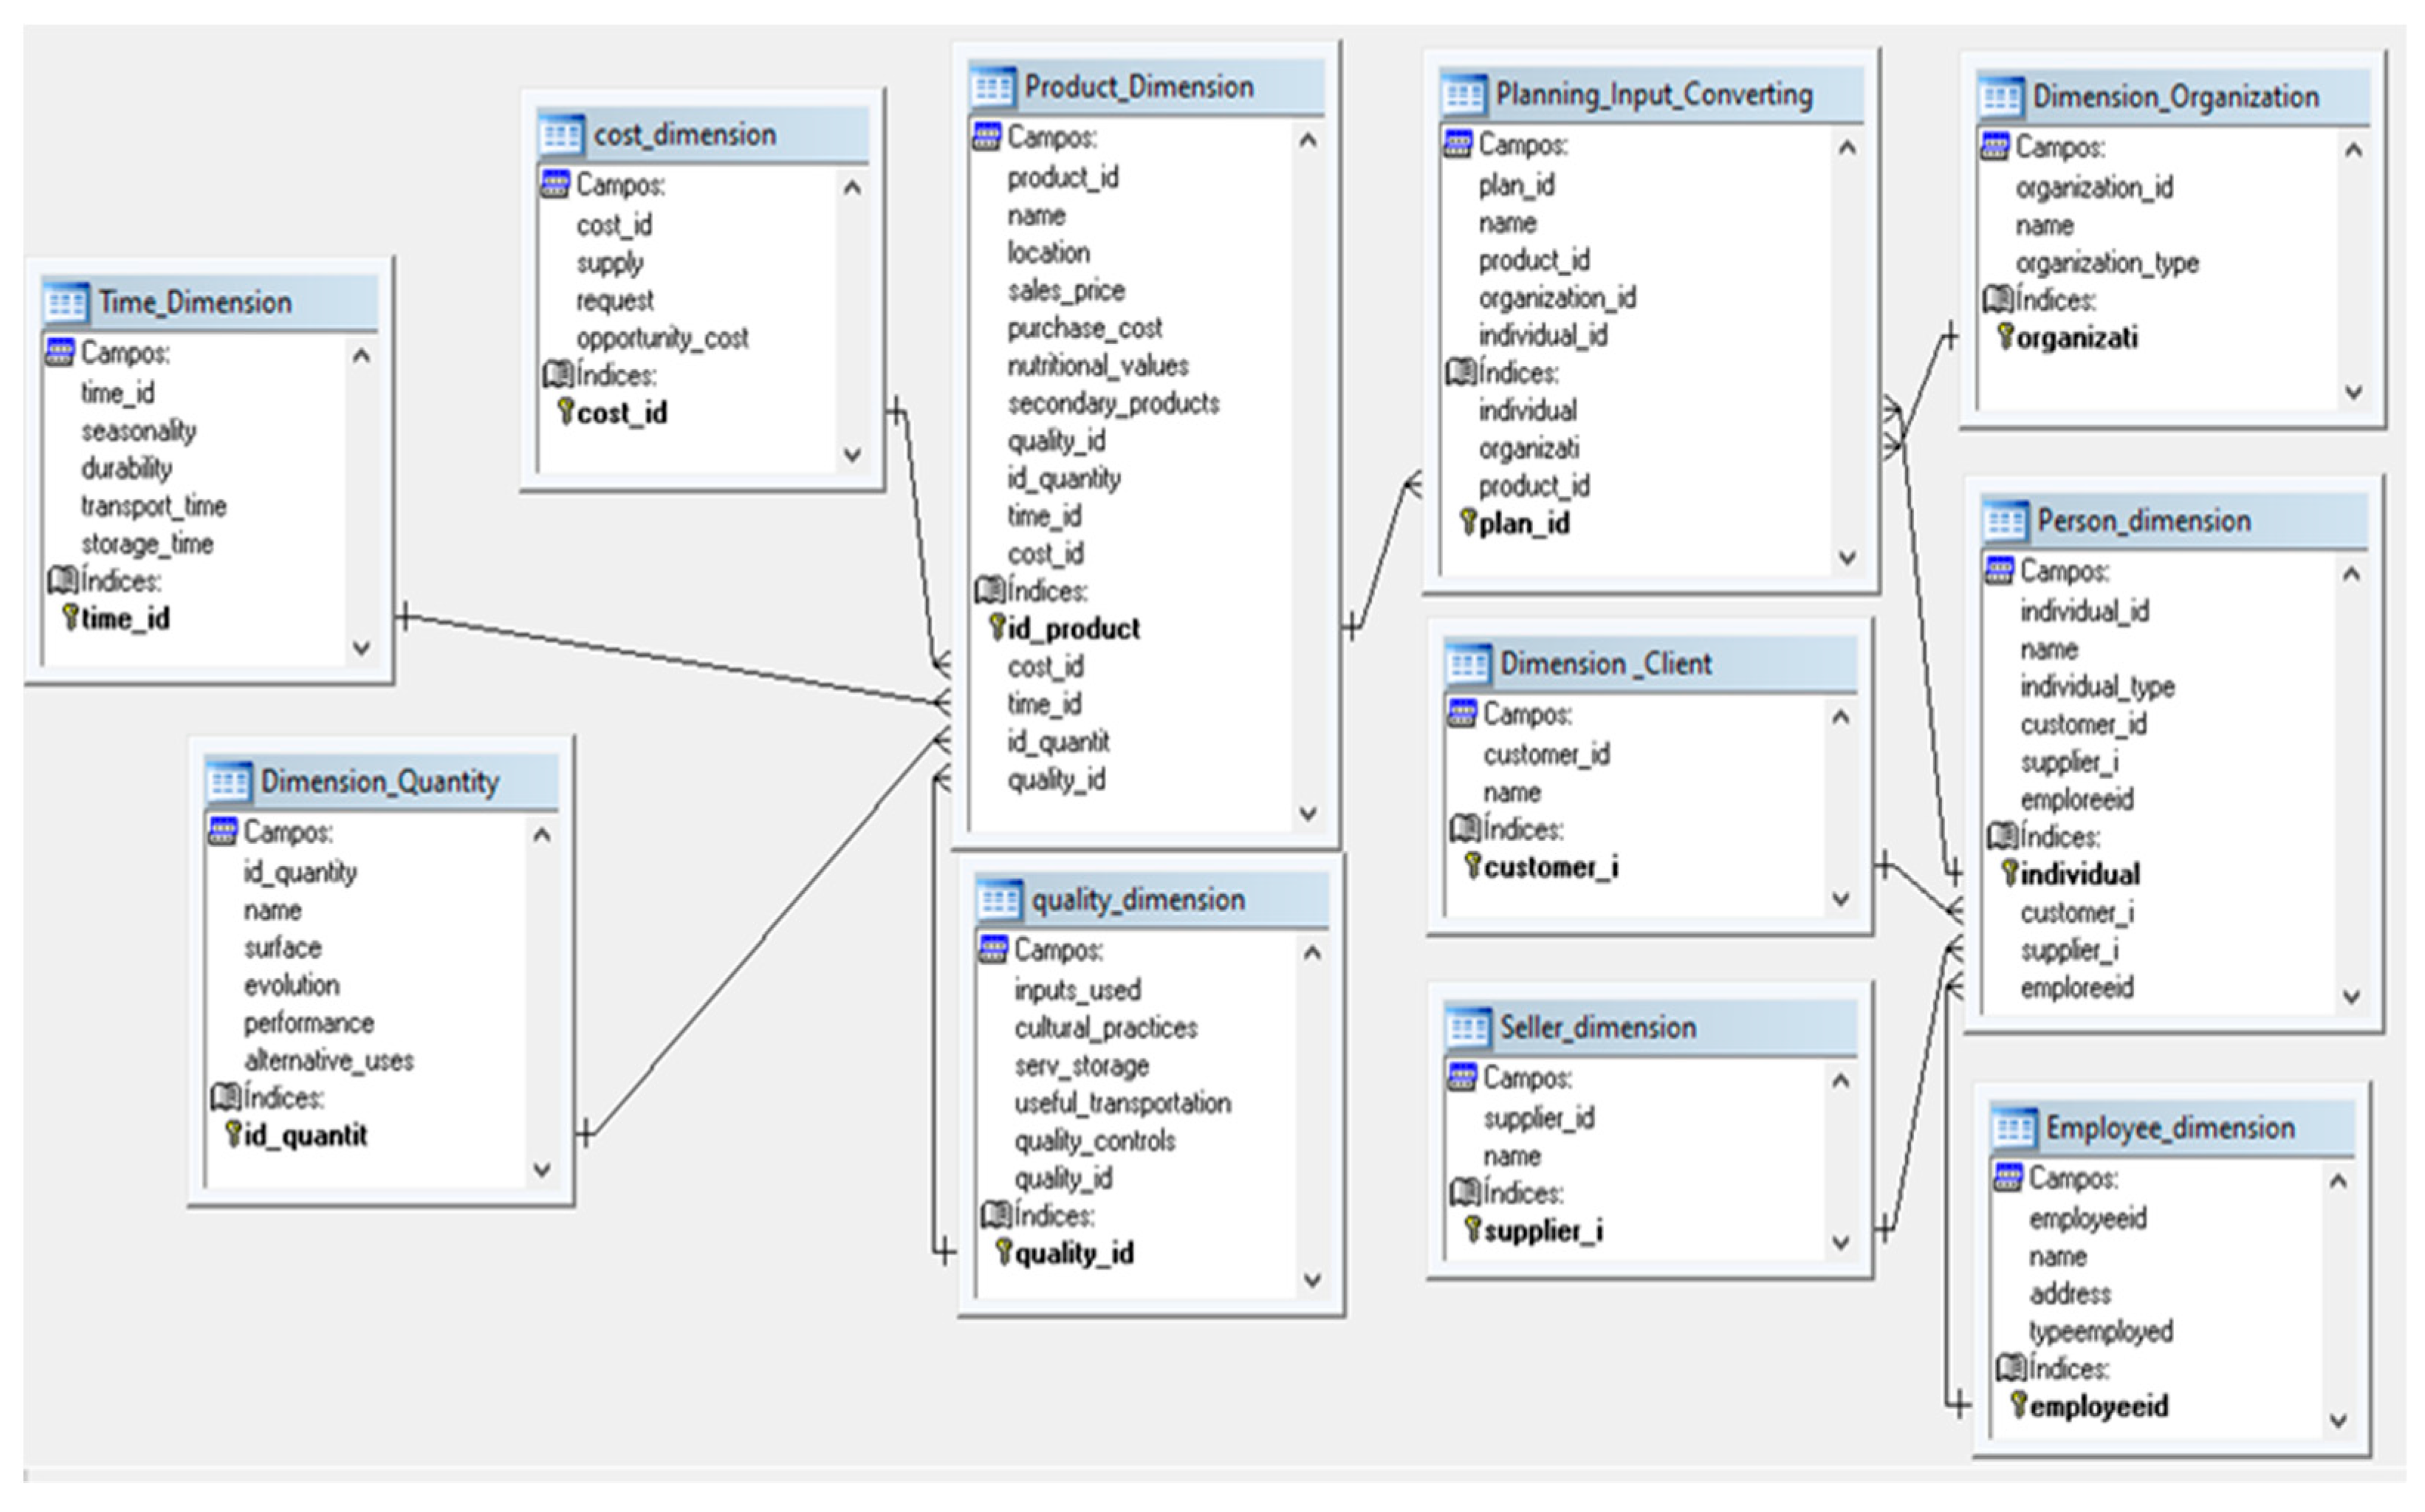
6. Multidimensional Data Model for the Autonomous Cycles
- Product Dimension: Stores product data (e.g., location, selling price, production cost).
- Quantity Dimension: Stores data on the quantity of raw materials required to satisfy demand, for example, historical evolution, yield, and alternative uses.
- Quality Dimension: Stores data on the quality of raw materials or products, and the information related; for example, inputs used on the farm, cultural practices, storage and transportation services, and quality controls established.
- Time Dimension: Stores time data of raw materials or inputs identifying the various factors related to time, for example, seasonality, durability, and storage time.
- Cost Dimension: Stores data on the cost of raw materials or inputs; for example, supply and demands, opportunity cost, logistic services, government interventions, alliances with producers and contracting standards in the area.
- Organization Dimension: Stores company or organization data; for example, name, address, and type of organization such as producers, suppliers, processors, transporters, warehousing, financial, marketing and distributors.
- Person Dimension: Stores individual data; address, phone, and email.
- Client Dimension: Stores client data (e.g., type and frequency of demand).
- Seller Dimension: Stores seller data (e.g., type of product to sell).
- Employee Dimension: Stores Employee data; for example, the type of employees such as producers, coordinators, or operators.
7. Case Study of Café Galavis
7.1. Experimental Context
7.2. Instantiation of ACPCPA-001 (Type of Input to Transform)
8. General Discussion
8.1. Comparison with Previous Works
- Criterion 1: Automation of the entire industrial production chain of MSMEs.
- Criterion 2: Use of data mining techniques in the industrial automation of the production chain.
- Criterion 3: Quantity, quality, time, and cost are jointly analyzed in the industrial-automation process.
- Criterion 4: Consider efficient and environmentally friendly production.
8.2. Quality of the Knowledge Models
9. Conclusions and Direction of Future Work
Author Contributions
Funding
Institutional Review Board Statement
Informed Consent Statement
Data Availability Statement
Conflicts of Interest
References
- Solleiro, J.; Del Valle, M. El cambio Tecnológico en la Agricultura y las Agroindustrias en México; Siglo, Ed.; Siglo XXI: Yucatán, México, 1996; p. xxi. [Google Scholar]
- Solleiro-Rebolledo, J.L.; García-Martínez, M.B.; Castañón-Ibarra, R.; Martínez-Salvador, L.E. Smart specialization for building up a regional innovation agenda: The case of San Luis Potosí, Mexico. J. Evol. Stud. Business-JESB 2020, 5, 81–115. [Google Scholar] [CrossRef]
- Sánchez, M.; Aguilar, J.; Cordero, J.; Valdiviezo-Díaz, P.; Barba-Guamán, L.; Chamba-Eras, L. Cloud Computing in Smart Educational Environments: Application in Learning Analytics as Service. In New Advances in Information Systems and Technologies. Advances in Intelligent Systems and Computing; Rocha, Á., Correia, A., Adeli, H., Reis, L., Mendonça Teixeira, M., Eds.; Springer: Berlin/Heidelberg, Germany, 2016; Volume 444, pp. 993–1002. [Google Scholar]
- Aguilar, J.; Garces-Jimenez, A.; Gallego-Salvador, N.; De Mesa, J.A.G.; Gomez-Pulido, J.M.; Garcia-Tejedor, A.J. Autonomic Management Architecture for Multi-HVAC Systems in Smart Buildings. IEEE Access 2019, 7, 123402–123415. [Google Scholar] [CrossRef]
- Candia, G. Industry 4.0 and its aberrations. İnformasiya Cəmiyyəti Probl. 2022, 1, 48–57. [Google Scholar] [CrossRef]
- Eisavi, V.; Homayouni, S.; Yazdi, A.M.; Alimohammadi, A. Land cover mapping based on random forest classification of multitemporal spectral and thermal images. Environ. Monit. Assess. 2015, 187, 291. [Google Scholar] [CrossRef]
- Sanchez, M.; Exposito, E.; Aguilar, J. Implementing self-* autonomic properties in self-coordinated manufacturing processes for the Industry 4.0 context. Comput. Ind. 2020, 121, 103247. [Google Scholar] [CrossRef]
- Valencia-Cárdenas, M.; Restrepo-Morales, J.A.; Día-Serna, F.J. Big Data Analytics in the Agribusiness Supply Chain Management. AiBi Rev. Investig. Adm. Ing. 2021, 9, 32–42. [Google Scholar] [CrossRef]
- Flórez, D. Prospective research guidelines for the production chain of sugarcane—(focus on panela, not centrifuged sugar). Tecnura 2013, 17, 72–86. [Google Scholar]
- Chaves, J.; Díaz, R.; Hernández, A.; Hidalgo, O. Cadenas productivas agroindustriales y competitividad: Definición de políticas y estrategias en el meso nivel. Econ. Soc. 2000, 13, 5–18. [Google Scholar]
- Isaza, J. Cadenas productivas. Enfoques y precisiones conceptuales. Sotavento 2008, 11, 8–25. [Google Scholar]
- Sen, D.; Ozturk, M.; Vayvay, O. An Overview of Big Data for Growth in SMEs. Procedia-Soc. Behav. Sci. 2016, 235, 159–167. [Google Scholar] [CrossRef]
- Li, Y.; Jiang, W.; Yang, L.; Wu, T. On neural networks and learning systems for business computing. Neurocomputing 2018, 275, 1150–1159. [Google Scholar] [CrossRef]
- Marinagi, C.; Skourlas, C.; Galiotou, E. Advanced information technology solutions for implementing information sharing across supply chains. In ACM International Conference Proceeding Series, Proceedings of the PCI ‘18: 22nd Pan-Hellenic Conference on Informatics, Athens, Greece, 29 November–1 December 2018; ACM: New York, NY, USA, 2018; pp. 99–102. [Google Scholar] [CrossRef]
- Lopez, H.A.G.; Cisneros, M.A.P. Industry 4.0 & Internet of Things in Supply Chain. In Proceedings of the CLIHC ‘17: 8th Latin American Conference on Human-Computer Interaction, Antigua Guatemala, Guatemala, 8–10 November 2017; pp. 1–4. [Google Scholar] [CrossRef]
- Luque, A.; Peralta, M.E.; Heras, A.d.L.; Córdoba, A. State of the Industry 4.0 in the Andalusian food sector. Procedia Manuf. 2017, 13, 1199–1205. [Google Scholar] [CrossRef]
- García, E.; Vieira, M. Estudo de caso de mineração de dados multirelacional: Aplicação do algoritmo connetionblock em um problema da agroindústria. In Proceedings of the Simpósio Brasileiro de Bancos de Dados, Campinas, Brazil, 13–15 October 2008; pp. 224–237. [Google Scholar]
- Meyer, M.; Dykes, J. Criteria for Rigor in Visualization Design Study. IEEE Trans. Vis. Comput. Graph. 2019, 26, 87–97. [Google Scholar] [CrossRef] [PubMed]
- Bader, F.; Rahimifard, S. Challenges for Industrial Robot Applications in Food Manufacturing. In Proceedings of the ISCSIC ‘18: The 2nd International Symposium on Computer Science and Intelligent Control, Stockholm, Sweden, 21–23 September 2018. [Google Scholar]
- Kakhki, F.D.; Freeman, S.A.; Mosher, G. Evaluating machine learning performance in predicting injury severity in agribusiness industries. Saf. Sci. 2019, 117, 257–262. [Google Scholar] [CrossRef]
- Borghesan, F.; Zagorowska, M.; Mercangöz, M. Unmanned and Autonomous Systems: Future of Automation in Process and Energy Industries. IFAC-Pap. 2022, 55, 875–882. [Google Scholar] [CrossRef]
- Uygun, Y. Autonomous Manufacturing-Related Procurement in the Era of Industry 4.0. In Digitalisierung im Einkauf; Schupp, F., Wöhner, H., Eds.; Springer: Gabler, Wiesbaden, 2023. [Google Scholar]
- Kephart, J.; Chess, D. The vision of autonomic computing. Computer 2003, 36, 41–52. [Google Scholar] [CrossRef]
- Papetti, A.; Gregori, F.; Pandolfi, M.; Peruzzini, M.; Germani, M. Iot to enable social sustainability in manufacturing systems. Adv. Transdiscipl. Eng. 2018, 7, 53–62. [Google Scholar]
- Aguilar, J.; Jerez, M.; Exposito, E.; Villemur, T. CARMiCLOC: Context Awareness Middleware in Cloud Computing. In Proceedings of the 2015 XLI Latin American Computing Conference (CLEI), Arequipa, Peru, 19–23 October 2015. [Google Scholar]
- Morales, L.; Ouedraogo, C.A.; Aguilar, J.; Chassot, C.; Medjiah, S.; Drira, K. Experimental comparison of the diagnostic capabilities of classification and clustering algorithms for the QoS management in an autonomic IoT platform. Serv. Oriented Comput. Appl. 2019, 13, 199–219. [Google Scholar] [CrossRef]
- Verdouw, C.; Sundmaeker, H.; Tekinerdogan, B.; Conzon, D.; Montanaro, T. Architecture framework of IoT-based food and farm systems: A multiple case study. Comput. Electron. Agric. 2019, 165, 104939. [Google Scholar] [CrossRef]
- Yadav, S.; Luthra, S.; Garg, D. Modelling Internet of things (IoT)-driven global sustainability in multi-tier agri-food supply chain under natural epidemic outbreaks. Environ. Sci. Pollut. Res. 2021, 28, 16633–16654. [Google Scholar] [CrossRef]
- Ramírez-Valverde, B. “Gerardo Torres Salcido y Rosa María Larroa Torres (coord): Sistemas agroalimentarios localizados: Desarrollo conceptual y diversidad de situaciones” (Reseña). Agric. Soc. Desarro. 2013, 10, 133–137. [Google Scholar]
- Nonaka, I. The knowledge creating company. Harv. Bus. Rev. 1991, 85, 162–171. [Google Scholar]
- Castellanos, O.; Rojas, J. Conceptualización y papel de la cadena productiva en un entorno de competitividad. Innovar 2001, 18, 87–98. [Google Scholar]
- Fletes, H.; Ocampo, G.; Valdiviezo, G. Agroindustry dynamism in the Corredor Costero, Chiapas, Mexico. Coordination and territorial competitivity. Mundo Agrar. 2016, 17, e038. [Google Scholar]
- Organización de Cooperación y Desarrollo Económicos, ocde. Manual de Oslo: Guía Para la Recogida e Interpretación de Datos Sobre Innovación, 3rd ed.; Traducción española Grupo Tragsa: Madrid, España, 2005; p. 188. [Google Scholar]
- Salimbeni, S.; Redchuk, A.; Rousserie, H. Quality 4.0: Technologies and readiness factors in the entire value flow life cycle. Prod. Manuf. Res. 2023, 11, 2238797. [Google Scholar] [CrossRef]
- Bell, M.; Pavitt, K. The development of technological capabilities. In Trade, Technology, and International Competitiveness; Haque, I., Ed.; Economic Development Institute, The World Bank: Washington, DC, USA, 1995; pp. 69–101. [Google Scholar]
- Roukh, A.; Fote, F.; Mahmoudi, S.; Mahmoudi, S. WALLeSMART: Cloud Platform for Smart Farming. In Proceedings of the ACM International Conference Proceeding Series, SSDBM ‘20: 32nd International Conference on Scientific and Statistical Database Management, Vienna, Austria, 7–9 July 2020; pp. 1–4. [Google Scholar] [CrossRef]


| Phase | Use |
|---|---|
| Phase 1 | Analysis of the production chain in the agroindustrial to improve their competitiveness. To this end, this research proposes ACODAT to improve industrial production. |
| Phase 2 | Identification of data sources (e.g., quantity, quality, time, and cost). |
| Phase 3 | Implementation of autonomic cycles for the automation of the production chains in agroindustry. |
| Process | Examples |
|---|---|
| Suppliers of Input Materials | Irrigation systems, organic and inorganic fertilizers, certified seeds. |
| Producers and/or Growers | Land tenure, area, labor force, technological level, degree of specialization, market share, working capital, forestry support services, agricultural support activities, post-harvest activities, seed processing. |
| Industrial Transformer | Size of the property, labor force, type of input to be processed, quality parameters, technological level, the added value of the product, market scope and coverage, level of specialization of the business. |
| Wholesaler/Retailer | Stockpiling and Distribution. Storage, Classification, Standardization, Packaging and Transportation. |
| Process | Subprocess | ACRONYM |
|---|---|---|
| Input suppliers | Certified seeds | SCS |
| Organic and inorganic fertilizers | AOEI | |
| Primary, secondary and tertiary packaging | EPST | |
| Applications of agrochemicals in particular and fertilizers. | AAPF | |
| Producers and/or growers | Workmanship | MOEP |
| Forestry support services | SAAF | |
| Post-harvest activities | APAC | |
| Technological level | NTAP | |
| Industrial transformer | Type of input to be processed | TIAT |
| Transformer technology level | NTAT | |
| Market reach and coverage. | ACDM | |
| Level of business specialization. | NEDN | |
| Wholesaler/retailer commercialization | Stockpiling | ACOP |
| Leveling | NIVE | |
| Distribution | DIST |
| Meaning | Weight |
|---|---|
| Subprocess is not important | 1 |
| Subprocess is slightly important | 2 |
| Subprocess is important | 3 |
| Subprocess is very important | 4 |
| Weight | Evaluation Criteria | Processes | ||||||||||||||
|---|---|---|---|---|---|---|---|---|---|---|---|---|---|---|---|---|
| Input Suppliers | Producers and/or Growers | Industrial Transformer | Wholesaler/Retailer | |||||||||||||
| SCS | AOEI | EPST | AAPF | MOEP | SAAF | APAC | NTAP | TIAT | NTAT | ACDM | NEDN | ACOP | NIVE | DIST | ||
| Relevance to Production Management | ||||||||||||||||
| 4 | the factors that intervene in the process are characterized. | 4 | 3 | 2 | 4 | 3 | 3 | 4 | 4 | 4 | 4 | 4 | 4 | 3 | 3 | 4 |
| 4 | the uses and functions of the materials and tools used are distinguished | 3 | 4 | 3 | 4 | 2 | 2 | 4 | 4 | 4 | 4 | 4 | 3 | 2 | 3 | 3 |
| 4 | information and knowledge management is identified | 2 | 3 | 3 | 4 | 2 | 3 | 3 | 4 | 4 | 4 | 4 | 4 | 2 | 3 | 4 |
| 4 | Production, service and support processes are identified. | 2 | 4 | 3 | 4 | 3 | 4 | 4 | 4 | 4 | 4 | 4 | 3 | 2 | 3 | 4 |
| 4 | Environmental responsibility, good use and conservation of biodiversity. | 3 | 4 | 4 | 4 | 2 | 4 | 4 | 3 | 4 | 4 | 4 | 4 | 2 | 3 | 3 |
| 4 | Machinery capacity | 2 | 3 | 4 | 4 | 2 | 3 | 3 | 3 | 4 | 4 | 3 | 4 | 3 | 3 | 2 |
| 4 | Accessibility to technology. | 3 | 3 | 4 | 2 | 2 | 3 | 3 | 4 | 4 | 4 | 4 | 4 | 3 | 3 | 4 |
| 4 | Skilled Labor (Requirement and Availability) | 4 | 3 | 3 | 2 | 4 | 2 | 3 | 4 | 4 | 4 | 4 | 4 | 3 | 3 | 4 |
| 4 | Identification of suppliers of raw materials and inputs (domestic, international origin) | 4 | 4 | 4 | 3 | 2 | 3 | 3 | 2 | 4 | 4 | 4 | 4 | 4 | 3 | 4 |
| Relevance for performing data analysis tasks | ||||||||||||||||
| 4 | How many internal or external sources of information exist: databases, Excel sheets, reports, etc. | 3 | 3 | 4 | 3 | 3 | 3 | 3 | 4 | 3 | 4 | 4 | 4 | 4 | 3 | 4 |
| 4 | What level of access do you have to the information | 4 | 3 | 3 | 4 | 3 | 2 | 4 | 4 | 3 | 4 | 4 | 4 | 4 | 3 | 4 |
| 4 | Level of use of computer tools (Words, excel, power point, etc.). | 2 | 3 | 3 | 3 | 3 | 2 | 3 | 4 | 3 | 3 | 4 | 3 | 4 | 3 | 4 |
| 4 | Frequency of information gathering at this stage of the process | 3 | 3 | 3 | 3 | 3 | 3 | 3 | 4 | 3 | 3 | 4 | 4 | 4 | 3 | 4 |
| Total unweighted | 39 | 43 | 43 | 44 | 34 | 37 | 44 | 48 | 48 | 50 | 51 | 49 | 40 | 39 | 48 | |
| Weighted total | 36 | 36 | 37 | 39 | 37 | 33 | 38 | 39 | 42 | 41 | 38 | 41 | 37 | 36 | 38 | |
| Task Name | Knowledge Models | Data Sources |
|---|---|---|
| Predictive Model | Production demand, customers. |
| Diagnostic Model | Inputs used on the farm, cultural practices, storage, and transport services. |
| Predictive Model | Annual demand. |
| Predictive Model | Operating Costs. |
| Name Task | Knowledge Models | Data Sources |
|---|---|---|
| Classification Model | Location, the exclusivity of the premises, access roads, structure and finishes, lighting, ventilation. |
| Prescription Model | Phases (collection and production), transportation and storage, sources of supplies, availability of labor, availability of infrastructure, cost of land and raw material, quality standards. |
| Classification or identification Model | Type of production process (made-to-order or job, batch, mass, and continuous flow). |
| Name Task | Knowledge Models | Data Sources |
|---|---|---|
| Classification or identification Model | Demand needs, access to markets. |
| Diagnostic Model | Hygienic-sanitary quality and bromatological quality management in production. |
| Winery | Week | Quantity (Bags) | Ambient Temperature °C | Humidity % |
|---|---|---|---|---|
| Bod_01 | Week 1 | 100 | 20 | 12 |
| Bod_01 | Week 2 | 120 | 22 | 13 |
| Bod_01 | Week 3 | 150 | 18 | 15 |
| Bod_01 | Week 4 | 110 | 25 | 14 |
| Winery | Week | Quantity (Bags) | Acidity (4.9–5.2) | Category (0–5) |
|---|---|---|---|---|
| Bod_01 | Week 1 | 100 | 4.9 | 0 |
| Bod_01 | Week 2 | 120 | 5.0 | 2 |
| Bod_01 | Week 3 | 150 | 5.5 | 6 |
| Bod_01 | Week 4 | 110 | 5.2 | 4 |
| Toaster | Week | Quantity (Bags) | Temperature (°C) | Time (Minutes) |
|---|---|---|---|---|
| Tost_01 | Week 1 | 100 | 193 | 12 |
| Tost_01 | Week 2 | 120 | 200 | 13 |
| Tost_01 | Week 3 | 150 | 218 | 14 |
| Tost_01 | Week 4 | 110 | 300 | 20 |
| Criterion 1 | Criterion 2 | Criterion 3 | Criterion 4 | |
|---|---|---|---|---|
| [12] | X | √ | √ | X |
| [17] | X | √ | √ | X |
| [18] | X | X | X | X |
| [19] | X | X | X | X |
| [32] | X | X | X | X |
| [36] | X | √ | √ | X |
| This work | √ | √ | √ | √ |
| Task Number | Knowledge Models | Quality Metrics |
|---|---|---|
| 1 | Predictive Model | R2 = 0.95 MAPE = 89% |
| 2 | Diagnostic Model | Silhouette index = 0.87 |
| 3 | Predictive Model | R2 = 0.92 MAPE = 88% |
| 4 | Predictive Model | R2 = 0.97 MAPE = 95% |
Disclaimer/Publisher’s Note: The statements, opinions and data contained in all publications are solely those of the individual author(s) and contributor(s) and not of MDPI and/or the editor(s). MDPI and/or the editor(s) disclaim responsibility for any injury to people or property resulting from any ideas, methods, instructions or products referred to in the content. |
© 2024 by the authors. Licensee MDPI, Basel, Switzerland. This article is an open access article distributed under the terms and conditions of the Creative Commons Attribution (CC BY) license (https://creativecommons.org/licenses/by/4.0/).
Share and Cite
Fuentes, J.; Aguilar, J.; Montoya, E.; Pinto, Á. Autonomous Cycles of Data Analysis Tasks for the Automation of the Production Chain of MSMEs for the Agroindustrial Sector. Information 2024, 15, 86. https://doi.org/10.3390/info15020086
Fuentes J, Aguilar J, Montoya E, Pinto Á. Autonomous Cycles of Data Analysis Tasks for the Automation of the Production Chain of MSMEs for the Agroindustrial Sector. Information. 2024; 15(2):86. https://doi.org/10.3390/info15020086
Chicago/Turabian StyleFuentes, Jairo, Jose Aguilar, Edwin Montoya, and Ángel Pinto. 2024. "Autonomous Cycles of Data Analysis Tasks for the Automation of the Production Chain of MSMEs for the Agroindustrial Sector" Information 15, no. 2: 86. https://doi.org/10.3390/info15020086
APA StyleFuentes, J., Aguilar, J., Montoya, E., & Pinto, Á. (2024). Autonomous Cycles of Data Analysis Tasks for the Automation of the Production Chain of MSMEs for the Agroindustrial Sector. Information, 15(2), 86. https://doi.org/10.3390/info15020086