Article

Predictive Modeling of Water Level in the San Juan River Using Hybrid Neural Networks Integrated with Kalman Smoothing Methods

by
Jackson B. Renteria-Mena
1 and
Eduardo Giraldo
2,*
1
Faculty of Engineering, Universidad Tecnologica del Chocó, Quibdó 111071, Chocó, Colombia
2
Electrical Engineering Department, Universidad Tecnologica de Pereira, Pereira 660003, Risaralda, Colombia
*
Author to whom correspondence should be addressed.
Information 2024, 15(12), 754; https://doi.org/10.3390/info15120754
Submission received: 22 October 2024 / Revised: 20 November 2024 / Accepted: 22 November 2024 / Published: 26 November 2024
(This article belongs to the Special Issue Real-World Applications of Machine Learning Techniques)

Abstract

:
This study presents an innovative approach to predicting the water level in the San Juan River, Chocó, Colombia, by implementing two hybrid models: nonlinear auto-regressive with exogenous inputs (NARX) and long short-term memory (LSTM). These models combine artificial neural networks with smoothing techniques, including the exponential, Savitzky–Golay, and Rauch–Tung–Striebel (RTS) smoothing filters, with the aim of improving the accuracy of hydrological predictions. Given the high rainfall in the region, the San Juan River experiences significant fluctuations in its water levels, which presents a challenge for accurate prediction. The models were trained using historical data, and various smoothing techniques were applied to optimize data quality and reduce noise. The effectiveness of the models was evaluated using standard regression metrics, such as Nash–Sutcliffe efficiency (NSE), mean square error (MSE), and mean absolute error (MAE), in addition to Kling–Gupta efficiency (KGE). The results show that the combination of neural networks with smoothing filters, especially the RTS filter and smoothed Kalman filter, provided the most accurate predictions, outperforming traditional methods. This research has important implications for water resource management and flood prevention in vulnerable areas such as Chocó. The implementation of these hybrid models will allow local authorities to anticipate changes in water levels and plan preventive measures more effectively, thus reducing the risk of damage from extreme events. In summary, this study establishes a solid foundation for future research in water level prediction, highlighting the importance of integrating advanced technologies in water resources management.

Graphical Abstract

1. Introduction

The choice of appropriate models for river water level prediction is of utmost importance, as they determine the accuracy and reliability of projections. Effective modeling facilitates the understanding of water dynamics and allows for the identification of patterns and trends crucial for decision making. In contexts where floods are a constant threat, advanced and well-structured techniques become essential tools to mitigate risks, optimize water resource management, and protect vulnerable communities. Investing in appropriate models can make the difference between an effective response and the occurrence of devastating disasters. By forecasting increases in water levels, it is possible to issue early warnings that facilitate evacuation and the implementation of emergency measures, helping to save lives and minimize damage. It is also essential for efficiently managing water resources, such as reservoir regulation, agricultural irrigation, and drinking water supply. It also provides a sound basis for planning and developing infrastructure in flood-prone areas, according to Moreno et al. [1]. Numerous research studies have contributed significantly to developing water level prediction models to prevent future floods. Among these studies are works encompassing advanced hydrological modeling techniques, machine learning methods, and hybrid approaches combining different methodologies to improve prediction accuracy. This research has demonstrated the effectiveness of various approaches to anticipating flood events, thus enabling better preparedness and the mitigation of their impacts. A standard method to describe the hydrological model is the use of exponential smoothing, as reported by Mgandu et al. [2], which focuses on trend analysis and water level prediction in the Mtera reservoir using exponential smoothing methods. This study applies exponential smoothing techniques to model and forecast fluctuations in water levels, seeking to improve the accuracy of predictions and provide valuable tools for water resource management in the reservoir. Hamidon et al. [3] investigated how to apply smoothing techniques to improve water level forecasting in rivers. The work focuses on the use of smoothing methods to analyze time series and provide more accurate water level estimates, which is crucial for better water resource management and anticipating possible extreme events related to river flow. Muhamad et al. [4] explored the application of exponential smoothing techniques to analyzing and predicting river water level data. The authors evaluate how these techniques can improve water level modeling, aiming to provide more accurate and reliable methods for predicting trends in hydrological data and to facilitate better management and planning in water resource management. Abdurrahman et al. [5] presented a combined approach for flood forecasting using the Holt–Winters exponential smoothing method with geographic information systems (GIS). The research focuses on how to apply this smoothing method to flood forecasting, integrating geospatial data to improve the accuracy of predictions and support decision making in flood-related risk management. Bae et al. [6] addressed outlier detection and smoothing processes for water level data collected by ultrasonic sensors in river flows. The authors propose methods to identify and handle outliers in the data and apply smoothing techniques to improve the quality of measurements and accuracy in predicting water levels in river flows, contributing to more effective and accurate management of water resources. Wibowo et al. [7] explored the use of the Holtz–Winters exponential smoothing method to predict tide levels in Cilacap Bay. The authors implemented this approach to capture seasonal trends and variations in water level data, demonstrating that the technique is effective in tidal prediction, providing a valuable tool for coastal risk management. Imani et al. [8] developed a model to accurately predict seasonal Caspian Sea level anomalies using satellite data. The approach combines polynomial interpolation with the Holt–Winters exponential smoothing method, demonstrating that this methodology effectively captures fluctuations and provides accurate sea level forecasts.
Other studies propose different water level prediction techniques, such as the one proposed by Tiu et al. [9], which examines different data preprocessing techniques applied to machine learning models for water level prediction. The authors evaluate how preprocessing, including normalization and outlier removal, affects the accuracy of predictive models in hydrological contexts. The study highlights the importance of optimizing data preprocessing to improve water level predictions and effectively manage risks associated with natural events. Li et al. [10] demonstrated that hybrid models can provide more reliable and effective estimates for flood risk management and water resource planning in complex rivers. In addition, the authors of [11] presented a NARX structure for groundwater level forecasts, where short-term and mid-term forecasts are achieved. Moreover, in [12], a system for predicting flood levels was developed based on real-time sensor data.
Artificial neural networks (ANNs) can also be used to improve the performance of hydrological models based on physical variables. For example, in [13], five alternative machine learning techniques were used to improve the hydrological model, including linear regression, neural network regression, Bayesian linear regression, and reinforced decision tree regression. In another study published by us [14], we presented an approach to short-term water level prediction using multivariate NARX neural network models; the study evaluates the effectiveness of these models in water level prediction using inputs such as flow and precipitation to improve forecast accuracy. The results show that the proposed NARX models are valuable tools for flood risk management and hydrological planning. In other research [15], we addressed multivariate hydrologic modeling using long- and short-term memory (LSTM) neural networks for water level prediction, employing multivariate hydrological data, such as flow, precipitation, and other relevant factors, to improve the accuracy of predictive models. The results highlight the ability of LSTM networks to capture complex temporal patterns, making them an effective tool for hydrological prediction and water resource management, and in [16], we present a comparative analysis of nonlinear methods for multivariate water level prediction in the Atrato River. Several predictive approaches, including neural-network-based models, are evaluated to determine which is the most effective at capturing the complex hydrological dynamics of the basin. The results highlight the importance of nonlinear approaches to improve the accuracy of predictions in environments with considerable hydrological variability. The authors of [17] evaluated the bias correction of real-time precipitation data and the improvement of hydrological models using the ANN bias correction method for real-time flood forecasting. New studies have been undertaken using a novel model [18], GRA-NARX (grey relational analysis–nonlinear autoregressive with exogenous input), in which the model integrates gray relation analysis with a nonlinear auto-regression approach with exogenous inputs. It focuses on accurately predicting water levels at these critical stations using historical data and relevant variables. However, we can see how the hybridization of an ANN with particle swarm optimization (PSO) for water level prediction can improve the accuracy of hydrological predictions, especially in terms of flood forecasting and water management [19]. Consequently, the need to solve the problem of river water level prediction has led to the need to develop new innovative models such as BAS-ELM (intelligent bat algorithm with a simplified extreme learning machine) for water level prediction in front of pumping stations [20]. This methodology stands out for its application of advanced computational intelligence techniques specifically designed to improve the accuracy of hydrological predictions. Another method explores the integration of synthetic aperture radar (SAR)-derived flood extent data with river flood forecasting models to improve the accuracy of flood forecasts [21]. The study demonstrates the potential benefits of assimilating SAR-derived flood extent observations into existing forecasting systems using a proof-of-concept approach. Another study performed a sensitivity analysis of the hyperparameters of an ensemble Kalman [22] filter applied to a semi-distributed hydrologic model for streamflow prediction. The analysis investigates how different configurations of the hyperparameters affect the accuracy of streamflow predictions. In addition, the assimilation of remotely sensed data with a chained hydrologic-hydraulic model for flood prediction [23] has been explored. This approach seeks to improve the accuracy of flood predictions by integrating remotely sensed data into a model that simulates both hydrologic and hydraulic processes. The study demonstrates how the combination of remote sensing data and hydrologic-hydraulic models can significantly improve flood prediction capability. Other hybrid models have been used to implement different advanced algorithms, such as artificial neural networks and support vector machines, in order to more effectively capture the complex hydrological dynamics of the Barak River and provide more reliable and accurate forecasts for flood risk management [24]. Another model showed effectiveness when coupling multilayer perceptron (MLP) and support vector machine (SVM) in modeling hydrological data, where the importance of the grey wolf optimizer (GWO) was noted, optimizing model parameters to improve its predictive performance in order to provide more accurate and reliable forecasts to support flood risk management [25]. Finally, it can be indicated that advanced AI techniques can be applied to improve water management, predict hydrological phenomena, and optimize the use of water resources. A detailed overview of various AI methodologies and algorithms has been provided, highlighting their applicability in watershed studies and their potential to address environmental and sustainability challenges in water management [26].
Hydrological models can also be improved by using optimal filters, such as the Kalman filter (KF), the unscented Kalman filter (UKF), or the ensemble Kalman filter (EnKF), for data assimilation. The ensemble Kalman filter (EnKF) has made a contribution to the prediction of water levels [27]; it is used to improve the performance of hydrological models. The coupled model in [28] uses a combination of the UKF and a recurrent neural network for long-term flood forecasting. In [29], the EnKF improves water level simulation in complex river networks, and in [30], the EnKF is used to improve the forecasting capability of flood models. Moreover, in [31], the improvement of an ANN is presented by using the KF for water level forecasting, and in [32], an ANN is improved by using the EnKF by using a hybrid algorithm for water level forecasting. Finally, in [33], the UKF and EnKF were tested for the improvement of a lowland hydrologic model, and in [34], the UKF and support vector regression (SVR) were used to improve the predictions on a lake. The scientific community has employed modeling methods or techniques that can be used to improve water management and reduce water losses in the system. By using artificial neural networks (ANNs) and multiple linear regression (MLR), researchers seek to identify and predict factors that contribute to predicting non-revenue water (NRW) [35], thus providing more accurate and efficient tools for water authorities and managers. It is worth mentioning that the combination of coupled models such as particle swarm (PSO) with support vector machines (SVMs) improves the accuracy of flood flow predictions, which is crucial for risk management and disaster planning. By integrating these two methods, the model can better tune parameters and optimize predictive performance [22]. Support vector machines (SVMs) represent another advanced optimization and machine learning method that improves the accuracy of flow predictions. This hybrid approach allows for better tuning and optimization of model parameters, improving prediction capability compared to traditional methods [36]. Additionally, some hybrid models combining particle swarm optimization with artificial intelligence can improve river flow prediction [37].
The novelty of the proposal lies in the combination of advanced artificial intelligence techniques and statistical smoothing to improve hydrological prediction in a complex and vulnerable environment. Hybrid neural networks allow for the capture of the nonlinear and dynamic relationships of the hydrological system, integrating multiple variables such as precipitation, flow, and other key factors that affect water levels in the San Juan River. This ability of neural networks to learn complex patterns from historical data is critical in a context such as the Chocó, where flood events can be highly unpredictable due to intense climatic variability.
Incorporating the smoothed Kalman filter adds correction and refinement to the predictions generated by the neural networks. The filter allows the model estimates to be adjusted in real time, correcting the predictions by integrating new observations and removing noise or errors that may arise in the input data. This filtering stage ensures that the predictions are accurate, stable, and reliable. The innovation of this approach lies in its ability to provide continuous and adaptive predictions, which is ideal for early warning systems in flood-prone areas such as the San Juan River. In addition, this methodology is flexible and can be adjusted to different hydrological conditions, providing a robust tool for flood risk management and efficient water resource planning in vulnerable regions such as Chocó.
To evaluate the effectiveness of the hybrid models, standard regression evaluation metrics, such as Nash–Sutcliffe efficiency (NSE), mean square error (MSE), mean absolute error (MAE), and Kling–Gupta efficiency (KGE), were used. This paper is structured as follows: in Section 2, the structures of the two proposed hybrid nonlinear methods, NARX and LSTM, are detailed, together with the geographical location of the hydrological stations and their components. In Section 3, the results that were obtained are presented, including the prediction of the two water level output variables with the proposed approach, as well as the corresponding performance measures and comparative analysis. In addition, the results of the two nonlinear models with the different Kalman smoothing techniques are included. Finally, Section 4 provides the conclusions and concluding remarks.

2. Theoretical Framework

2.1. San Juan River

The San Juan River, located in the department of Chocó, Colombia, is one of the most important bodies of water in the Pacific region. With an approximate length of 380 km, it rises on the slopes of the western mountain range and flows through dense jungle areas before emptying into the Pacific Ocean. This river is characterized by its fast-flowing waters and a basin that covers one of the largest areas in the country. Its basin is located in one of the rainiest regions on the planet, which considerably increases its flow at certain times of the year [38].
The San Juan Basin measures 16,465 km2 and consists of 12 mountain tributaries; it originates at 3990 m and follows a sinuous course until it encounters a plateau 90 m above sea level (MASL). The flood plain of San Juan is of limited size, and the bends of the river are in contact with bedrock walls. The San Juan Basin receives an average annual rainfall of 7277 mm, where 78% falls between May and November, and 22% falls between December and May. The mean annual discharge of Rio San Juan is 2550 m3 s−1.
In [38], a mathematical model for water flow with a simple climatic runoff model is proposed. The measured water flow ( Q R in m3 s−1) from a drainage basin (A in km2) is computed as
Q R = r × Δ f r d A
where Δ f is the runoff (mm yr−1); r is the precipitation (mm yr−1); and the nondimensional quantity Δ f r is the runoff ratio, which expresses the fraction of rainfall converted into runoff. In Table 1, some of the physical parameters of the San Juan River are summarized.
This model allows for a correlation between the water flow and water precipitation, but the runoff ratio varies along the river and must be adjusted accordingly. This simplified model does not include a correlation to water level since detailed knowledge of the sectional area of the river and drain characteristics of the basin are required.
The San Juan River is fundamental for the subsistence of the Afro-Colombian and indigenous communities that live along its banks; it is a vital resource for fishing, agriculture, and river transportation, given that many of these areas are difficult to access by land. It is also one of the main arteries for the movement of products and people in the region. However, heavy rains and its fluctuating flow make the river prone to flooding, which represents a considerable risk for the riverside populations, who frequently face emergencies due to overflows. This makes water level monitoring and forecasting essential to prevent disasters, protect communities, and manage water resources efficiently.
There are several hydrological stations located along the river. Even when these stations measure several variables, the data measurements in this study consider only three types of hydrological variables: water flows, water levels, and precipitation. In this study, only two hydrological stations are considered; however, the proposed methodology can be extended to several hydrological stations and may correlate several variables. From Equation (1), it can be seen that the measurement variables have an inherent coupling, and therefore, a multivariable model can be defined to describe the dynamic behavior. Each station provides measurements of these three variables, with records every 12 h. Figure 1 shows the location of the hydrological stations and the exact place where the data collection of the proposed case study was carried out. The hydrological stations are located in Colombia, Department of Chocó.
Table 2 shows the geographical positions of the hydrological stations considered in this study.

2.2. Hydrological Variables

In order to perform water level forecasting based on the dynamics of the river, two hydrological stations are located on the river in two different positions. It is worth mentioning that water flow, precipitation, and water level are the measurements at each hydrological station. In order to consider the correlation among all the variables of the system and their corresponding nonlinearities, a nonlinear dynamical model is proposed based on neural networks. In Equation (2), the inputs u k , outputs y k , and states x k of the proposed model are shown:
y k = y L 1 [ k ] y L 2 [ k ] , u k = u F 1 [ k ] u P T 1 [ k ] u F 2 [ k ] u P T 2 [ k ] , x k = y k 1 y k n u k 1 u k n
where y L 1 [ k ] and y L 2 [ k ] correspond to the two outputs of the water level variable of the two stations; and u F 1 [ k ] , u F 2 [ k ] , u P T 1 [ k ] , and u P T 2 [ k ] are the four inputs of the hydrological model, where u F j [ k ] represents the j t h input of the water flow variable of the two stations, and u P T j [ k ] represents the j t h input of the precipitation variable of the two stations already mentioned. In addition, x k describes the state vector related to past inputs and outputs, with n being the system order.

2.3. NARX Neural Network Model for Hydrological Level Forecasting

The dynamic of the hydrological variables is defined by considering the following equation:
y k = f ( x k ) + ϵ k
where f ( . ) is the nonlinear vector function that represents the NARX model, and ϵ k is the additive noise at time instant k. Equation (3) can be considered as the measurement equation; therefore, the following state space nonlinear model of hydrological activity can be defined:
x k + 1 = y k y k 1 y k n + 1 u k u k n + 1 = f ( x k ) I y 0 0 0 0 I y 0 0 0 0 0 0 0 I u 0 0 0 0 I u 0 y k 1 y k n u k 1 u k n x k + 0 0 0 I u 0 u k + η k
x k + 1 = F ( x k , u k ) + η k
where the dimensions of identity matrices I y and I u are 2 × 2 and 4 × 4 , respectively, and η k is the additive noise at time instant k. In order to approximate the nonlinear function of (3), the nonlinear function f ( . ) is approximated by using a neural network structure, f * ( . ) , where the NARX model can be defined as follows:
y k = f * ( x k ) + ϵ k
Figure 2 shows the NARX-based neural network structure.

2.4. Recurrent Neural Network Modeling for Long Short-Term Memory (LSTM)

The LSTM neural network is defined by considering the input, x k , 10 nodes in the hidden layer, and the output y k (of dimension 2). The LSTM structure is defined by considering the state cells and gates, and the output layer is described in the following subsections.

2.4.1. State Cells and Gates in LSTM

The LSTM consists of several gates and cells that manage the flow of information. The formulation for an LSTM with a memory cell, c k , and output, h k , are defined by
i k = σ ( W i x k + U i h k 1 + b i ) f k = σ ( W f x k + U f h k 1 + b f ) o k = σ ( W o x k + U o h k 1 + b o ) c ˜ t = tanh ( W c x k + U c h k 1 + b c ) c k = f k c k 1 + i k c ˜ k h k = o k tanh ( c k )
where
  • i k is the entrance door;
  • f k is the gate of oblivion;
  • o k is the exit gate;
  • c ˜ k is the candidate memory cell;
  • c k is the current memory cell;
  • h k is the output of the LSTM;
  • W i , W f , W o , and W c are the weight matrices for the input, forgetting, and output gates and the candidate memory cell, respectively;
  • U i , U f , U o , and U c are the recurrent weight matrices;
  • b i , b f , b o , and b c are the son biases;
  • σ is the sigmoid function;
  • tanh is the hyperbolic tangent function;
  • ⊙ denotes element-by-element multiplication.

2.4.2. Output Layer

The output of the neural network is obtained via a dense layer that transforms the LSTM output, h k , into the desired output, y k , as follows:
y k = W y h k + b y
where
  • y k is the final output;
  • W y is the weight matrix of the output layer;
  • b y is the bias of the output layer.
In this case, given that we have two outputs, the dimensions of W y will be 2 × 10 (two outputs and 10 nodes in the hidden layer), and b y will have two elements.

2.5. Smoothing Techniques

Kalman smoothing is an advanced technique in the field of state estimation that is used to refine the estimates of the state of a dynamic system by using all available observations up to the end of the period of interest, as reported by Simon [39]. Unlike the standard Kalman filter, which only considers past observations to make real-time estimates, Kalman smoothing optimizes state estimation by incorporating future information.

2.5.1. A. Exponential Smoothing

Exponential smoothing weights historical data with exponentially decreasing weights, giving greater weight to more recent data. The general formula for this type of smoothing is
S k = α X k + ( 1 α ) S k 1
where
  • S k is the smoothed value at time k;
  • X k is the observed value over time k;
  • α is the smoothing parameter (0 < α < 1).
This technique is useful for short-term forecasting in time series with smooth and seasonal characteristics, such as water levels in rivers that exhibit seasonality.

2.5.2. B. Savitzky–Golay Smoothing Filter (SG)

The Savitzky–Golay filter smooths data by fitting low-degree polynomials to data windows and is able to preserve important features such as peaks and oscillations. The basic equation for this filter is
y ^ i = j = m m c j y i + j
where m is the number of convolution coefficients, and
  • y ^ i is the smoothed value at point i;
  • y i + j are the neighboring data points;
  • c j are the coefficients obtained by fitting a polynomial to the data window of size 2 m + 1 .

2.5.3. C. Smoothed Kalman Filter with Rauch–Tung–Striebel (RTS)

The smoothed Kalman filter is based on the following equations:
State prediction:
x ^ k | k 1 = A x ^ k 1 | k 1 + B u k
where x ^ k | k 1 is the a priori estimate of the state over time k; A is the state transition matrix; B is the matrix that relates the control inputs to the control inputs, u k .
Covariance prediction:
P k | k 1 = A P k 1 | k 1 A + Q
where - P k | k 1 is the a priori covariance; - Q is the covariance of the process noise.
Status update:
x ^ k | k = x ^ k | k 1 + K k z k H x ^ k | k 1
where z k is the observation over time k; H is the observation matrix; K k is the Kalman gain:
K k = P k | k 1 H H P k | k 1 H + R 1
Covariance update:
P k | k = ( I K k H ) P k | k 1
The Rauch–Tung–Striebel smoothing (RTS) stage is performed using the following equations:
Smoothing of the state:
x ^ k | N = x ^ k | k + C k x ^ k + 1 | N x ^ k + 1 | k
where x ^ k | N is the smoothed estimate of the state over time, k, using all observations up to N; C k is the smoothing gain:
C k = P k | k A P k + 1 | k 1
Covariance smoothing:
P k | N = P k | k + C k P k + 1 | N P k + 1 | k C k
This filter is useful when noise needs to be removed without losing important peaks or signal structures, such as in water level data with significant fluctuations.

3. Results

3.1. Hydrological Station Measurements

In Table 3, the information period of the datasets used and the specified hydrological variables of the system can be observed.
For this study, only a sample corresponding to 1219 days with records every 12 h is considered, resulting in a total of 2438 data per station for each of the mentioned variables. The following figures describe the real measurements used for data forecasting for the hydrological variables of water level, water flow, and precipitation. Figure 3 shows the sample data of the level variable of the two hydrological stations.
Figure 4 shows the sample data of the flow measurements at the two corresponding stations.
Figure 5 shows the sample data of the precipitation measurements at the two corresponding stations.

3.2. Regression Metrics for the Estimation of the Quadratic Error

In this work, the evaluation of prediction performance is the key to assessing the quality of the model and optimizing efficiency. In this study, standard regression evaluation metrics such as Nash–Sutcliffe efficiency (NSE), mean square error (MSE), mean absolute error (MAE), and Kling–Gupta efficiency (KGE) indicators were used to evaluate the prediction performance of the outputs of the feedforward NARX neural network model and recurrent neural network LSTM. These regression metrics were used to evaluate the two hybrid models proposed in this research, evaluating the smoothed Kalman techniques using the two neural networks in terms of water level prediction.
M S E = 1 N Σ i = 1 N ( y 0 i y i ) 2
where N is the total amount of data samples.
N S E = 1 Σ i = 1 N ( y 0 i y i ) 2 Σ i = 1 N ( y 0 i y 0 ) ¯ 2
M A E = 1 N Σ i = 1 N [ y 0 i y i ]
KGE = 1 ( r 1 ) 2 + ( α 1 ) 2 + ( β 1 ) 2
where r is the Pearson correlation coefficient, α is a term representing the variability of prediction errors, and β is a bias term.

3.3. Order Analysis

Therefore, by considering the variables described in (2), the proposed NARX model consists of y k as the vector of the outputs and x k as the vector of the inputs. The vector of the outputs, y k , is defined as follows:
y k = y L 1 [ k ] y L 2 [ k ]
It is worth noting that the vector of the outputs, y k , is the same for all the models, where the model is proposed as described in (3), with a general structure of the form y k = f ( x k ) .
On the other hand, the elements of x k can vary for each order. For example, for a system of order n = 1 , the vector x k has the following structure:
x k = y k 1 u k 1 = y L 1 [ k 1 ] y L 2 [ k 1 ] u F 1 [ k 1 ] u P T 1 [ k 1 ] u F 2 [ k 1 ] u P T 2 [ k 1 ]
which results in a neural network structure with s i x inputs and t w o outputs.
For a system of order n = 2 , the elements of x k are defined as follows:
x k = y k 1 y k 2 u k 1 u k 2 = y L 1 [ k 1 ] y L 2 [ k 1 ] y L 1 [ k 2 ] y L 2 [ k 2 ] u F 1 [ k 1 ] u P T 1 [ k 1 ] u F 2 [ k 1 ] u P T 2 [ k 1 ] u F 1 [ k 2 ] u P T 1 [ k 2 ] u F 2 [ k 2 ] u P T 2 [ k 2 ]
which results in a neural network structure with 12 inputs and 2 outputs. In a similar way, a system of order n = 3 results in a neural network structure with 18 inputs and 2 outputs. Finally, a system of order n = 4 results in a neural network structure with 24 inputs and 2 outputs.
We conducted an analysis of the order in terms of the MSE for systems of orders 1 to 4 for the two neural network structures (NARX and LSTM). In Table 4, the mean squared error (MSE) response for the two water level outputs of the NARX and LSTM neural network models for systems of orders 1, 2, 3, and 4 are shown.
It can be seen that the adequate selection for the order is order 1, which results in a neural network structure with six inputs and two outputs. By considering the distance between the hydrological stations S1 and S2 (around 15 km) and considering the water flow, as well as the characteristics of the river, it turns out that the signals take around one time sample to propagate from one station to another.

3.4. Experimental Setup

To validate the proposed approach, an analysis was conducted using the NARX and LSTM models with Kalman smoothing for a first-order system. This system was applied to two hydrological stations with a first-order system by using six inputs and two outputs with off-line training. In this water level prediction model, three different Kalman smoothing techniques are employed to assess the robustness of the models in predicting water levels. A comparative visualization is provided, showing both the real and estimated signals from the nonlinear hybrid models, along with the graphical responses of the three Kalman smoothing techniques for each model. Additionally, a quantitative evaluation is performed using four machine learning regression metrics, as previously described, allowing for a thorough assessment of the model’s performance. The algorithms were implemented using MATLAB (R2023b). In order to perform the training and validation of the neural network, the MATLAB function PREPARETS is used, where the time steps are automatically divided into training, validation, and test sets. The training set is used to teach the network, and the training continues as long as the network continues improving on the validation set.
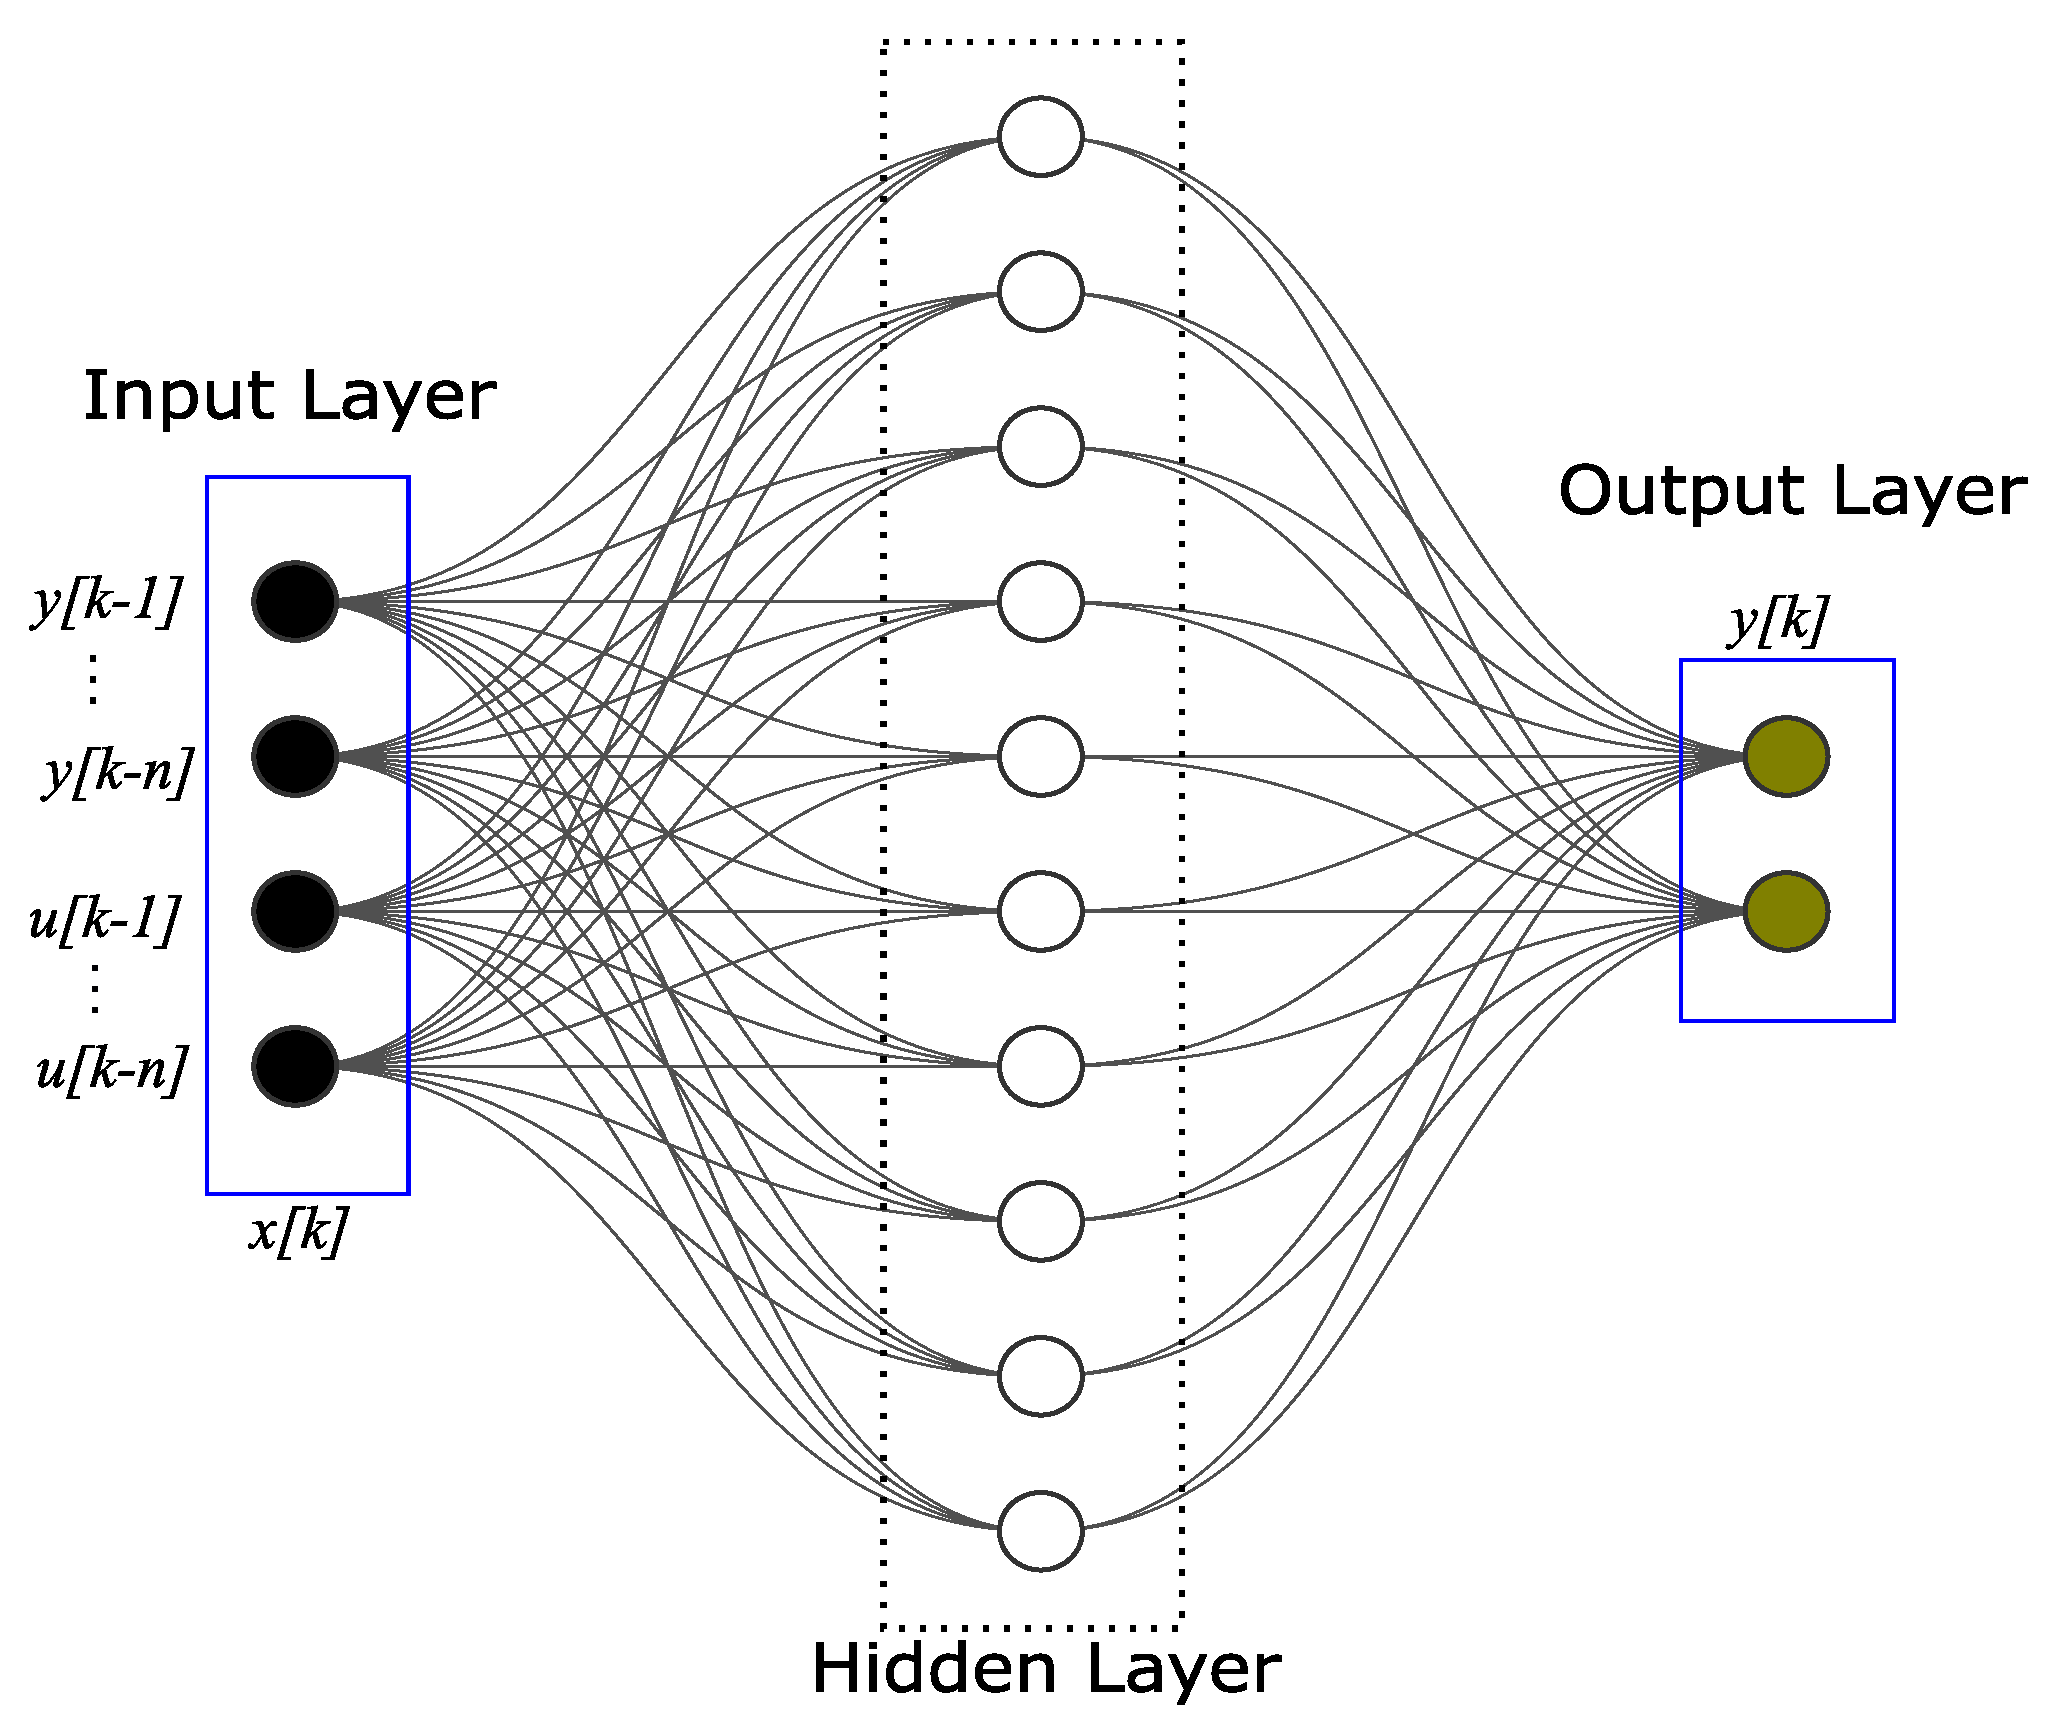
The feedforward network structure for the NARX neural network approach and the LSTM recurrent neural network includes a hidden layer with 10 nodes. The ReLU (rectified linear unit) activation function was selected for the NARX model since this piecewise linear function generates an output directly proportional to the input if it is positive or a value of zero otherwise.
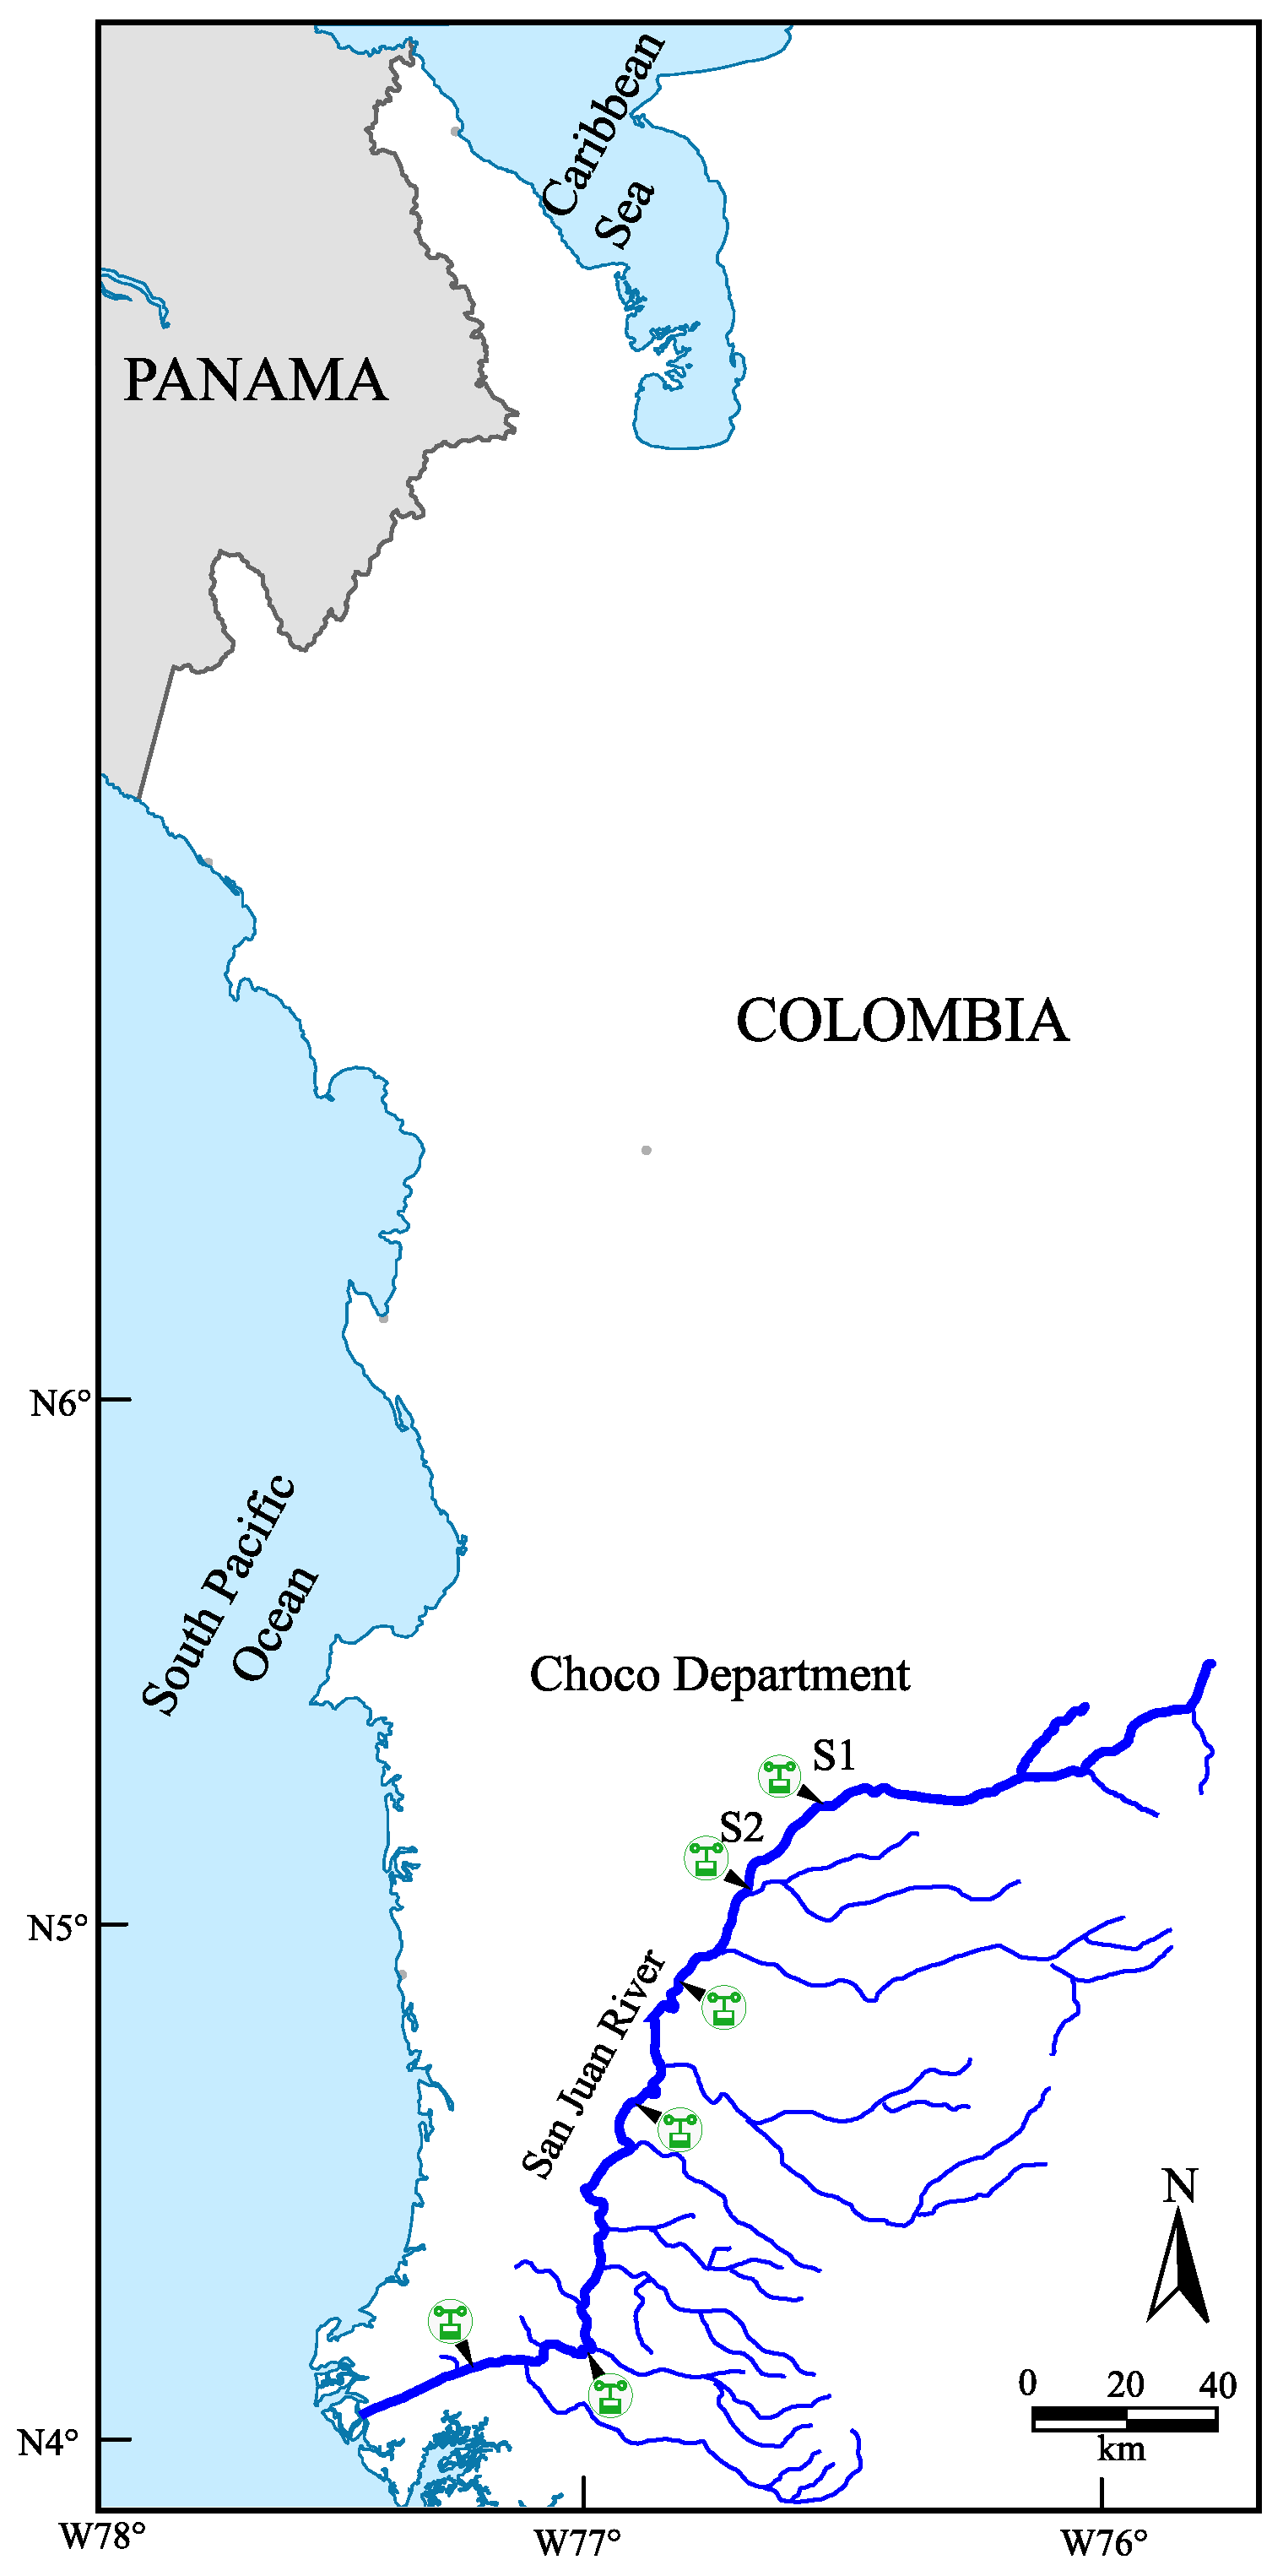
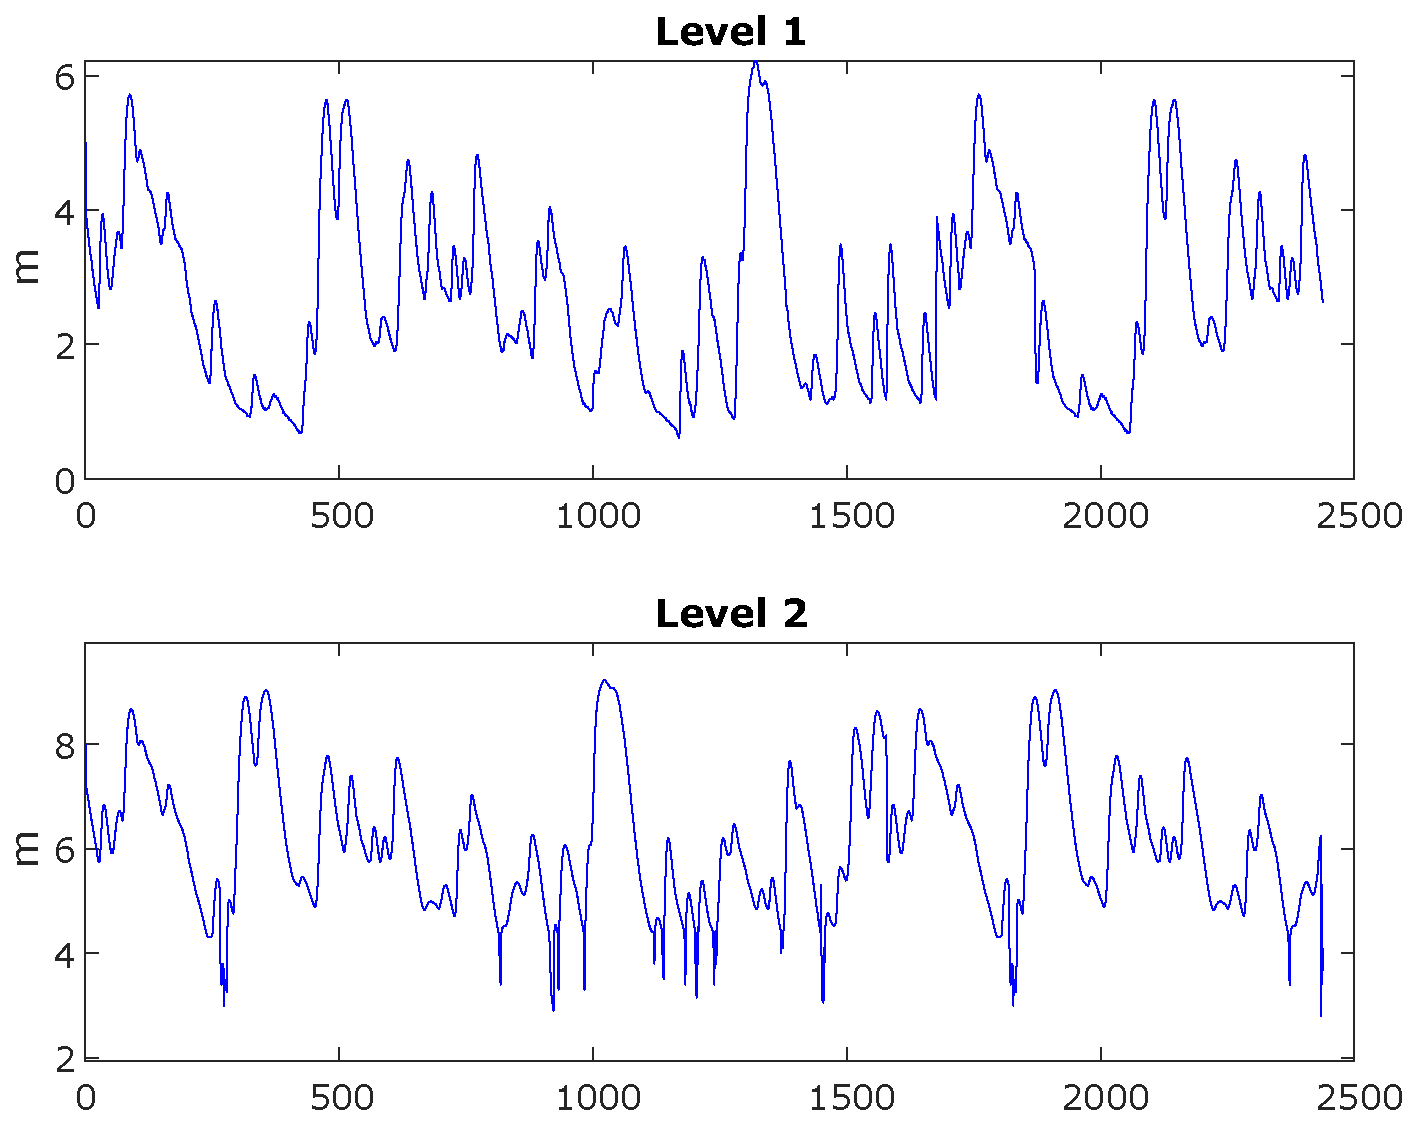
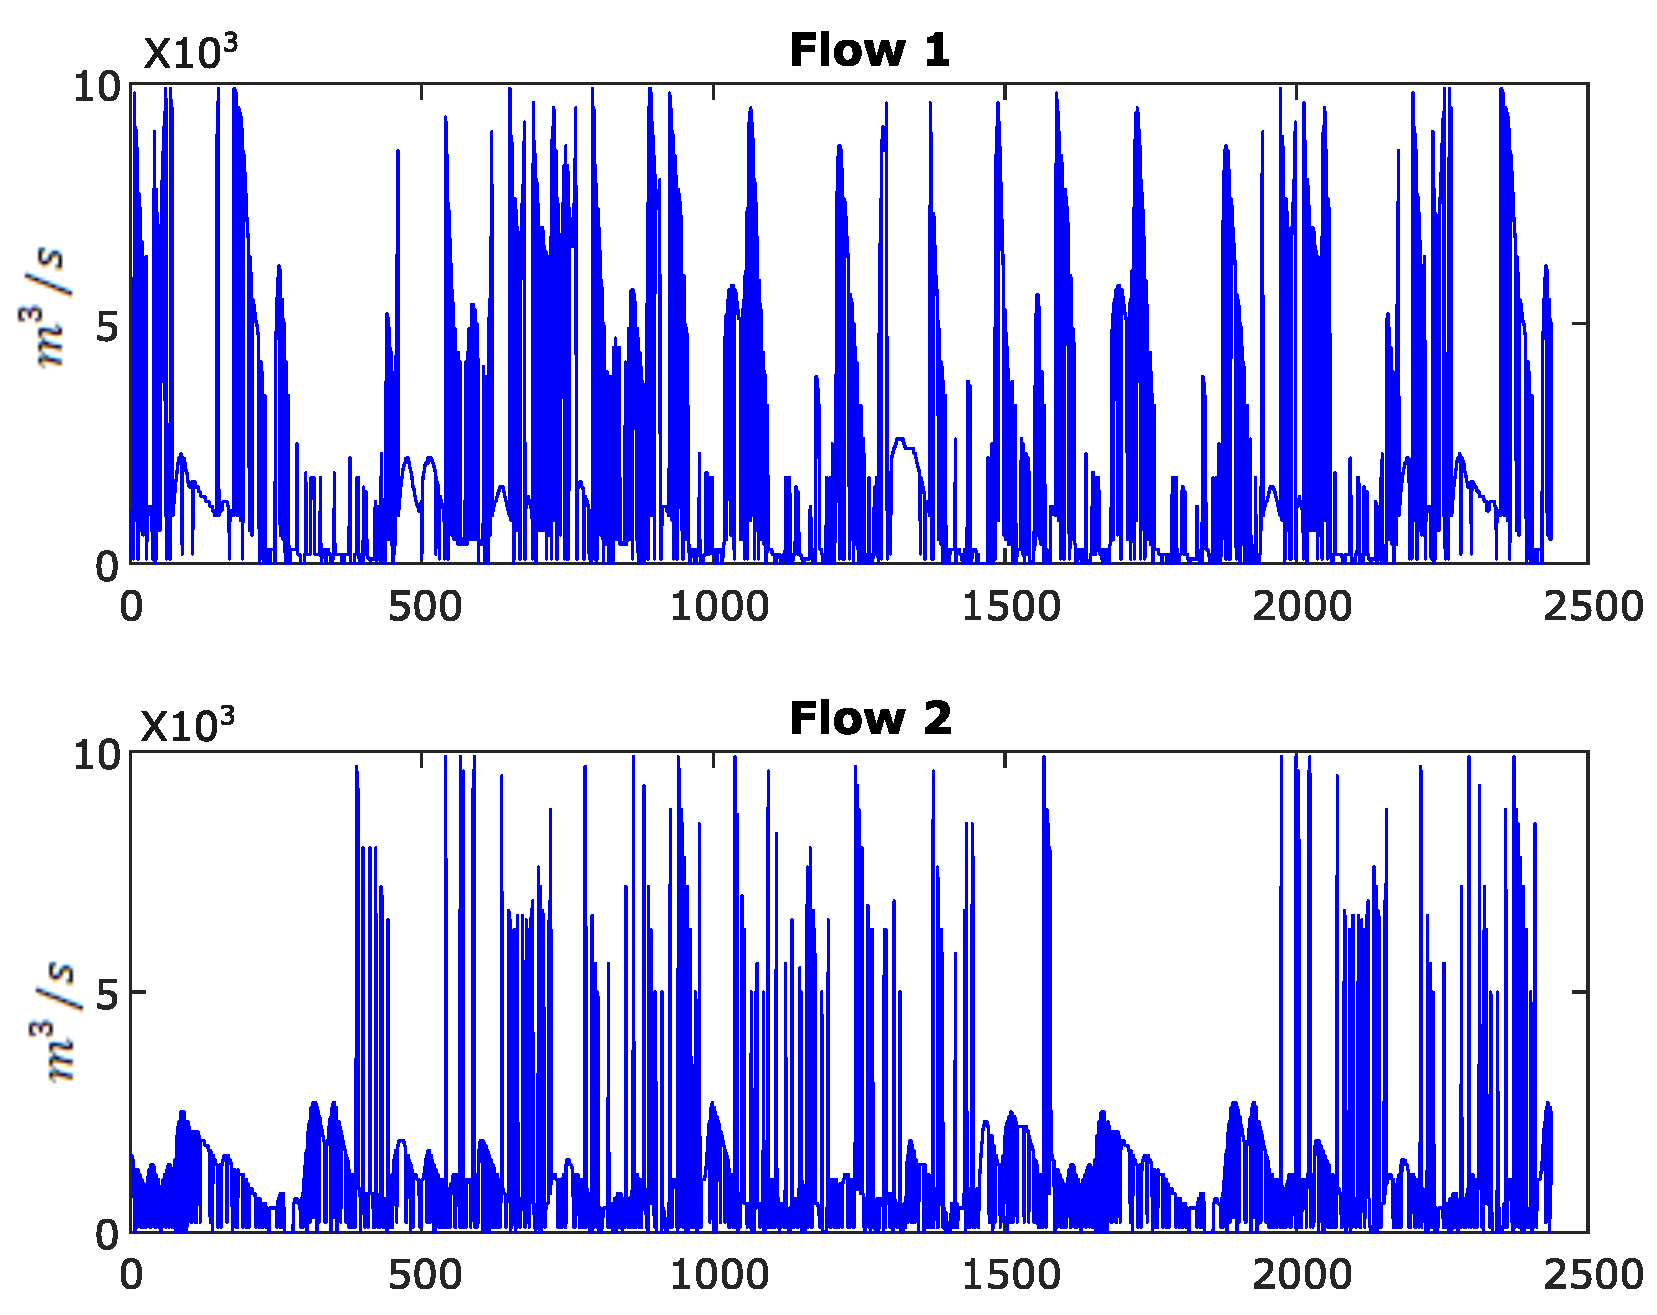
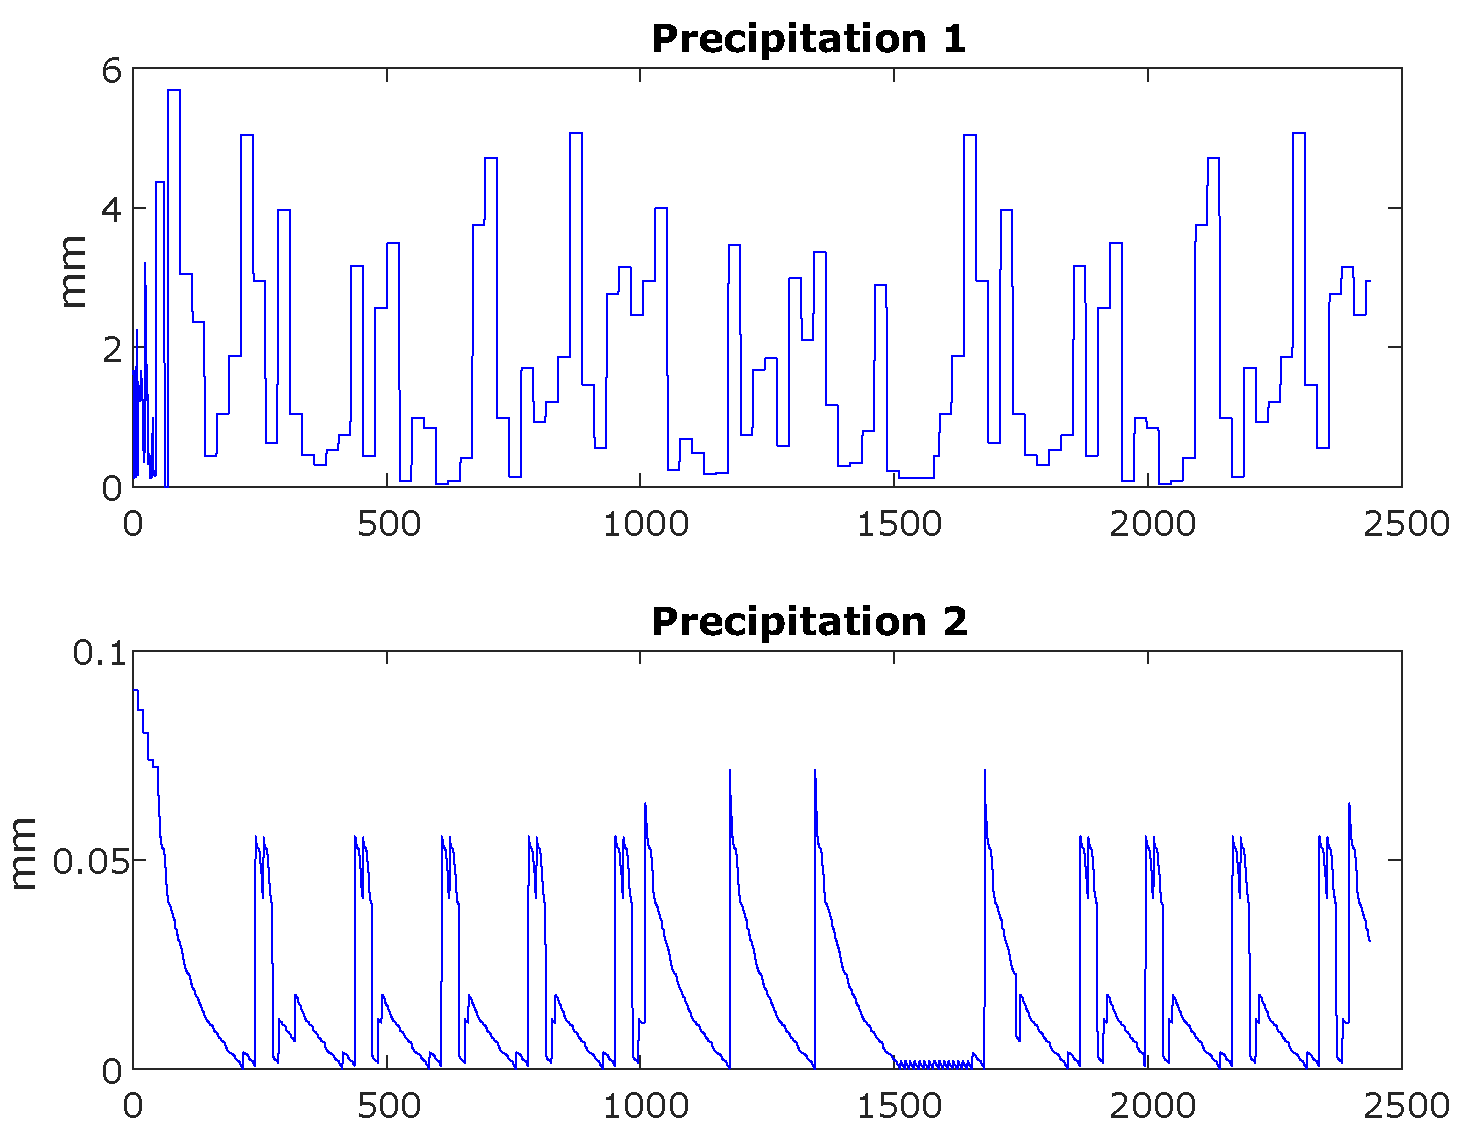
For this study, six activation functions in the input layer, one hidden layer with 10 nodes, and two outputs were considered. A feedforward network and an LSTM recurrent neural network were selected as the framework for the development of the hybrid NARX with Kalman smoothing and LSTM with Kalman smoothing models. Both models were trained off-line, using a dataset composed of 2438 samples corresponding to the three hydrological variables previously mentioned, measured at two hydrological stations located at the San Juan River in the department of Chocó, Colombia. It is worth noting that the real measurements in the dataset were not filtered before the training stage.
This approach allows for capturing the complex dynamics of the time series related to flow, water level, and precipitation. The hybrid models take advantage of the capacity of the smoothed Kalman filter to improve the accuracy of the predictions, integrating temporal information and correcting past estimates, which results in more robust and reliable predictions for flood risk management in the region.
The combined NARX and LSTM model, coupled with the smoothed Kalman filter, is essential for hydrological prediction, as it has the ability to handle external disturbances, such as white noise, which significantly improves the accuracy of the estimates. This approach is ideal for modeling complex phenomena such as river water levels, where environmental conditions and temporal variability play a key role in the evolution of the data. It is worth mentioning that exponential smoothing is configured by using the smoothing parameter of α = 0.8 , and the Savitzky–Golay smoothing filter sets the number of convolution coefficients at m = 1 .

3.5. NARX Neural Network Validation Results

In Figure 6, the validation of the proposed model is presented, showing the results obtained using a histogram that reflects prediction performance. In addition, the best reference value of the mean squared error (MSE) is highlighted, which allows for evaluating the accuracy of the proposed model compared to other approaches. These results confirm the effectiveness of the model in terms of its ability to make accurate predictions. In Figure 6a, a visualization of the distribution of the values of the weights in the neural network is presented. This representation is crucial for identifying possible irregularities or patterns that may be influencing model performance. Analyzing this distribution can provide valuable information about the stability and fit of the model, allowing for adjustments and improvements to optimize the accuracy and efficiency of the predictions. In Figure 6b, we can see that the best model performance response of the neural network model is obtained with the first-order model, with 6 inputs, a hidden layer of 10 nodes, and 2 outputs.
Figure 7 shows a visual representation of how well the model fits the data and the training state of a NARX network. In Figure 7a, the training status of a NARX network is displayed, usually showing graphs that include the evolution of the training error, the validation error, and the test error over the training epochs. In Figure 7b, a comprehensive view of the training process is provided; this is useful for diagnosing problems such as overfitting and inadequate convergence.

3.6. NARX Estimation Results with the Three Kalman Smoothing Techniques: Exponential Smoothing, Savitzky–Golay Smoothing, and Rauch–Tung–Striebel (RTS)

This subsection shows the results of the short-term forecasting using the LSTM model and multivariate NARX for a system of order 1. In addition, the short-term response of the smoothed models proposed in this research and their corresponding quantitative values of the metric regressions already mentioned are examined.
The results of the NARX method for both water level outputs are shown in Figure 8. Specifically, Figure 8a shows the short-term estimation results for the first water level output of the estimated signal with the actual measurements. Similarly, Figure 8b shows the short-term forecast results for the second water level output juxtaposed with the corresponding actual measurements.
The following is the response of the two water level outputs of the hydrological stations located on the San Juan River according to the five Kalman smoothing methods:
The responses in Figure 9 of exponential smoothing show how the smoothed values fit a time series, removing noise and highlighting the underlying trend. The graph shows how the smoothed values follow the general direction of the original data but with fewer fluctuations. Figure 9a shows the response to the first water level output. Figure 9b shows the response for the second water level output with exponential smoothing.
The Savitzky–Golay smoothing filter in Figure 10 for the two outputs shows how the method smoothes the fluctuations of both data series, removing noise and preserving important trends and patterns. This type of plot is useful for observing the evolution of water levels at two measurement points, highlighting underlying variations without distorting peaks or sharp changes that may be relevant to the analysis. Figure 10a shows the response for the first water level output; Figure 10b shows the response for the second water level output with the Savitzky–Golay smoothing filter.
The smoothed Kalman filter with the Rauch–Tung–Striebel (RTS) algorithm for two water level outputs shows how the model estimates compare to the actual measurements over time, allowing its performance to be evaluated at each measurement station. Figure 11 illustrates the filter’s ability to smooth noisy data, providing more stable estimates that adequately reflect water level dynamics. A good fit between the lines of the actual outputs and the estimates suggests that the model is effectively capturing fluctuations and trends in the data, which is essential for decision making in water resource management. In addition, the visual representation facilitates the identification of patterns and changes in water levels, which is useful for forecasting related to floods and droughts. Figure 11a shows the response for the first water level output; Figure 11b shows the response for the second water level output with the smoothed Kalman filter and the Rauch–Tung–Striebel (RTS) algorithm.

3.7. LSTM Estimation Results with the Three Kalman Smoothing Techniques: Exponential Smoothing, Savitzky–Golay Smoothing, and Rauch–Tung–Striebel (RTS)

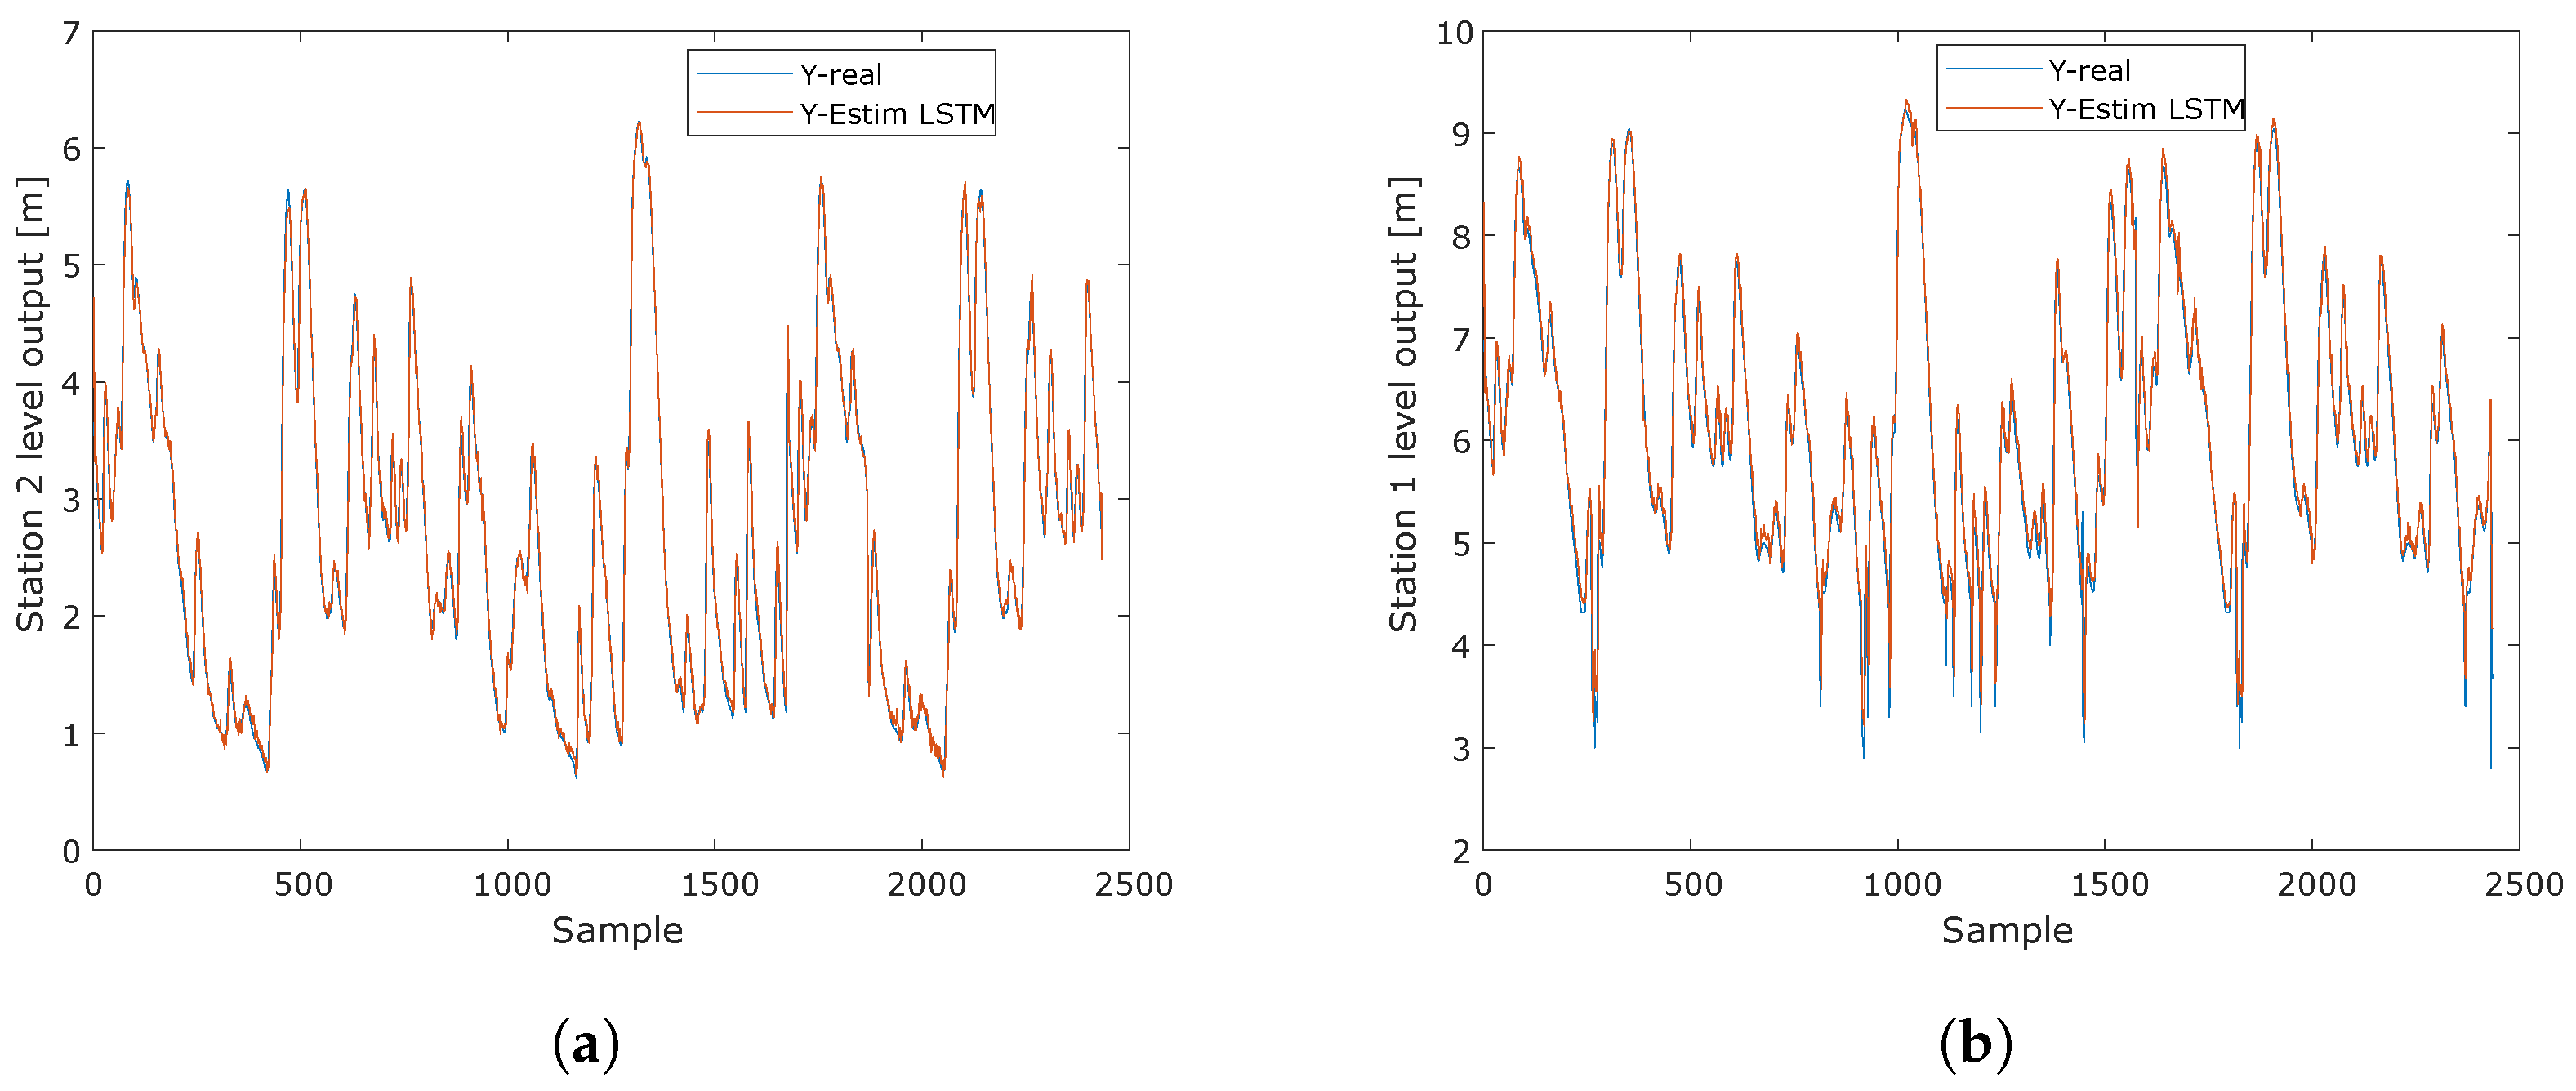
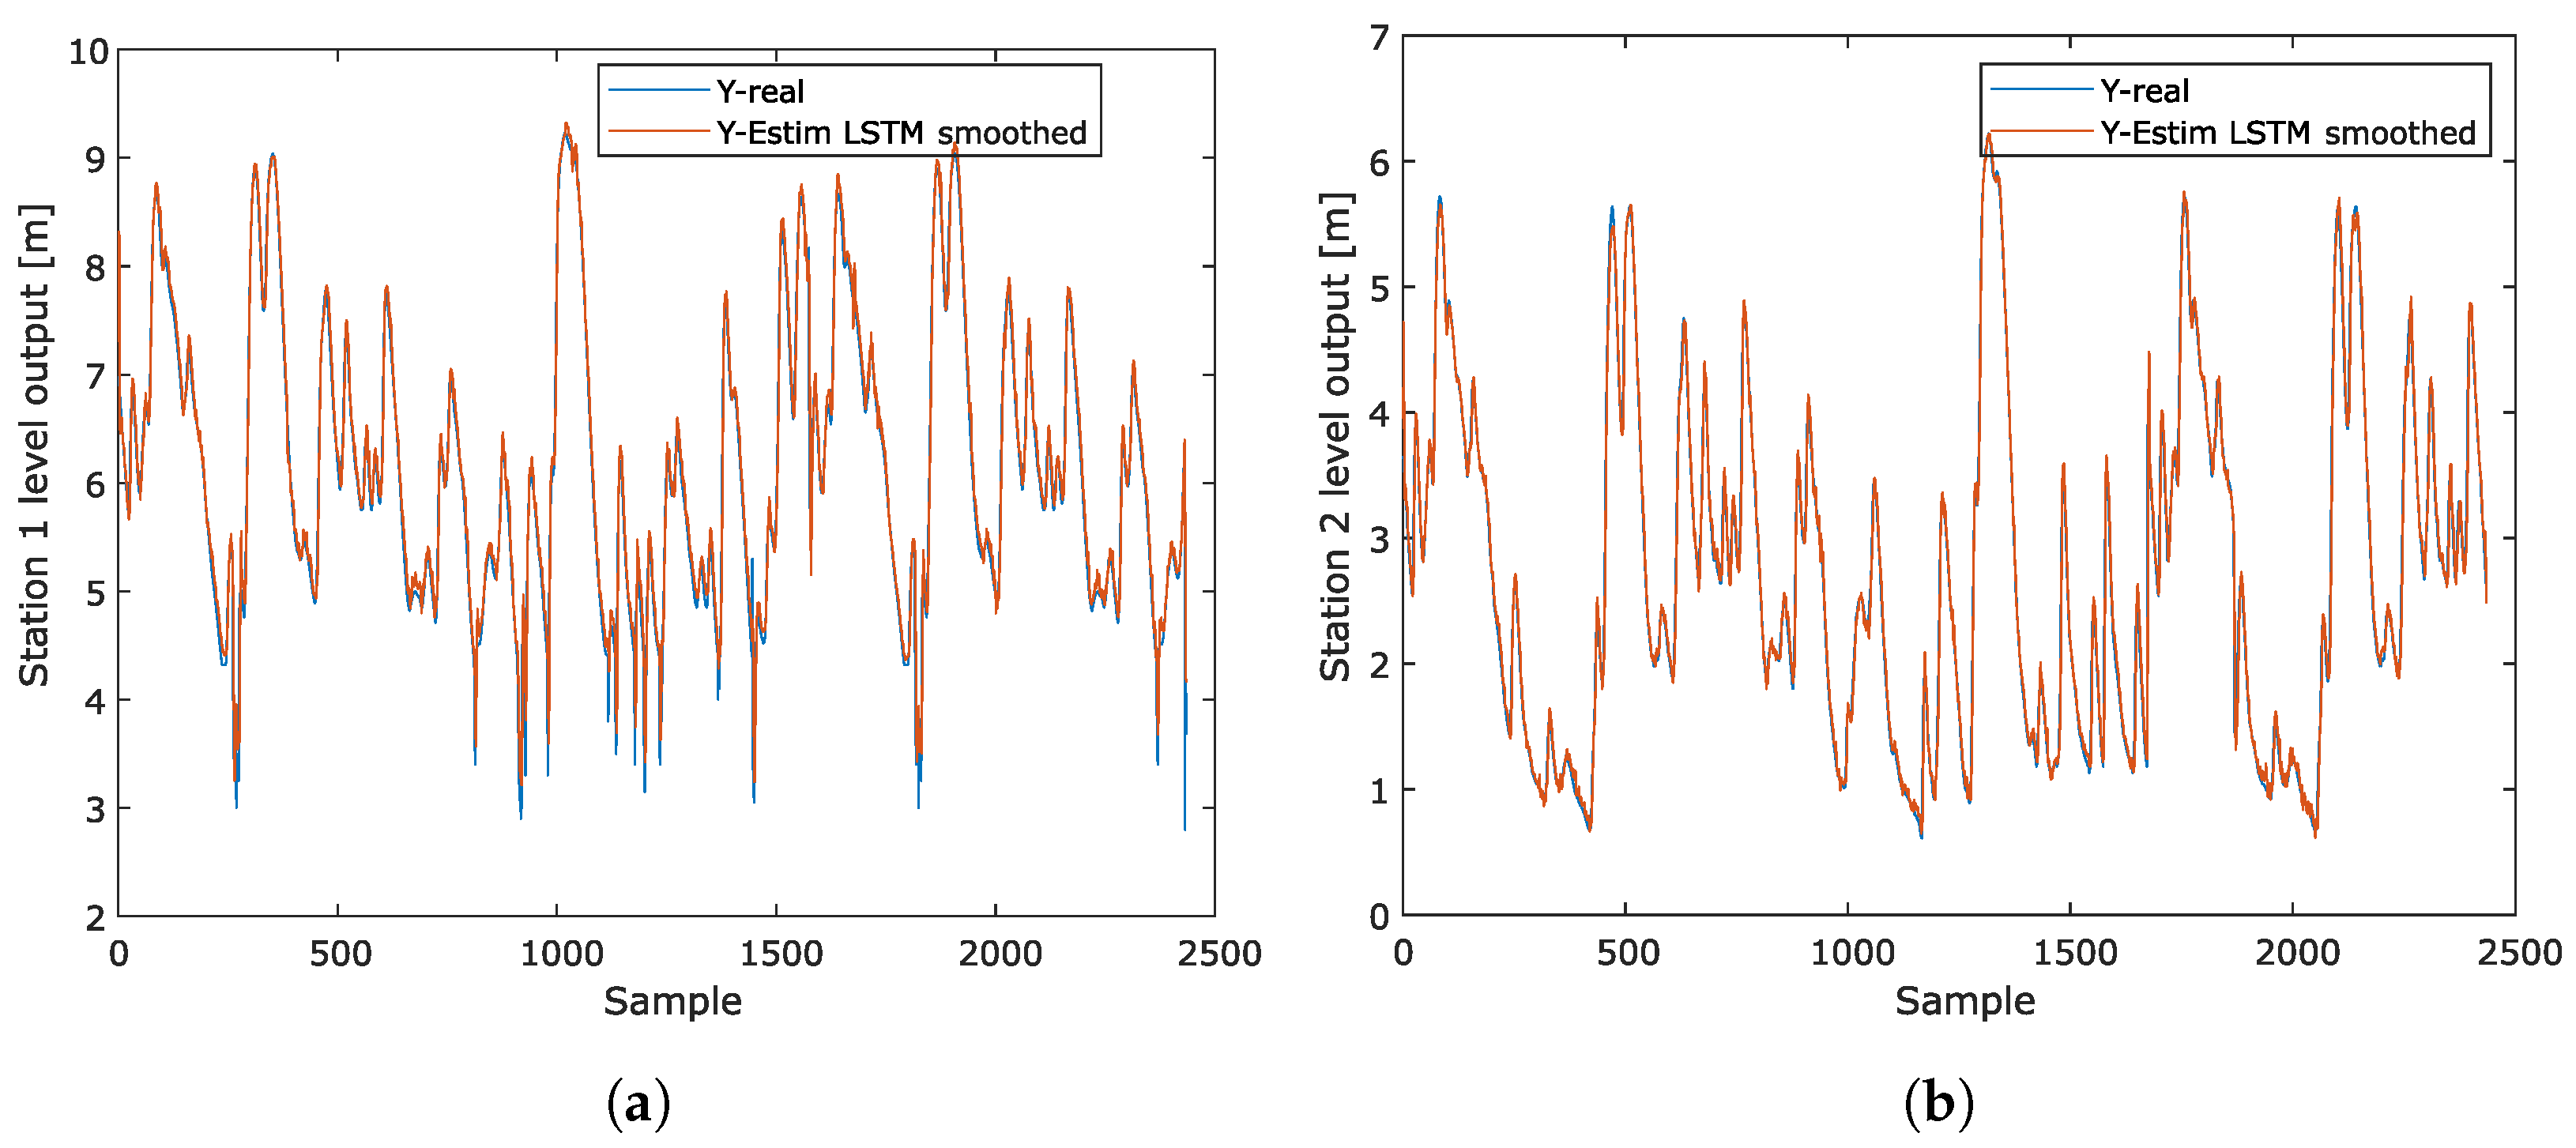
The results obtained for the LSTM model applied to both water level outflows can be seen in Figure 12. Specifically, 
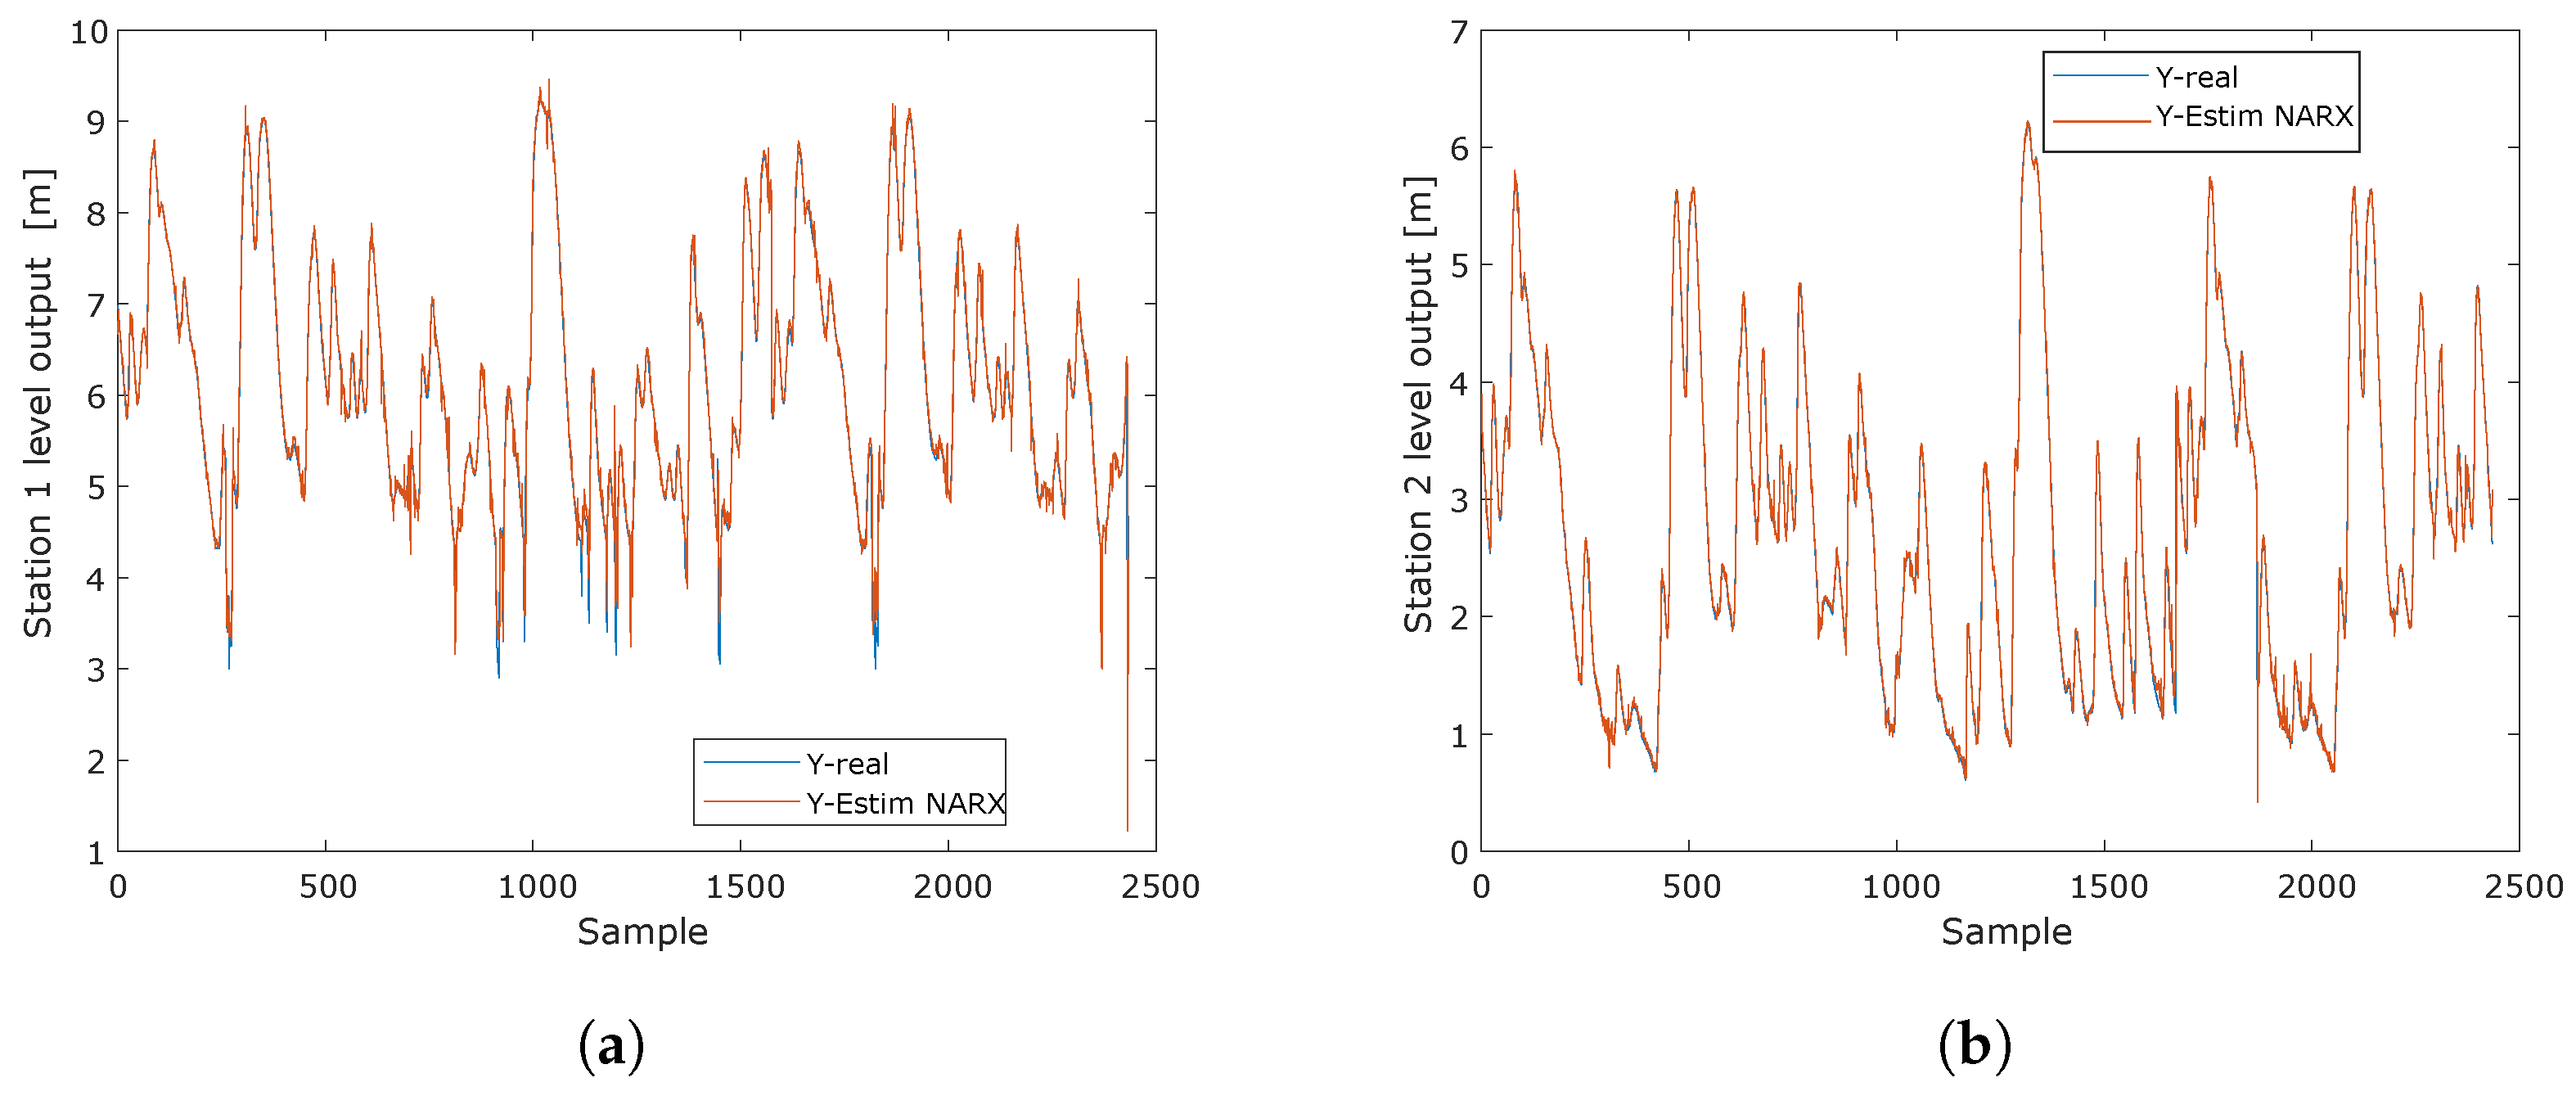
Figure 12a illustrates the short-term estimates for the first water level output, comparing the estimated signal with the actual measurements. Similarly, Figure 12b presents the short-term prediction for the second water level output, together with the corresponding actual measurements, allowing for the accuracy of the model to be evaluated.
This type of comparative analysis allows for a clear visualization of the performance of the LSTM model and its ability to follow the evolution of water levels at both outlets.
The responses shown in Figure 13 using the exponential smoothing method illustrate how the smoothed values fit a time series, helping to reduce noise and reveal the overall underlying trend in the data. This plot highlights the ability of smoothing to follow the general behavior of the data, eliminating short-term fluctuations. In Figure 13a,b, the responses for the first and second water level outputs, respectively, using the exponential smoothing method are presented. The plots reflect how the method captures the main trends at both outlets, conforming to the overall patterns of water level behavior while mitigating the effects of noise.
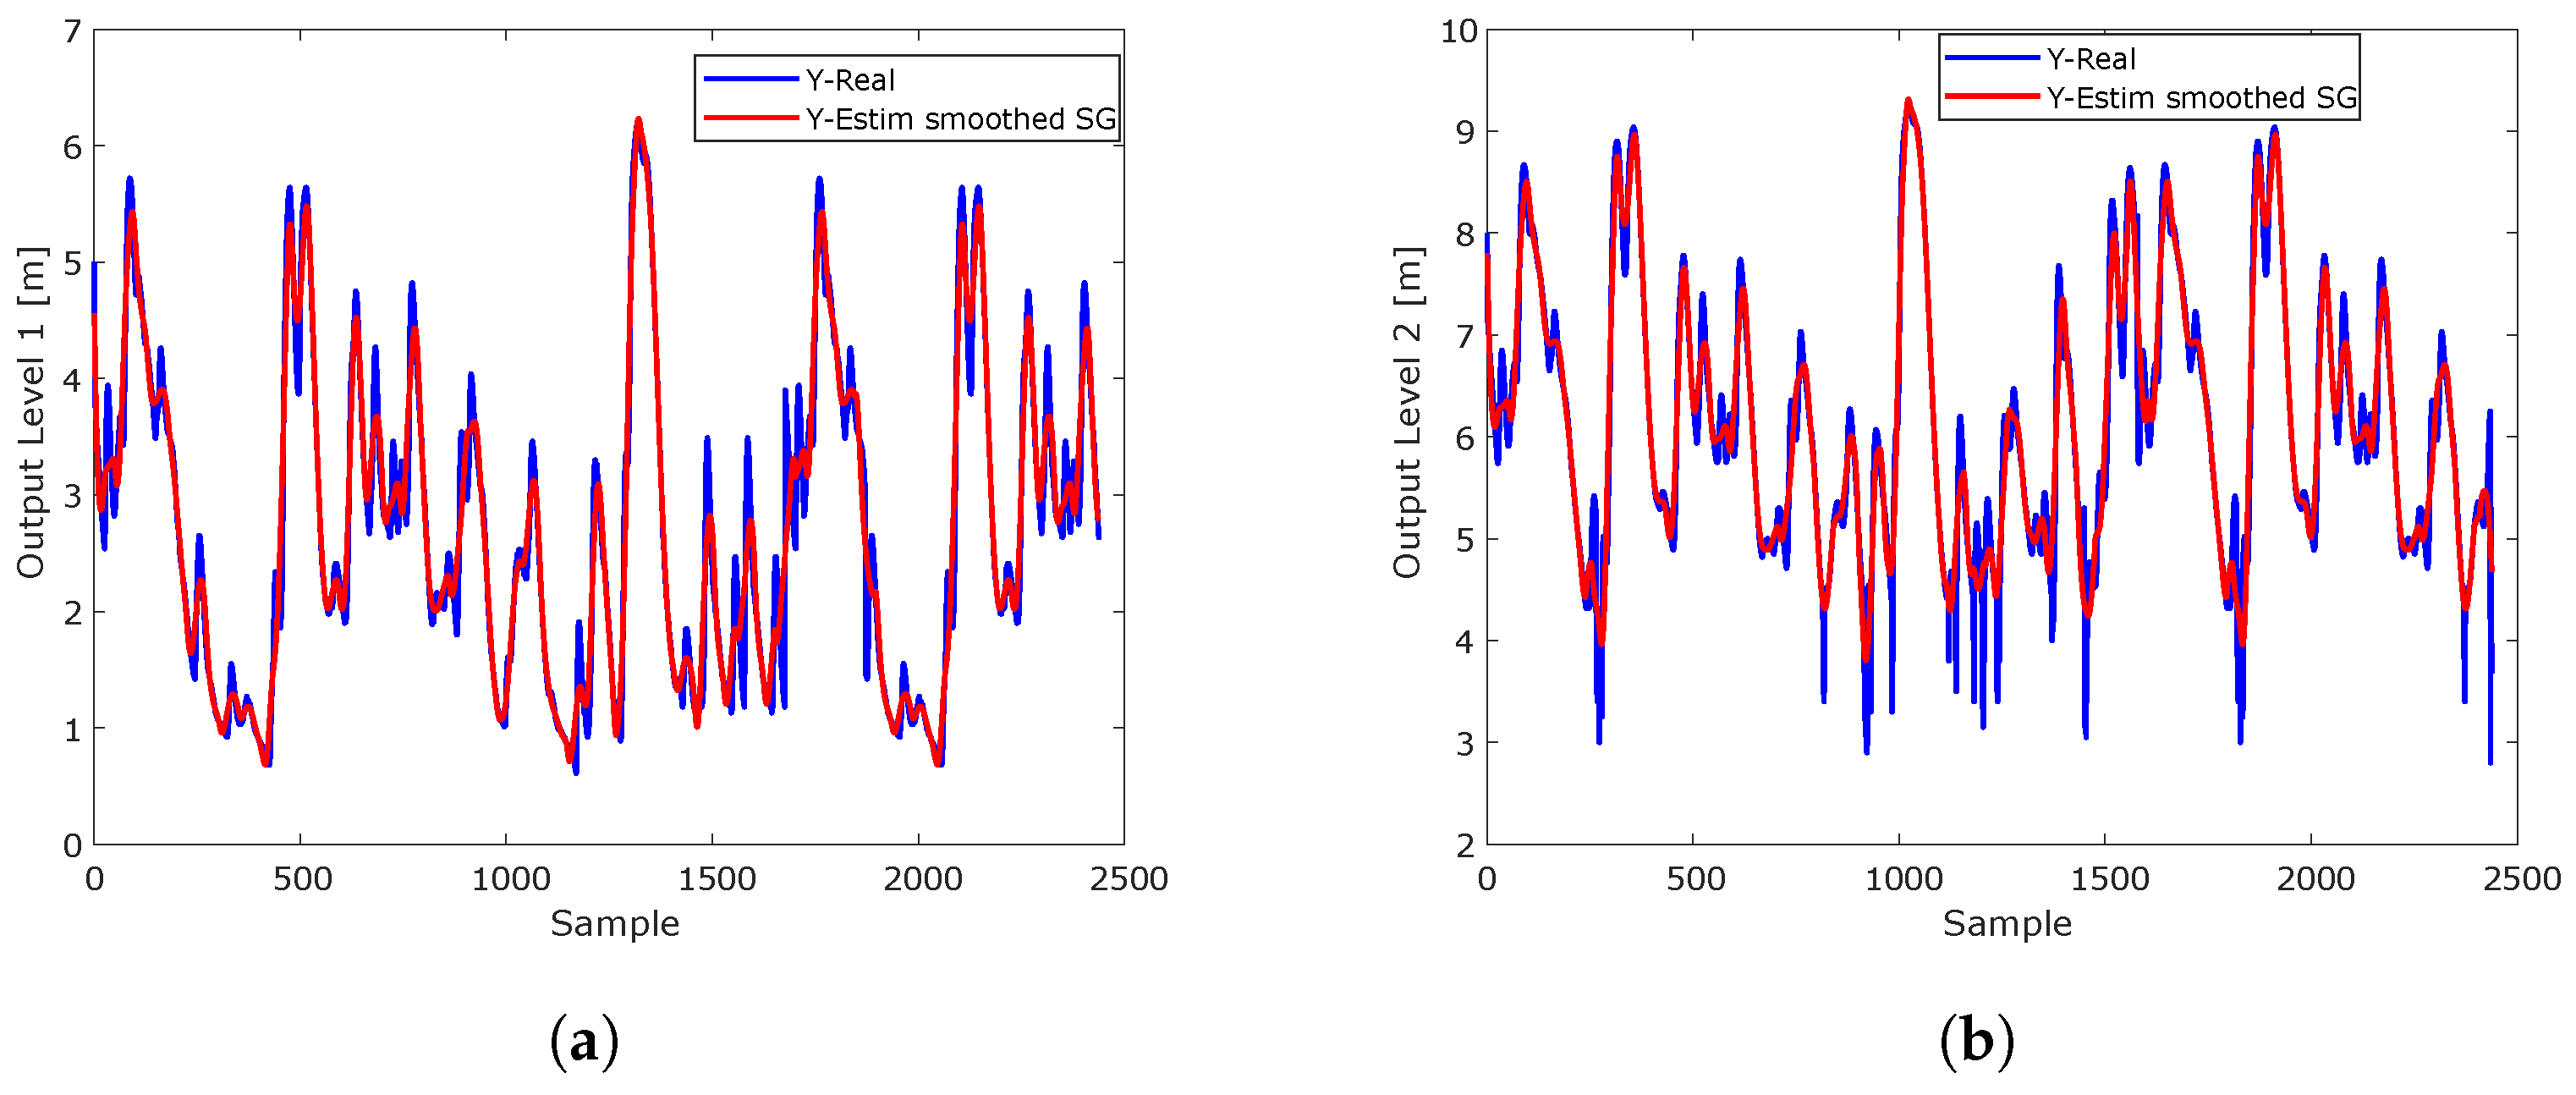
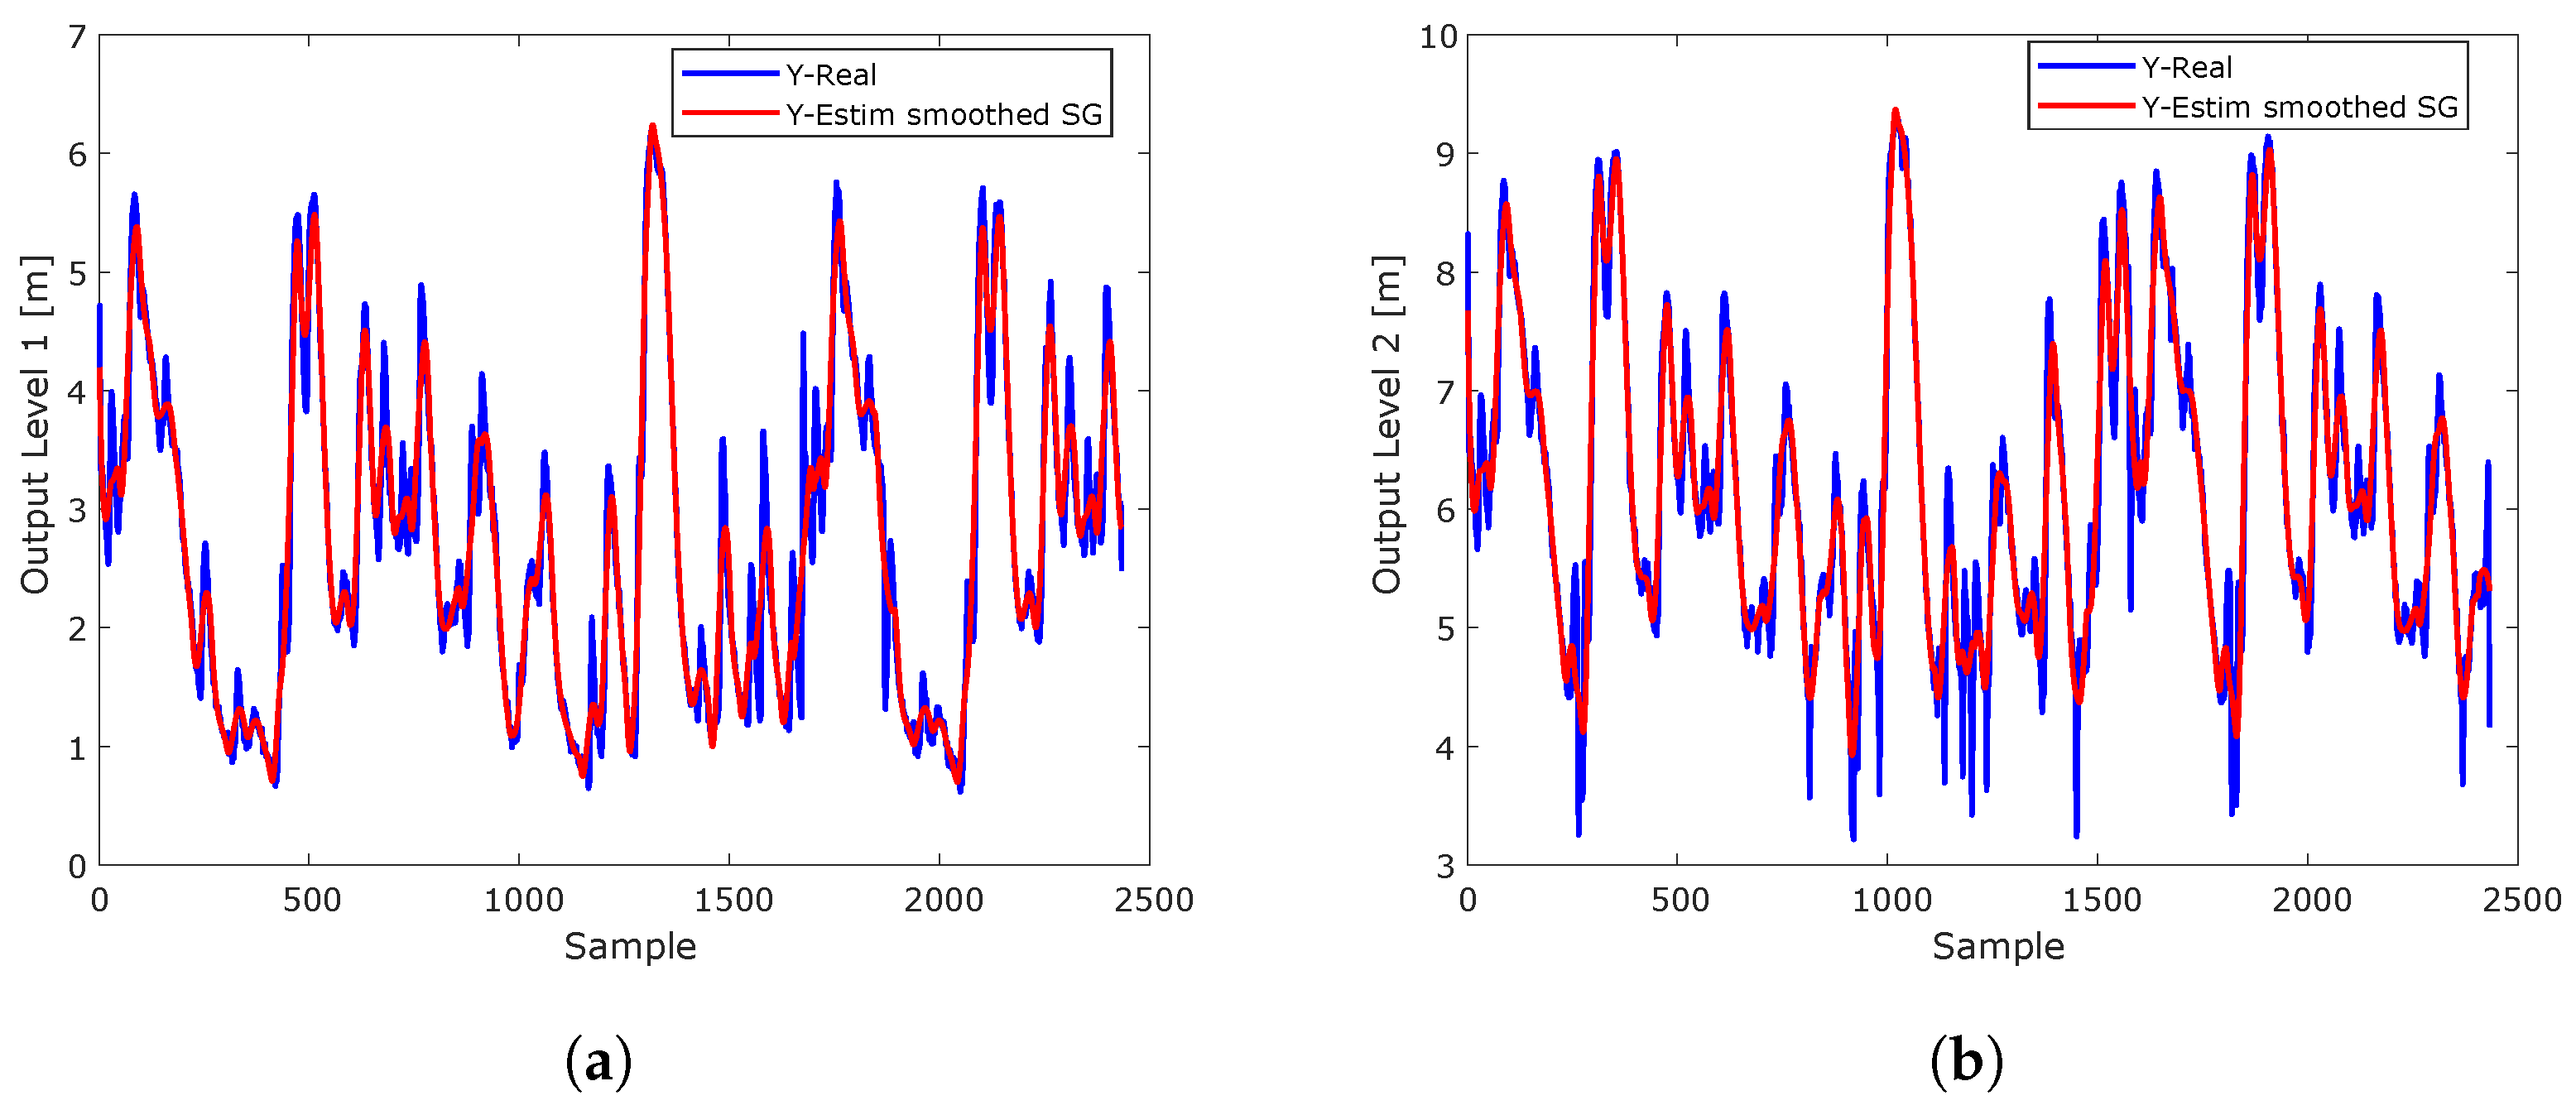
The Savitzky–Golay smoothing filter coupled to an LSTM network for two outputs, as presented in Figure 14, illustrates how the method can reduce noise in the data and improve the accuracy of the LSTM model in predicting water level trends. This approach combines the filter’s ability to preserve relevant patterns with the ability of the LSTM to capture long-term dependencies in time series. In Figure 14a, the first smoothed water level output is shown, and in Figure 14b, the second output is shown, providing a more accurate and robust prediction of water levels.
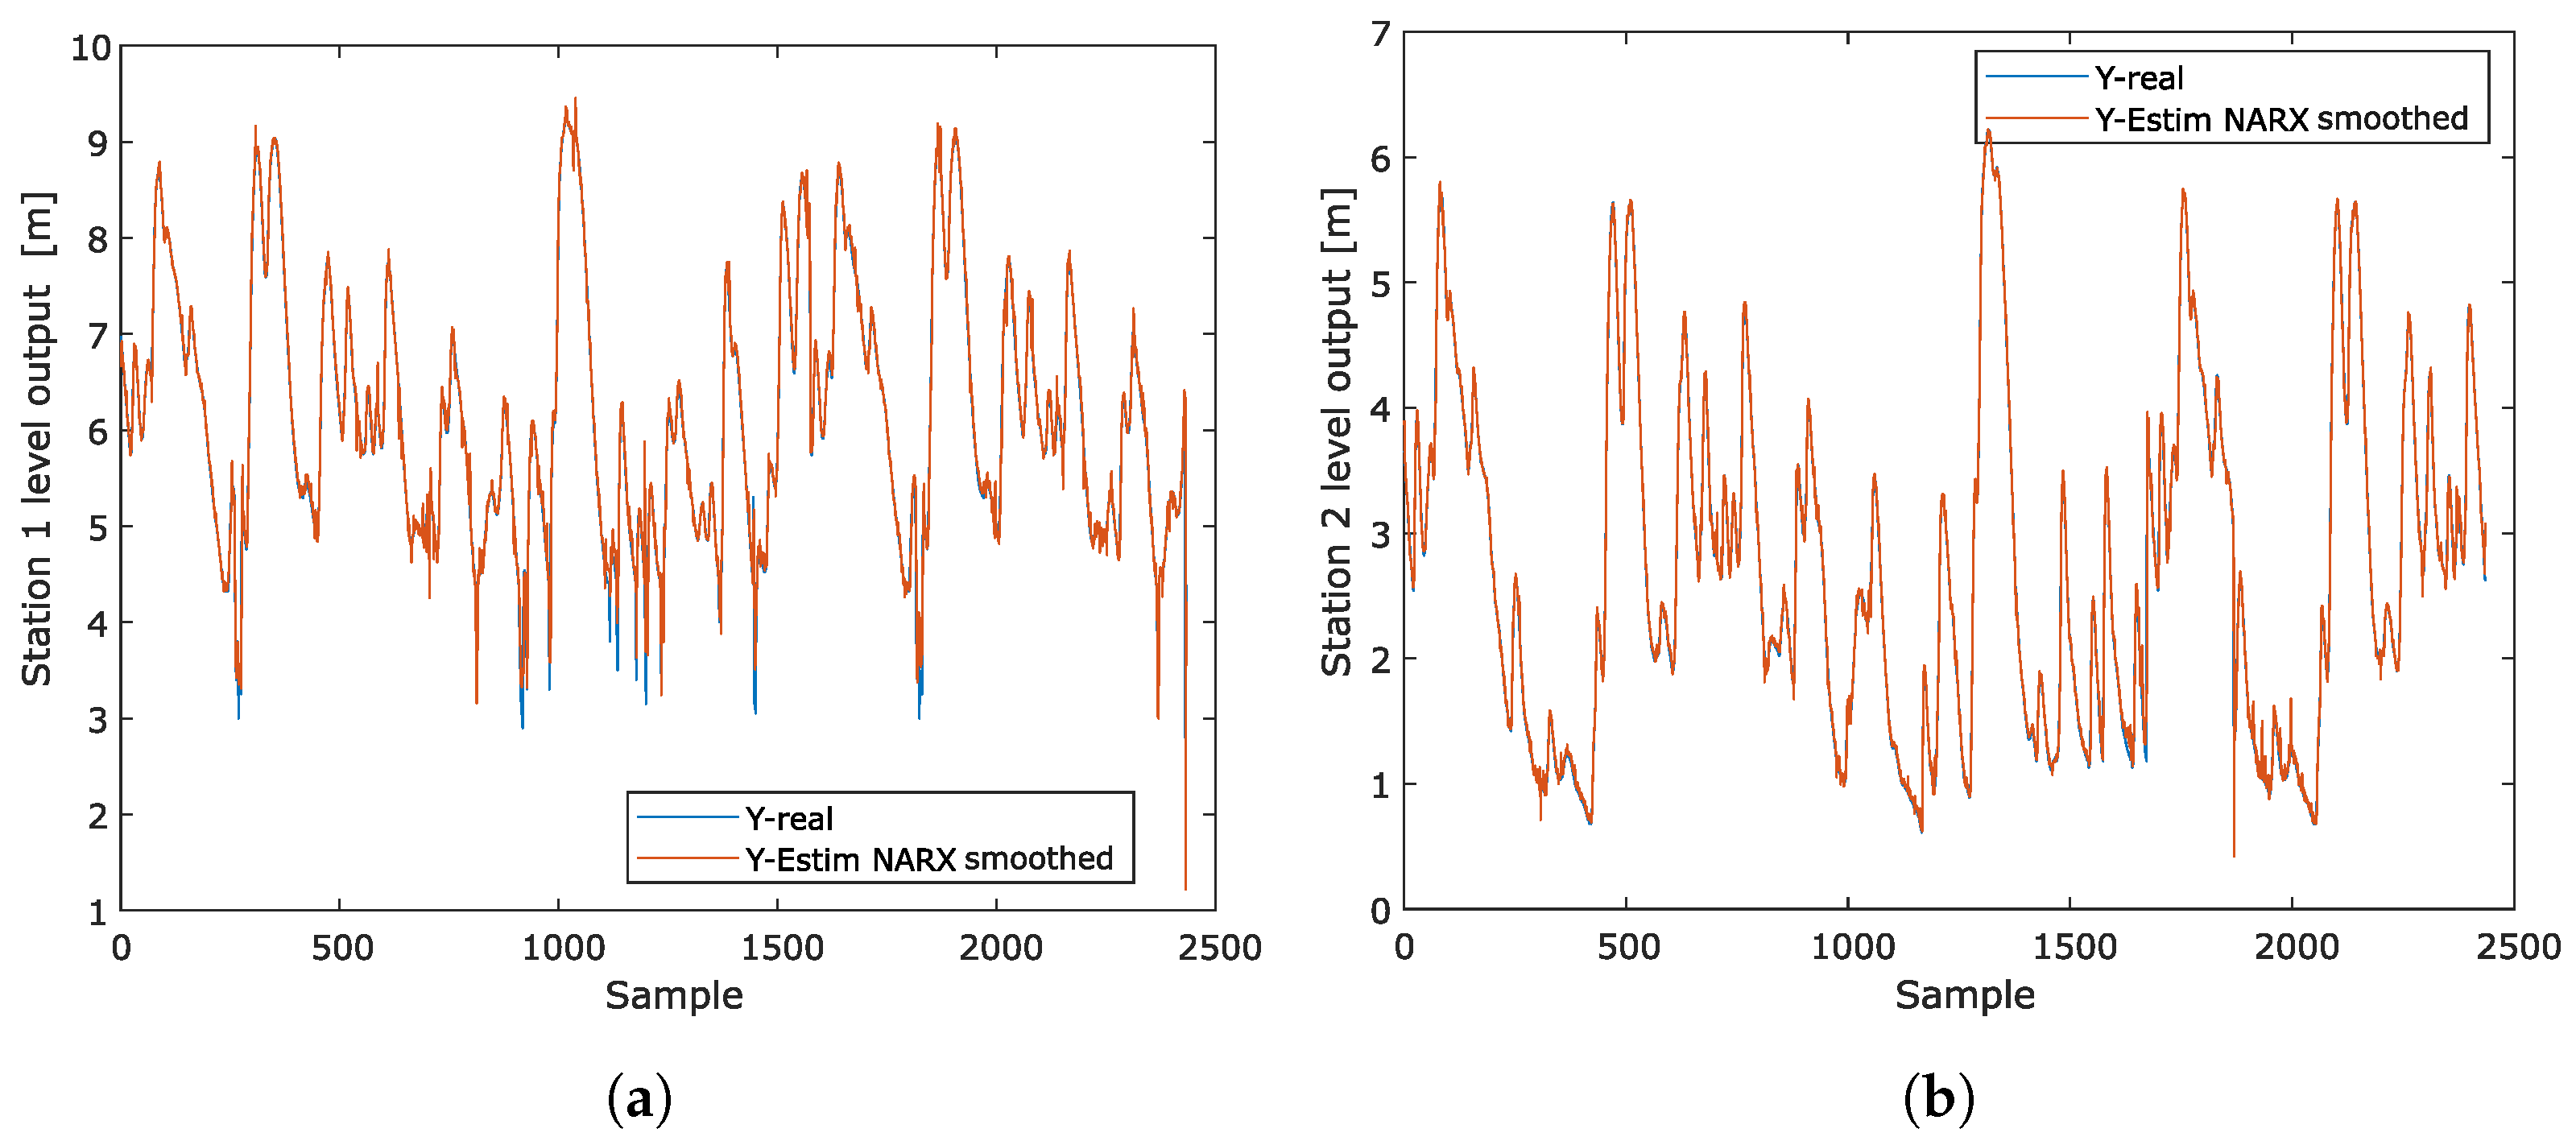
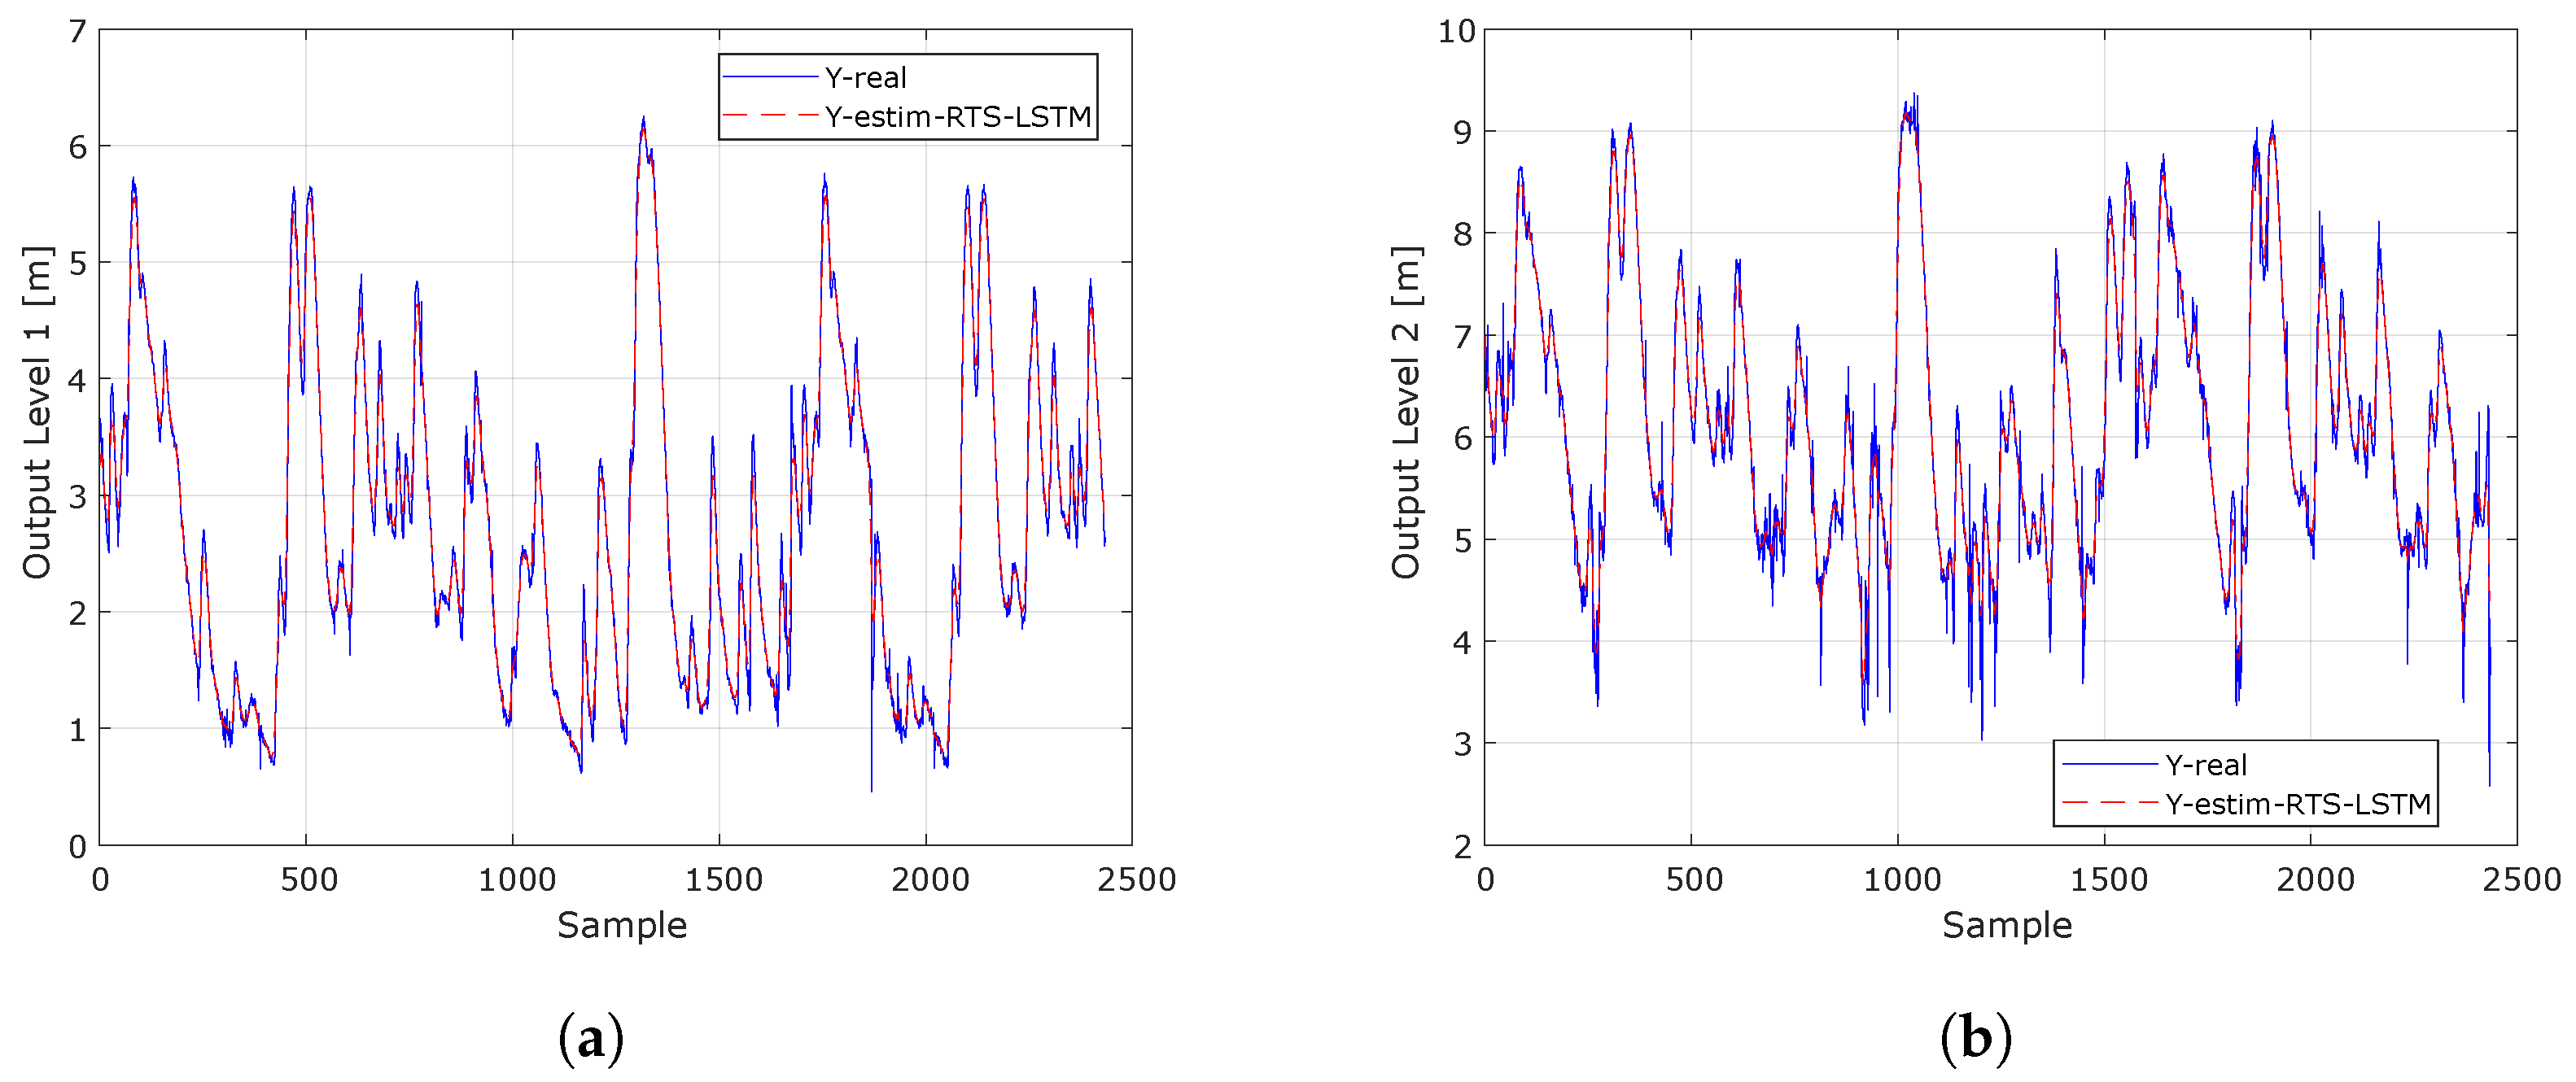
The smoothed Kalman filter using the Rauch–Tung–Striebel (RTS) algorithm applied to two water level outputs allows for observing how the model estimates align with actual measurements over time, facilitating the evaluation of its performance at each monitoring station. Figure 15 illustrates the effectiveness of the filter in reducing noise, resulting in more consistent estimates that accurately reflect water level dynamics. A good fit between the curves of the actual outputs and the estimates indicates that the model is able to adequately capture variations and trends in the data, a crucial aspect for efficient water resource management. In addition, this graphical representation facilitates the detection of patterns and changes in water levels, which is particularly useful for forecasting floods and droughts. Figure 15a shows the response for the first water level output, while Figure 15b shows the response for the second output, using the smoothed Kalman filter with the Rauch–Tung–Striebel (RTS) algorithm.
Table 5 and Table 6 present a quantitative analysis of the four regression metrics used in this research: MSE, KGE, NSE, and MAE. These metrics allow us to evaluate the accuracy of the estimates obtained using the NARX neural network model coupled with three Kalman smoothing techniques. This facilitates the evaluation of the model’s performance and its ability to generate accurate water level predictions.
In the results presented in both tables, the Narx-EXP model (NARX coupled with the exponential smoothing technique) shows the best performance in terms of accuracy and predictive ability for both Output 1 and Output 2. In Output 1, the MSE of Narx-EXP is the lowest (0.0013), with a KGE of 0.9968, an NSE of 0.9961, and an MAE of 0.0123, indicating exceptional performance in predicting water levels. In Output 2, Narx-EXP also outperforms the other models, with an MSE of 0.0078, a KGE of 0.9887, an NSE of 0.9812, and an MAE of 0.0308. This shows that exponential smoothing considerably improves prediction accuracy for both outputs, significantly reducing errors and increasing model efficiency compared to the base Narx model. In comparison, the base Narx model has a much higher MSE at both outputs (0.0062 for Output 1 and 0.0248 for Output 2), with lower KGE and NSE, showing its lower ability to predict water levels accurately.
On the other hand, the Savitzky–Golay (SG) and Rauch–Tung–Striebel (RTS) smoothing techniques also improve the performance of the Narx model, although not as markedly as exponential smoothing. Narx-SG, which uses Savitzky–Golay smoothing, has an MSE of 0.0432 for Output 1 and 0.0199 for Output 2, with the KGE and NSE lower than those of Narx-EXP but still better than those of the base model. The MAE of Narx-SG is also higher compared to Narx-EXP, reaching values of 0.0325 for Output 1 and 0.0623 for Output 2. Finally, Narx-RTS, which uses Rauch–Tung–Striebel smoothing, shows solid performance, especially for Output 1, with an MSE of 0.0135, a KGE of 0.9901, an NSE of 0.9921, and an MAE of 0.0463. For Output 2, its results are also quite good, with an MSE of 0.0123, a KGE of 0.9812, an NSE of 0.9766, and an MAE of 0.0548, placing it as the second best option after Narx-EXP. In summary, Narx-EXP offers the best accuracy and efficiency in water level prediction, while Narx-RTS and Narx-SG improve performance over the base model but do not reach the accuracy levels of Narx-EXP.
When comparing both outputs, it can be seen that, overall, the Narx-EXP model provides the best estimates for both Output 1 and Output 2, with the lowest MSE and MAE values, reflecting its ability to improve the accuracy of the original NARX model by applying exponential Kalman smoothing. Second, Narx-SG provides good results, although it is less effective compared to Narx-EXP. Finally, Narx-RTS provides an improvement in global estimates, but its higher MAE indicates lower accuracy in point predictions, which could limit its usefulness in situations where immediate accuracy is critical.
In Table 7 and Table 8, the quantitative analysis presented in this study evaluates four key regression metrics: MSE, KGE, NSE, and MAE. These metrics are used to measure the accuracy of the predictions generated by the LSTM neural network model coupled with three Kalman smoothing techniques. The purpose is to verify whether the estimates of the model, with four inputs and two outputs for an order 1 system, meet the accuracy standards required by these metrics. This allows for a thorough evaluation of the model’s performance and its ability to generate accurate water level predictions.
In the tables presented, the results for water level prediction using the LSTM (long short-term memory) model coupled with three Kalman smoothing techniques, exponential (EXP), Savitzky–Golay (SG), and Rauch–Tung–Striebel (RTS), can be analyzed. Overall, the LSTM-EXP model shows superior performance compared to the other models for both water level outputs (Output 1 and Output 2). For Output 1, LSTM-EXP has the lowest MSE (0.0072), the highest KGE (0.9882), the highest NSE (0.9721), and the lowest MAE (0.0298), demonstrating a significant improvement in prediction accuracy and efficiency compared to the base LSTM model. In Output 1, the LSTM model presents an MSE of 0.0121, a KGE of 0.9715, an NSE of 0.9642, and an MAE of 0.0584, which, although good, do not reach the accuracy of LSTM-EXP. In Output 2, the performance of LSTM-EXP is also outstanding, with an MSE of 0.0101, a KGE of 0.9864, an NSE of 0.9611, and an MAE of 0.0423. In comparison, the base LSTM model has a much higher MSE (0.0409) and a higher MAE (0.0777), indicating that Kalman smoothing considerably improves model performance.
On the other hand, the LSTM-RTS model, which employs Rauch–Tung–Striebel (RTS) smoothing, also shows good performance, especially in Output 1, where it has an MSE of 0.0257, a KGE of 0.9791, an NSE of 0.9707, and an MAE of 0.0432, which places it in second place in terms of accuracy. For Output 2, LSTM-RTS presents an MSE of 0.0233, a KGE of 0.9625, an NSE of 0.9514, and an MAE of 0.0548, improving significantly compared to the base LSTM model, but it does not reach the levels of LSTM-EXP. The LSTM-SG model, which uses Savitzky–Golay (SG) smoothing, has the worst performance on both outputs, with an MSE of 0.0325 on Output 1 and 0.0387 on Output 2 and a very high MAE (0.3210 on Output 1 and 0.0635 on Output 2). This suggests that this smoothing technique is not as effective as the others in terms of improving the performance of the LSTM model. In summary, EXP smoothing is the best Kalman technique for the LSTM model, showing the most consistent and accurate results in both water level outputs, while LSTM-RTS also improves the base model results, and LSTM-SG offers the worst results in terms of accuracy and error.

3.8. Novelty of the Proposed Model NARX-Smoothed Kalman and LSTM-Smoothed Kalman

The novelty of the proposed model lies in the combination of two advanced prediction techniques: the nonlinear model NARX (neural autoregressive network with exogens) and the LSTM (long short-term memory) network, together with the smoothed Kalman filter, to improve the accuracy of water level prediction in complex hydrological systems. This approach is distinguished by integrating the smoothed Kalman filter, which allows for correcting estimates based on previous and future information, reducing the noise and inaccuracies that are often present in traditional time series prediction models.
The hybrid NARX-Kalman and LSTM-Kalman approach combines the ability of the NARX and LSTM models to capture nonlinear dynamics and complex time dependencies with the ability of the smoothed Kalman filter to optimize estimates over time. This process improves the robustness and reliability of the predictions, which is especially useful in environments with noisy or incomplete hydrological data, as in the case of the San Juan River in Chocó, Colombia. In summary, this integration provides more accurate and adaptive forecasting, which is crucial for flood risk management and real-time decision making.

4. Conclusions

The implementation of the NARX and LSTM hybrid models, coupled with the three Kalman smoothing techniques (exponential, Savitzky–Golay, and Rauch–Tung–Striebel), showed differences in their ability to predict water levels. The LSTM model presented better performance in terms of accuracy, reflected in lower MSE and MAE values and higher KGE and NSE values than the NARX model. Among the smoothing techniques, the exponential Kalman was the most effective in both neural networks, while the Savitzky–Golay filter, although useful for mitigating noise, achieved different accuracy, making it a less robust option in environments with high temporal variability.
For predicting nonlinear hydrologic systems, the LSTM model showed a greater ability to capture complex dynamics, especially when coupled with the exponential Kalman smoothing and RTS techniques. These techniques make it particularly suitable for short-term predictions with higher accuracy. The NARX model, although more straightforward, is still a suitable option when looking for a less complex approach. Overall, the use of neural networks combined with Kalman smoothing techniques significantly improves the quality of predictions, providing a balance between reducing noise and preserving critical water level dynamics. It is worth noting that an order analysis was performed in terms of the estimation error, where a first-order system was selected since the selected hydrological stations are separated by a distance of around 15 km. The model order must be computed again if another hydrological station is selected to consider a delay that corresponds to the river’s physical behavior.
Exponential Kalman was the most effective smoothing technique overall in both the NARX and LSTM models, achieving the best accuracy in both water level outputs. Its ability to respond quickly to signal changes makes it an excellent choice for capturing rapid and small variations in data.
While useful for reducing noise, the Savitzky–Golay (SG) smoothing filter did not perform as robustly as the other techniques. In particular, the NARX-SG model presented the lowest performance among the hybrid models, indicating that more suitable methods may exist in scenarios with high variability or nonlinearity.
Kalman-RTS was shown to be an intermediate method, offering good smoothing capability and prediction accuracy. It is especially effective for capturing more complex fluctuations and providing a smoothed signal that respects the system’s dynamic structure.

Author Contributions

Conceptualization, J.B.R.-M.; Methodology, J.B.R.-M.; Software, J.B.R.-M.; Validation, J.B.R.-M. and E.G.; Formal analysis, E.G.; Writing—original draft, J.B.R.-M.; Writing—review & editing, E.G. All authors have read and agreed to the published version of the manuscript.

Funding

This research received no external funding.

Institutional Review Board Statement

Not applicable.

Informed Consent Statement

Not applicable.

Data Availability Statement

The data presented in this study are available on request from the corresponding author.

Conflicts of Interest

The authors declare no conflicts of interest.

References

  1. Moreno Chaparro, A.M. Cambio Climático y Migración: Preparación Para una Nueva Realidad; Universidad de Barselona: Barselona, Spain, 2020. [Google Scholar]
  2. Mgandu, F.A.; Mkandawile, M.; Rashid, M. Trend analysis and forecasting of water level in mtera dam using exponential smoothing. Int. J. Math. Sci. Comput 2020, 4, 26–34. [Google Scholar]
  3. Hamidon, A.M.; Musa, S. River water level time-series forecasting by using smoothing technique. Recent Trends Civ. Eng. Built Environ. 2022, 3, 1312–1319. [Google Scholar]
  4. Muhamad, N.S.; Mohamed Din, A. Exponential smoothing techniques on time series river water level data. In Proceedings of the Annual Conference on Computer Science and Engineering Technology (AC2SET), Medan, Indonesia, 23 September 2015. [Google Scholar]
  5. Abdurrahman, M.; Irawan, B.; Latuconsina, R. Flood forecasting using holt-winters exponential smoothing method and geographic information system. In Proceedings of the 2017 International Conference on Control, Electronics, Renewable Energy and Communications, Yogyakarta, Indonesia, 26–28 September 2017; pp. 159–163. [Google Scholar]
  6. Bae, I.; Ji, U. Outlier detection and smoothing process for water level data measured by ultrasonic sensor in stream flows. Water 2019, 11, 951. [Google Scholar] [CrossRef]
  7. Wibowo, D.S.; Adytia, D.; Saepudin, D. Prediction of tide level by using holtz-winters exponential smoothing: Case study in cilacap bay. In Proceedings of the 2020 International Conference on Data Science and Its Applications (ICoDSA), Bandung, Indonesia, 5–6 August 2020; pp. 1–5. [Google Scholar]
  8. Imani, M.; You, R.J.; Chung-Yen, K. Accurate Forecasting of the satellite-derived seasonal Caspian sea level anomaly using polynomial interpolation and holt-winters exponential smoothing. Tao: Terr. Atmos. Ocean. Sci. 2013, 24, 521. [Google Scholar] [CrossRef]
  9. Tiu, E.S.K.; Huang, Y.F.; Ng, J.L.; AlDahoul, N.; Ahmed, A.N.; Elshafie, A. An evaluation of various data pre-processing techniques with machine learning models for water level prediction. Nat. Hazards 2022, 110, 121–153. [Google Scholar] [CrossRef]
  10. Li, Y.; Shi, H.; Liu, H. A hybrid model for river water level forecasting: Cases of Xiangjiang River and Yuanjiang River, China. J. Hydrol. 2020, 587, 124934. [Google Scholar] [CrossRef]
  11. Wunsch, A.; Liesch, T.; Broda, S. Forecasting groundwater levels using nonlinear autoregressive networks with exogenous input (NARX). J. Hydrol. 2018, 567, 743–758. [Google Scholar] [CrossRef]
  12. Cruz, F.R.G.; Binag, M.G.; Ga, M.R.G.; Uy, F.A.A. Flood prediction using multi-layer artificial neural network in monitoring system with rain gauge, water level, soil moisture sensors. In Proceedings of the TENCON 2018-2018 IEEE Region 10 Conference, Jeju, Republic of Korea, 28–31 October 2018; pp. 2499–2503. [Google Scholar]
  13. Noymanee, J.; Theeramunkong, T. Flood forecasting with machine learning technique on hydrological modeling. Procedia Comput. Sci. 2019, 156, 377–386. [Google Scholar] [CrossRef]
  14. Renteria-Mena, J.B.; Giraldo, E. Multivariable AR Data Assimilation for Water Level, Flow, and Precipitation Data. IAENG Int. J. Comput. Sci. 2023, 50, 263–273. [Google Scholar]
  15. Renteria-Mena, J.B.; Plaza, D.; Giraldo, E. Multivariate Hydrological Modeling Based on Long Short-Term Memory Networks for Water Level Forecasting. Information 2024, 15, 358. [Google Scholar] [CrossRef]
  16. Renteria-Mena, J.B.; Plaza, D.; Giraldo, E. Comparative Analysis of Nonlinear Methods for Multivariable Water Level Prediction: The Case Study of the Atrato River. J. Electr. Comput. Eng. 2024, 2024, 2894031. [Google Scholar] [CrossRef]
  17. Jabbari, A.; Bae, D.H. Application of Artificial Neural Networks for accuracy enhancements of real-time flood forecasting in the Imjin basin. Water 2018, 10, 1626. [Google Scholar] [CrossRef]
  18. Liu, X.; Ha, M.; Lei, X.; Zhang, Z.; Wang, C. A Hydraulic Prediction Model for an Open-Channel Water Transfer Project. 2024. Available online: https://papers.ssrn.com/sol3/papers.cfm?abstract_id=4759276 (accessed on 21 November 2024).
  19. Mohammed, S.J.; Zubaidi, S.L. Hybridisation of artificial neural network with particle swarm optimisation for water level prediction. Wasit J. Eng. Sci. 2023, 11, 59–70. [Google Scholar] [CrossRef]
  20. Yan, P.; Zhang, Z.; Hou, Q.; Lei, X.; Liu, Y.; Wang, H. A novel IBAS-ELM model for prediction of water levels in front of pumping stations. J. Hydrol. 2023, 616, 128810. [Google Scholar] [CrossRef]
  21. Nguyen, T.H.; Ricci, S.; Piacentini, A.; Fatras, C.; Kettig, P.; Blanchet, G.; Luque, S.P.; Baillarin, S. Assimilation of SAR-derived flood extent observations for improving fluvial flood forecast–A proof-of-concept. In IOP Conference Series: Earth and Environmental Science; IOP Publishing: Bristol, UK, 2023; Volume 1136, p. 012018. [Google Scholar]
  22. Sabzipour, B.; Arsenault, R.; Troin, M.; Martel, J.L.; Brissette, F. Sensitivity analysis of the hyperparameters of an ensemble Kalman filter application on a semi-distributed hydrological model for streamflow forecasting. J. Hydrol. 2023, 626, 130251. [Google Scholar] [CrossRef]
  23. Nguyen, T.H.; Piacentini, A.; Ricci, S.; Cassan, L.; Munier, S.; Bonassies, Q.; Rodriguez-Suquet, R. Remote Sensing Data Assimilation with a Chained Hydrologic-hydraulic Model for Flood Forecasting. arXiv 2024, arXiv:2405.00567. [Google Scholar]
  24. Sahoo, A.; Samantaray, S.; Ghose, D.K. Prediction of flood in Barak River using hybrid machine learning approaches: A case study. J. Geol. Soc. India 2021, 97, 186–198. [Google Scholar] [CrossRef]
  25. Sahoo, A.; Samantaray, S.; Ghose, D.K. Multilayer perceptron and support vector machine trained with grey wolf optimiser for predicting floods in Barak river, India. J. Earth Syst. Sci. 2022, 131, 85. [Google Scholar] [CrossRef]
  26. Samantaray, S.; Sahoo, A.; Ghose, D.K. Watershed Management and Applications of AI; CRC Press: Boca Raton, FL, USA, 2021. [Google Scholar]
  27. Kong, L.; Li, Y.; Yuan, S.; Li, J.; Tang, H.; Yang, Q.; Fu, X. Research on water level forecasting and hydraulic parameter calibration in the 1D open channel hydrodynamic model using data assimilation. J. Hydrol. 2023, 625, 129997. [Google Scholar] [CrossRef]
  28. Zhou, Y.; Guo, S.; Xu, C.Y.; Chang, F.J.; Yin, J. Improving the reliability of probabilistic multi-step-ahead flood forecasting by fusing unscented Kalman filter with recurrent neural network. Water 2020, 12, 578. [Google Scholar] [CrossRef]
  29. Chen, Y.; Cao, F.; Meng, X.; Cheng, W. Water Level Simulation in River Network by Data Assimilation Using Ensemble Kalman Filter. Appl. Sci. 2023, 13, 3043. [Google Scholar] [CrossRef]
  30. Ziliani, M.G.; Ghostine, R.; Ait-El-Fquih, B.; McCabe, M.F.; Hoteit, I. Enhanced flood forecasting through ensemble data assimilation and joint state-parameter estimation. J. Hydrol. 2019, 577, 123924. [Google Scholar] [CrossRef]
  31. Zhong, C.; Guo, T.; Jiang, Z.; Liu, X.; Chu, X. A hybrid model for water level forecasting: A case study of wuhan station. In Proceedings of the 2017 4th International Conference on Transportation Information and Safety (ICTIS), Banff, AB, Canada, 8–10 August 2017; pp. 247–251. [Google Scholar]
  32. Zhong, C.; Jiang, Z.; Chu, X.; Guo, T.; Wen, Q. Water level forecasting using a hybrid algorithm of artificial neural networks and local Kalman filtering. Proc. Inst. Mech. Eng. Part J. Eng. Marit. Environ. 2019, 233, 174–185. [Google Scholar] [CrossRef]
  33. Sun, Y.; Bao, W.; Valk, K.; Brauer, C.; Sumihar, J.; Weerts, A. Improving forecast skill of lowland hydrological models using ensemble Kalman filter and unscented Kalman filter. Water Resour. Res. 2020, 56, e2020WR027468. [Google Scholar] [CrossRef]
  34. Wang, K.; Hu, T.; Zhang, P.; Huang, W.; Mao, J.; Xu, Y.; Shi, Y. Improving Lake Level Prediction by Embedding Support Vector Regression in a Data Assimilation Framework. Water 2022, 14, 3718. [Google Scholar] [CrossRef]
  35. Elkharbotly, M.R.; Seddik, M.; Khalifa, A. Toward sustainable water: Prediction of non-revenue water via artificial neural network and multiple linear regression modelling approach in Egypt. Ain Shams Eng. J. 2022, 13, 101673. [Google Scholar] [CrossRef]
  36. Samantaray, S.; Sahoo, A.; Agnihotri, A. Prediction of flood discharge using hybrid PSO-SVM algorithm in Barak River Basin. MethodsX 2023, 10, 102060. [Google Scholar] [CrossRef]
  37. Tao, H.; Abba, S.I.; Al-Areeq, A.M.; Tangang, F.; Samantaray, S.; Sahoo, A.; Siqueira, H.V.; Maroufpoor, S.; Demir, V.; Bokde, N.D.; et al. Hybridized artificial intelligence models with nature-inspired algorithms for river flow modeling: A comprehensive review, assessment, and possible future research directions. Eng. Appl. Artif. Intell. 2024, 129, 107559. [Google Scholar] [CrossRef]
  38. Restrepo, J.; Kjerfve, B. Water Discharge and Sediment Load from the Western Slopes of the Colombian Andes with Focus on Rio San Juan. J. Geol. 2000, 108, 17–33. [Google Scholar] [CrossRef]
  39. Simon, D. Optimal State Estimation: Kalman, H Infinity, and Nonlinear Approaches; John Wiley & Sons: Hoboke, NJ, USA, 2006. [Google Scholar]
Figure 1. Geographical location of the San Juan River and the hydrological stations.
Information 15 00754 g001
Figure 2. NARX-based neural network structure.
Information 15 00754 g002
Figure 3. Measurements of the level data samples at the two hydrological stations.
Information 15 00754 g003
Figure 4. Measurements of the flow data samples at the two hydrological stations.
Information 15 00754 g004
Figure 5. Measurements of the precipitation data samples at the two hydrological stations.
Information 15 00754 g005
Figure 6. NARX-EnKF model validation: (a) NARX-EnKF Feedforward model response; (b) NARXEnKF model performance response.
Information 15 00754 g006
Figure 7. NARX-EnKF model validation: (a) NARX-EnKF visual representation of the model fitted to the data; (b) NARX-EnKF response train state.
Information 15 00754 g007
Figure 8. Short-term estimation response of the two water level outputs of the NARX model for the hydrological stations. Y-Real corresponds to the real data of the study sample, and Y-Estim NARX corresponds to the estimation of this real data by the NARX model. (a) Short-term estimation of the water level at Tadó at hydrological station 1 using a NARX model. (b) Short-term estimation of the water level at Santa Rita Iró at hydrological station 2 using a NARX model.
Information 15 00754 g008
Figure 9. The exponential smoothing method applied to two water level outputs shows how the predicted values of both outputs are smoothed and adjusted. In this case, the plot presents the observed water level variations together with their corresponding smoothed values, eliminating minor fluctuations or noise. This allows for the clear visualization of the overall water level trend at both outlets, facilitating the prediction and analysis of patterns over time, which is useful for identifying potential flooding or significant changes in levels. (a) Short-term estimation of the water level at Tadó at hydrological station 1 using a NARX model with the exponential Kalman smoothing technique. (b) Short-term estimation of the water level at Santa Rita Iró at hydrological station 2 using a NARX model with the exponential Kalman smoothing technique.
Information 15 00754 g009
Figure 10. The Savitzky–Golay smoothing filter (applied to two water level outputs) shows how the predicted values of both outputs are smoothed and adjusted. This case indicates how the filter reduces noise in both time series without significantly altering key features such as peaks or abrupt transitions. The smoothed lines allow for the underlying trends to be identified more clearly, making it easier to detect important patterns and behaviors, such as gradual changes or sharp increases in water level. This approach is especially useful when you need to analyze the evolution of data with natural fluctuations, but these are affected by noise. (a) Short-term estimation of the water level at Tadó at hydrological station 1 using a NARX model with the Savitzky–Golay smoothing filter technique. (b) Short-term estimation of the water level at Santa Rita Iró at hydrological station 2 using a NARX model with the Savitzky–Golay smoothing filter technique.
Information 15 00754 g010
Figure 11. The smoothed Kalman filter using the Rauch–Tung–Striebel (RTS) algorithm for the two water level outputs provides a clear view of the effectiveness of the model by comparing the estimates to the actual measurements over time. By observing how the estimation curves align with the actual values, the ability of the filter to capture the fluctuations and noise present in the data can be assessed. A close match between the estimates and measurements indicates that the model is achieving an accurate prediction, which is crucial for anticipating changes in water levels. This type of visualization not only allows for an analysis of system performance but is also essential for identifying patterns and making informed decisions in water resource management, especially in situations of flood risk. (a) Short-term estimation of the water level at Tadó at hydrological station 1 using a NARX model with the Rauch–Tung–Striebel (RTS) smoothing filter technique. (b) Short-term estimation of the water level at Santa Rita Iró at hydrological station 2 using a NARX model with the Rauch–Tung–Striebel (RTS) smoothing filter technique.
Information 15 00754 g011
Figure 12. Short-term estimation response of the two water level outputs of the LSTM model for the hydrological stations. Y-real corresponds to the actual data from the study sample, and Y-Estim LSTM corresponds to the estimation of these actual data using the LSTM model. (a) Short-term estimation of Tadó water level at hydrologic station 1 using the LSTM model. (b) Short-term estimation of Santa Rita Iró water level at hydrologic station 2 using the LSTM model.
Information 15 00754 g012
Figure 13. The exponential smoothing method applied to two water level outputs on a neural network recurrent LSTM illustrates how the predicted values of both outputs are smoothly adjusted, reducing the impact of minor fluctuations or noise in the data. The plot compares the observed variations in water level with their smoothed values, allowing the overall trend in both outflows to be identified. This approach facilitates a clearer understanding of patterns over time, improving the ability to predict potential floods or detect major changes in water levels. (a) The short-term water level estimation at Tadó, hydrological station 1, was performed using an LSTM model and exponential Kalman smoothing. This combination improves accuracy by capturing nonlinear dynamics and reducing noise, allowing for more accurate river level predictions and facilitating early warnings of possible flooding. (b) The short-term estimation of the water level in Santa Rita Iró, hydrological station 2, was carried out using an LSTM model combined with the Kalman exponential smoothing technique. This methodology allows for obtaining more accurate predictions by reducing noise in the data, providing an effective tool for the monitoring and prevention of possible river floods.
Information 15 00754 g013
Figure 14. The Savitzky–Golay smoothing filter, applied to two water level outputs, demonstrates its ability to smooth and adjust the estimated values of both outputs. This method is effective at reducing noise in the time series while keeping essential features such as peaks and abrupt transitions intact. Smoothed lines facilitate the identification of underlying trends, allowing clearer analysis of critical patterns and behaviors, such as sudden increases or gradual changes in water level. This approach is particularly useful for examining the evolution of data that exhibit natural fluctuations but are affected by noise. (a) Short-term estimation of the water level at Tadó at hydrological station 1 using an LSTM model with the Savitzky–Golay smoothing filter technique. (b) Short-term estimation of the water level at Santa Rita Iró at hydrological station 2 using an LSTM model with the Savitzky–Golay smoothing filter technique.
Information 15 00754 g014
Figure 15. The smoothed Kalman Filter using the Rauch–Tung–Striebel (RTS) algorithm applied to an LSTM for the two water level outputs provides a clear view of the effectiveness of the model by comparing the estimates with the actual short-term measurements. Alignment between the estimation curves and the observed values allows for the LSTM to capture the inherent fluctuations and noise in the data to be assessed. A close match between estimates and measurements indicates that the model is achieving accurate predictions, which is critical for anticipating changes in water levels. This type of visualization not only allows for an analysis of system performance but is also essential for identifying patterns and facilitating informed decision making in water resource management, especially in situations of flood risk. (a) The short-term estimation of the water level at Tadó, corresponding to hydrological station 1, is presented using an LSTM model with the Rauch–Tung–Striebel smoothing filter (RTS) technique. (b) The short-term estimation of the water level at Santa Rita Iró, from hydrological station 2, using the same technique is shown.
Information 15 00754 g015
Table 1. San Juan River physical variables based on historical data.
Basin Area (km2)Annual Average Rainfall (mm)Average Water Flow (m3 × s−1) Δ f r
16,465727725500.65 to 0.88
Table 2. Location of the hydrological stations.
Station 1 (S1)Station 2 (S2)
Longitude76° 33’ 44.6” W76° 39’ 56.16” W
Latitude5° 15’ 54” N5° 6’ 59.76” N
Altitude100 MASL32 MASL
CityTadóSanta Rita Iró
Table 3. Information on the used datasets.
TypeOrganizationAvailable DataDataset
Station 1 (S1)IDEAM2021–2024Flow; Level; Precipitation.
Station 2 (S2)IDEAM2019–2024Flow; Level; Precipitation.
Table 4. Response mean square error (MSE).
MSE Output 1 NARXMSE Output 2 NARXMSE Output 1 LSTMMSE Output 2 LSTM
Order 10.00620.02480.01210.0409
Order 20.00950.02540.01570.0380
Order 30.01120.02790.01520.0422
Order 40.07950.09530.01710.0568
Table 5. MSE, NSE, KGE, and MAE for a short-term system: NARX water level output 1 coupled to the three Kalman smoothing techniques.
NARX Hybrid Three Kalman Smoothing Techniques: Output 1
ModelsMSEKGENSEMAE
Narx0.00620.96320.97620.0521
Narx-EXP0.00130.99680.99610.0123
Narx-SG0.04320.98130.98120.0325
Narx-RTS0.01350.99010.99210.0463
Table 6. MSE, NSE, KGE, and MAE for a short-term system: NARX water level output 2 coupled to the three Kalman smoothing techniques.
NARX Hybrid Three Kalman Smoothing Techniques: Output 2
ModelsMSEKGENSEMAE
Narx0.02480.95220.94270.0888
Narx-EXP0.00780.98870.98120.0308
Narx-SG0.01990.96920.96130.0623
Narx-RTS0.01230.98120.97660.0548
Table 7. MSE, NSE, KGE, and MAE for a short-term system: LSTM water level Output 1 coupled to the three Kalman smoothing techniques.
LSTM Hybrid Three Kalman Smoothing Techniques: Output 1
ModelsMSEKGENSEMAE
LSTM0.01210.97150.96420.0584
LSTM-EXP0.00720.98820.97210.0298
LSTM-SG0.03250.96990.95570.3210
LSTM-RTS0.02570.97910.97070.0432
Table 8. MSE, NSE, KGE, and MAE for a short-term system: LSTM water level Output 2 coupled to the three Kalman smoothing techniques.
NARX hybrid Three Kalman Smoothing Techniques: Output 2
ModelsMSEKGENSEMAE
LSTM0.04090.93660.92120.0777
LSTM-EXP0.01010.98640.96110.0423
LSTM-SG0.03870.95990.94400.0635
LSTM-RTS0.02330.96250.95140.0548
Disclaimer/Publisher’s Note: The statements, opinions and data contained in all publications are solely those of the individual author(s) and contributor(s) and not of MDPI and/or the editor(s). MDPI and/or the editor(s) disclaim responsibility for any injury to people or property resulting from any ideas, methods, instructions or products referred to in the content.

