Article

A Distributed RF Threat Sensing Architecture

by
Georgios Michalis
1,*,†,
Andreas Rousias
2,†,
Loizos Kanaris
1,†,
Akis Kokkinis 
1,†,
Pantelis Kanaris 
1,† and
Stavros Stavrou
2,†
1
Sigint Solutions Ltd., Nicosia 2311, Cyprus
2
Faculty of Pure and Applied Sciences, Open University of Cyprus, Nicosia 2252, Cyprus
*
Author to whom correspondence should be addressed.
These authors contributed equally to this work.
Information 2024, 15(12), 752; https://doi.org/10.3390/info15120752
Submission received: 26 August 2024 / Revised: 12 November 2024 / Accepted: 13 November 2024 / Published: 26 November 2024
(This article belongs to the Special Issue Emerging Information Technologies in the Field of Cyber Defense)

Abstract

:
The scope of this work is to propose a distributed RF sensing architecture that interconnects and utilizes a cyber security operations center (SOC) to support long-term RF threat monitoring, alerting, and further centralized processing. For the purpose of this work, RF threats refer mainly to RF jamming, since this can jeopardize multiple wireless systems, either directly as a Denial of Service (DoS) attack, or as a means to force a cellular or WiFi wireless client to connect to a malicious system. Furthermore, the possibility of the suggested architecture to monitor signals from malicious drones in short distances is also examined. The work proposes, develops, and examines the performance of RF sensing sensors that can monitor any frequency band within the range of 1 MHz to 8 GHz, through selective band pass RF filtering, and subsequently these sensors are connected to a remote SOC. The proposed sensors incorporate an automatic calibration and time-depended environment RF profiling algorithm and procedure for optimizing RF jamming detection in a dense RF spectrum, occupied by heterogeneous RF technologies, thus minimizing false-positive alerts. The overall architecture supports TCP/IP interconnections of multiple RF jamming detection sensors through an efficient MQTT protocol, allowing the collaborative operation of sensors that are distributed in different areas of interest, depending on the scenario of interest, offering holistic monitoring by the centralized SOC. The incorporation of the centralized SOC in the overall architecture allows also the centralized application of machine learning algorithms on all the received data.

1. Introduction

Nowadays, wireless networks support multiple operations and processes in households, businesses, industries, and organizations. This is mostly a result of the unprecedented evolution of numerous wireless technologies, including software-defined radio (SDR) [1] and software-defined networking (SDN) [2], millimeter wave (mmWave) [3], massive multiple-input multiple-output (MIMO) [4], non-orthogonal multiple access (NOMA) [5], interference management [6], learning-based resource allocation [7], and much more. This rapid technological development, supported by various wireless technologies and combined with machine learning (ML) and Artificial Intelligence (AI) techniques, has boosted the capacity and the quality of service of wireless networks and led to the massive utilization of smart devices and applications that take humanity a step closer to the vision of the Internet of Everything (IoE). We all witness daily the dependency of many activities on the existence of a reliable wireless connection. Multiple wireless systems utilize the RF spectrum, including radar, aerial or naval systems, and tactical communications for security and military forces such as TETRA and Mobile Ad Hoc Networks (MANETs) operating in different bands. With the rise of such wireless networks and systems, wireless security and wireless system resilience are essential elements that need to be safeguarded due to their increased vulnerability [8] as well as the evolution of enhanced intentional passive attacks or active interference/jamming techniques [9]. Jamming is defined as an active adversary attack that transmits energy to disrupt wireless communications, and can drastically degrade system performance [10]. A comprehensive survey on jamming attacks and anti-jamming strategies in wireless networks is given in [9,11]. Since a jamming attack is an effective way to disrupt and/or degrade any wireless network and system, it is important that it is detected in time. Due to the complexity and wide spread of wireless communications in all environments, it is of extreme importance to provide modular, low-cost RF jamming detection sensors for monitoring the spectrum bands of interest. Of equal importance is to provide sensors that automatically adjust in the the locality of the areas of interest, and provide reliable alarms to respective security operations centers, in order to take effective and immediate measures.
With this concept, the contributions of this paper can be summarized as follows:
  • Design of a low-cost RF monitoring sensor, based on a wideband, wide dynamic range logarithmic amplifier, to be utilized for multi-band interference, RF jamming monitoring, with distributed and collaborative capabilities.
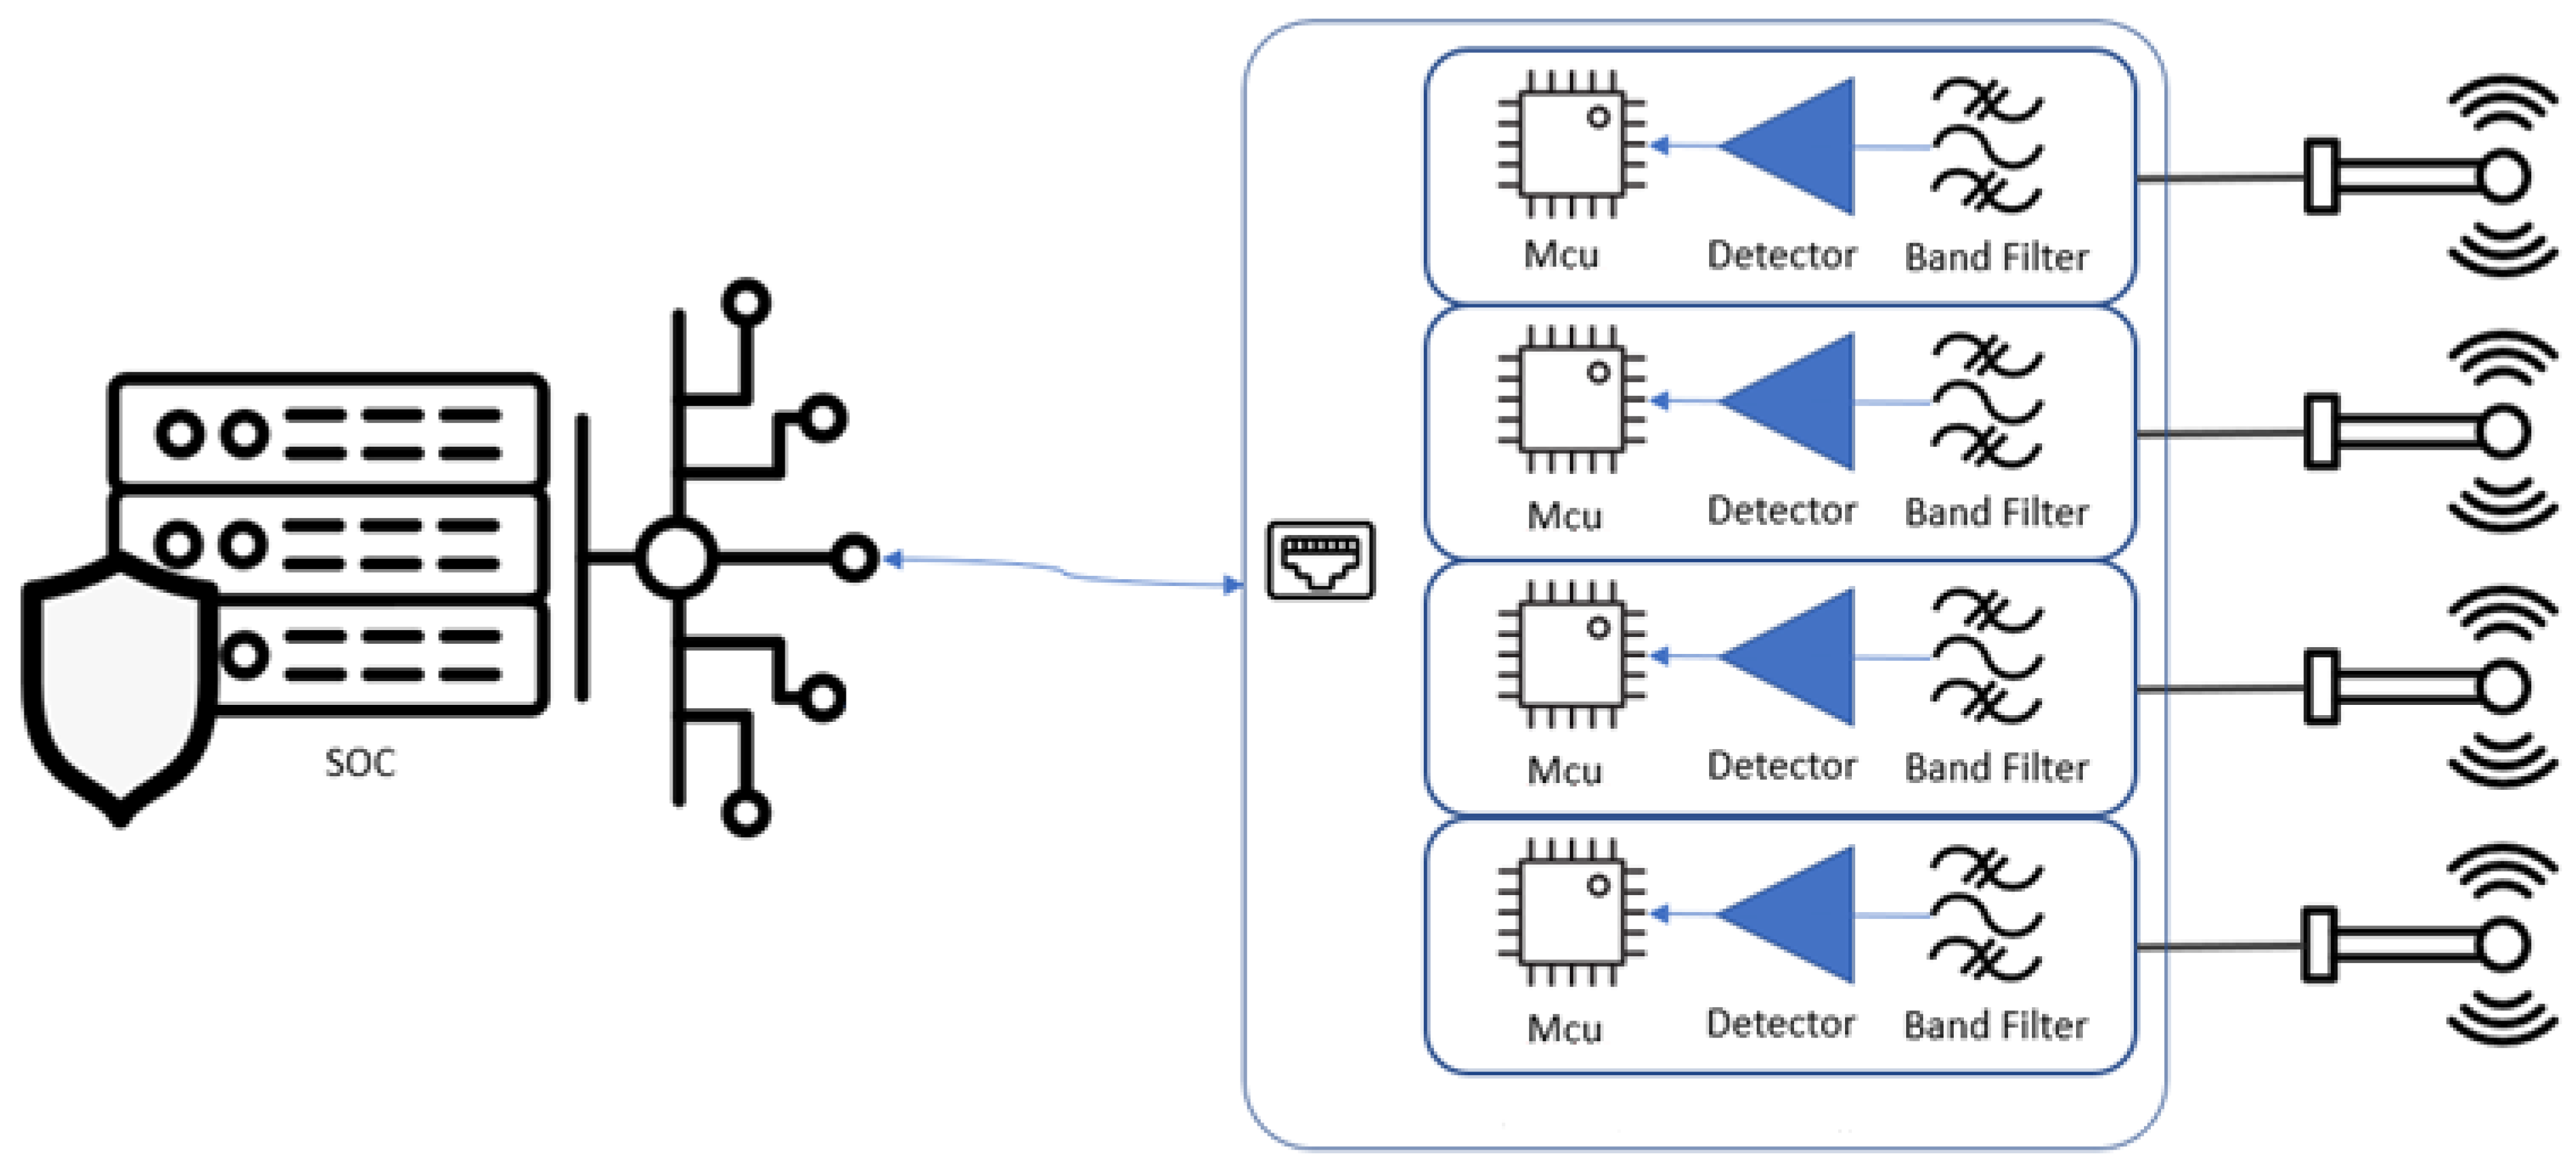
  • Interconnection of the proposed sensor with a security operations center (SOC), providing raw RF data and alerts, per monitored frequency band, in case of an anomaly—either interference or jamming activity.
  • Provision of an automated calibration process, allowing reliable, long-term RF recordings and RSS threshold analysis, for optimizing sensor operation in typical rural, suburban, and urban environments.
  • Analysis of the main radio contributing factors for detecting drone operations, in the scope of this work.
The remaining of this paper is organized as follows. Section 2 covers related research on jamming techniques and jamming sensing. Section 3 describes the proposed design of the low-cost RF sensor, the sensor calibration procedure, the sensing algorithm, and the sensor configuration for optimized performance. Section 4 gives a detailed description of the test environment, the experiment setup, and the datasets retrieved. Section 5 includes a discussion and analysis of the results, and an evaluation of their reliability, limitations, and applicability. Lastly, Section 6 summarizes the conclusions and discusses possible future steps.

2. Related Work

This section is divided into two subcategories that briefly summarize jamming attack techniques and then focuses on the related work in jamming sensing.

2.1. Jamming Attacks

Jamming as a subset of Denial of Service (DoS) is one of the most effective means to completely interrupt communication, or at least degrade the performance of wireless networks, and for this reason it is considered as a top ranked critical threat in wireless communication [11]. Therefore, it is a prime priority to identify the jamming attacks, localize the source of threat, and implement mitigation measures to prevent any harm to the system, or at least minimize the impact and the downtime of the network.
The most common types of generic jamming attacks are described below and are summarized in Table 1:
  • Constant Jamming: the attacker continuously transmits a high-power signal to disrupt the communication channel. In constant jamming attacks, the jammer may either target the whole channel bandwidth or a specific fraction of it, destroying the packet reception of legitimate users and preventing them from accessing the channel [9]. As a reference, based on work presented in [12] on WiFi communications, when the network is attacked by a constant broadband jammer, a 100% packet error rate occurs when the received desired signal power is 4 dB less than the jamming signal. Respectively, when the jamming occurs with only a bandwidth of one sub-carrier spacing, WiFi communications fail when S J R > 19 dB [13]. This type of jamming is more easy to detect due to the constant interference it creates.
  • Deceptive Jamming: the malicious device sends regular, meaningful signals that mimic legitimate communications, causing the receiving devices to think they are receiving valid data. The main purpose of this type of attack is to waste the resources of the wireless network to prevent the legitimate devices from accessing the channel [14]. This can be harder to detect than constant jamming.
  • Random Jamming: the jammer alternates between jamming and non-jamming periods, making it more difficult to detect the source of the interference [15]. This type is not as efficient as constant jamming, but may endure for long periods as it conserves the attacker’s energy while still disrupting communications.
  • Reactive Jamming: the attacker only transmits signals when legitimate communication is detected [16]. Due to this concept, reactive jammers are considered an energy-efficient attack strategy; however, they require tide timing constraints in order to rapidly switch from sensing mode to jamming. In practice, this can be achieved by implementing a built-in part of signal sensing or utilizing a third-party packet detection module. More detailed research work in this direction is presented in [17,18]. This method makes it harder to identify the jammer since the interference only occurs intermittently.
  • Selective Jamming: the attacker targets specific types of communications, such as control channels or particular frequencies, by exploiting their knowledge of the targeted wireless network and the implementation details of network protocols at various layers of the protocol stack [19]. This can cause significant disruption with minimal effort, as critical components of the network are affected.
  • Pulse Jamming: the attacker sends short bursts of high-power signals. This type of jamming can be very effective against certain types of modulation schemes and is challenging to counteract. Several countermeasure methods have been presented in the research community. For example, [20] investigates the challenge of anti-jamming communication in a random pulse jamming environment. The authors employ the Markov decision process (MDP) to model and analyze the countermeasure in the time domain, proposing an anti-pulse jamming algorithm based on reinforcement learning. In this way, they enable the transmitter to switch between two states—“active” and “silent”—to avoid random pulse jamming. Researchers in [21] propose the Swarm intelligence algorithm to adapt change in network topology and traffic, especially for IEEE 802.15.4 wireless networks. Based on this technique, the forward ants unicast or broadcast depending on the availability of the channel information for the end of the channel. If the channel information is available, the ants randomly choose the next hop. The source on receiving the channel information verifies the prevalence of the attacker and avoids the particular channel for transmission.
  • Spot Jamming: the attacker focuses all their power on a single frequency or a narrow band of frequencies. In [22], the authors investigate the effects of interference in mmWave radar by utilizing another identical device to emulate spot jamming. Spot jamming effects, among other jamming attacks on GPS, are investigated in [23,24]. This can be very effective if the targeted frequency is critical for communication.
  • Sweep Jamming: in sweep jamming, the attacker rapidly changes the frequency of the jamming signal across a range of frequencies. Different waveforms can be used for the sweeping signal, such as sinusoidal, square, triangle, saw-tooth, and chirp. This can disrupt communication over a broad spectrum and is harder to mitigate. In [25], researchers propose an anti-jamming algorithm based on distributed multi-agent reinforcement learning, for sweep and smart jamming strategies. Each terminal take the spectrum state of the environment as an input. Then the proposed algorithm employs Q-learning, along with the primary and backup channel allocation rules, to select the optimum communication channel.
  • Barrage Jamming: the attacker jams multiple frequencies simultaneously. This type of jamming is very effective. It requires significant power and is typically used to disrupt communication across a wide band of frequencies and systems. Barrage jamming detection and classification for Synthetic Aperture Radar (SAR), based on a convolutional neural network (CNN), is presented in [26].
  • Intelligent Jamming: the attacker uses advanced techniques, such as machine learning algorithms, to adapt their jamming strategy based on the network’s current state and responses. The evolution of AI/ML has been heavily implemented in jamming strategies as well, which makes such jamming techniques much more effective and harder to counter. Reference [27] presents intelligent jamming in LTE networks, while intelligent anti-jamming is discussed in [28].
Summing up, understanding these different types of jamming attacks helps in developing effective detection techniques and countermeasures to protect wireless communications from such threats. For some methods, the pattern or the effect of the jammer can be easily identified but, for others, the probability of detecting a jammer could be low (e.g., random jammers, intelligent jammers). Jamming attacks can interrupt communication, cause connectivity problems, avoid the availability of services, and, eventually, degrade the performance of legitimate user devices significantly, regarding both energy consumption and the network throughput. Communication interruptions, connection problems, and unavailability of the service can not only negatively affect the performance of the system.

2.2. Jamming Sensing

Being in the era of the vast utilization of wireless networks in everyday typical or critical operations, the obvious challenges communicated to the research community are towards ensuring security and reliability of those systems. The risk of malicious jamming attacks has risen dramatically and for this a number of jamming detection techniques have been proposed. These techniques can be categorized into two main classes: non-machine learning, such as [29,30,31,32,33,34,35,36,37,38], and Artificial Intelligence (AI) machine learning (ML), such as [39,40,41,42,43,44].
Non-machine learning methods perform using some parameters and strategies including threshold, fuzzy logic, game theory, channel surfing, mapping jammed region, and timing channel. More specifically, in [29], the authors evaluate the performance of the wireless channels in time-critical applications by applying a threshold-based model that utilizes the packet loss, throughput, and message invalidation ratio. In [30], a Stackelberg game framework is utilized to analyze interactions between a smart jammer and an actual network user. The authors use a variable sampling approach to manage data packets dropout between a sensor and a controller. A time series model is presented in [31], where the state of the communication link is detected by measuring the current state of the link over series of time and compared with the past link data. The authors in [32] propose a fuzzy logic centralized jamming detection technique that calculates a jamming index (JI) to identify the level of jamming effects on a node. The proposed system input is based on the received signal strength, packet delivery ratio, bad packet ratio, and channel clear assessment parameters. In [33], researchers implement a new layer to an NS-2 simulator to support multi-radio multichannel capability. The aim is to increase network capacity and implement anti-jamming models for improving the resiliency of multi-radio networks against jamming attacks using channel hopping and error-correcting code (ECC). In [34], a detection approach for reactive jamming attacks in tactical wireless ad hoc networks is proposed. The authors claim that the proposed mechanism is capable of detecting jamming either by comparing the behavior of the packet delivery rate across the short term and the long term or by observing the required number of re-transmission attempts in the network. Physical layer security is considered in massive MIMO (MaMIMO) systems that experience attacks of a multi-antenna jammer in [35]. The authors propose a jamming detection method that utilizes intentionally unused pilots in the network and calculate a generalized likelihood ratio test over some coherence blocks. The researchers claim that the performance of the detector can be improved by increasing the number of base station antennas,  unused pilots, and coherence blocks that are utilized. In [36], the researchers introduce a new class of low-cost detectors that implement an algorithm that is based on the hypothesis that jamming causes correlated changes in all the measured Carrier-to-Noise density power ratio (C/No) values. The decision parameter, which is calculated based on the sum of squared C/No variations, is tested in a real-time platform using a typical GPS receiver and an android device. The work in [37] is focused on detecting jamming attacks in IoT networks. The limited computational resources of IoT networks make it difficult to implement sophisticated and resource-hungry detection algorithms. For this reason, the authors propose a real-time jamming detection mechanism that can identify attacks on multiple channels in 2.4 GHz bandwidth simultaneously, based on the proven hypothesis that, if a jamming attack occurs, the throughput, PDR, delay, and RSSI values will deviate (deteriorate) from the regular state parameters. This is also valid even if the jammer adapts its settings by sensing the effect of jamming in the IoT network. Finally, in [38], an energy-efficient scheme is proposed for the protection of reactive alarm systems with very low network traffic. The scheme is claimed to be able to identify the cause of bit errors for individual packets, by looking at the RSS during the reception of these bits. Three techniques are presented for the identification of bit errors based on predetermined knowledge, error-correcting codes, and limited node wiring.
On the other hand, AI/ML-based scientific work includes implementation of machine learning models, deep learning, and neural networks, all trained with utilization of large datasets that encapsulate several parameters and jamming indexes. Some examples of related work in this area are provided briefly. In [39], the authors focus on jamming detection for 802.11 networks, using metrics that are accessible through standard device drivers, and perform detection via machine learning. The proposed approach allows for both stand-alone operation and cooperative detection, with preliminary tests indicating high detection rates in indoor and mobile outdoor scenarios under challenging link conditions. In [40], the researchers create a large dataset of signal and jamming features and compare the efficiency of several machine learning algorithms after their training. More specifically, they evaluate the performance of random forest, support vector machine, and neural network, using as indicators the probability of detection, probability of false alarm, probability of miss detection, and accuracy. They finally conclude that a random forest algorithm seems to detect RF jammers with a higher accuracy and low probability of false alarms. In [41], the proposed approach extends the state-of-the-art jamming detection and classification methods by implementing a deep learning (DL) model on an IoT edge device. The DL model, which is trained to detect constant and periodic jamming, is built using TensorFlow and deployed on the IoT device using TensorFlow lite. In [42], the authors focus on detecting jamming preemptively, before an increase in the BER (in low BER regimes) and the decrease in the SNR at a level that will completely disrupt the communication link. This method is important for drones and similar-use mobile devices, where communication loss will probably result in critical security and safety issues for the related system and humans. Their approach analyzes raw physical-layer information (I-Q samples) acquired from the wireless channel and converts this information to grayscale images. Then they detect image anomalies caused by jamming attacks, by using sparse autoencoders. Their method, dubbed Bloodhound+, can detect indoor jamming up to 20 m from the jamming source, at the minimum available relative jamming power. In [43], an ML approach is proposed to detect and classify jamming attacks against orthogonal frequency division multiplexing (OFDM) receivers for unmanned aerial vehicle (UAV) applications. The first algorithm utilizes SNR, energy threshold, OFDM parameters to develop a feature-based classification model with ML, while the second collects spectrogram images to build a spectrogram-based classification model via deep learning algorithms. In the same direction, researchers in [44] propose a framework for jamming detection in drone networks, by using a distributed approach based on Multi-layer Perceptron and Decision Tree supervised ML techniques. Their algorithm compares throughput, PDR, and RSS parameters that vary during a jamming attack, with respect to a reference data packet trace set, detecting in this way the anomaly.
Summing up, it can be concluded that numerous signal-specific metrics are used for detecting jamming attacks, such as RSS, PDR, Carrier-to-Noise density power ratio, re-transmission attempts, and the packet re-transmission profile. Additionally, other modulation specific metrics can be combined to improve the performance of the proposed detection algorithms, such as OFDM. Such metrics have been used in several scenarios and communication technologies, e.g., WiFi IEEE 802.11, IoT LWAN, 5G+, MaMIMO, GNSS, MANET, and other spread spectrum-based communication technologies. The proposed methods tend to be assisted by ML and DL models to improve jamming detection. Such tools include neural networks, Decision Trees, random forest, support vector machine, and autoencoders. Different from what is proposed in other research work, we approach the jamming detection challenge at a more holistic, strategic level, identifying the necessity of centralized—at a SOC level—simultaneous monitoring of multiple heterogeneous wireless network technologies, offering a bird’s view sensing and localization capability of malicious jammers’ activity to various bands of interest. The proposed approach presents the applicability of the deployment of a large number of low-cost sensors, with wideband RF detection capabilities that are technology neutral. The wideband RF capabilities can be RF band restricted through selective RF filtering for the purpose of increasing selectivity and band identification. The RF jamming detection sensors can be geographically distributed, allowing localized jamming detection and jamming localization based on the use of directional antennas. RF jamming detection capabilities can be also further enhanced through the overall architecture that incorporates an SOC with centralized machine learning processing capabilities.

3. Proposed Approach

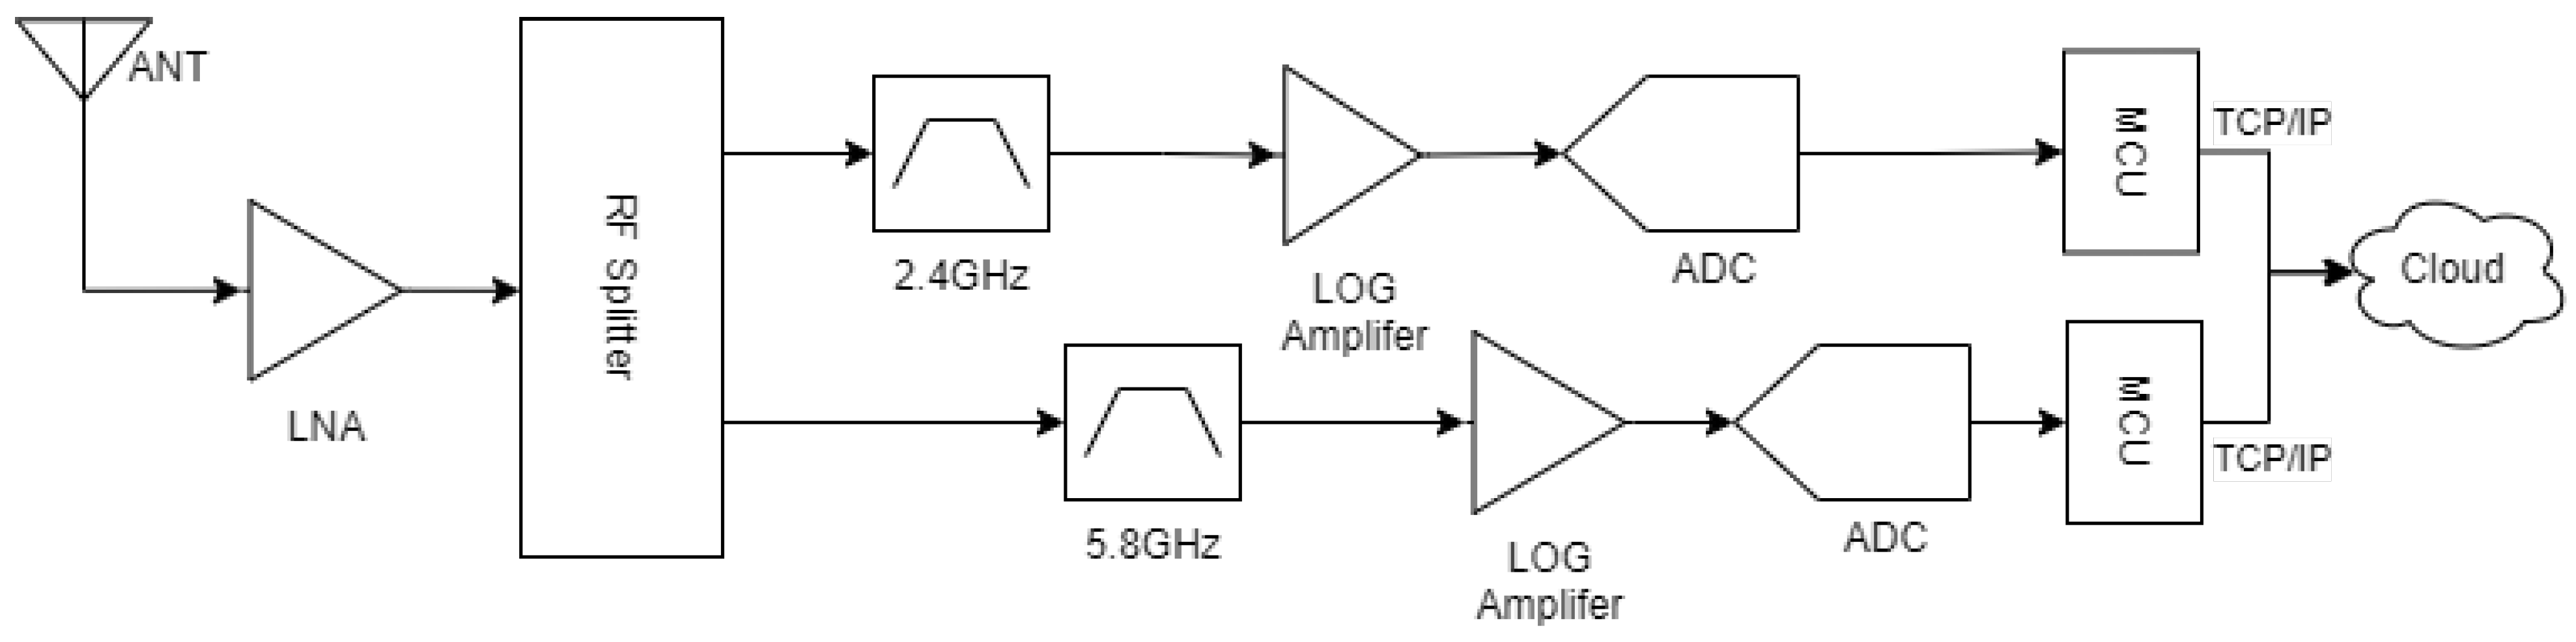
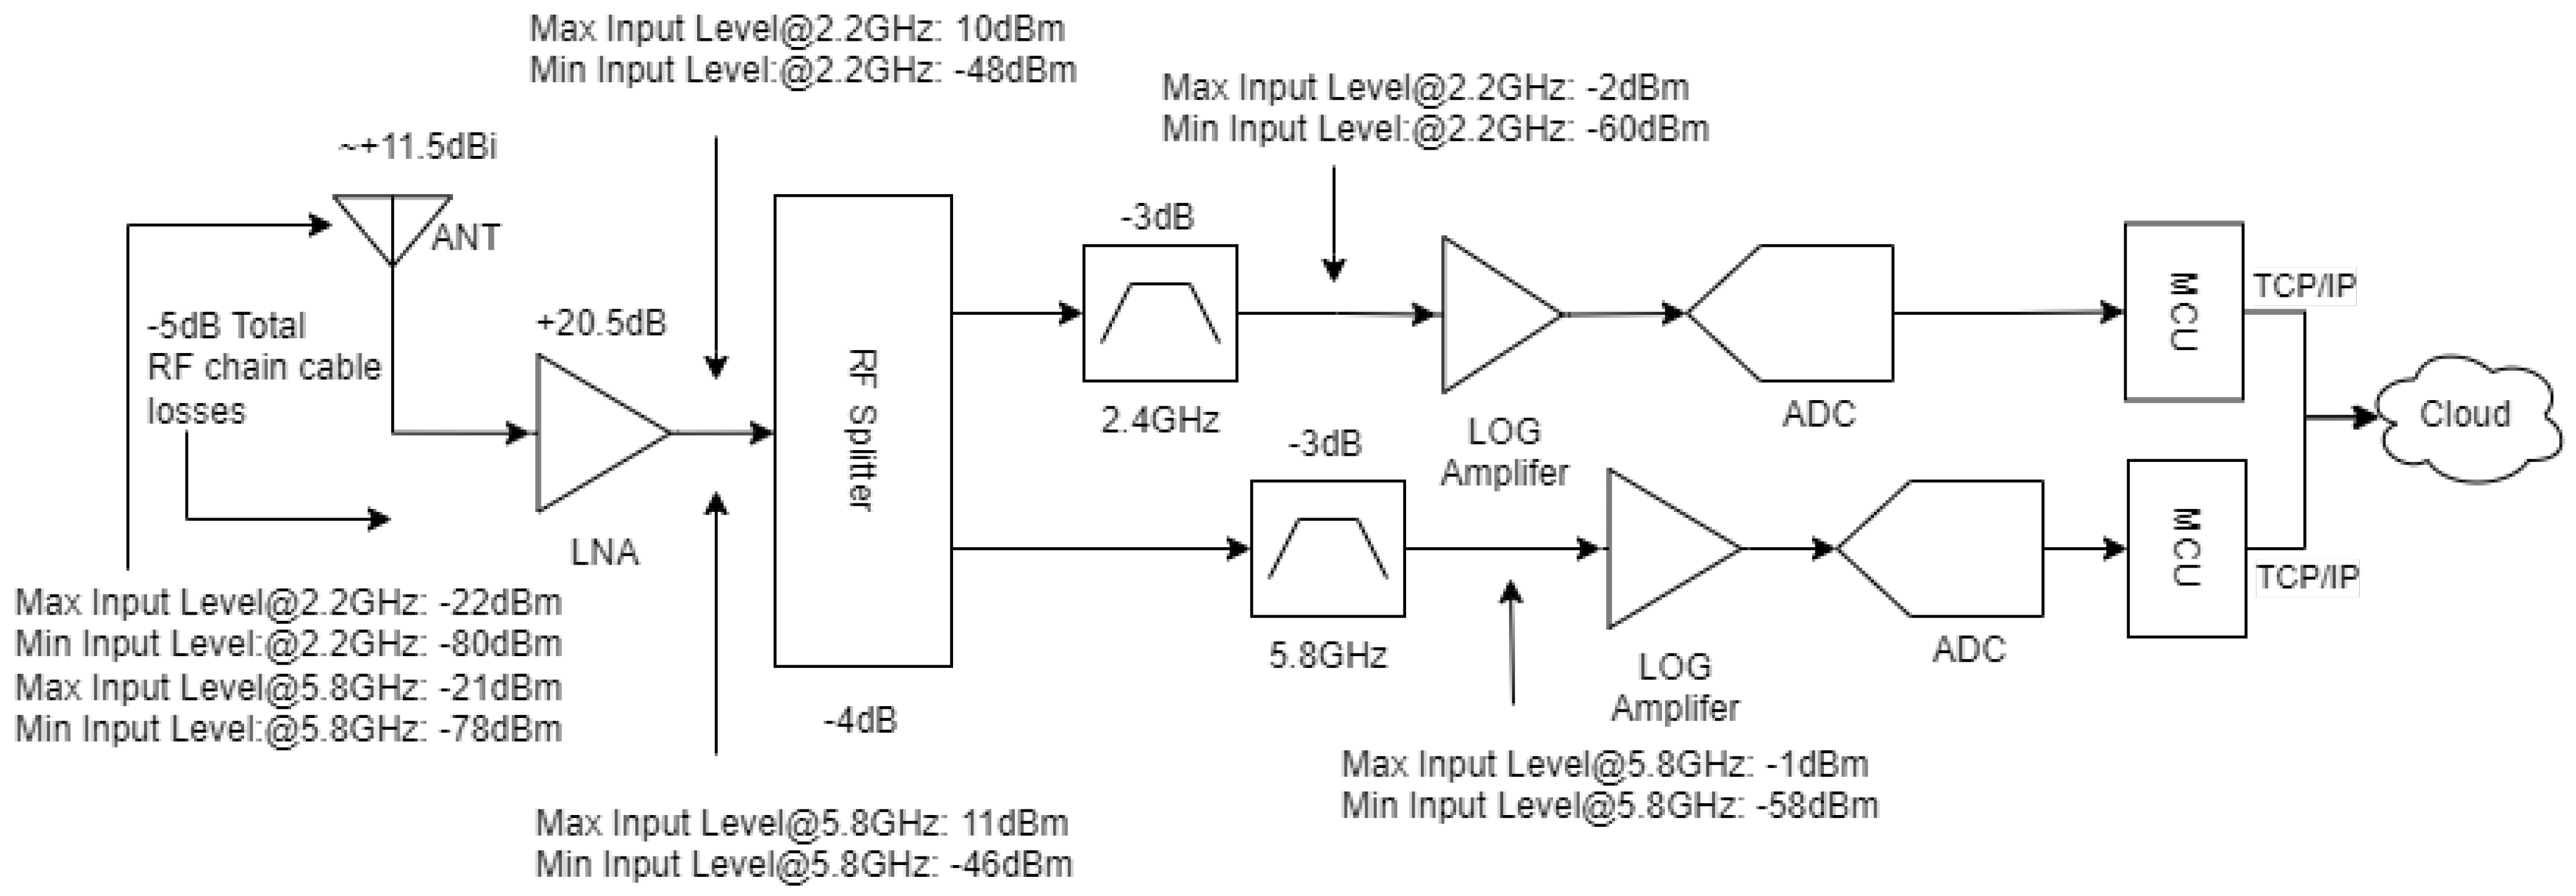
3.1. Low-Cost RF Sensor Design Using a Logarithmic Amplifier

In this paper, we propose the design and operation of a low-cost RF jamming detection sensor, incorporating an RF environment characterization algorithm, capable of operating in multiple RF bands for either RF jamming detection or interference monitoring, including potential drone detection for short distances. Monitoring and further processing is performed, centralized through a SOC, allowing also further centralized machine learning processing capabilities. The initial design comprises two modules for demonstration purposes, one for monitoring 2.4 GHz band (2340 MHz–2530 MHz) and the second for 5.8 GHz band (5490 MHz–5895 MHz), using a logarithmic amplifier with a high dynamic range. The logarithmic amplifier’s sensitivity level is further enhanced through the use of specific RF band directional antennas, a low-noise amplifier, and  RF band selective filtering, for the purpose of filtering the Signal band of Interest (SoI). In this way, lower-level RF signals are captured, aiming to provide more sensitive and longer distance interference monitoring.
Both aforementioned sensors on the two RF bands were designed based on the AD8318, which is a 9-stage demodulating logarithmic amplifier that provides RF measurement and power amplifier control functions. AD8318 has an input frequency range that extends up to 8 GHz with a 60 dB dynamic range. The covered frequency and dynamic range characteristics can fulfill the frequency range monitoring criteria, covering several widely used wireless networks, as well as the typical frequencies used in drone operations [45]. Additional module sensors for other frequency bands of interest within the 8 GHz frequency range can be added to the same overall RF sensing architecture.
Figure 1 provides a basic block diagram of the developed RF sensor system used during the environment RF profiling and field tests.
Distributed communication and control of module sensors is achieved by a WT32-ETH01 micro-controller that supports Ethernet, making it well-suited for the networking functions of embedded devices, as per Figure 2.
An algorithmic code base was implemented in the device side, providing functionality to parameterize and calibrate the sensor and perform real-time RF monitoring, alarm push, and recording in the cloud, through the use of the MQTT (Message Queuing Telemetry Transport) protocol. More specifically, the code provides the following functionality:
  • Connecting the device to the module manager.
  • Accessing the network and configuring the module IP for SOC interconnection.
  • Monitoring the module status.
  • Configuring the module parameters (general information, configuring the system clock and the reporting server, and calibrating the modules of the RF sensor).
  • Setting up active RF measurement and RF jamming monitoring.

3.2. Sensor Calibration

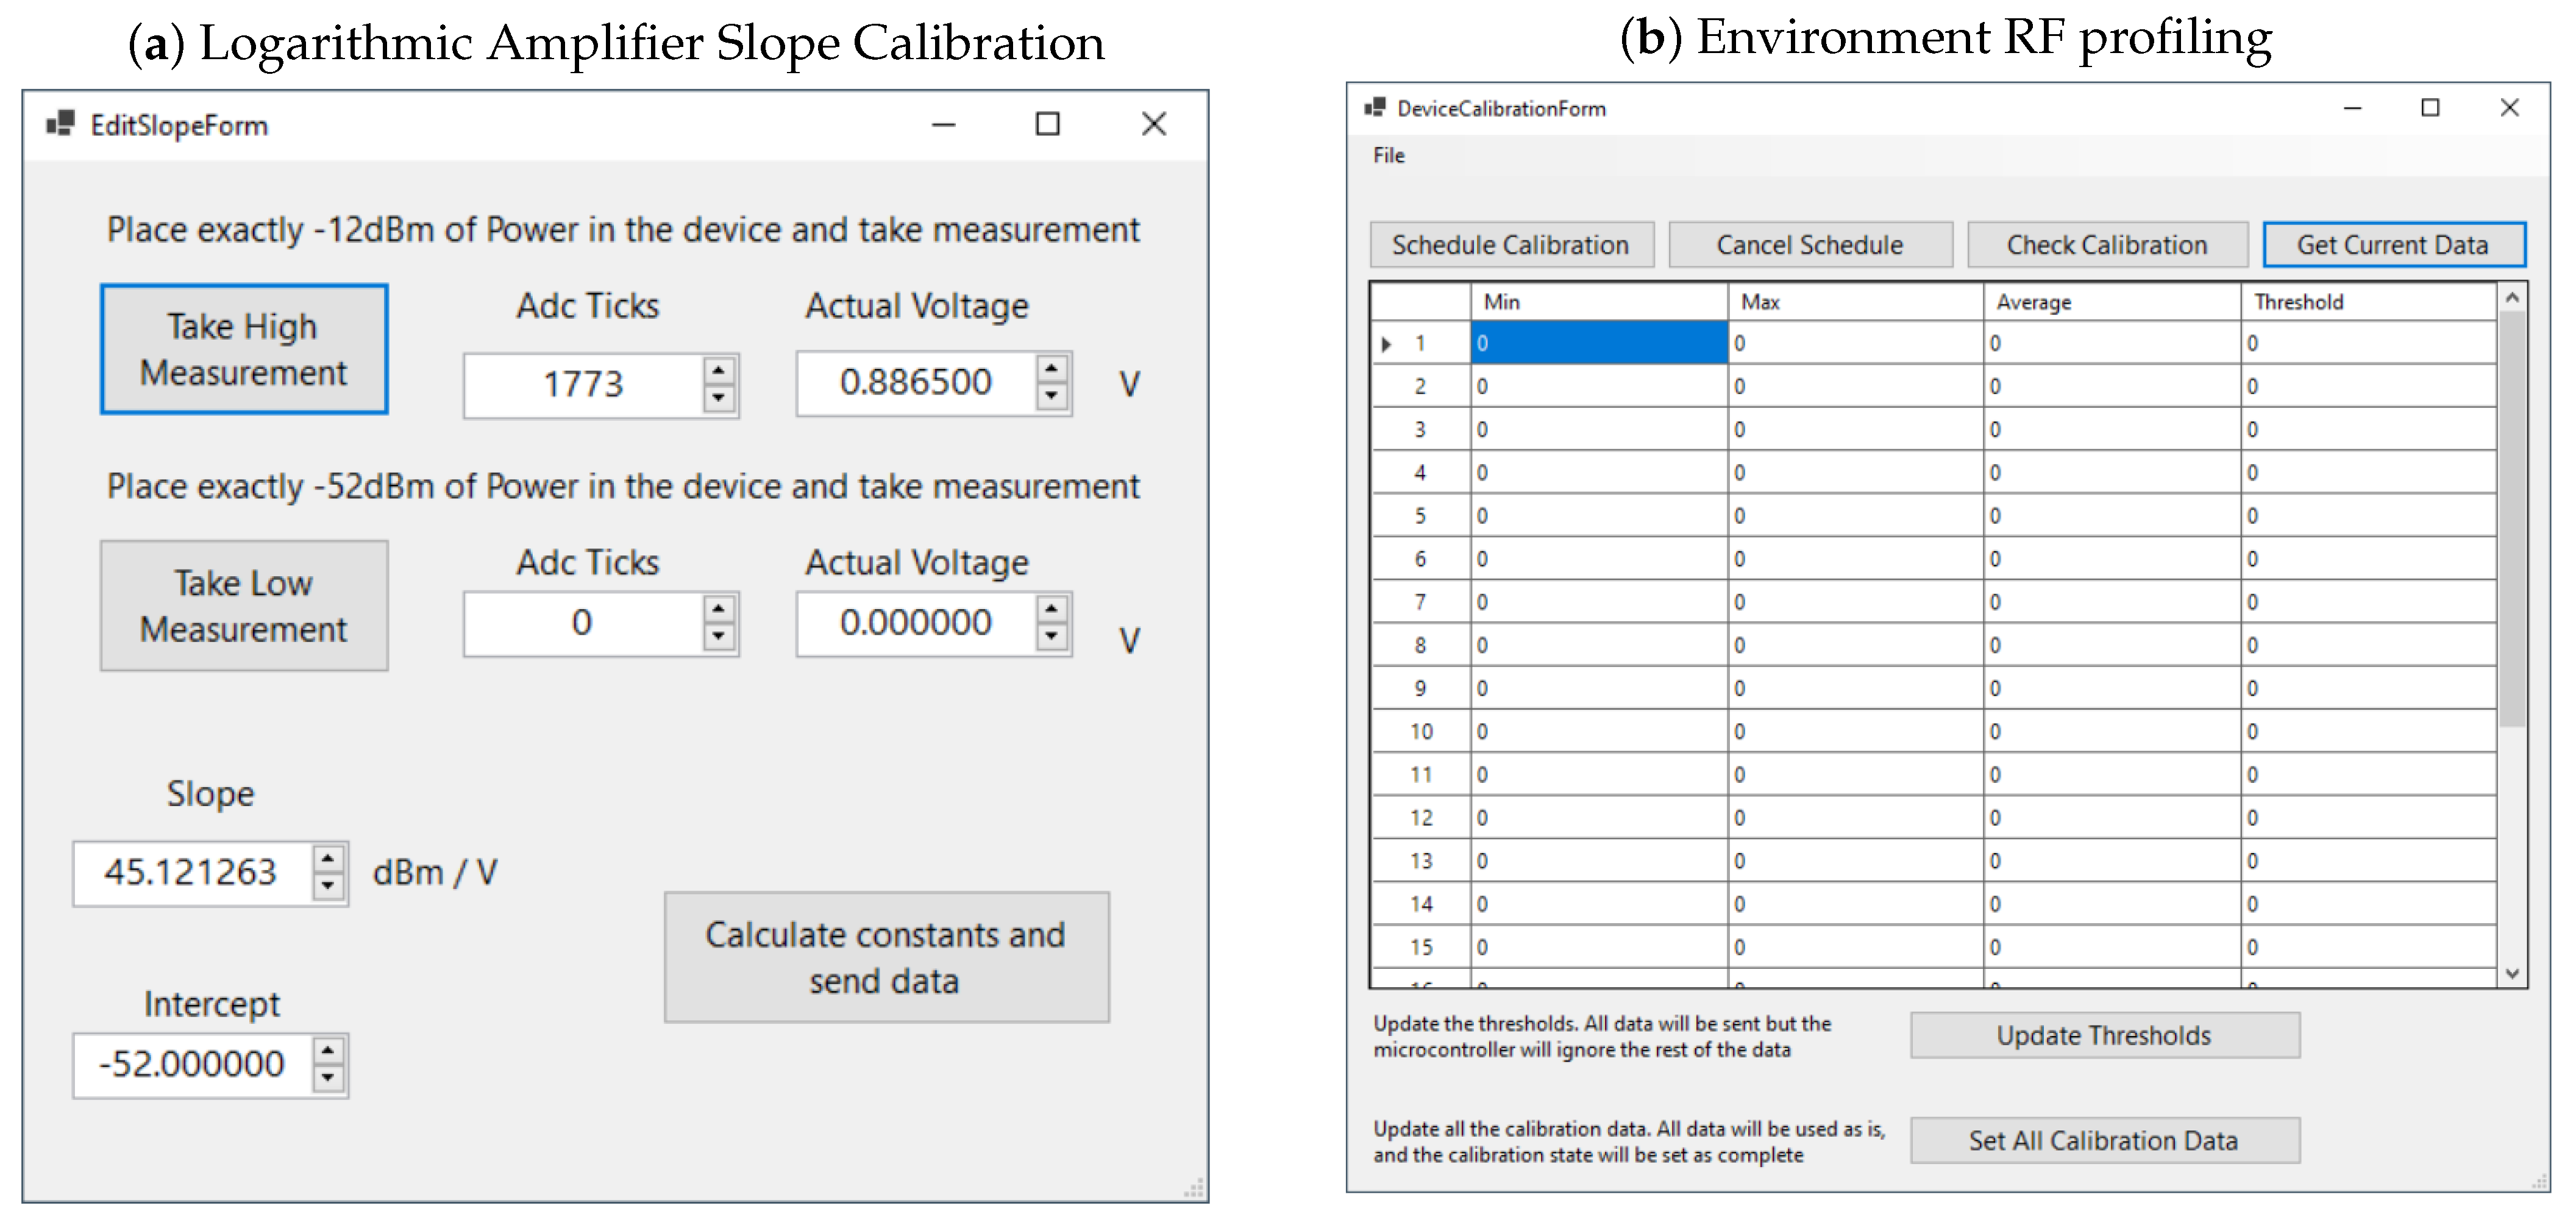
3.2.1. Calibrating the Logarithmic Amplifier

Before operation, the logarithmic amplifier-based sensor requires an initial calibration. Such a calibration needs to be performed only once per module, after which the calibration values are kept permanently in a database and recalled whenever the module is operating.
To perform the calibration, a Lab Brick Signal Generator from Vaunix was used, LSG-602, measured with an R&S FSH8 calibrated spectrum analyzer. The signal generator was used to inject a signal within the desired frequency range of the two sensors developed and utilized for this work.
In our case study, the first sensor utilizes a filter that ranges from 2340 MHz to 2530 MHz, while the second sensor utilizes a filter with a frequency range of 5490 MHz–5895 MHz. Hence for calibration purposes, we used signal generator frequencies within the two frequency ranges.
The calibration power levels at the logarithmic amplifier inputs are set initially within the linear performance of the dynamic range of the logarithmic amplifier, as described in the manufacturer’s device data sheet. The received signal level range at the input of the logarithmic amplifier is then estimated at the input of the antenna by considering the gain of the used antennas, the  gain of the low-noise amplifier, and any passive losses. During overall RF chain calibration, all RF gains and RF passive components losses of the RF chain are taken into consideration.
During the logarithmic amplifier calibration, the sensor application collects a large number of sample measurements (adc ticks), and the average voltage output value (VOUT) is set to construct the linear slope of each module (Figure 3).

3.2.2. Environment RF Profiling

Having corrected the slope of the logarithmic amplifier, we need to profile the local ambient RF environment at the frequency bands of interest. To achieve this, the sensor is deployed in the specific area of interest to record the ambient RF noise level at each RF sensor band. Each RF sensor performs continuous measurements for up to 24 h, recording samples every second. For each hour, the system then registers the minimum, maximum, and average RSS levels as per Figure 3. At the end of each hour, the system automatically generates a recommended Alarm Threshold Level (ATL) using proposed Formulas (1), (2), and (4), which take into consideration a jamming-to-noise ratio (JNR) that is related to the monitored band and the technologies utilizing this specific band. Alternatively, this guard threshold for alarm activation can be set as a percentage of the increased power level (in dBm) above the calculated average.

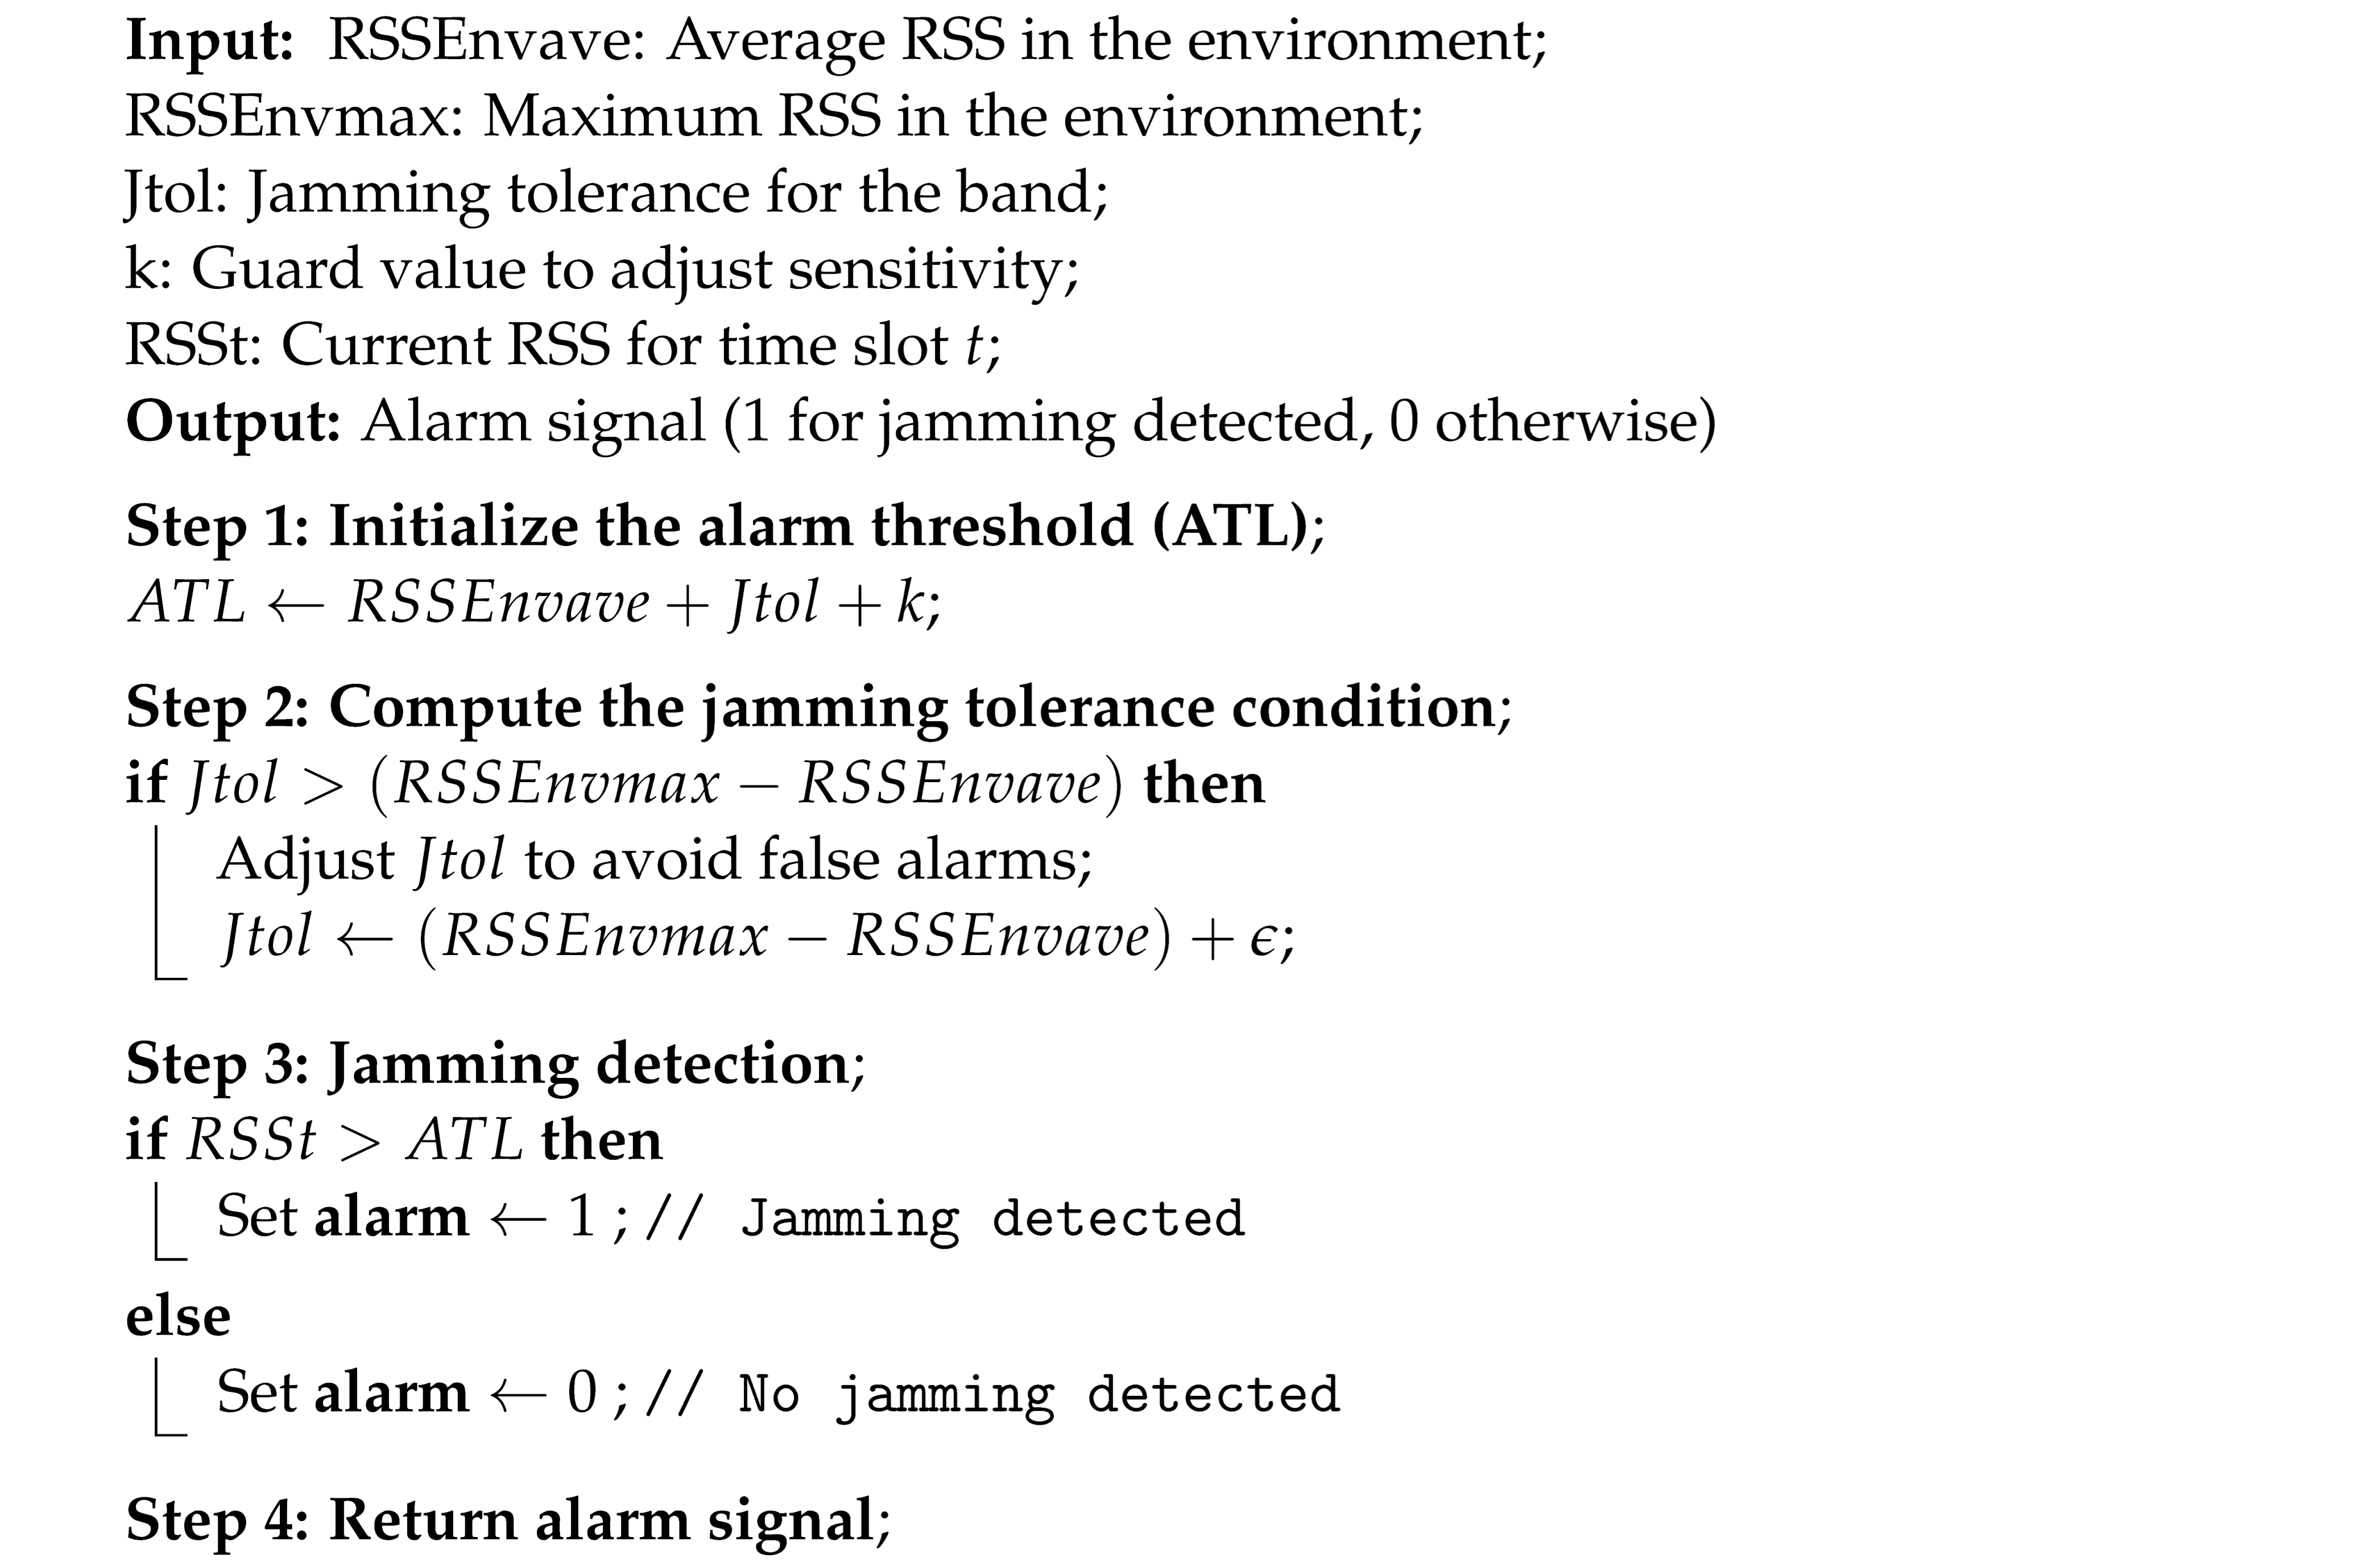
3.3. Sensor Expected Performance and Alarm Threshold Level

Before testing the proposed RF sensor, we need to estimate the expected performance, taking into consideration system component losses, LNA and antenna gain, and the typical expected propagation losses in each frequency band. Based on the specifications of each component and measurements performed with an R&S FSH-8 Spectrum analyzer, the system losses are presented in Table 2.
One also has to consider the system gain, where the LNA ZX60-83LN-S+ provides a signal gain of 20.5 dB, with a noise figure of 1.5 at the highest frequency of sensor operation, and the directional Vivaldi wideband antenna, with a gain of 11.5–12 dBi at the frequencies of interest. The gain characteristics of the Vivaldi antenna are shown in Figure 4.
As a result of the aforementioned gains and losses and data sheet specifications of the AD8318, Figure 5 presents the theoretical RF signal levels that can be present at various points of the receiver chain, including the gain of the Vivaldi antenna. The data sheet provides the various min and max RF levels at various frequencies across the 1 MHz to 8 GHz operating range, including values at 2.2 GHz and 5.8 GHz. For the purpose of this investigation, it is assumed that the 2.2 GHz figures provided in the data sheet, and the ones at 2.4 GHz where one of the two sensors will operate, will not differ significantly. One would also expect that the minimum detectable RF levels should be influenced by the overall noise figure of the individual RF receiver chain as a function of the gains and losses and the noise figure of the low-noise amplifier, as estimated by the Friis noise formula, where on this occasion the overall chain noise figure is not expected to exceed 3 dB. It also has to be noted that the min and max signal levels taken from the data sheet appearing in front of the log amplifiers refer to values in the ±1 dB log conformance error region. If one considers an increased log conformance error vs. input power, as presented in the data sheet, lower RF signals than the ones presented in Figure 5 can be detected at the log amplifier input.
In order to sense a malicious emitter and send an alarm, the recorded signal should exceed a predefined Alarm Threshold Level ( A T L ( f / t ) ) that is adequately higher than the average environmental noise of the monitored frequency band, f i , for time slot t. This means that, in environments with dense utilization of wireless networks, any malicious interference below the average noise level will not be detected.
The A T L ( f / t ) for each band depends on the signal-to-noise ratio (SNR) given by Equation (1), the jamming-to-noise ratio as per Formula (2), and each wireless technology jamming tolerance ( J tol measured in dBm) to handle such a jamming signal.
SNR ( dB ) = 20 log S N
JNR ( dB ) = 20 log S N + J s
From Shannon’s Equation, the channel capacity (CC) is given as:
C C = B log 2 ( 1 + S N )
where B is the bandwidth of the channel and S / N is the power ratio of the received signal and noise level.
When a jammer is active in the environment, the noise level increases since the jamming interference is added to the environment noise that is already in the channel (Equation (1)), thus lowering the signal-to-noise ratio. Hence the capacity of the channel is degraded, affecting several network parameters such as the packet delivery ratio (PDR), network throughput, and collision rate, until the total loss of communication. Based on the above, an  A T L ( f / t ) can be defined as such a level that, if exceeded, the wireless network will face severe difficulty in medium access, implying a possible jamming attack against it.
Hence, in our proposed system, the  A T L ( f / t ) is automatically set after the profiling period by taking into consideration the specific environment profiling parameters, for each specific band i and time slot t under no jamming events ( R S S Env max , R S S Env min , R S S Env ave ) and J tol . The calculation is provided by Equation (4) for band i per time slot t.
A T L b a n d i ( t ) = R S S e n v a v e ( i ) ( t ) + J t o l + k
where k is a manually set guard value.
For example, as described in [13], for WiFi communications a constant jamming signal is effective when exceeds it the legitimate signal by 4 dB. To avoid false-positive alarms occurring due to RSS fluctuations in each band, we force:
J t o l > ( R S S e n v m a x ( i ) ( t ) R S S e n v a v e ( i ) ( t ) )
To consider a sensing scenario, we assume the existence of a low-to-moderate RF jammer with an EIRP power of 48 dBm at 2.4 GHz and an EIRP of 45 dBm at 5.8 GHz, operating in a typical average noise suburban environment, up to 3 km away from the sensor. It can be theoretically calculated, using the free space loss Equation (6), that the path loss is 109.5 dB at 2.4 GHz and 117.2 dB at 5.8 GHz. This means that the expected signal level arriving at the Vivaldi antenna would be −61.6 dBm at 2.4 GHz and −72.3 dBm at 5.8 GHz, which are within the detected ranges of the ±1 dB log conformance error of the specific log amps.
F S L = 4 π d λ 2
where d is the distance between the transmitter and receiver in meters and λ the wavelength of the signal.
The proposed algorithm is presented with the following pseudocode (Algorithm 1):
Algorithm 1: ATL Algorithm for RF Jamming Detection
Information 15 00752 i001

3.4. Sensor Interconnection with a SOC

As mentioned in Section 3.1, the sensors support an Ethernet connection and the MQTT protocol. Using a secure connection, we forward the MQTT messages to the MQTT server hosted in a SOC. The typical message includes:
  • Device name and hostname.
  • Device ID and IP addresses.
  • Various measurement values, including threshold, delta, and geographic coordinates (longitude and latitude).
  • Antenna orientation details (azimuth, elevation, roll).
  • Measurement settings (samples, period).
  • Alarm status.
  • Sensor attenuation and actual measurement values.
  • Device information (location, band, name, group).
  • Timestamp and version.
The messages, which include both raw measurements and alerts, are retrieved in near real time, at an adjustable by the user time interval (heart bits), and are visualized—using OpenSearch Dashboards—in the SOC platform, as can be seen in Figure 6.
In this way, SOC has the capability to continuously monitor, long term, the RF spectrum in multiple areas, and at the same time investigate any alerts that may arise in the filtered bands of interest. Also, if one considers the use of directional antennas on the distributed sensors, the true direction of the jamming source can be also identified.

4. Test Environment and Experiment Setup

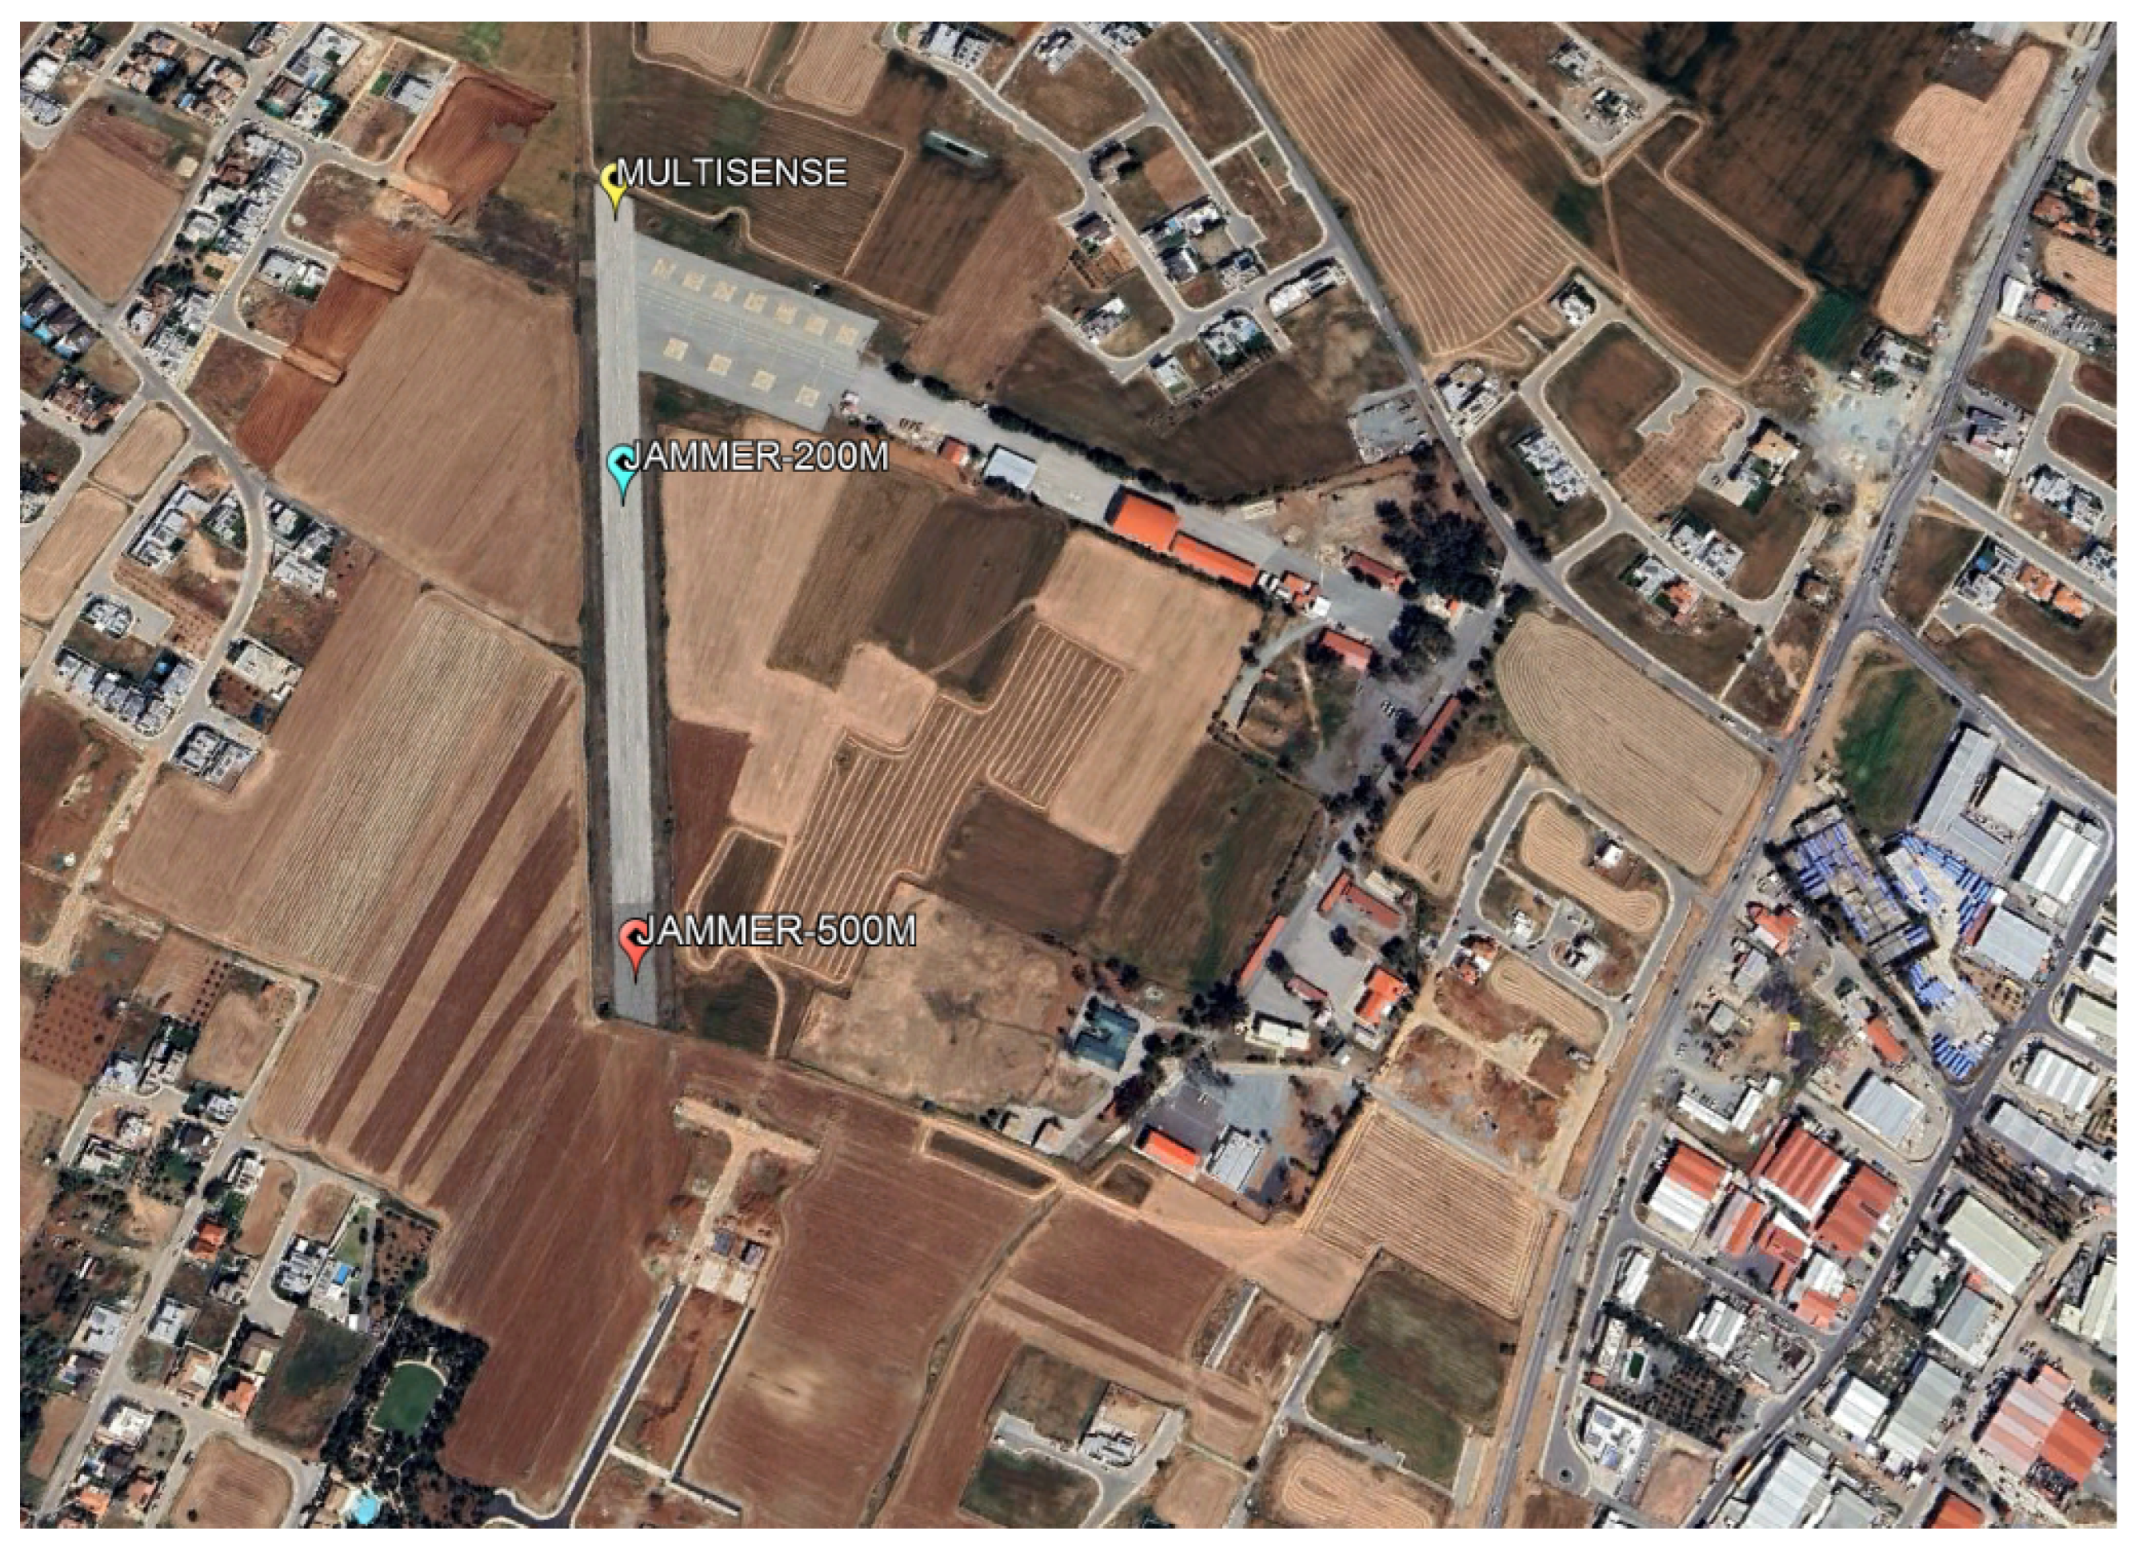
4.1. Test Environment

The experimentation setup included the sensors developed for the purpose of this research, based on the logarithmic amplifiers and RF chain, as described in Section 3.1 and Figure 1, and an RF jamming system able to provide 48 and 45 dBm of EIRP RF jamming power at 2.4 and 5.8 dBm; the antennas of the system used were the directional antennas described in Section 3.3 and Figure 4. A DJI mini pro 3 drone, a real time spectrum analyzer, SMB200, from signal hound, and a security operation platform (SOC) based on OpenSearch were also used for collecting and visualizing the alarms. The SOC is designed around OpenSearch, which incorporates built-in machine learning capabilities, while visualization is achieved through an OpenSearch dashboard system. RF sensor alerts and raw data are securely sent through a VPN tunnel to the SOC, and over an MQTTs connection, where the SOC filters select fields from the alerts and raw data for the purpose of visualization. Sensor position and ID, timestamps, environment RF levels and RF jamming levels, alerts, and other information are sent over to the SOC.
For testing the performance of our system, we selected a small airfield, as shown in Figure 7, within a fenced area of 500 m × 500 m, which lies at the urban boundaries of a city. Such a scenario resembles a typical critical infrastructure area accommodating a power station, a data center, a telecommunications hub, or other critical infrastructures. It is not rare that these categories of infrastructures may lie at the proximity of an urban or semi-urban environment and they are typically fenced at a distance of several hundreds of meters to physically protect the critical assets.
The sensor was deployed at the north barrier of the runway, with the Vivaldi directional antenna facing south towards the other end of the runway (azimuth 180 , tilt 0 , and vertical polarization).
During the environment RF spectrum profiling procedure, the RF sensor recorded the m i n , m a x , a v e r a g e noise levels within a time slot of one hour before the execution of the experiment, as explained in Section 3.2.2. The values are presented in Table 3.
The above RF noise measurements for this specific environment are much higher than the recordings performed within the lab, as per Table 4, where all indoor wireless networks were deactivated. This inevitably will result in degraded RF sensing capabilities, especially in the 2.4 GHz band.

4.2. Experiment Setup and Measurements

Several scenarios were investigated during the system trials in the test environment. One scenario refers to a relative high-power sweep jamming attack detection, another to a relative low-power constant jamming attack detection, while the last was focused on drone RF profiling and detection thresholds. These scenarios are further analyzed below.

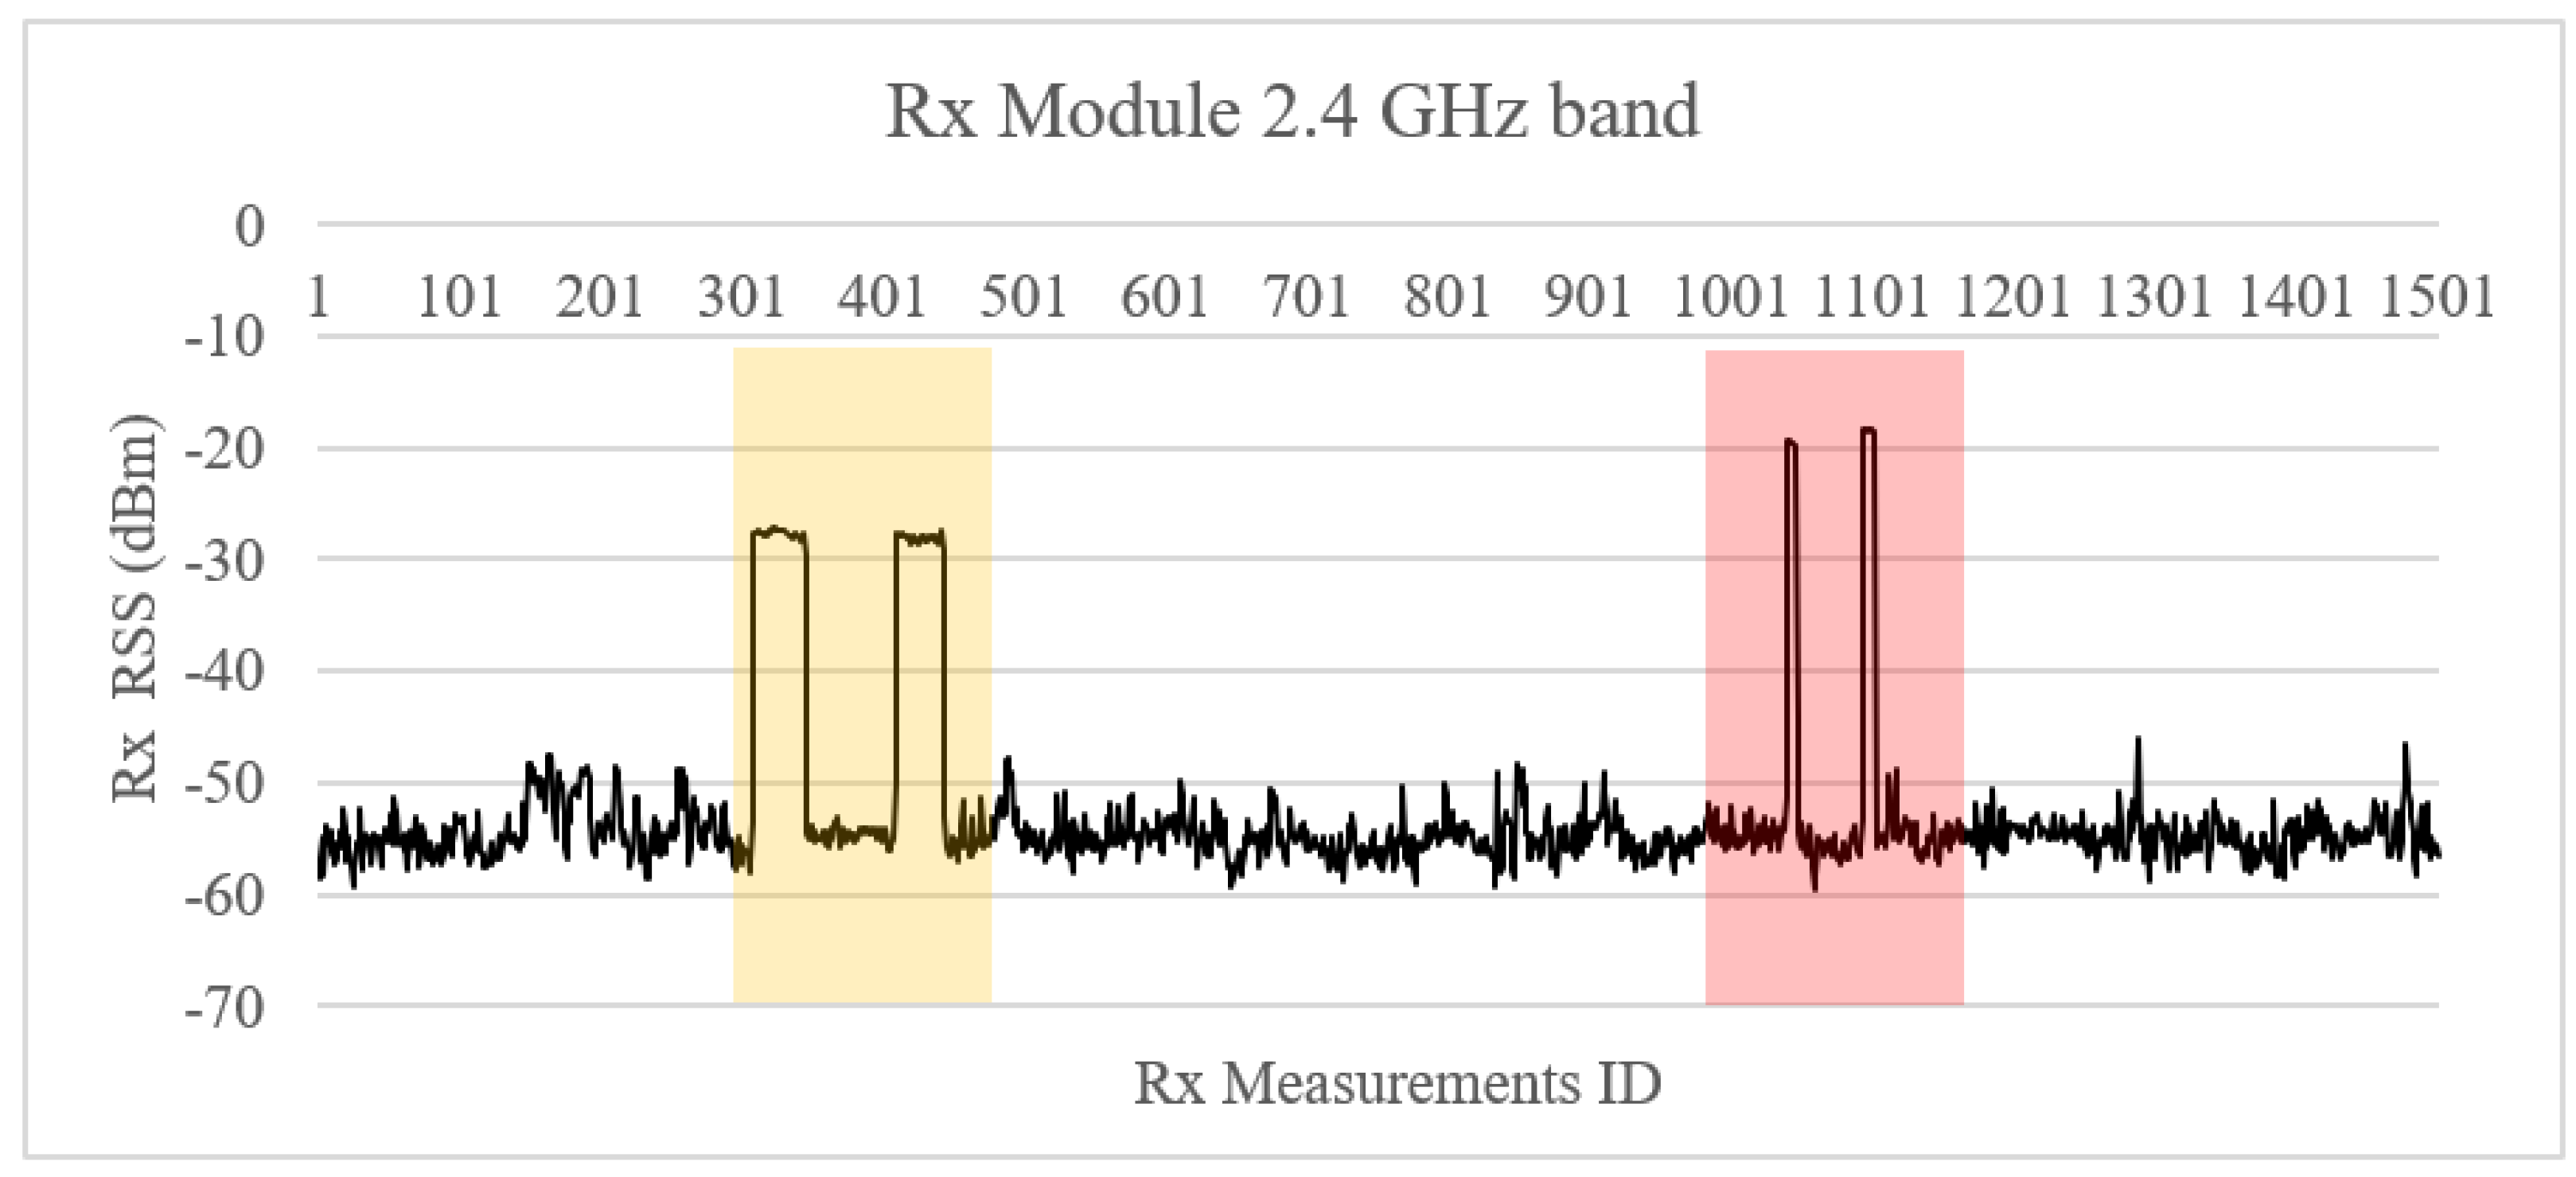
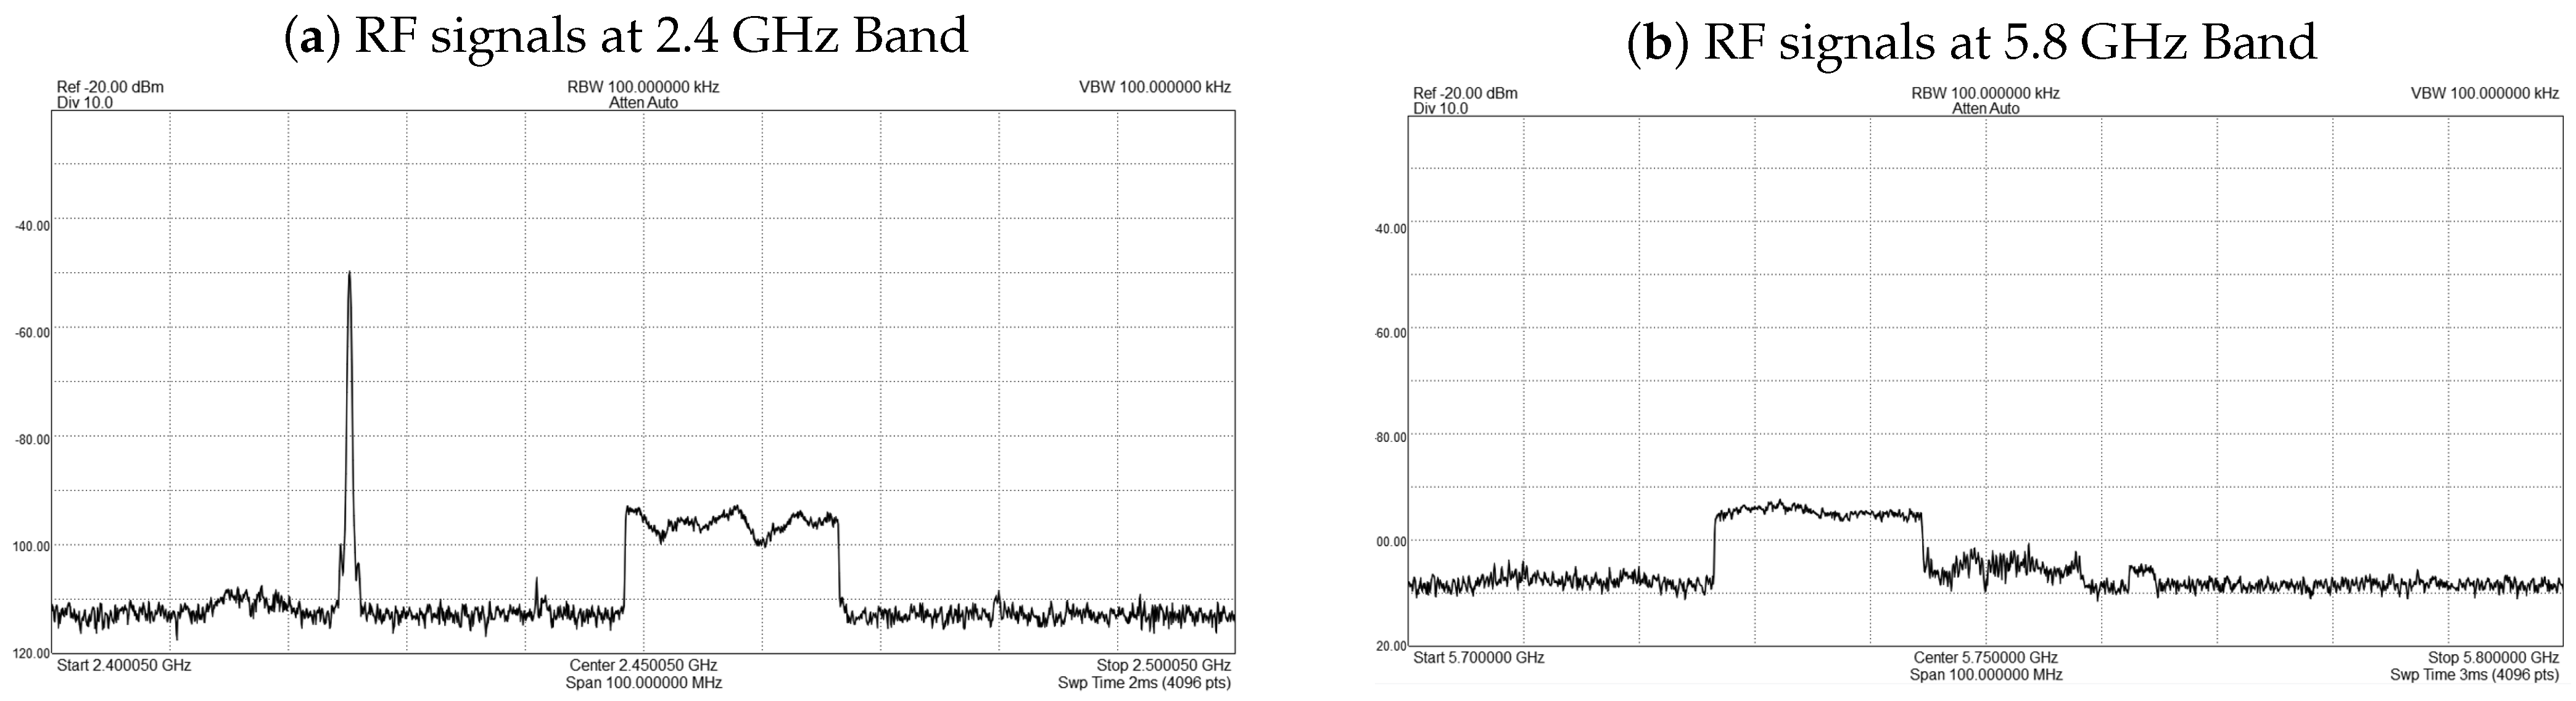
4.2.1. High-Power Frequency Sweep Jamming Attack in Both 2.4 GHz and 5.8 GHz Frequency Bands

In this scenario, the RF sensor was deployed at a distance of 200 m and 500 m from the jammer, respectively. At these specific distances and frequencies, the 1st Fresnel zone (r1) at the two frequencies of interest is presented in Table 5 below.
In theory, it is recommended to ensure obstacle avoidance and ground clearance at 80% of r1, while in practice a 60% clearance is typically adopted. Hence in our case, we deployed the Vivaldi antennas at a height of 2.50 m to minimize the effects of Fresnel zone disturbance. In practice, in a clear line of site setup, to avoid Fresnel zone obstructions, the sensor antenna must be placed on an elevated mast. To emulate a high-power jamming signal, an experimental jammer was developed and utilized, emitting 48 dBm EIRP at 2.4 GHz and 45 dBm EIRP at 5.8 GHz on a sweep jamming mode, within both band ranges. The high-power transmission at 500 m lasted 20 s and was repeated twice. The same experiment was also performed at 200 m.
Based on the performed profiling measurements, presented in Table 2 and Table 3, it becomes obvious that, in order to reduce the false-positive alerts, one has to consider in the ATL estimations the existing interfering signals. For example, to trigger with confidence a jamming alarm at 2.4 GHz, a J t o l should be set above the environment noise/interfering level. On this occasion, a J t o l = 10 dB was set for the 2.4 GHz band bringing the Alarm Threshold Level ( A T L > 45 dBm). Similarly, the same procedure can be carried out for the 5.8 GHz sensor and its profiled environment.
All jamming signals were clearly detected by the sensor, as depicted in Figure 8 and Figure 9. Consequently, an alarm was triggered and forwarded to the SOC.

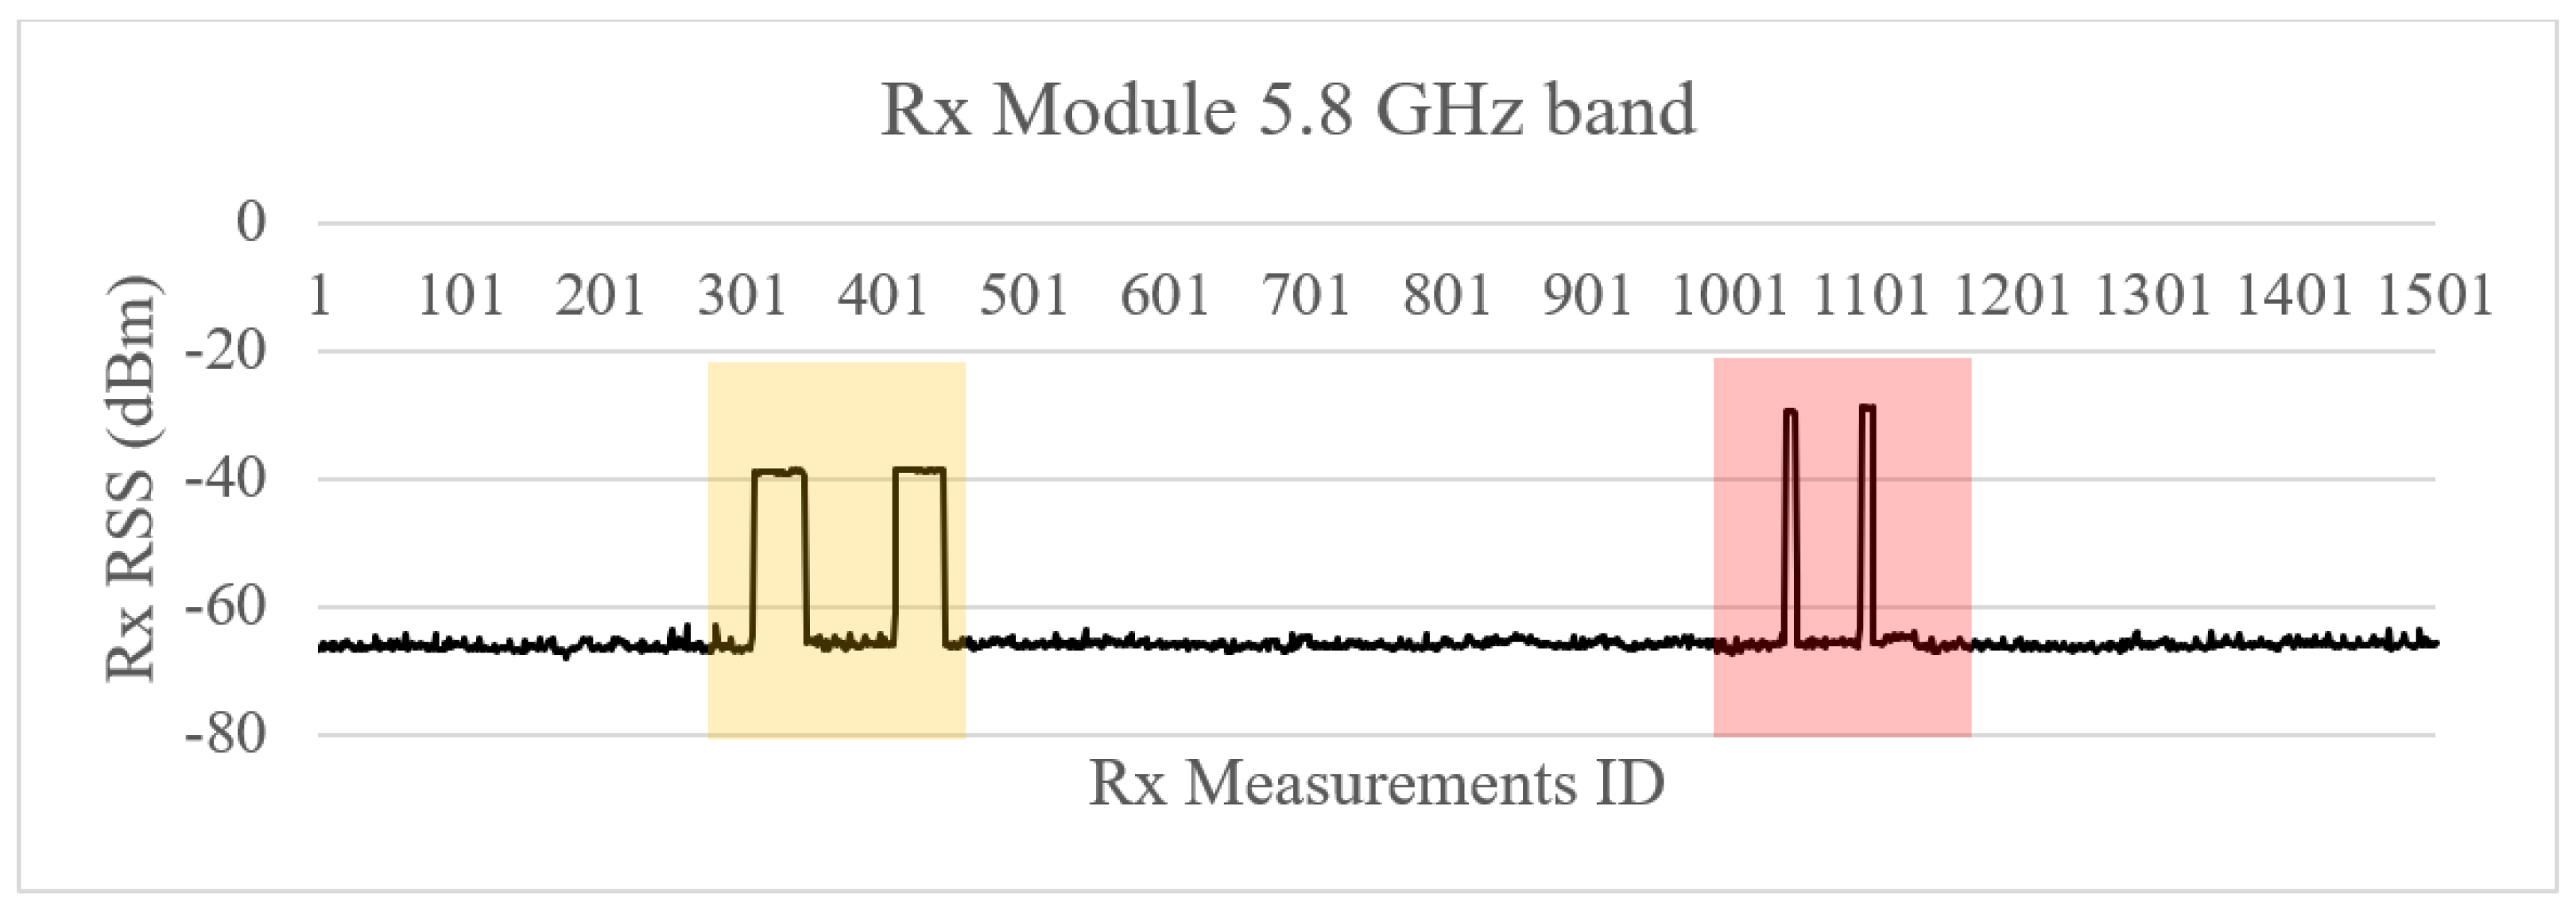
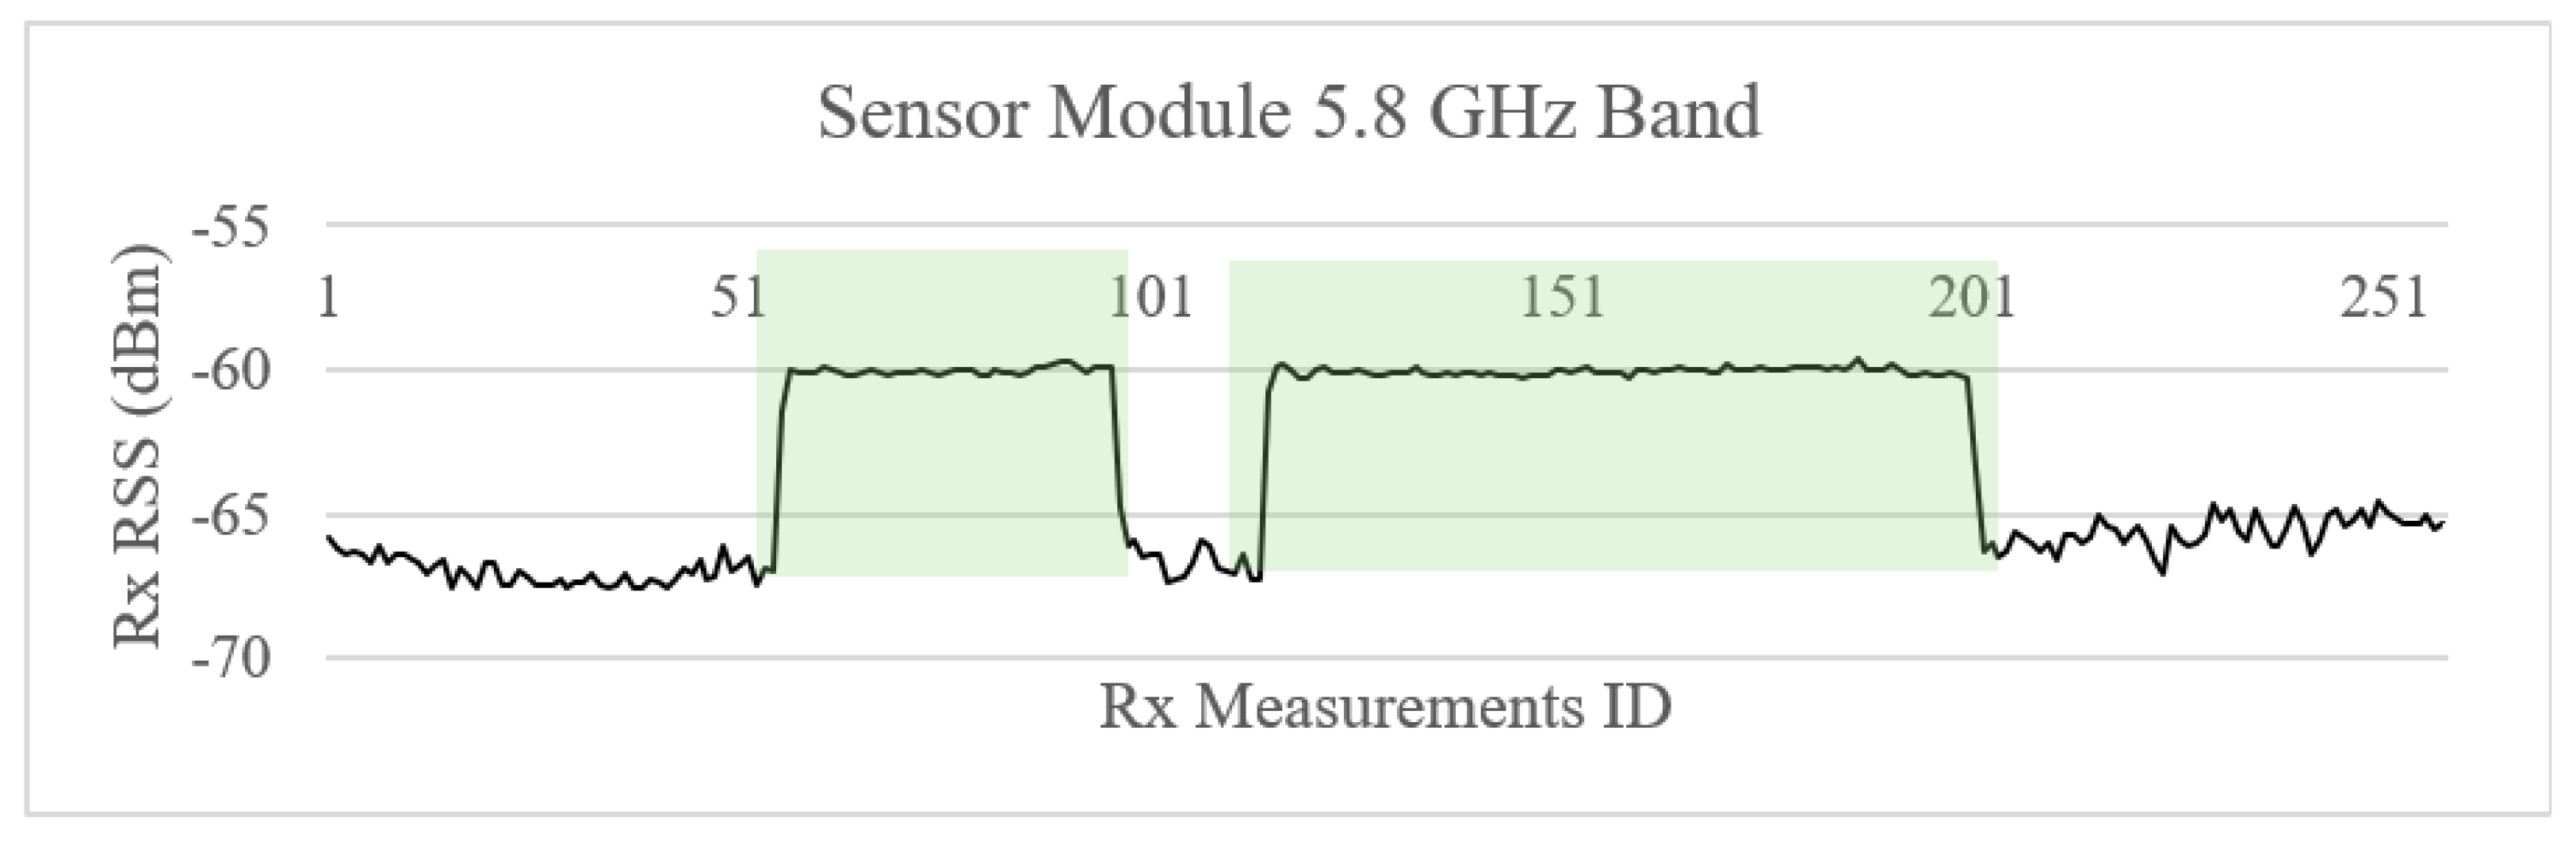
4.2.2. Low-Power Constant Jamming Attack in 5.8 GHz Frequency Band

The second scenario involved a lower-power jamming signal, emulating a much longer distance between the jammer and the sensor. For this scenario, jamming was only performed at 5.8 GHz, as shown in Table 3.
Low-power RF jamming was also emulated by using a Vaunix signal generator emitting only 10 dBm, at the central frequency of the band. The jamming was performed in two sequential bursts of 40 and 80 s, respectively. The signal was again detected, triggering an alarm, as shown in Figure 10, demonstrating the capabilities of the proposed sensor.

4.2.3. Drone Detection RF Profiling

We also examined the potential use case of detecting RF activity of a malicious COTS drone, assuming transmitting within the typical regulation limits (EU WiFi band up to 20 dBm). In this scenario, after estimating the free space loss and considering the received interference levels due to wideband monitoring in crowded RF bands, the expected maximum detection range cannot exceed 50–100 m. Although such a detection range does not seem ideal for drone sensing activities, it may still serve the purpose for dual scope sensor use.
To investigate the actual sensor behavior, we operated a DJI Mini 3 pro drone and recorded the RF activity (control signal and video streaming) at a distance of 150 m from the sensor, using an SMB200 20 GHz real-time Signal Hound spectrum analyzer that provides fast scanning speeds at 1 THz/s and increased sensitivity levels. During the first flight, the drone was configured on a dual band mode (2.4 GHz and 5.8 GHz), while on the second flight both control and video signals were set on the 2.4 GHz band. As depicted in Figure 11, the drone control signal appears with short duration spikes at −54.5 dBm, while the video streaming signal has a longer span but much lower power (<90 dBm), which cannot be detected by the proposed sensor. The subfigure on the left of Figure 11 represents the RF signals from the first flight where RF operation of the drone was restrained, from the remote control of the drone, to operate only in the 2.4 GHz band. As such, one can observe in the 2.4 GHz band both the RC signal as a spike and the video signal as a broadband RF signal. The subfigure on the right figure of Figure 11 represents the RF signals from the second flight where RF operation of the drone was allowed in both the 2.4 and 5.8 GHz bands. On this occasion, the RC signal remained in the 2.4 GHz band, but the broadband video signal in this occasion hopped into the 5.8 GHz band.

5. Performance Evaluation

In this section, we analyze the performance, usage scenarios with potential improvements, and limitations of the proposed low-cost RF sensor, based on the experimentation results.

5.1. Jamming Detection

The proposed RF sensor has been able to detect reliably constant and sweep jamming, forwarding RF raw data, and alarms over the RF threshold to a SOC for further processing. The jamming detection has been demonstrated up to 500 m, even with low-power jamming signals. The system capability to profile the deployment environment in time slots and implement the ATL algorithm allows for minimization of false-positive alarms, while, in the collaborative setup, it provides additional capabilities to the SOC for simultaneous monitoring of numerous critical infrastructures. The significant improvement of the false-positive rate (FPR) is depicted in Table 6 and Table 7, which summarize the analysis of the data retrieved during the experiment. In a number of recorded 2912 RSS measurements, involving 87 real jamming events, the ATL with k = 8 outperforms as follows:
Furthermore, by utilizing directional antennas and distributed RF sensors in the overall architecture, one can also estimate the direction and/or the location of the jamming source. This is the next step in future work. The SOC operators can also centrally utilize AI/ML models to better detect anomalies and increase the confidence level of a jamming attempt.

5.2. Drone Detection

In the current configuration, due to the overall wide bandwidth of the monitored 2.4 GHz and 5.8 GHz bands, the noise floor in urban and suburban areas is higher than the emitted drone signals, and hence they cannot be detected over distances more than 50 m with the proposed sensors. In order to improve drone detection capabilities, the authors propose the utilization of sharper RF filters, or a mixed architecture based on RF down-converting and narrowband RF/IF filtering. Nevertheless, the utilization of a series of sensors as suggested in this work, in a fence-like setup, could provide malicious drone early warning.

5.3. Limitations

The system design was based on an RF wideband logarithmic amplifier in order to provide flexibility on the band monitoring while keeping the costs low. It is primarily focused on jamming detection and for this scope it appears to serve its purpose. However, it cannot be used for detecting very low RF signals at long distances.

6. Conclusions

In this research paper, we have proposed a collaborative low-cost RF jamming detector, interconnected with a SOC, for centralized long-term monitoring and alerting. Each system sensor can be customized accordingly to monitor any band within the range of 1 MHz to 8 GHz, providing the capability for simultaneous monitoring of multiple bands and heterogeneous technologies. The developed sensors’ algorithm allows the self-calibration and time-depended environment RF profiling in order to minimize false-positive alerts and optimizes performance for each specific environment. It supports TCP/IP interconnection of multiple sensors, which can be deployed in multiple areas of interest, offering holistic early warning and localization possibility of RF jamming sources. Future work includes:
  • The deployment and testing of several collaborative sensors utilizing multiple direction antennas for jamming source localization with AoA/DoA and triangulation techniques.
  • Implementation of an RF down-converting receiver chain and integration of sharper RF filters to improve the system sensitivity for the purpose of supporting simple drone activity detection at longer distances.
  • Implementation of AI/ML techniques at the SOC level for optimized detection of RF spectrum anomalies from several distributed sensors.

Author Contributions

All authors contributed equally. All authors have read and agreed to the published version of the manuscript.

Funding

This work was supported by RESTART 2016-2020 Programme and co-funded by the European Union and the Research Innovation Foundation of the Republic of Cyprus, under MULISENSE project (Multi-domain wireless threat detection sensors for security operations centres) with contract number ENTERPRISES/0521/0203.

Informed Consent Statement

Not Applicable.

Data Availability Statement

Data is contained within the article.

Acknowledgments

This work is gratefully acknowledged with the support of the RESTART 2016-2020 program, co-funded by the European Union and the Research and Innovation Foundation of the Republic of Cyprus, under the MULTISENSE project (Multi-domain Wireless Threat Detection Sensors for Security Operations Centers), with contract No. ENTERPRISES/0521/0203.

Conflicts of Interest

Authors Georgios Michalis, Loizos Kanaris, Akis Kokkinis and Pantelis Kanaris were employed by the company Sigint Solutions Ltd. The remaining authors declare that the research was conducted in the absence of any commercial or financial relationships that could be construed as a potential conflict of interest.

Abbreviations

The following abbreviations are used in this manuscript:
5G5th generation
AoAAngle of arrival
AIArtificial Intelligence
BERBit error rate
C/NoCarrier-to-Noise density power ratio
CRNCognitive radio networks
DLDeep learning
DoADirection of arrival
DoSDenial of Service
ECCError-correcting code
GNSSGlobal Navigation Satellite System
GPSGlobal Positioning System
GUIGraphical User Interface
IoTInternet of Things
IoEInternet of Everything
JIJamming index
LNALow-noise amplifier
LOSLine-of-sight
MDPIMultidisciplinary Digital Publishing Institute
MaMIMOMassive MIMO
MIMOMultiple-input multiple-output
MLMachine learning
mmWaveMillimeter Wave
MQTTsSecure Message Queuing Telemetry Transport
NLOSNon-line-of-sight
NOMANon-orthogonal multiple access
OFDMOrthogonal frequency division multiplexing
RSSReceived signal strength
RSSIReceived signal strength indicator
SDR  Software-defined radio
SDNSoftware-defined networking
SNRSignal-to-noise ratio
SoISignal of interest
SOCSecurity operations center
TAL(RSS) Threshold Alert Level
UAVUnmanned aerial vehicle
WLAN    Wireless Local Area Network
WSNWireless Sensors Network

References

  1. Sinha, D.; Verma, A.K.; Kumar, S. Software defined radio: Operation, challenges and possible solutions. In Proceedings of the 2016 10th International Conference on Intelligent Systems and Control (ISCO), Coimbatore, India, 7–8 January 2016; pp. 1–5. [Google Scholar] [CrossRef]
  2. Xia, W.; Wen, Y.; Foh, C.H.; Niyato, D.; Xie, H. A Survey on Software-Defined Networking. IEEE Commun. Surv. Tutorials 2015, 17, 27–51. [Google Scholar] [CrossRef]
  3. Shen, X.; Liu, Y.; Zhao, L.; Huang, G.L.; Shi, X.; Huang, Q. A Miniaturized Microstrip Antenna Array at 5G Millimeter-Wave Band. IEEE Antennas Wirel. Propag. Lett. 2019, 18, 1671–1675. [Google Scholar] [CrossRef]
  4. Björnson, E.; Sanguinetti, L. Scalable Cell-Free Massive MIMO Systems. IEEE Trans. Commun. 2020, 68, 4247–4261. [Google Scholar] [CrossRef]
  5. Makki, B.; Chitti, K.; Behravan, A.; Alouini, M.S. A Survey of NOMA: Current Status and Open Research Challenges. IEEE Open J. Commun. Soc. 2020, 1, 179–189. [Google Scholar] [CrossRef]
  6. Naderializadeh, N.; Maddah-Ali, M.A.; Avestimehr, A.S. Cache-Aided Interference Management in Wireless Cellular Networks. IEEE Trans. Commun. 2019, 67, 3376–3387. [Google Scholar] [CrossRef]
  7. Yu, P.; Zhou, F.; Zhang, X.; Qiu, X.; Kadoch, M.; Cheriet, M. Deep Learning-Based Resource Allocation for 5G Broadband TV Service. IEEE Trans. Broadcast. 2020, 66, 800–813. [Google Scholar] [CrossRef]
  8. Pelechrinis, K.; Iliofotou, M.; Krishnamurthy, S.V. Denial of Service Attacks in Wireless Networks: The Case of Jammers. IEEE Commun. Surv. Tutorials 2011, 13, 245–257. [Google Scholar] [CrossRef]
  9. KanikaLim, G.; Qing, A. Jamming and Anti-jamming and Techniques in Wireless Networks: A Survey. Int. J. Hoc Ubiquitous Comput. 2014, 17, 197–215. [Google Scholar]
  10. Ali, A.S.; Baddeley, M.; Bariah, L.; Lopez, M.A.; Lunardi, W.T.; Giacalone, J.P.; Muhaidat, S. JamRF: Performance Analysis, Evaluation, and Implementation of RF Jamming over Wi-Fi. IEEE Access 2022, 10, 133370–133384. [Google Scholar] [CrossRef]
  11. Hossein, P.; Huacheng, Z. Jamming Attacks and Anti-Jamming Strategies in Wireless Networks: A Comprehensive Survey. IEEE Commun. Surv. Tutorials 2022, 24, 767–809. [Google Scholar] [CrossRef]
  12. Karhima, T.; Silvennoinen, A.; Hall, M.; Haggman, S.G. IEEE 802.11b/g WLAN tolerance to jamming. In Proceedings of the IEEE MILCOM 2004, Military Communications Conference, Monterey, CA, USA, 31 October–3 November 2004. [Google Scholar]
  13. Jun, L.; Andrian, J.H.; Zhou, C. Bit Error Rate Analysis of jamming for OFDM systems. In Proceedings of the 2007 Wireless Telecommunications Symposium, Pomona, CA, USA, 26–28 April 2007; pp. 1–8. [Google Scholar] [CrossRef]
  14. Gvozdenovic, S.; Becker, J.K.; Mikulskis, J.; Starobinski, D. Truncate after preamble: PHY-based starvation attacks on IoT networks. In Proceedings of the 13th ACM Conference on Security and Privacy in Wireless and Mobile Networks (WiSec’20), New York, NY, USA, 8–10 July 2020; pp. 89–98. [Google Scholar] [CrossRef]
  15. Bayraktaroglu, E.; King, C.; Liu, X.; Noubir, G.; Rajaraman, R.; Thapa, B. Performance of IEEE 802.11 under jamming. Mob. Netw. Appl. 2013, 18, 678–696. [Google Scholar] [CrossRef]
  16. Cai, Y.; Pelechrinis, K.; Wang, X.; Krishnamurthy, P.; Mo, Y. Joint reactive jammer detection and localization in an enterprise WiFi network. Comput. Netw. 2013, 57, 3799–3811. [Google Scholar] [CrossRef]
  17. Yan, Q.; Zeng, H.; Jiang, T.; Li, M.; Lou, W.; Hou, Y.T. Jamming Resilient Communication Using MIMO Interference Cancellation. IEEE Trans. Inf. Forensics Secur. 2016, 11, 1486–1499. [Google Scholar] [CrossRef]
  18. Schulz, M.; Gringoli, F.; Steinmetzer, D.; Koch, M.; Hollick, M. Massive reactive smartphone-based jamming using arbitrary waveforms and adaptive power control. In Proceedings of the 10th ACM Conference on Security and Privacy in Wireless and Mobile Networks, New York, NY, USA, 18–20 July 2017; pp. 111–121. [Google Scholar]
  19. Proaño, A.; Lazos, L. Selective Jamming Attacks in Wireless Networks. In Proceedings of the 2010 IEEE International Conference on Communications, Cape Town, South Africa, 23–27 May 2010; pp. 1–6. [Google Scholar] [CrossRef]
  20. Zhou, Q.; Li, Y.; Niu, Y. A Countermeasure Against Random Pulse Jamming in Time Domain Based on Reinforcement Learning. IEEE Access 2020, 8, 97164–97174. [Google Scholar] [CrossRef]
  21. Sudha, I.; Mustafa, M.A.; Suguna, R.; Karupusamy, S.; Ammisetty, V.; Shavkatovich, S.N.; Ramalingam, M.; Kanani, P. Pulse jamming attack detection using swarm intelligence in wireless sensor networks. Optik 2023, 272, 170251. [Google Scholar] [CrossRef]
  22. Kumuda, D.K.; Vandana, G.S.; Pardhasaradhi, B.; Raghavendra, B.S.; Srihari, P.; Cenkeramaddi, L.R. Multitarget Detection and Tracking by Mitigating Spot Jammer Attack in 77-GHz mm-Wave Radars: An Experimental Evaluation. IEEE Sens. J. 2023, 23, 5345–5361. [Google Scholar] [CrossRef]
  23. Elezi, E.; Çankaya, G.; Boyacı, A.; Yarkan, S. A detection and identification method based on signal power for different types of Electronic Jamming attacks on GPS signals. In Proceedings of the 2019 IEEE 30th Annual International Symposium on Personal, Indoor and Mobile Radio Communications (PIMRC), Istanbul, Turkey, 8–11 September 2019; pp. 1–5. [Google Scholar] [CrossRef]
  24. Purwar, A.; Joshi, D.; Chaubey, V.K. GPS signal jamming and anti-jamming strategy—A theoretical analysis. In Proceedings of the 2016 IEEE Annual India Conference (INDICON), Bangalore, India, 16–18 December 2016; pp. 1–6. [Google Scholar] [CrossRef]
  25. Ma, D.; Wang, Y.; Wu, S. Against Jamming Attack in Wireless Communication Networks: A Reinforcement Learning Approach. Electronics 2024, 13, 1209. [Google Scholar] [CrossRef]
  26. Junfei, Y.; Jingwen, L.; Bing, S.; Yuming, J. Barrage Jamming Detection and Classification Based on Convolutional Neural Network for Synthetic Aperture Radar. In Proceedings of the IGARSS 2018—2018 IEEE International Geoscience and Remote Sensing Symposium, Valencia, Spain, 22–27 July 2018; pp. 4583–4586. [Google Scholar] [CrossRef]
  27. Capotă, C.; Popescu, M.; Bădulă, E.M.; Halunga, S.; Fratu, O.; Popescu, M. Intelligent Jammer on Mobile Network LTE Technology: A Study Case in Bucharest. Appl. Sci. 2023, 13, 12286. [Google Scholar] [CrossRef]
  28. Zhou, Q.; Niu, Y. From Adaptive Communication Anti-Jamming to Intelligent Communication Anti-Jamming: 50 Years of Evolution. Adv. Intell. Syst. 2024, 6. [Google Scholar] [CrossRef]
  29. Lu, Z.; Wang, W.; Wang, C. Modeling, Evaluation and Detection of Jamming Attacks in Time-Critical Wireless Applications. IEEE Trans. Mob. Comput. 2014, 13, 1746–1759. [Google Scholar] [CrossRef]
  30. Yang, H.; Shi, M.; Xia, Y.; Zhang, P. Security Research on Wireless Networked Control Systems Subject to Jamming Attacks. IEEE Trans. Cybern. 2019, 49, 2022–2031. [Google Scholar] [CrossRef] [PubMed]
  31. Cheng, M.; Ling, Y.; Wu, W.B. Time Series Analysis for Jamming Attack Detection in Wireless Networks. In Proceedings of the GLOBECOM 2017—2017 IEEE Global Communications Conference, Singapore, 4–8 December 2017; pp. 1–7. [Google Scholar] [CrossRef]
  32. Reyes, H.; Kaabouch, N. Jamming and Lost Link Detection in Wireless Networks with Fuzzy Logic. Int. J. Sci. Eng. Res. 2013, 4, 1–7. [Google Scholar]
  33. Abdulkawi, A.; Saleh, T.S.; Khattab, S.; Farag, I. Anti-jamming defense in wireless networks using channel hopping and error correcting code. In Proceedings of the 2012 8th International Conference on Informatics and Systems (INFOS), Giza, Egypt, 14–16 May 2012; pp. NW-12–NW-17. [Google Scholar]
  34. Marttinen, A.; Wyglinski, A.M.; Jantti, R. Statistics-Based Jamming Detection Algorithm for Jamming Attacks against Tactical MANETs. In Proceedings of the 2014 IEEE Military Communications Conference, Baltimore, MD, USA, 6–8 October 2014. [Google Scholar] [CrossRef]
  35. Akhlaghpasand, H.; Razavizadeh, S.M.; Bjornson, E.; Do, T.T. Jamming Detection in Massive MIMO Systems. IEEE Wirel. Commun. Lett. 2018, 7, 242–245. [Google Scholar] [CrossRef]
  36. Borio, D.; Gioia, C. Real-time jamming detection using the sum-of-squares paradigm. In Proceedings of the 2015 International Conference on Localization and GNSS (ICL-GNSS), Gothenburg, Sweden, 22–24 June 2015; pp. 1–6. [Google Scholar] [CrossRef]
  37. Zahra, F.T.; Bostanci, Y.S.; Soyturk, M. Real-Time Jamming Detection in Wireless IoT Networks. IEEE Access 2023, 11, 70425–70442. [Google Scholar] [CrossRef]
  38. Strasser, M.; Danev, B.; Čapkun, S. Detection of reactive jamming in sensor networks. ACM Trans. Sens. Netw. 2010, 7, 1–29. [Google Scholar] [CrossRef]
  39. Puñal, O.; Aktaş, I.; Schnelke, C.J.; Abidin, G.; Wehrle, K.; Gross, J. Machine learning-based jamming detection for IEEE 802.11: Design and experimental evaluation. In Proceedings of the Proceeding of IEEE International Symposium on a World of Wireless, Mobile and Multimedia Networks 2014, Sydney, NSW, Australia, 19 June 2014; pp. 1–10. [Google Scholar] [CrossRef]
  40. Arjoune, Y.; Salahdine, F.; Islam, M.S.; Ghribi, E.; Kaabouch, N. A Novel Jamming Attacks Detection Approach Based on Machine Learning for Wireless Communication. In Proceedings of the 2020 International Conference on Information Networking (ICOIN), Barcelona, Spain, 7–10 January 2020; pp. 459–464. [Google Scholar] [CrossRef]
  41. Hussain, A.; Abughanam, N.; Qadir, J.; Mohamed, A. Jamming Detection in IoT Wireless Networks: An Edge-AI Based Approach. In Proceedings of the 12th International Conference on the Internet of Things, New York, NY, USA, 7–10 November 2022. [Google Scholar] [CrossRef]
  42. Sciancalepore, S.; Kusters, F.; Abdelhadi, N.K.; Oligeri, G. Jamming Detection in Low-BER Mobile Indoor Scenarios via Deep Learning. IEEE Internet Things J. 2024, 11, 14682–14697. [Google Scholar] [CrossRef]
  43. Li, Y.; Pawlak, J.; Price, J.; Al Shamaileh, K.; Niyaz, Q.; Paheding, S.; Devabhaktuni, V. Jamming Detection and Classification in OFDM-Based UAVs via Feature- and Spectrogram-Tailored Machine Learning. IEEE Access 2022, 10, 16859–16870. [Google Scholar] [CrossRef]
  44. Greco, C.; Pace, P.; Basagni, S.; Fortino, G. Jamming detection at the edge of drone networks using Multi-layer Perceptrons and Decision Trees. Appl. Soft Comput. 2021, 111, 107806. [Google Scholar] [CrossRef]
  45. Allahham, M.S.; Al-Sa’d, M.F.; Al-Ali, A.; Mohamed, A.; Khattab, T.; Erbad, A. DroneRF dataset: A dataset of drones for RF-based detection, classification and identification. Data Brief 2019, 26, 104313. [Google Scholar] [CrossRef]
Figure 1. RF sensor connectivity outline.
Information 15 00752 g001
Figure 2. RF sensor to SOC connectivity outline.
Information 15 00752 g002
Figure 3. RF sensor system calibration.
Information 15 00752 g003
Figure 4. Vivaldi directional antenna.
Information 15 00752 g004
Figure 5. Min and Max RF input levels.
Information 15 00752 g005
Figure 6. Visualized sensor data in a SOC.
Information 15 00752 g006
Figure 7. Small city airfield.
Information 15 00752 g007
Figure 8. High-power sweep jamming detection at 2.4 GHz band.
Information 15 00752 g008
Figure 9. High-power sweep jamming detection at 5.8 GHz band.
Information 15 00752 g009
Figure 10. Low-power jamming detection at 5.8 GHz band.
Information 15 00752 g010
Figure 11. DJI Mavic 3 Pro RF signals at 150 m.
Information 15 00752 g011
Table 1. Strengths and limitations of jamming attack methods.
Jamming Attack TypeStrengthsLimitations
Constant Jamming
-
Simple to implement.
-
Highly effective in disrupting communication.
-
Easily detectable due to continuous interference.
-
Requires high power for constant transmission.
Deceptive Jamming
-
Harder to detect since it mimics legitimate communication.
-
Wastes network resources.
-
Less effective in completely blocking communications.
-
Detection requires deeper packet analysis.
Random Jamming
-
Conserves attacker’s energy by alternating jamming and non-jamming periods.
-
Less disruptive compared with constant jamming.
-
Random nature makes it less consistent in impact.
Reactive Jamming
-
Energy-efficient since it only jams when legitimate transmission is detected.
-
Difficult to detect due to intermittent activity.
-
Complex timing requirements for effective attack.
-
Can be bypassed with sophisticated countermeasures.
Selective Jamming
-
Targets critical channels or communications.
-
High disruption with minimal power consumption.
-
Requires knowledge of the system to be targeted.
-
Limited to specific channels, not broad-spectrum.
Pulse Jamming
-
Effective in disrupting certain modulation schemes.
-
Can bypass some anti-jamming measures.
-
Less efficient for long-duration jamming.
-
Can be countered with advanced detection algorithms.
Spot Jamming
-
Focused disruption on a single frequency or band.
-
Highly effective if the frequency is critical.
-
Easily detectable due to narrowband attack.
-
Limited scope; can be bypassed by frequency hopping.
Sweep Jamming
-
Can cover a broad range of frequencies, disrupting multiple channels.
-
Requires significant power.
-
Less efficient than targeted jamming methods.
Barrage Jamming
-
Disrupts multiple frequencies simultaneously.
-
Highly effective in broad-spectrum attacks.
-
High power consumption.
-
Easily detectable due to large interference area.
Intelligent Jamming
-
Adapts based on the system’s response, making it highly efficient.
-
Harder to counter due to its adaptive nature.
-
Requires advanced machine learning techniques.
-
Complex to implement and may be computationally expensive.
Table 2. RF sensor system losses.
NoComponentLoss (dB)
1Internal RF cables and connectors−5.0
2RF Coupler loss−4.0
3RF Filter loss−3.0
TOTAL−12.0
Table 3. Environment RF spectrum profile.
Interference@2.4 GHzInterference@5.8 GHz
Min (dBm)−67.4−70.2
Max (dBm)−47.3−61.5
Average (dBm)−57.2−66.3
Table 4. Laboratory RF spectrum profile.
Interference@2.4 GHzInterference@5.8 GHz
Min (dBm)−79.5−71.8
Max (dBm)−71.5−65.3
Average (dBm)−78.8−70.9
Table 5. 1st Fresnel zone.
Tx-Rx Distance (m)2.4 GHz5.8 GHz
2002.50 m1.61 m
5003.95 m2.54 m
Table 6. Comparison between Env. Max and ATL algorithm configurations (2.4 GHz band).
MethodTriggersFalse PositivesFalse-Positive Rate (FPR)Precision (%)
Env. Max169822.90%51.48%
ATL (k = 2)120331.17%72.50%
ATL (k = 4)113260.92%77.00%
ATL (k = 6)109220.78%79.82%
ATL (k = 8)8920.07%97.75%
Table 7. Comparison between Env. Max and ATL algorithm configurations (5.8 GHz band).
MethodTriggersFalse PositivesFalse-Positive Rate (FPR)Precision (%)
Env. Max162752.65%53.70%
ATL (k = 2)147602.12%59.18%
ATL (k = 4)125381.35%69.60%
ATL (k = 6)102150.53%85.29%
ATL (k = 8)101140.50%86.14%
Disclaimer/Publisher’s Note: The statements, opinions and data contained in all publications are solely those of the individual author(s) and contributor(s) and not of MDPI and/or the editor(s). MDPI and/or the editor(s) disclaim responsibility for any injury to people or property resulting from any ideas, methods, instructions or products referred to in the content.

