Article

A Note on Equivalent and Nonequivalent Parametrizations of the Two-Parameter Logistic Item Response Model

by
Alexander Robitzsch
1,2
1
IPN—Leibniz Institute for Science and Mathematics Education, Olshausenstraße 62, 24118 Kiel, Germany
2
Centre for International Student Assessment (ZIB), Olshausenstraße 62, 24118 Kiel, Germany
Information 2024, 15(11), 668; https://doi.org/10.3390/info15110668
Submission received: 29 September 2024 / Revised: 22 October 2024 / Accepted: 22 October 2024 / Published: 23 October 2024
(This article belongs to the Section Information and Communications Technology)

Abstract

:
The two-parameter logistic (2PL) item response model is typically estimated using an unbounded distribution for the trait θ . In this article, alternative specifications of the 2PL models are investigated that consider a bounded or a positively valued θ distribution. It is highlighted that these 2PL specifications correspond to the partial membership mastery model and the Ramsay quotient model, respectively. A simulation study revealed that model selection regarding alternative ranges of the θ distribution can be successfully applied. Different 2PL specifications were additionally compared for six publicly available datasets.

1. Introduction

Let X = ( X 1 , , X I ) be a vector of I binary (i.e., dichotomous) random variables X i ( i = 1 , , I ) that are also referred to as items or item responses. A unidimensional item response theory (IRT) model [1,2] model parametrizes the multivariate distribution P ( X = x ) for x = ( x 1 , , x I ) { 0 , 1 } I as
P ( X = x ) = i = 1 I P i ( θ ; γ i ) x i 1 P i ( θ ; γ i ) 1 x i d F ( θ ) ,
where F is the distribution function of the latent trait θ (also referred to as the ability variable) that depends on some unknown model parameters. The quantity P i ( θ ) = P i ( θ ; γ i ) = P ( X i = 1 | θ ) is referred to as the item response function (IRF) for item i that depends on an item parameter,  γ i . The discrete multivariate distribution (1) entails that items i = 1 , , I are conditionally independent, given the latent trait θ . Additional identification constraints on item parameters, γ i , and distribution parameters must be imposed to ensure model identification [3].
An important class of IRT models is the logistic IRT model. The IRF in the two-parameter logistic (2PL) model [4] is given by
P i ( θ ) = exp a i ( θ b i ) 1 + exp a i ( θ b i ) = Ψ a i ( θ b i ) ,
where a i is item discriminations, b i is item difficulties, and Ψ denotes the logistic link function. In most applications, the ability variable θ is real-valued and unbounded; that is, θ ( , ) , and θ has no lower or upper bound. A normal distribution is often used in the 2PL model, but this assumption can be relaxed [5,6].
A frequently employed identification constraint in the 2PL model is a zero mean (i.e., E ( θ ) = 0 ) and a standard deviation (SD) of one (i.e., SD ( θ ) = 1 ) of the θ distribution. As an alternative, the item discrimination and the item difficulty of one reference item i 0 can be fixed; that is, a i 0 = 1 and b i 0 = 0 for some i 0 { 1 , , I } .
Some researchers question the utility of unbounded θ distributions in IRT models. In contrast, they suggest considering positively valued or bounded θ distributions [7]. In this article, we clarify how such modifications lead to equivalent or nonequivalent parametrizations of the 2PL model. It is demonstrated that the choice of the range of the  θ distribution can be empirically tested. Moreover, restricting the range in the θ distribution in the 2PL model implies that guessing or slipping behavior in IRFs can be accommodated.
The rest of the article is organized as follows. Section 2 presents different equivalent and nonequivalent parametrizations of the 2PL model. In particular, the case of the 2PL model with a bounded and a positively valued θ distribution is connected to previously suggested IRT models with different motivations compared to the 2PL model. Section 3 reports the findings of a simulation study that addresses the performance of model selection for 2PL model specifications with different θ distributions. Section 4 presents model comparisons for different 2PL specifications for six empirical datasets. Finally, the article closes with a discussion in Section 5.

2. Two-Parameter Item Response Models

In this section, several two-parameter IRT models equivalent and nonequivalent to the 2PL models are discussed. In Section 2.1 and Section 2.2, two two-parameter models are introduced that are statistically equivalent to the 2PL model with an unbounded θ variable. In Section 2.3, Section 2.4 and Section 2.5, 2PL models with a skewed, positive, and bounded θ variable, respectively, are discussed. Notably, these assumptions concerning the θ distribution refer to 2PL models that are nonequivalent to the 2PL model with a normal distribution assumption.

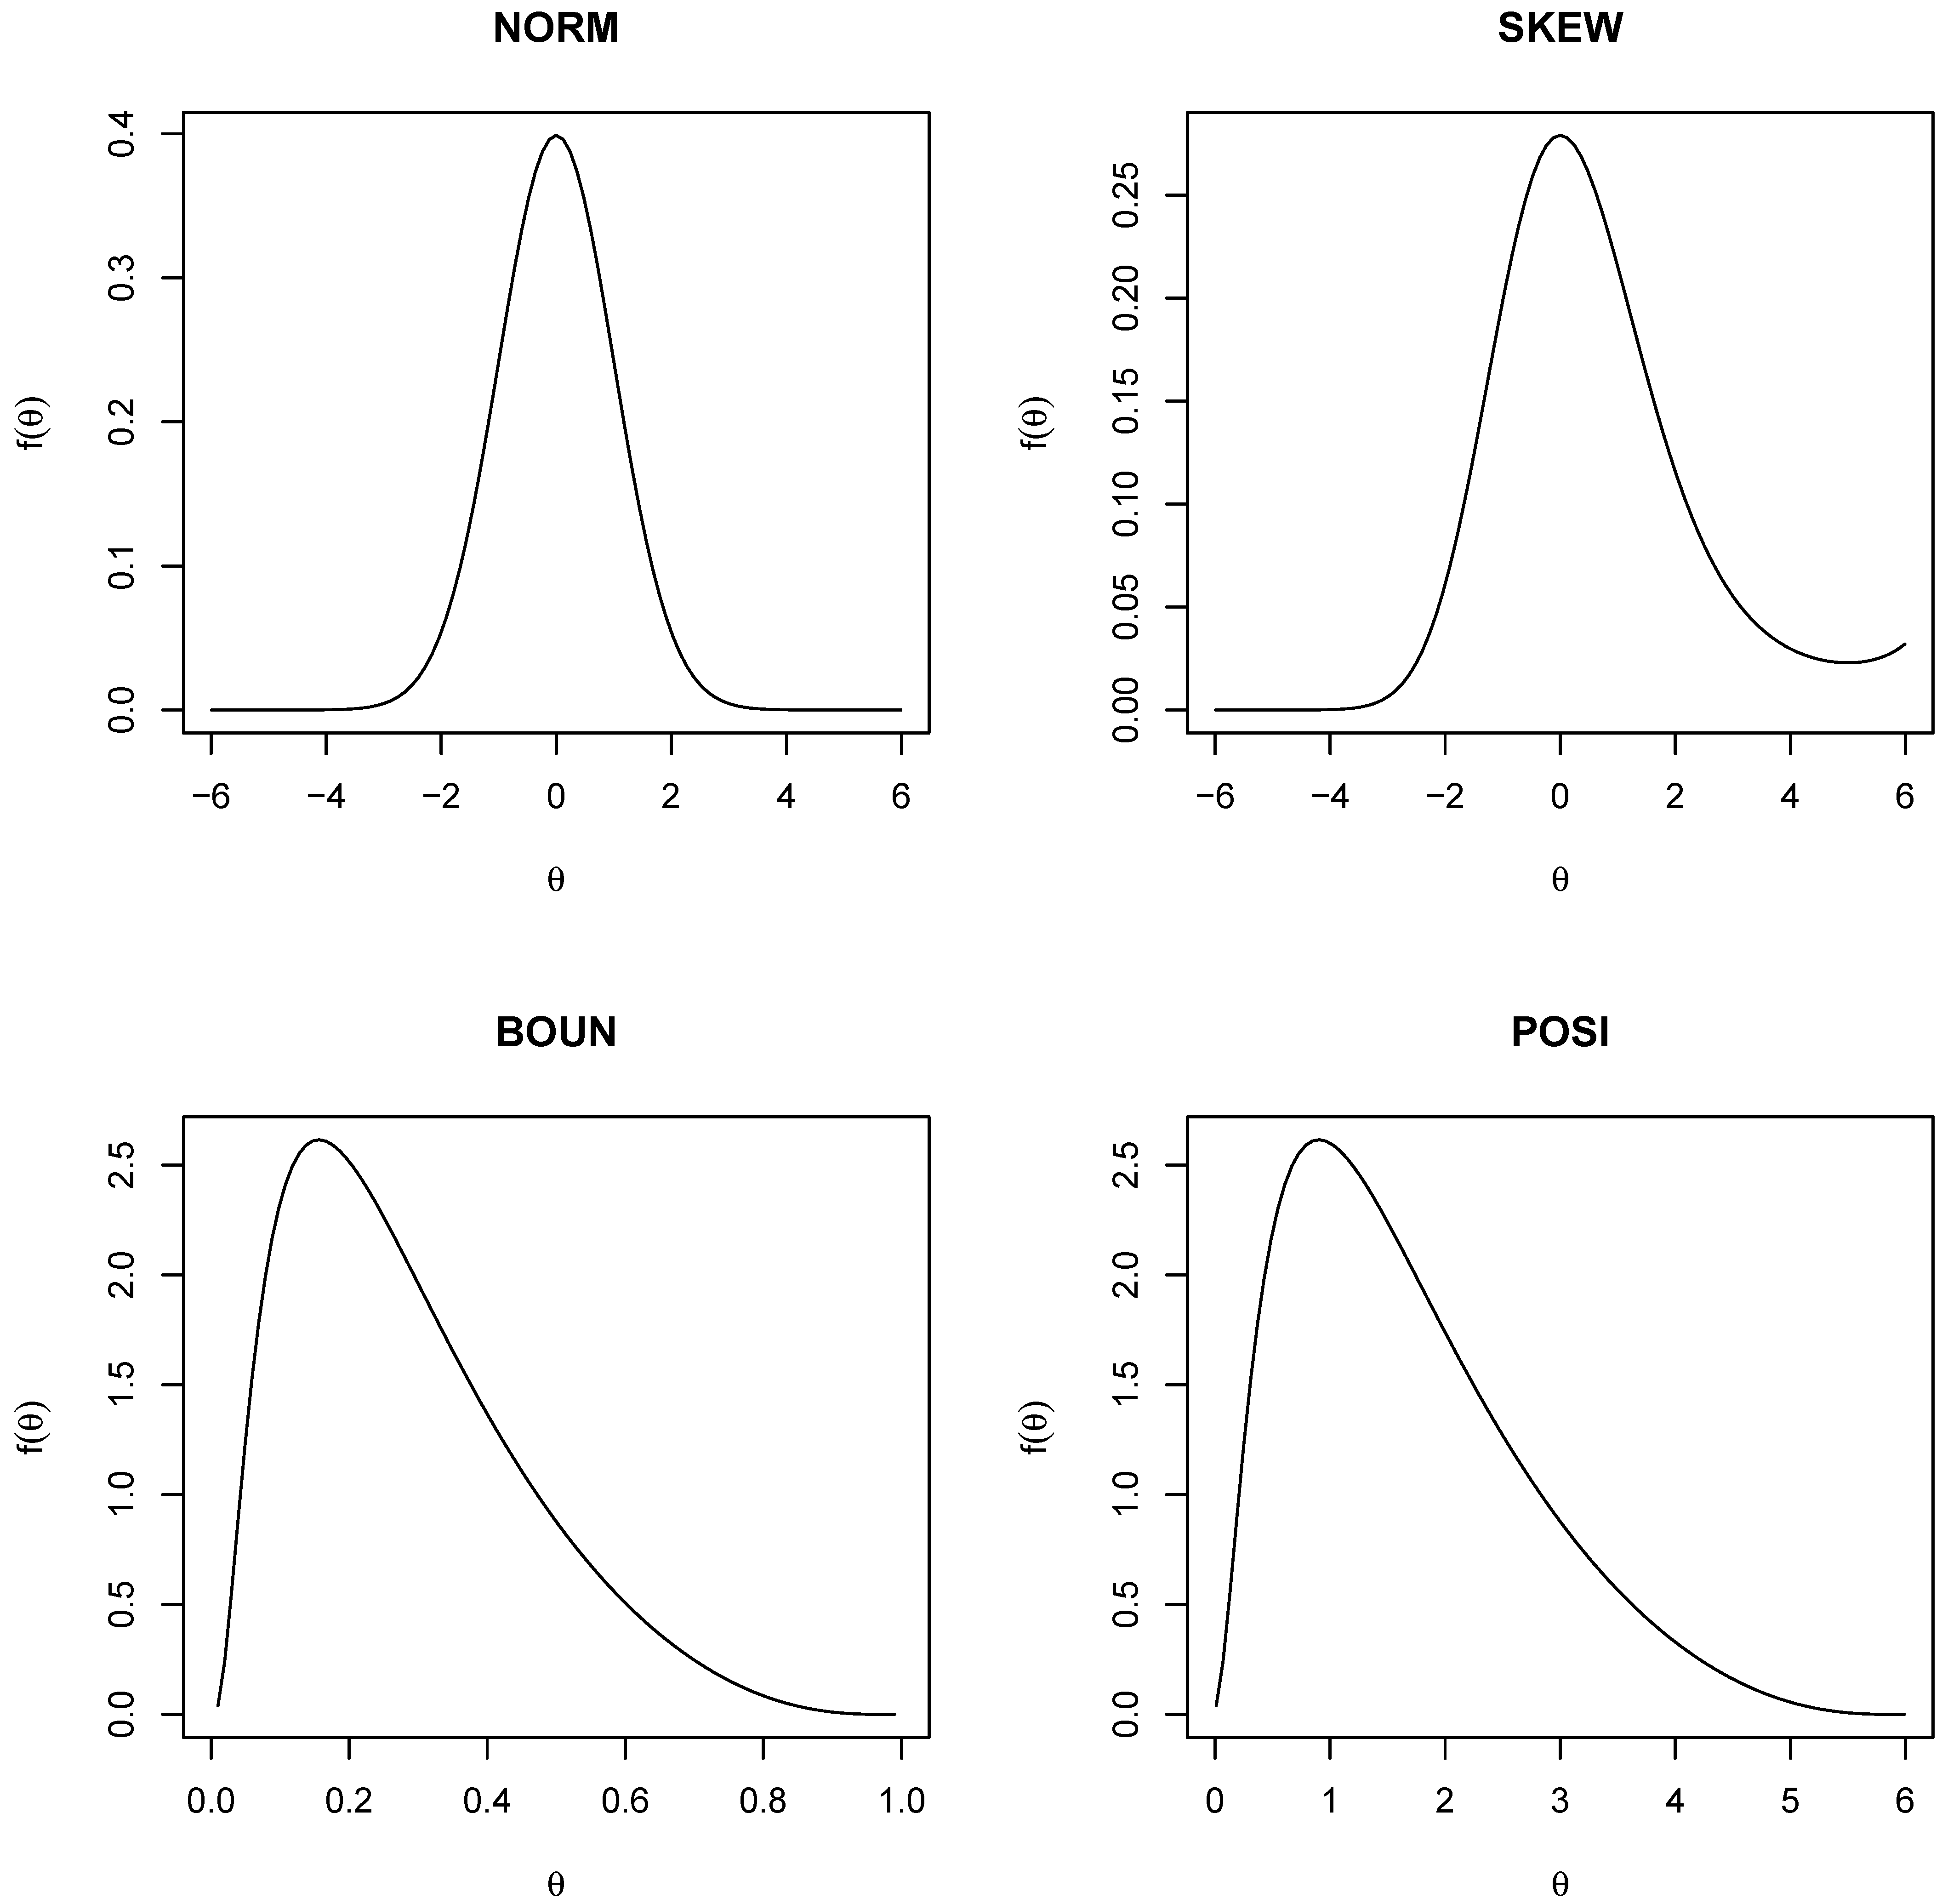
2.1. Unipolar IRT Model

In recent years, unipolar IRT models gained interest [7,8,9]. The random variable has a natural zero point in this IRT model. The unipolar IRT model for dichotomous items can be written as [10,11]
P ( X i = 1 | ξ ) = ( ξ / β i ) α i 1 + ( ξ / β i ) α i ,
where ξ is the positively valued random variable ξ , and α i and β i are positive item parameters. The IRT model in (3) can be expressed as
P ( X i = 1 | ξ ) = exp α i ( log ξ log β i ) 1 + exp α i ( log ξ log β i ) = Ψ a i ( θ b i ) = P ( X i = 1 | θ ) .
As pointed out in [11], the unipolar IRT model is equivalent to the 2PL model by defining  θ = log ξ , a i = α i , and b i = log β i . If a normal distribution is imposed on θ , a log-normal distribution for ξ follows. If the log-normal distribution is used for ξ when estimating the unipolar IRT model (3), the label log-logistic model has been proposed for the unipolar IRT model [10]. Also, note that θ has a fixed zero mean and a fixed SD of 1 for identification reasons if all item parameters are freely estimated.
Because of the equivalence of the unipolar IRT model (3) and the 2PL model (4), it is a matter of convenience or interpretational ease whether the bipolar trait θ ( , ) or the unipolar trait ξ ( 0 , ) is utilized in the IRT model. From a statistical perspective, the two models are indistinguishable (see also [12]) because the bijective transformation θ ξ = exp ( θ ) can always be applied. Researchers might consider the unipolar IRT model advantageous from a substantive point of view [7,10], but psychometrics cannot help in deciding on the appropriate metric for the latent variable in the IRT model.

2.2. Rational Function Model (RFM)

The rational function model (RFM; [13]) is an IRT model for a bounded ability variable,  δ , on the interval ( 0 , 1 ) . The IRF is defined as
P ( X i = 1 | δ ) = 1 1 + 1 δ δ β i 1 β i α i
with positive item parameters α i and β i . The IRT model (5) can be reformulated as
P ( X i = 1 | ξ ) = 1 1 + exp α i log δ 1 δ log β i 1 β i = Ψ a i ( θ b i ) = P ( X i = 1 | θ ) ,
when employing the transformed parameters
θ = log δ 1 δ = Ψ 1 ( δ ) , b i = log β i 1 β i = Ψ 1 ( β i ) , and a i = α i .
Hence, the RFM is equivalent to the 2PL model [14,15]. If a normal distribution is imposed on θ , a logistic normal distribution for δ follows [16,17].
As in the case of the unipolar IRT model, using the bounded trait δ ( 0 , 1 ) in the RFM or the bipolar trait θ ( , ) is a matter of convenience. Researchers can apply the bijective transformation θ δ = Ψ ( θ ) without changing the statistical properties of the IRT model. Hence, the bounded variable δ in the RFM can always be transformed into an unbounded variable, θ , in the 2PL model, and the other way around. Consequently, the 2PL model can also be used to estimate the parameters of the RFM after applying the appropriate transformations [14].

2.3. 2PL Model with Log-Linear Smoothing

In most applications, the 2PL model is estimated under the assumption of a normal  θ distribution. This assumption is weakened in the log-linear smoothing approach [6,18,19]. It is assumed that θ is represented by a finite number of (equidistant) location points θ 1 , , θ T . The logarithm of the discrete probabilities P ( θ = θ t ) are modeled by polynomials for an integer, Q, of at least 2
log P ( θ = θ t ) w t = q = 0 Q κ q θ t q for t = 1 , , T ,
where the discrete probabilities, p t defined as
p t = P ( θ = θ t ) = exp ( w t ) u = 1 T exp ( w u )
sum to 1. The choice Q = 2 corresponds to the normal distribution, while Q = 3 allows for skewness in the trait θ (see [20,21]). If the parameters κ q are freely estimated (8), item parameters of a reference item must be fixed for identification reasons (i.e., set a i 0 = 1 and  b i 0 = 0 for a reference item, i 0 ).

2.4. Ramsay Quotient Model

The Ramsay quotient model (RQM; [22,23,24]) proposed an alternative IRT model to the 2PL model that allows guessing behavior and restricts the ability variable, θ , to be positive. The IRF of the RQM is given by
P ( X i = 1 | θ ) = exp ( θ / B i ) K i + exp ( θ / B i ) .
The RQM (10) is equivalent to the 2PL model (see [22]) because
P ( X i = 1 | θ ) = exp 1 B i θ B i log K i 1 + exp 1 B i θ B i log K i = Ψ a i ( θ b i ) ,
where a i = 1 / B i and b i = B i log K i are the item parameters in the 2PL parametrization. The IRFs in (10) and (11) look quite different. However, the constraint of θ on ( 0 , ) allows for the modeling of a lower asymptote that might reflect guessing behavior like in the three-parameter logistic (3PL) model [25,26,27,28,29] in items because
lim θ 0 P ( X i = 1 | θ ) = 1 1 + K i = Ψ ( a i b i ) .
A positively valued θ variable can again be modeled with a log-normal distribution of θ (i.e., using a normal distribution for log θ ). Note that the mean and the SD of θ frequently cannot be empirically identified. In our experience, we often arrive at a sufficient model fit and empirical identification by fixing the mean of log θ to zero and estimating the SD. We want to emphasize that the RQM is equivalent to the 2PL model but with a unipolar trait, θ , that can only attain positive values.

2.5. Partial Membership Mastery Model

The mastery model [30] assumes a dichotomous latent variable, α , that can attain values of 0 or 1. In the literature on the diagnostic classification model (DCM; [31,32,33]), this latent class variable is often referred to as a skill or attribute. The class α = 1 indicates masters, while the class α = 0 represents non-masters of the skill. The IRF in the mastery model is given by
P ( X i = 1 | α = 1 ) = P i 1 = exp ( β i + α i ) 1 + exp ( β i + α i ) = Ψ ( β i + α i ) and P ( X i = 1 | α = 0 ) = P i 0 = exp ( β i ) 1 + exp ( β i ) = Ψ ( β i ) ,
where the probabilities P i 1 and P i 0 can be parametrized in the logit metric with item parameters α i and β i .
Some scholars have challenged the crisp classification of the skill α into masters and non-masters [34,35]. Mixed-membership models or partial-membership models relax this assumption [36,37,38,39]. In these models, subjects can switch the mastery and non-mastery state across items [40,41,42,43].
In the partial-membership mastery model (PMMM; [44,45,46]), the dichotomous variable  α is replaced with a partial membership variable, θ , that can attain values in the bounded interval [ 0 , 1 ] . Note that θ is often denoted by α in the partial membership literature [47,48]. The boundary case θ = 1 corresponds to complete membership in latent class α = 1 , while the limiting case θ = 0 corresponds to complete membership in the class α = 0 . The IRF in the PMMM is defined by (see [17,45,48])
P ( X i = 1 | θ ) = P i 1 θ P i 0 1 θ P i 1 θ P i 0 1 θ + ( 1 P i 1 ) θ ( 1 P i 0 ) 1 θ .
The IRF in (14) can be simplified to
P ( X i = 1 | θ ) = exp α i θ + β i 1 + exp α i θ + β i = Ψ a i ( θ b i )
with a i = α i and b i = β i / α i . Hence, the PMMM is equivalent to the 2PL model with a bounded θ variable on the interval [ 0 , 1 ] (see [44,46,48]). In the estimation of the 2PL model with a bounded θ , the logistic normal distribution can be assumed. In this case, the range of θ is ( 0 , 1 ) instead of [ 0 , 1 ] . Note that the mean and the SD of the logistic normally transformed variable Ψ 1 ( θ ) can be identified (i.e., estimated in empirical data; see [47,48]).
The PMMM can somehow model guessing and slipping behavior because
lim θ 1 P ( X i = 1 | θ ) = Ψ ( β i + α i ) = Ψ a i ( 1 b i ) and lim θ 0 P ( X i = 1 | θ ) = Ψ ( β i ) = Ψ a i b i .
Hence, the 2PL model with a bounded θ variable can be interpreted as a constrained version of the four-parameter logistic (4PL) IRT model [49,50,51,52]. Note that a 2PL model with a bounded  θ variable on the interval [ L , U ] is equivalent to a 2PL model with a bounded  θ variable on  [ 0 , 1 ] because the model parameters can easily be linearly transformed. It should also be emphasized that the so-called probabilistic skill approach to α [53,54] is equivalent to the PMMM [48].

3. Simulation Study

3.1. Method

In this Simulation Study, the statistical properties of a model selection of different specifications of the 2PL model were assessed. Four data-generated models (DGM) of the 2PL model were specified, and the performance of model selection was assessed for the same four 2PL specifications. The 2PL model was simulated according to one of the four DGMs. First, the 2PL model was simulated with a normal distribution for the θ variable (denoted as the DGM “NORM”). Second, the 2PL model was simulated according to a skewed θ variable that follows the log-linear smoothing approach described in Section 2.3 (denoted as the DGM SKEW). Third, a bounded θ distribution on the interval ( 0 , 1 ) with a logistic normal distribution was used as the DGM (denoted as the DGM “BOUN”) as described in Section 2.5. Note that the DGM “BOUN” is equivalent to the PMMM. Fourth, a positively valued θ variable was used in the DGM (denoted as the DGM BOUN) that has a log-normal distribution for the  θ variable as described in Section 2.4. This DGM corresponds to the RQM.
Distribution parameters and item parameters for the four DGMs were obtained from the empirical estimates of Dataset 4 (i.e., the SPM-LS dataset; see [55,56]) in the following Section 4. Item parameters from the first 10 items were chosen for the four DGMs, NORM, SKEW, BOUN, and POSI. The item parameters can be found in Table A1 in Appendix A, as well on https://osf.io/ax49d (accessed on 29 September 2024). The IRFs in the four DGMs are displayed in Figure 1. Note that the IRF of Item 1 is much noticeably flatter than that of the other 9 items, which is explained by its lower item discrimination, a i , across all four DGMs.
The θ distribution in the four DGMs was simulated as follows. In the first DGM NORM, θ was assumed to be standard and normally distributed (i.e., θ had a zero mean and an SD of one). In the second DGM SKEW, the skewed θ distribution followed the specification
log P ( θ t ) 0 + 0 · θ t 0.3 · θ t 2 + 0.04 · θ t 3 .
This distribution was restricted on the interval [ 6 , 6 ] . The simulated θ had a mean of 0.36, an SD of 1.39, and a skewness SK = 0.30 . The third DGM BOUN had a logistic normal θ distribution with a mean parameter of 1.08 and an SD parameter of 0.94. In the original metric, the θ variable had a mean of 0.29, an SD of 0.17 and an SK of 0.76. Finally, the fourth DGM POSI had a log-normal distribution of θ with a mean parameter of 0 and an SD parameter of 0.34. In the original θ variable, the mean was 1.06, the SD was 0.41, and the SK was 0.83. The density functions for the θ variable in the four DGMs are displayed in Figure 2.
In this study, three different test lengths were simulated. Test lengths of I = 10 , 20, and 30 items were chosen, representing short, medium, and long test lengths. In the conditions I = 20 and I = 30 , the item parameters have been duplicated and tripled, respectively.
Moreover, the three different sample sizes N = 500 , 1000, and 2000 were investigated in this simulation study. We did not opt for smaller sample sizes because the estimation of the 2PL would be more unstable for smaller sample size conditions [2].
A total of 3000 replications were performed in all of the 3 (sample size N) × 3 (number of items I) × 4 (DGMs) = 36 cells of the simulation study.
In each of the simulation conditions, four analysis models using a normal θ distribution (NORM), a skewed θ distribution (SKEW), a bounded θ distribution (BOUN), and a positively valued θ distribution were utilized in the estimation of the 2PL model. In the NORM specification, the mean μ and the SD σ of the θ distribution were fixed at 0 and 1, respectively. In the SKEW specification, the eight items served as the reference item with fixed item discrimination, a i = 1 , and fixed item difficulty, b i = 0 . The distribution parameters  κ q for q = 0 , 1 , 2 , 3 (see (8) in Section 2.3) of the log-linear smoothing θ distribution were freely estimated. In the BOUN specification, μ and σ of the logistic normal distribution were freely estimated. In the POSI specification, the mean parameter of the log-normal distribution was fixed at 0, while the SD parameter was freely estimated.
Model selection was conducted using the Akaike information criterion (AIC; [57,58]), which is defined as
AIC = 2 · LL + 2 p ,
where LL is the estimated log-likelihood value, and p denotes the number of estimated model parameters. The 2PL model specification with the least AIC value was selected. Model selection rates were computed as the empirical proportion in which a particular 2PL model was selected based on AIC.
All IRT models were fitted with the sirt::xxirt() function from the R (Version 4.3.1; [59]) package sirt [60]. Marginal maximum likelihood estimation was used for model estimation [61,62,63]. Replication materials for this Simulation Study are available at https://osf.io/ax49d (accessed on 29 September 2024).

3.2. Results

Table 1 presents the model selection rates based on the AIC for the DGMs as a function of the number of items, I, and the sample size, N. If the normal distribution, NORM, was the DGM, model selection rates were satisfactory, and they improved with a larger number of items, slightly improving with increasing sample sizes.
In the DGM SKEW, model selection rates were unsatisfactory for a short test length, I = 10 , in particular, with a small sample size, N = 500 . Model selection rates improved considerably in the large test length condition of I = 30 . In the DGM BOUN, the model selection turned out to be quite difficult. The BOUN analysis model was frequently inferior to the POSI analysis model, which had one parameter less. Finally, the DGM POSI had satisfactory selection rates, except for the small sample condition, I = 10 .
An anonymous reviewer suggested conducting an additional simulation study in which the DGM had a skewed, unbounded distribution for the θ distribution, but the true distribution was not included in the list of analysis models. Following the reviewer’s suggestion, the SKEW distribution served as the DGM in this additional simulation study, but SKEW was excluded from the list of analysis models. Hence, the competitive 2PL models were NORM, BOUN, and POSI, while SKEW was the DGM. Table 2 presents model selection rates based on the AIC. Overall, it can be seen that the analysis model POSI with a positively valued θ variable was most frequently selected. This finding is noteworthy because the true DGM involved an unbounded θ variable. The normal distribution assumption implemented in the analysis model NORM had an unbounded θ variable, but it had an obviously misspecified distribution. Interestingly, the skewness of the  θ unbounded variable is better reflected in a skewed but positively-value distribution (i.e., POSI) instead of a symmetric and unbounded distribution (i.e., NORM).
Overall, it can be concluded that the different 2PL specifications can be successfully statistically distinguished from each other if the true DGM is included in the set of analysis models. Hence, the alternative 2PL specifications might be simultaneously evaluated in empirical research because they result in IRFs with quite different interpretations.

4. Empirical Examples

In this section, different specifications of the 2PL model are compared through six publicly available datasets.

4.1. Method

The six example datasets used in the empirical comparison are described in what follows. All datasets include dichotomous items and do not contain missing item responses.
Dataset 1 is the data.ecpe dataset, and it has N = 2922 subjects who provided item responses to I = 28 items. The data.ecpe is available in the R package CDM [64,65]. This dataset stems from the grammar section of the examination for the certificate of proficiency in English (ECPE) test [66,67].
Dataset 2 is the data.read dataset from the R package sirt [60], which contains N = 328 subjects and I = 12 items. This dataset stems from a reading comprehension test.
Dataset 3 is the SPISA dataset from the R package psychotree [68], and it contains N = 1075 subjects and I = 45 items. It stems from a so-called student PISA test [69] on general declarative knowledge.
Dataset 4 contains N = 499 subjects and I = 12 items, and it stems from the last series of the standard progressive matrices (SPM-LS; [55,56]). It has been analyzed in numerous publications (e.g., [70,71,72]).
Dataset 5 is the data.ex16 dataset from the R package TAM [73], and it contains N = 1102 subjects on I = 15 items. Only the first-graders were selected from the original data.ex16 dataset in this analysis.
Dataset 6 is the data.timss03.G8.su dataset from the R package CDM [64,65], and it contains N = 757 and I = 23 . It is a subset of the trends in international mathematics and science study (TIMSS) 2003 dataset for eighth-graders, and it was also analyzed in [74,75].
The same four 2PL specifications, NORM, SKEW, BOUN, and POSI, as described in Section 3.1 of the Simulation Study, were employed. Model selection was also carried out based on the AIC. Because the expected value of the AIC depends on sample size, the Gilula–Haberman penalty (GHP; [76,77,78,79]) was used as a normalized measure of model fit. It is defined as
GHP = AIC 2 N I = LL N I + p N I .
In this empirical analysis, a normalized variant of the GHP, normalized for the size of the rectangular dataset N I = 10 4 , is defined as
GHP 4 = 10 4 · GHP .
As for the AIC statistic, lower values of GHP or GHP4 suggest a better model fit.
To evaluate alternative 2PL specification, differences in the GHP 4 statistic were calculated, referred to as Δ GHP 4 . Following the rules of thumb from the literature, GHP 4 differences larger than 10 may indicate a moderate deviation, while Δ GHP 4 differences ranging between 1 and 10 suggest a small deviation [79,80,81]. In the following analysis, the 2PL model specification NORM served as the reference model for computing the Δ GHP 4 statistic.

4.2. Results

Table 3 presents the Δ GHP 4 statistic for the six example datasets. For all datasets, the 2PL model with the normal distribution for θ did not result in the best-fitting model. Datasets 1 and 3 indicated only slight improvements in using the SKEW or POSI 2PL specifications. Datasets 2, 4, and 6 showed more substantial model fit improvements for all three alternative non-normal distributions for θ . Notably, the bounded distribution BOUN clearly showed the best model fit for Datasets 2 and 4. Finally, Dataset 5 achieved an improved model fit based on the skew distribution SKEW.
Overall, these findings for the example datasets highlight that it would be advantageous to also consider bounded or positively valued distributions for θ in terms of the model fit in empirical applications.

5. Discussion

In this article, we have discussed the importance and meaning of different specifications of the θ distribution in the 2PL model. An empirical analysis of different publicly available datasets revealed that θ distributions on a bounded interval or restricted on the positive range can provide a much better model fit for some datasets. Moreover, the simulation study also demonstrated that model selection based on the AIC can effectively determine the right θ distribution.
The simulation study indicated difficulties in empirically distinguishing the bounded θ distribution from the positively valued θ distribution. This finding might be the consequence that the DGM in the simulation with a bounded range was quite similar to the DGM with positive θ values. Future research might investigate different data scenarios.
We emphasized that the 2PL model with positively valued or bounded θ distribution can be interpreted as a restricted version of the 3PL or 4PL model. Importantly, the 2PL model has fewer parameters than the 3PL and 4PL models. Hence, using more parsimonious IRT models that can also accommodate guessing and slipping behavior, as modeled in the 3PL and 4PL models, can be fruitful in empirical research. Note that it has been pointed out in the literature that it is difficult to disentangle guessing effects in items from non-normal θ distributions [82,83].
Section 2 demonstrated that the unipolar IRT model with a positively valued θ variable and the RFM with a bounded θ variable are statistically equivalent to the 2PL model that involves an unbounded θ variable. Based on our experience, it is computationally preferable to utilize statistical models with unbounded parameters to improve model convergence. Therefore, researchers may fit the 2PL model first and then transform the item parameters and θ distribution to obtain the parametrization unipolar IRT or RFM models if they are desired.
The statistical equivalence of the 2PL model with the unipolar IRT model or the RFM implies that the unbounded θ variable from the 2PL model can be transformed bijectively to ξ = exp ( θ ) in the unipolar IRT model and to δ = Ψ ( θ ) = 1 / ( 1 + exp ( θ ) ) in the RFM. The choice of transformation η = f ( θ ) is arbitrary, and it depends on the objectives of the researcher [12]. In many cases, reporting scores in the ( 0 , 1 ) metric is preferable since 0 and 1 correspond to minimum and maximum ability, respectively. Based on this reasoning, one could argue that only ordinal information is extracted from the θ variable in the 2PL model. As a consequence, group differences will only be independent of the chosen metric η = f ( θ ) if rank statistics based solely on ordinal information of θ are used [84].
An anonymous reviewer noted that practitioners sometimes truncate the unbounded θ scores on the logit metric from the 2PL model to a finite range, such as [ 3 , 3 ] or [ 5 , 5 ] . That is, extreme scores are set to arbitrary bounds on the logit metric. I do not see a clear rationale for this approach. If the unbounded logit metric should be used, practitioners must accept the presence of extremely small (negative) and extremely large (positive) scores. For instance, if a subject answered all items correctly or incorrectly, θ would tend toward infinity or minus infinity, respectively, unless prior information (regularization) were applied. In contrast, the bounded metric yields more interpretable scores of 1 or 0. Ultimately, the choice of metric depends on which is more suitable for the research objectives.
In this article, alternative flexible θ distributions were investigated. However, the functional form of the item response function was restricted to the 2PL model. Future research might aim at the flexible modeling of the item response function using flexible machine learning techniques (e.g., [85,86]). Examples of using machine learning techniques in IRT can be found in [87,88,89,90,91,92,93,94].

Funding

This research received no external funding.

Institutional Review Board Statement

Not applicable.

Informed Consent Statement

Informed consent was obtained from all subjects involved in the study.

Data Availability Statement

The empirical datasets used in Section 4 are publicly available. See Section 4 for detailed information on how the datasets can be accessed. The simulated datasets in the simulation study in Section 3 can be created using the replication material at https://osf.io/ax49d (accessed on 29 September 2024).

Conflicts of Interest

The authors declare no conflicts of interest.

Abbreviations

The following abbreviations are used in this manuscript:
AICAkaike information criterion
2PLtwo-parameter logistic
3PLthree-parameter logistic
4PLfour-parameter logistic
DCMdiagnostic classification model
DGMdata-generating model
GHPGilula–Haberman penalty
IRFitem response function
IRTitem response theory
Mmean
PMMMpartial membership mastery model
RFMrational function model
RQMRamsay quotient model
SDstandard deviation
SKskewness

Appendix A. Item Parameters in Simulation Study

Table A1 contains the item parameters that were used in the four DGMs of the Simulation Study.
Table A1. Simulation Study: Item parameters (i.e., item discriminations, a i , and item difficulties, b i ) of the 2PL model in the four data-generating models, NORM, SKEW, BOUN, and POSI.
ItemNORMSKEWBOUNPOSI
a i b i a i b i a i b i a i b i
10.85−1.550.54−1.852.67−0.061.340.14
22.01−1.761.54−1.975.65−0.144.670.41
31.69−1.221.19−1.295.07−0.033.280.52
44.05−1.013.15−0.967.85 0.037.530.62
54.77−1.123.91−1.108.27 0.028.520.56
62.38−0.891.69−0.846.64 0.054.710.64
71.56−0.791.04−0.704.60 0.062.760.67
81.61−0.311.00 0.004.77 0.182.530.87
91.27−0.320.81 0.033.95 0.202.150.87
102.20 0.321.29 1.016.28 0.353.021.19
Note. NORM = 2PL model with a normal θ distribution; SKEW = 2PL model with a skewed θ variable based on log-linear smoothing (see Section 2.3); BOUN = 2PL model with a bounded θ variable on [ 0 ,   1 ] (i.e., partial membership mastery model; see Section 2.5); POSI = 2PL model with a positive θ variable (i.e., Ramsay quotient model; see Section 2.4).

References

  1. Chen, Y.; Li, X.; Liu, J.; Ying, Z. Item response theory—A statistical framework for educational and psychological measurement. arXiv 2021, arXiv:2108.08604. [Google Scholar]
  2. Yen, W.M.; Fitzpatrick, A.R. Item response theory. In Educational Measurement; Brennan, R.L., Ed.; Praeger Publishers: Westport, CT, USA, 2006; pp. 111–154. [Google Scholar]
  3. San Martin, E. Identification of item response theory models. In Handbook of Item Response Theory, Volume 2: Statistical Tools; van der Linden, W.J., Ed.; CRC Press: Boca Raton, FL, USA, 2016; pp. 127–150. [Google Scholar] [CrossRef]
  4. Birnbaum, A. Some latent trait models and their use in inferring an examinee’s ability. In Statistical Theories of Mental Test Scores; Lord, F.M., Novick, M.R., Eds.; MIT Press: Reading, MA, USA, 1968; pp. 397–479. [Google Scholar]
  5. Woods, C.M. Estimating the latent density in unidimensional IRT to permit non-normality. In Handbook of Item Response Theory Modeling; Reise, S.P., Revicki, D.A., Eds.; Routledge: New York, NY, USA, 2014; pp. 78–102. [Google Scholar] [CrossRef]
  6. Xu, X.; von Davier, M. Fitting the Structured General Diagnostic Model to NAEP Data; (Research Report No. RR-08-28); Educational Testing Service: Princeton, NJ, USA, 2008. [Google Scholar] [CrossRef]
  7. Lucke, J.F. Unipolar item response models. In Handbook of Item Response Theory Modeling: Applications to Typical Performance Assessment; Routledge: New York, NY, USA, 2015; pp. 272–284. [Google Scholar] [CrossRef]
  8. Morales-Vives, F.; Ferrando, P.J.; Hernández-Dorado, A. Modeling maladaptive personality traits with unipolar item response theory: The case of callousness. J. Gen. Psychol. 2024. Epub ahead of print. [Google Scholar] [CrossRef] [PubMed]
  9. Reise, S.P.; Rodriguez, A.; Spritzer, K.L.; Hays, R.D. Alternative approaches to addressing non-normal distributions in the application of IRT models to personality measures. J. Personal. Assess. 2018, 100, 363–374. [Google Scholar] [CrossRef] [PubMed]
  10. Huang, Q.; Bolt, D.M. Unipolar IRT and the author recognition test (ART). Behav. Res. Methods 2024, 56, 5406–5423. [Google Scholar] [CrossRef]
  11. Reise, S.P.; Du, H.; Wong, E.F.; Hubbard, A.S.; Haviland, M.G. Matching IRT models to patient-reported outcomes constructs: The graded response and log-logistic models for scaling depression. Psychometrika 2021, 86, 800–824. [Google Scholar] [CrossRef]
  12. van der Linden, W.J. Unidimensional logistic response models. In Handbook of Item Response Theory, Volume 1: Models; van der Linden, W.J., Ed.; CRC Press: Boca Raton, FL, USA, 2016; pp. 11–30. [Google Scholar] [CrossRef]
  13. Dimitrov, D.M.; Atanasov, D.V. Latent D-scoring modeling: Estimation of item and person parameters. Educ. Psychol. Meas. 2021, 81, 388–404. [Google Scholar] [CrossRef]
  14. Robitzsch, A. About the equivalence of the latent D-scoring model and the two-parameter logistic item response model. Mathematics 2021, 9, 1465. [Google Scholar] [CrossRef]
  15. Dimitrov, D. D-scoring Method of Measurement: Classical and Latent Frameworks; Taylor & Francis: Boca Raton, FL, USA, 2023. [Google Scholar] [CrossRef]
  16. Paisley, J.; Wang, C.; Blei, D.M. The discrete infinite logistic normal distribution. Bayesian Anal. 2012, 7, 997–1034. [Google Scholar] [CrossRef]
  17. Robitzsch, A. Relating the one-parameter logistic diagnostic classification model to the Rasch model and one-parameter logistic mixed, partial, and probabilistic membership diagnostic classification models. Foundations 2023, 3, 621–633. [Google Scholar] [CrossRef]
  18. von Davier, M. A general diagnostic model applied to language testing data. Br. J. Math. Stat. Psychol. 2008, 61, 287–307. [Google Scholar] [CrossRef]
  19. Casabianca, J.M.; Lewis, C. IRT item parameter recovery with marginal maximum likelihood estimation using loglinear smoothing models. J. Educ. Behav. Stat. 2015, 40, 547–578. [Google Scholar] [CrossRef]
  20. Robitzsch, A. A comprehensive simulation study of estimation methods for the Rasch model. Stats 2021, 4, 814–836. [Google Scholar] [CrossRef]
  21. Steinfeld, J.; Robitzsch, A. Item parameter estimation in multistage designs: A comparison of different estimation approaches for the Rasch model. Psych 2021, 3, 279–307. [Google Scholar] [CrossRef]
  22. Ramsay, J.O. A comparison of three simple test theory models. Psychometrika 1989, 54, 487–499. [Google Scholar] [CrossRef]
  23. van der Maas, H.L.J.; Molenaar, D.; Maris, G.; Kievit, R.A.; Borsboom, D. Cognitive psychology meets psychometric theory: On the relation between process models for decision making and latent variable models for individual differences. Psychol. Rev. 2011, 118, 339–356. [Google Scholar] [CrossRef]
  24. Robitzsch, A. Relating the Ramsay quotient model to the classical D-scoring rule. Analytics 2023, 2, 824–835. [Google Scholar] [CrossRef]
  25. Aitkin, M.; Aitkin, I. Investigation of the Identifiability of the 3PL Model in the NAEP 1986 Math Survey; Technical Report; US Department of Education, Office of Educational Research and Improvement National Center for Education Statistics: Washington, DC, USA, 2006; Available online: https://bit.ly/3T6t9sl (accessed on 29 September 2024).
  26. Aitkin, M.; Aitkin, I. Statistical Modeling of the National Assessment of Educational Progress; Springer: New York, NY, USA, 2011. [Google Scholar] [CrossRef]
  27. Lord, F.M.; Novick, R. Statistical Theories of Mental Test Scores; Addison-Wesley: Reading, MA, USA, 1968. [Google Scholar]
  28. De Ayala, R.J. The Theory and Practice of Item Response Theory; Guilford Publications: New York, NY, USA, 2022. [Google Scholar]
  29. von Davier, M. Is there need for the 3PL model? Guess what? Meas. Interdiscip. Res. Persp. 2009, 7, 110–114. [Google Scholar] [CrossRef]
  30. Dayton, C.M.; Macready, G.B. A probabilistic model for validation of behavioral hierarchies. Psychometrika 1976, 41, 189–204. [Google Scholar] [CrossRef]
  31. DiBello, L.V.; Roussos, L.A.; Stout, W. A review of cognitively diagnostic assessment and a summary of psychometric models. In Handbook of Statistics, Volume 26: Psychometrics; Rao, C.R., Sinharay, S., Eds.; Elsevier: Amsterdam, The Netherlands, 2007; pp. 979–1030. [Google Scholar] [CrossRef]
  32. von Davier, M.; Lee, Y.S. (Eds.) Handbook of Diagnostic Classification Models; Springer: Cham, Switzerland, 2019. [Google Scholar] [CrossRef]
  33. Rupp, A.A.; Templin, J.; Henson, R.A. Diagnostic Measurement: Theory, Methods, and Applications; Guilford Press: New York, NY, USA, 2010. [Google Scholar]
  34. de la Torre, J.; Lee, Y.S. A note on the invariance of the DINA model parameters. J. Educ. Meas. 2010, 47, 115–127. [Google Scholar] [CrossRef]
  35. Huang, Q.; Bolt, D.M. Relative robustness of CDMs and (M)IRT in measuring growth in latent skills. Educ. Psychol. Meas. 2023, 83, 808–830. [Google Scholar] [CrossRef]
  36. Chen, L.; Gu, Y. A spectral method for identifiable grade of membership analysis with binary responses. Psychometrika 2024, 89, 626–657. [Google Scholar] [CrossRef] [PubMed]
  37. Erosheva, E.A. Comparing latent structures of the grade of membership, Rasch, and latent class models. Psychometrika 2005, 70, 619–628. [Google Scholar] [CrossRef]
  38. Manton, K.G.; Woodbury, M.A.; Stallard, E.; Corder, L.S. The use of grade-of-membership techniques to estimate regression relationships. Sociol. Methodol. 1992, 22, 321–381. [Google Scholar] [CrossRef]
  39. Woodbury, M.A.; Clive, J.; Garson Jr, A. Mathematical typology: A grade of membership technique for obtaining disease definition. Comput. Biomed. Res. 1978, 11, 277–298. [Google Scholar] [CrossRef] [PubMed]
  40. DeCarlo, L.T. A signal detection model for multiple-choice exams. Appl. Psychol. Meas. 2021, 45, 423–440. [Google Scholar] [CrossRef]
  41. Erosheva, E.A.; Fienberg, S.E.; Junker, B.W. Alternative statistical models and representations for large sparse multi-dimensional contingency tables. Ann. Fac. Sci. Toulouse Math. 2002, 11, 485–505. [Google Scholar] [CrossRef]
  42. Erosheva, E.A.; Fienberg, S.E.; Joutard, C. Describing disability through individual-level mixture models for multivariate binary data. Ann. Appl. Stat. 2007, 1, 346–384. [Google Scholar] [CrossRef]
  43. Finch, H.W. Performance of the grade of membership model under a variety of sample sizes, group size ratios, and differential group response probabilities for dichotomous indicators. Educ. Psychol. Meas. 2021, 81, 523–548. [Google Scholar] [CrossRef]
  44. Heller, K.A.; Williamson, S.; Ghahramani, Z. Statistical models for partial membership. In Proceedings of the 25th International Conference on Machine Learning, Helsinki, Finland, 5–9 July 2008; pp. 392–399. [Google Scholar] [CrossRef]
  45. Gruhl, J.; Erosheva, E.A.; Ghahramani, Z.; Mohamed, S.; Heller, K. A tale of two (types of) memberships: Comparing mixed and partial membership with a continuous data example. In Handbook of Mixed Membership Models and Their Applications; Airoldi, E.M., Blei, D., Erosheva, E.A., Fienberg, S.E., Eds.; Chapman & Hall: Boca Raton, FL, USA, 2014; pp. 15–38. [Google Scholar] [CrossRef]
  46. Ghahramani, Z.; Mohamed, S.; Heller, K. A simple and general exponential family framework for partial membership and factor analysis. In Handbook of Mixed Membership Models and Their Applications; Airoldi, E.M., Blei, D., Erosheva, E.A., Fienberg, S.E., Eds.; Chapman & Hall: Boca Raton, FL, USA, 2014; pp. 101–122. [Google Scholar] [CrossRef]
  47. Shang, Z.; Erosheva, E.A.; Xu, G. Partial-mastery cognitive diagnosis models. Ann. Appl. Stat. 2021, 15, 1529–1555. [Google Scholar] [CrossRef]
  48. Robitzsch, A. A comparison of mixed and partial membership diagnostic classification models with multidimensional item response models. Information 2024, 15, 331. [Google Scholar] [CrossRef]
  49. Barton, M.A.; Lord, F.M. An Upper Asymptote for the Three-Parameter Logistic Item-Response Model; ETS Research Report Series; Educational Testing Service: Princeton, NJ, USA, 1981. [Google Scholar] [CrossRef]
  50. Loken, E.; Rulison, K.L. Estimation of a four-parameter item response theory model. Br. J. Math. Stat. Psychol. 2010, 63, 509–525. [Google Scholar] [CrossRef] [PubMed]
  51. Culpepper, S.A. The prevalence and implications of slipping on low-stakes, large-scale assessments. J. Educ. Behav. Stat. 2017, 42, 706–725. [Google Scholar] [CrossRef]
  52. Robitzsch, A. Four-parameter guessing model and related item response models. Math. Comput. Appl. 2022, 27, 95. [Google Scholar] [CrossRef]
  53. Zhan, P.; Wang, W.C.; Jiao, H.; Bian, Y. Probabilistic-input, noisy conjunctive models for cognitive diagnosis. Front. Psychol. 2018, 9, 997. [Google Scholar] [CrossRef]
  54. Zhan, P. Refined learning tracking with a longitudinal probabilistic diagnostic model. Educ. Meas. 2021, 40, 44–58. [Google Scholar] [CrossRef]
  55. Myszkowski, N.; Storme, M. Data for: A snapshot of g? Binary and polytomous item-response theory investigations of the last series of the standard progressive matrices (SPM-LS). Mendeley Data 2018. [Google Scholar] [CrossRef]
  56. Myszkowski, N. Analysis of an intelligence dataset. J. Intell. 2020, 8, 39. [Google Scholar] [CrossRef]
  57. Cavanaugh, J.E.; Neath, A.A. The Akaike information criterion: Background, derivation, properties, application, interpretation, and refinements. WIREs Comput. Stat. 2019, 11, e1460. [Google Scholar] [CrossRef]
  58. Burnham, K.P.; Anderson, D.R. Model Selection and Multimodel Inference: A Practical Information-Theoretic Approach; Springer: New York, NY, USA, 2002. [Google Scholar] [CrossRef]
  59. R Core Team. R: A Language and Environment for Statistical Computing; R Core Team: Vienna, Austria, 2024; Available online: https://www.R-project.org (accessed on 15 June 2024).
  60. Robitzsch, A. sirt: Supplementary Item Response Theory Models, R Package Version 4.2-73; R Core Team: Vienna, Austria, 2024; Available online: https://github.com/alexanderrobitzsch/sirt (accessed on 7 September 2024).
  61. Aitkin, M. Expectation maximization algorithm and extensions. In Handbook of Item Response Theory, Volume 2: Statistical Tools; van der Linden, W.J., Ed.; CRC Press: Boca Raton, FL, USA, 2016; pp. 217–236. [Google Scholar] [CrossRef]
  62. Bock, R.D.; Aitkin, M. Marginal maximum likelihood estimation of item parameters: Application of an EM algorithm. Psychometrika 1981, 46, 443–459. [Google Scholar] [CrossRef]
  63. Glas, C.A.W. Maximum-likelihood estimation. In Handbook of Item Response Theory, Volume 2: Statistical Tools; van der Linden, W.J., Ed.; CRC Press: Boca Raton, FL, USA, 2016; pp. 197–216. [Google Scholar] [CrossRef]
  64. George, A.C.; Robitzsch, A.; Kiefer, T.; Groß, J.; Ünlü, A. The R package CDM for cognitive diagnosis models. J. Stat. Softw. 2016, 74, 1–24. [Google Scholar] [CrossRef]
  65. Robitzsch, A.; George, A.C. The R package CDM for diagnostic modeling. In Handbook of Diagnostic Classification Models; von Davier, M., Lee, Y.S., Eds.; Springer: Cham, Switzerland, 2019; pp. 549–572. [Google Scholar] [CrossRef]
  66. Templin, J.; Hoffman, L. Obtaining diagnostic classification model estimates using Mplus. Educ. Meas. 2013, 32, 37–50. [Google Scholar] [CrossRef]
  67. Templin, J.; Bradshaw, L. Hierarchical diagnostic classification models: A family of models for estimating and testing attribute hierarchies. Psychometrika 2014, 79, 317–339. [Google Scholar] [CrossRef] [PubMed]
  68. Zeileis, A.; Strobl, C.; Wickelmaier, F.; Komboz, B.; Kopf, J. psychotree: Recursive Partitioning Based on Psychometric Models, R Package Version 0.16-1. 2024. Available online: https://CRAN.R-project.org/package=psychotree (accessed on 11 April 2024).
  69. Strobl, C.; Kopf, J.; Zeileis, A. Rasch trees: A new method for detecting differential item functioning in the Rasch model. Psychometrika 2015, 80, 289–316. [Google Scholar] [CrossRef]
  70. Myszkowski, N.; Storme, M. A snapshot of g. Binary and polytomous item-response theory investigations of the last series of the standard progressive matrices (SPM-LS). Intelligence 2018, 68, 109–116. [Google Scholar] [CrossRef]
  71. Myszkowski, N. A Mokken scale analysis of the last series of the standard progressive matrices (SPM-LS). J. Intell. 2020, 8, 22. [Google Scholar] [CrossRef]
  72. Robitzsch, A. Regularized latent class analysis for polytomous item responses: An application to SPM-LS data. J. Intell. 2020, 8, 30. [Google Scholar] [CrossRef]
  73. Robitzsch, A.; Kiefer, T.; Wu, M. TAM: Test Analysis Modules, R Package Version 4.2-21. 2024. Available online: https://doi.org/10.32614/CRAN.package.TAM (accessed on 19 February 2024). [CrossRef]
  74. Su, Y.L.; Choi, K.M.; Lee, W.C.; Choi, T.; McAninch, M. Hierarchical Cognitive Diagnostic Analysis for TIMSS 2003 Mathematics; Technical Report; CASMA Research Report Number 35; University of Iowa: Iowa City, IA, USA, 2013; Available online: https://tinyurl.com/4jrm8mah (accessed on 29 September 2024).
  75. Skaggs, G.; Wilkins, J.L.M.; Hein, S.F. Grain size and parameter recovery with TIMSS and the general diagnostic model. Int. J. Test. 2016, 16, 310–330. [Google Scholar] [CrossRef]
  76. Gilula, Z.; Haberman, S.J. Conditional log-linear models for analyzing categorical panel data. J. Am. Stat. Assoc. 1994, 89, 645–656. [Google Scholar] [CrossRef]
  77. Gilula, Z.; Haberman, S.J. Prediction functions for categorical panel data. Ann. Stat. 1995, 23, 1130–1142. [Google Scholar] [CrossRef]
  78. Haberman, S.J. The Information a Test Provides on an Ability Parameter; Research Report No. RR-07-18; Educational Testing Service: Princeton, NJ, USA, 2007. [Google Scholar] [CrossRef]
  79. van Rijn, P.W.; Sinharay, S.; Haberman, S.J.; Johnson, M.S. Assessment of fit of item response theory models used in large-scale educational survey assessments. Large-Scale Assess. Educ. 2016, 4, 10. [Google Scholar] [CrossRef]
  80. Robitzsch, A. On the treatment of missing item responses in educational large-scale assessment data: An illustrative simulation study and a case study using PISA 2018 mathematics data. Eur. J. Investig. Health Psychol. Educ. 2021, 11, 1653–1687. [Google Scholar] [CrossRef] [PubMed]
  81. Robitzsch, A. On the choice of the item response model for scaling PISA data: Model selection based on information criteria and quantifying model uncertainty. Entropy 2022, 24, 760. [Google Scholar] [CrossRef] [PubMed]
  82. Maris, G.; Bechger, T. On interpreting the model parameters for the three parameter logistic model. Meas. Interdiscip. Res. Persp. 2009, 7, 75–88. [Google Scholar] [CrossRef]
  83. San Martín, E.; González, J.; Tuerlinckx, F. On the unidentifiability of the fixed-effects 3PL model. Psychometrika 2015, 80, 450–467. [Google Scholar] [CrossRef] [PubMed]
  84. Ho, A.D. A nonparametric framework for comparing trends and gaps across tests. J. Educ. Behav. Stat. 2009, 34, 201–228. [Google Scholar] [CrossRef]
  85. Fan, J.; Li, R.; Zhang, C.H.; Zou, H. Statistical Foundations of Data Science; Chapman and Hall/CRC: Boca Raton, FL, USA, 2020. [Google Scholar] [CrossRef]
  86. Peng, Y.; He, M.; Hu, F.; Mao, Z.; Huang, X.; Ding, J. Predictive modeling of flexible EHD pumps using Kolmogorov–Arnold networks. Biomim. Intell. Robotics 2024, 4, 100184. [Google Scholar] [CrossRef]
  87. Belov, D.I.; Lüdtke, O.; Ulitzsch, E. Likelihood-free estimation of IRT models in small samples: A neural networks approach. PsyArXiv 2024. [Google Scholar] [CrossRef]
  88. Gao, L.; Zhao, Z.; Li, C.; Zhao, J.; Zeng, Q. Deep cognitive diagnosis model for predicting students’ performance. Future Gener. Comput. Syst. 2022, 126, 252–262. [Google Scholar] [CrossRef]
  89. Gu, Y. Going deep in diagnostic modeling: Deep cognitive diagnostic models (DeepCDMs). Psychometrika 2024, 89, 118–150. [Google Scholar] [CrossRef]
  90. Maris, G.; Bechger, T. Boltzmann machines as multidimensional item response theory models. PsyArXiv 2021. [Google Scholar] [CrossRef]
  91. Pliakos, K.; Joo, S.H.; Park, J.Y.; Cornillie, F.; Vens, C.; Van den Noortgate, W. Integrating machine learning into item response theory for addressing the cold start problem in adaptive learning systems. Comput. Educ. 2019, 137, 91–103. [Google Scholar] [CrossRef]
  92. Pokropek, A.; Pokropek, E. Deep neural networks for detecting statistical model misspecifications. The case of measurement invariance. Struct. Equ. Model. 2022, 29, 394–411. [Google Scholar] [CrossRef]
  93. Tsutsumi, E.; Kinoshita, R.; Ueno, M. Deep item response theory as a novel test theory based on deep learning. Electronics 2021, 10, 1020. [Google Scholar] [CrossRef]
  94. Yu, J. Neural networks ensemble-based IRT parameter estimation. In Proceedings of the 2009 International Conference on Computational Intelligence and Software Engineering, Wuhan, China, 11–13 December 2009; IEEE: Piscataway, NJ, USA, 2009; pp. 1–3. [Google Scholar] [CrossRef]
Figure 1. Simulation Study: Item response functions of the 10 items (with item parameters presented in Table A1 in Appendix A) that were used in the four data-generating models NORM, SKEW, BOUN, and POSI.
Information 15 00668 g001
Figure 2. Simulation Study: Density functions of the θ variable in the four data-generating models NORM, SKEW, BOUN, and POSI.
Information 15 00668 g002
Table 1. Simulation Study: Model selection rates based on the Akaike information criterion (AIC) as a function of the number of items, I, and sample size, N, for the four data-generating models, NORM, SKEW, BOUN, and POSI.
DGM N I = 10 I = 20 I = 30
Analysis Model Analysis Model Analysis Model
NORM SKEW BOUN POSI NORM SKEW BOUN POSI NORM SKEW BOUN POSI
NORM50072.810.511.94.881.615.32.30.884.115.90.00.0
100074.112.111.62.284.115.60.30.083.816.20.00.0
200078.613.27.80.483.916.10.00.084.115.90.00.0
SKEW50014.836.414.234.61.673.30.524.50.389.60.010.2
10003.755.19.032.20.086.70.113.30.099.10.00.9
20000.168.74.426.90.095.90.04.10.0100.00.00.0
BOUN5008.415.021.355.30.01.140.957.90.00.155.744.2
10000.68.724.865.90.00.155.844.10.00.060.339.7
20000.02.433.464.10.00.067.832.20.00.067.132.9
POSI50010.820.615.453.20.414.48.376.90.010.22.886.9
10001.419.314.165.30.05.94.489.70.04.00.195.9
20000.013.511.275.30.02.50.696.90.01.50.098.5
Note. DGM = data-generating model; NORM = 2PL model with a normal θ distribution; SKEW = 2PL model with a skewed  θ variable based on log-linear smoothing (see Section 2.3); BOUN = 2PL model with a bounded  θ variable on [ 0 , 1 ] (i.e., partial membership mastery model; see Section 2.5); POSI = 2PL model with a positive  θ variable (i.e., Ramsay quotient model; see Section 2.4); Cells with model selection percentage rates larger than 50.0 are printed in bold font. Cells with analysis models that correspond to the data-generating model and a model selection rate smaller than 50.0 are printed with a yellow background color.
Table 2. Simulation Study: Model selection rates based on the Akaike information criterion (AIC) as a function of the number of items, I, and sample size, N, with SKEW was the data-generating model, but it was not included in the set of analysis models.
DGM N I = 10 I = 20 I = 30
Analysis Model Analysis Model Analysis Model
NORM BOUN POSI NORM BOUN POSI NORM BOUN POSI
SKEW50021.317.261.613.91.584.717.90.082.1
1000 1 8.216.575.3 1 6.90.292.919.10.080.9
2000 1 1.217.181.7 1 2.70.097.327.80.072.2
Note. DGM = data-generating model; NORM = 2PL model with a normal θ distribution; SKEW = 2PL model with a skewed  θ variable based on log-linear smoothing (see Section 2.3); BOUN = 2PL model with a bounded  θ variable on [ 0 ,   1 ] (i.e., partial membership mastery model; see Section 2.5); POSI = 2PL model with a positive  θ variable (i.e., Ramsay quotient model; see Section 2.4); Cells with model selection percentage rates larger than 50.0 are printed in bold font.
Table 3. Empirical examples: Δ GHP 4 statistic for the four analysis models, NORM, SKEW, BOUN, and POSI, for the six example datasets.
Model Dataset
1 2 3 4 5 6
NORM 0.0 1 0.0 0.0 1 0.0 1 0.0 1 0.0
SKEW−5.9−13.6−1.4−15.8−24.6−12.0
BOUN 3.5−20.3 4.9−27.6 1 6.4−11.9
POSI−4.5−14.2−0.9−16.4 26.0 1 −8.1
Note. NORM = 2PL model with a normal θ distribution; SKEW = 2PL model with a skewed θ variable based on log-linear smoothing (see Section 2.3); BOUN = 2PL model with a bounded θ variable on [ 0 , 1 ] (i.e., partial membership mastery model; see Section 2.5); POSI = 2PL model with a positive θ variable (i.e., Ramsay quotient model; see Section 2.4); The analysis model “NORM” was used as the reference model in the computation of the Δ GHP 4 statistic.
Disclaimer/Publisher’s Note: The statements, opinions and data contained in all publications are solely those of the individual author(s) and contributor(s) and not of MDPI and/or the editor(s). MDPI and/or the editor(s) disclaim responsibility for any injury to people or property resulting from any ideas, methods, instructions or products referred to in the content.

