Article

Preliminary Studies to Bridge the Gap: Leveraging Informal Software Architecture Artifacts for Structured Model Creation

Industrial Engineering & Management Systems Department, University of Central Florida, Orlando, FL 32816, USA
*
Author to whom correspondence should be addressed.
Information 2024, 15(10), 642; https://doi.org/10.3390/info15100642
Submission received: 4 May 2024 / Revised: 27 September 2024 / Accepted: 28 September 2024 / Published: 15 October 2024
(This article belongs to the Special Issue Optimization and Methodology in Software Engineering, 2nd Edition)

Abstract

:
This study addresses the prevalent gap between structured models and informal architectural methodologies in software engineering. Recognizing the potential of informal architecture artifacts in analytical processes, we introduce a methodology that efficiently transforms these informal components into structured models. This method facilitates understanding and utilizing informal diagrams and enhances analytical capabilities through graph analysis techniques. By leveraging user-friendly tools such as Draw.io, the methodology democratizes the modeling process, making sophisticated architectural analyses accessible to a broader spectrum of professionals without requiring deep expertise in formal methods. The innovative aspects of this methodology lie in its ability to streamline the transformation process, significantly improving both the efficiency and effectiveness of model creation and analysis. These enhancements are demonstrated through a practical application involving a sample architecture diagram, where the resulting model is thoroughly analyzed using advanced graph analysis tools. This approach bridges the theoretical and practical divides in software architecture.

1. Introduction

In the evolving landscape of software engineering, a significant gap persists between the theoretical methodologies proposed in research and the pragmatic approaches applied in practice. Research often emphasizes the rigor of meticulously structured methods to ensure semantic clarity and programmatic integrity [1,2]. However, these methods require a deep understanding of specialized modeling languages and tools [3], creating a barrier to widespread adoption due to the niche expertise required.
Conversely, informal methods predominate in the practical realm. Engineers frequently rely on natural-language documents, wikis, and simple boxes-and-lines diagrams due to their ease of use and accessibility [4]. Despite their popularity, these informal methods suffer significant drawbacks, including structure, formatting, and syntax inconsistencies, which complicate further analysis and integration into systems [5,6].
This paper introduces an innovative methodology that bridges this divide by transforming informal, often chaotic architectural diagrams into structured models. Our approach leverages the user-friendly diagramming tool Draw.io to extract data from informal boxes-and-lines diagrams. This data are then structured into graph-like constructs compatible with advanced analysis tools such as Python’s NetworkX library and Neo4j. This method not only democratizes the creation of structured models, making them accessible to a broader range of professionals without specialized training, but it also enhances the efficiency and effectiveness of architectural analyses.
We present a series of techniques that represent an evolution in handling architectural artifacts, optimizing the transformation process to be more intuitive and less resource-intensive. Our methodology is demonstrated through a sample analysis that showcases the complete workflow, from the initial extraction of data from informal diagrams to their integration into a structured model ready for analysis. This approach addresses the current gaps in practice. It pushes the boundaries of current software engineering methodologies by introducing a scalable, cost-effective solution that maintains the integrity and utility of structured modeling in a way aligned with everyday engineering practices. The derived descriptions of a system are more useful than the initial informal ones, and we analyze these in the Results Section. These are the initial steps to generate cases. Then, the capabilities of “interpretation” of large language models and advanced pattern recognition machines are used to build an even more powerful methodology, which is addressed in the subsection of the conclusions.

2. Background

2.1. Architecture Diagrams

What constitutes an architecture diagram only sometimes has a clear definition [7]. Architecture generally shows many views of a system. Diagrams are used in software architecture to communicate various aspects of the system using different viewpoints to represent different perspectives. This section will describe some of those views with simplified visual examples to demonstrate the variety of architectural views and their purpose.

2.2. Behavioral (Activity) Diagrams

UML (Unified Modeling Language) is a visual language for modeling software systems [8]. SysML (Systems Modeling Language) is a similar language describing complex systems [9]. One type of diagram used in UML is the activity diagram, which describes the behavior of a piece of system functionality [8,9].
This activity diagram (Figure 1) functions as a blueprint, outlining the actions involved in a software application’s login procedure. It presents simplified interactions while preserving the technical depth necessary for accurate interpretation. Key actions such as submitting credentials to an API, validating the request, and generating an authentication token are articulated. This clarity ensures that stakeholders with varying levels of technical proficiency can comprehend and analyze the process effectively. Furthermore, the diagram incorporates decision logic, exemplified by conditional evaluations that lead to different outcomes—specifically, a response indicating authentication failure or success. This approach facilitates a deeper understanding of the behavioral logic integrated within the system’s architecture.

2.3. Logical Network Diagrams

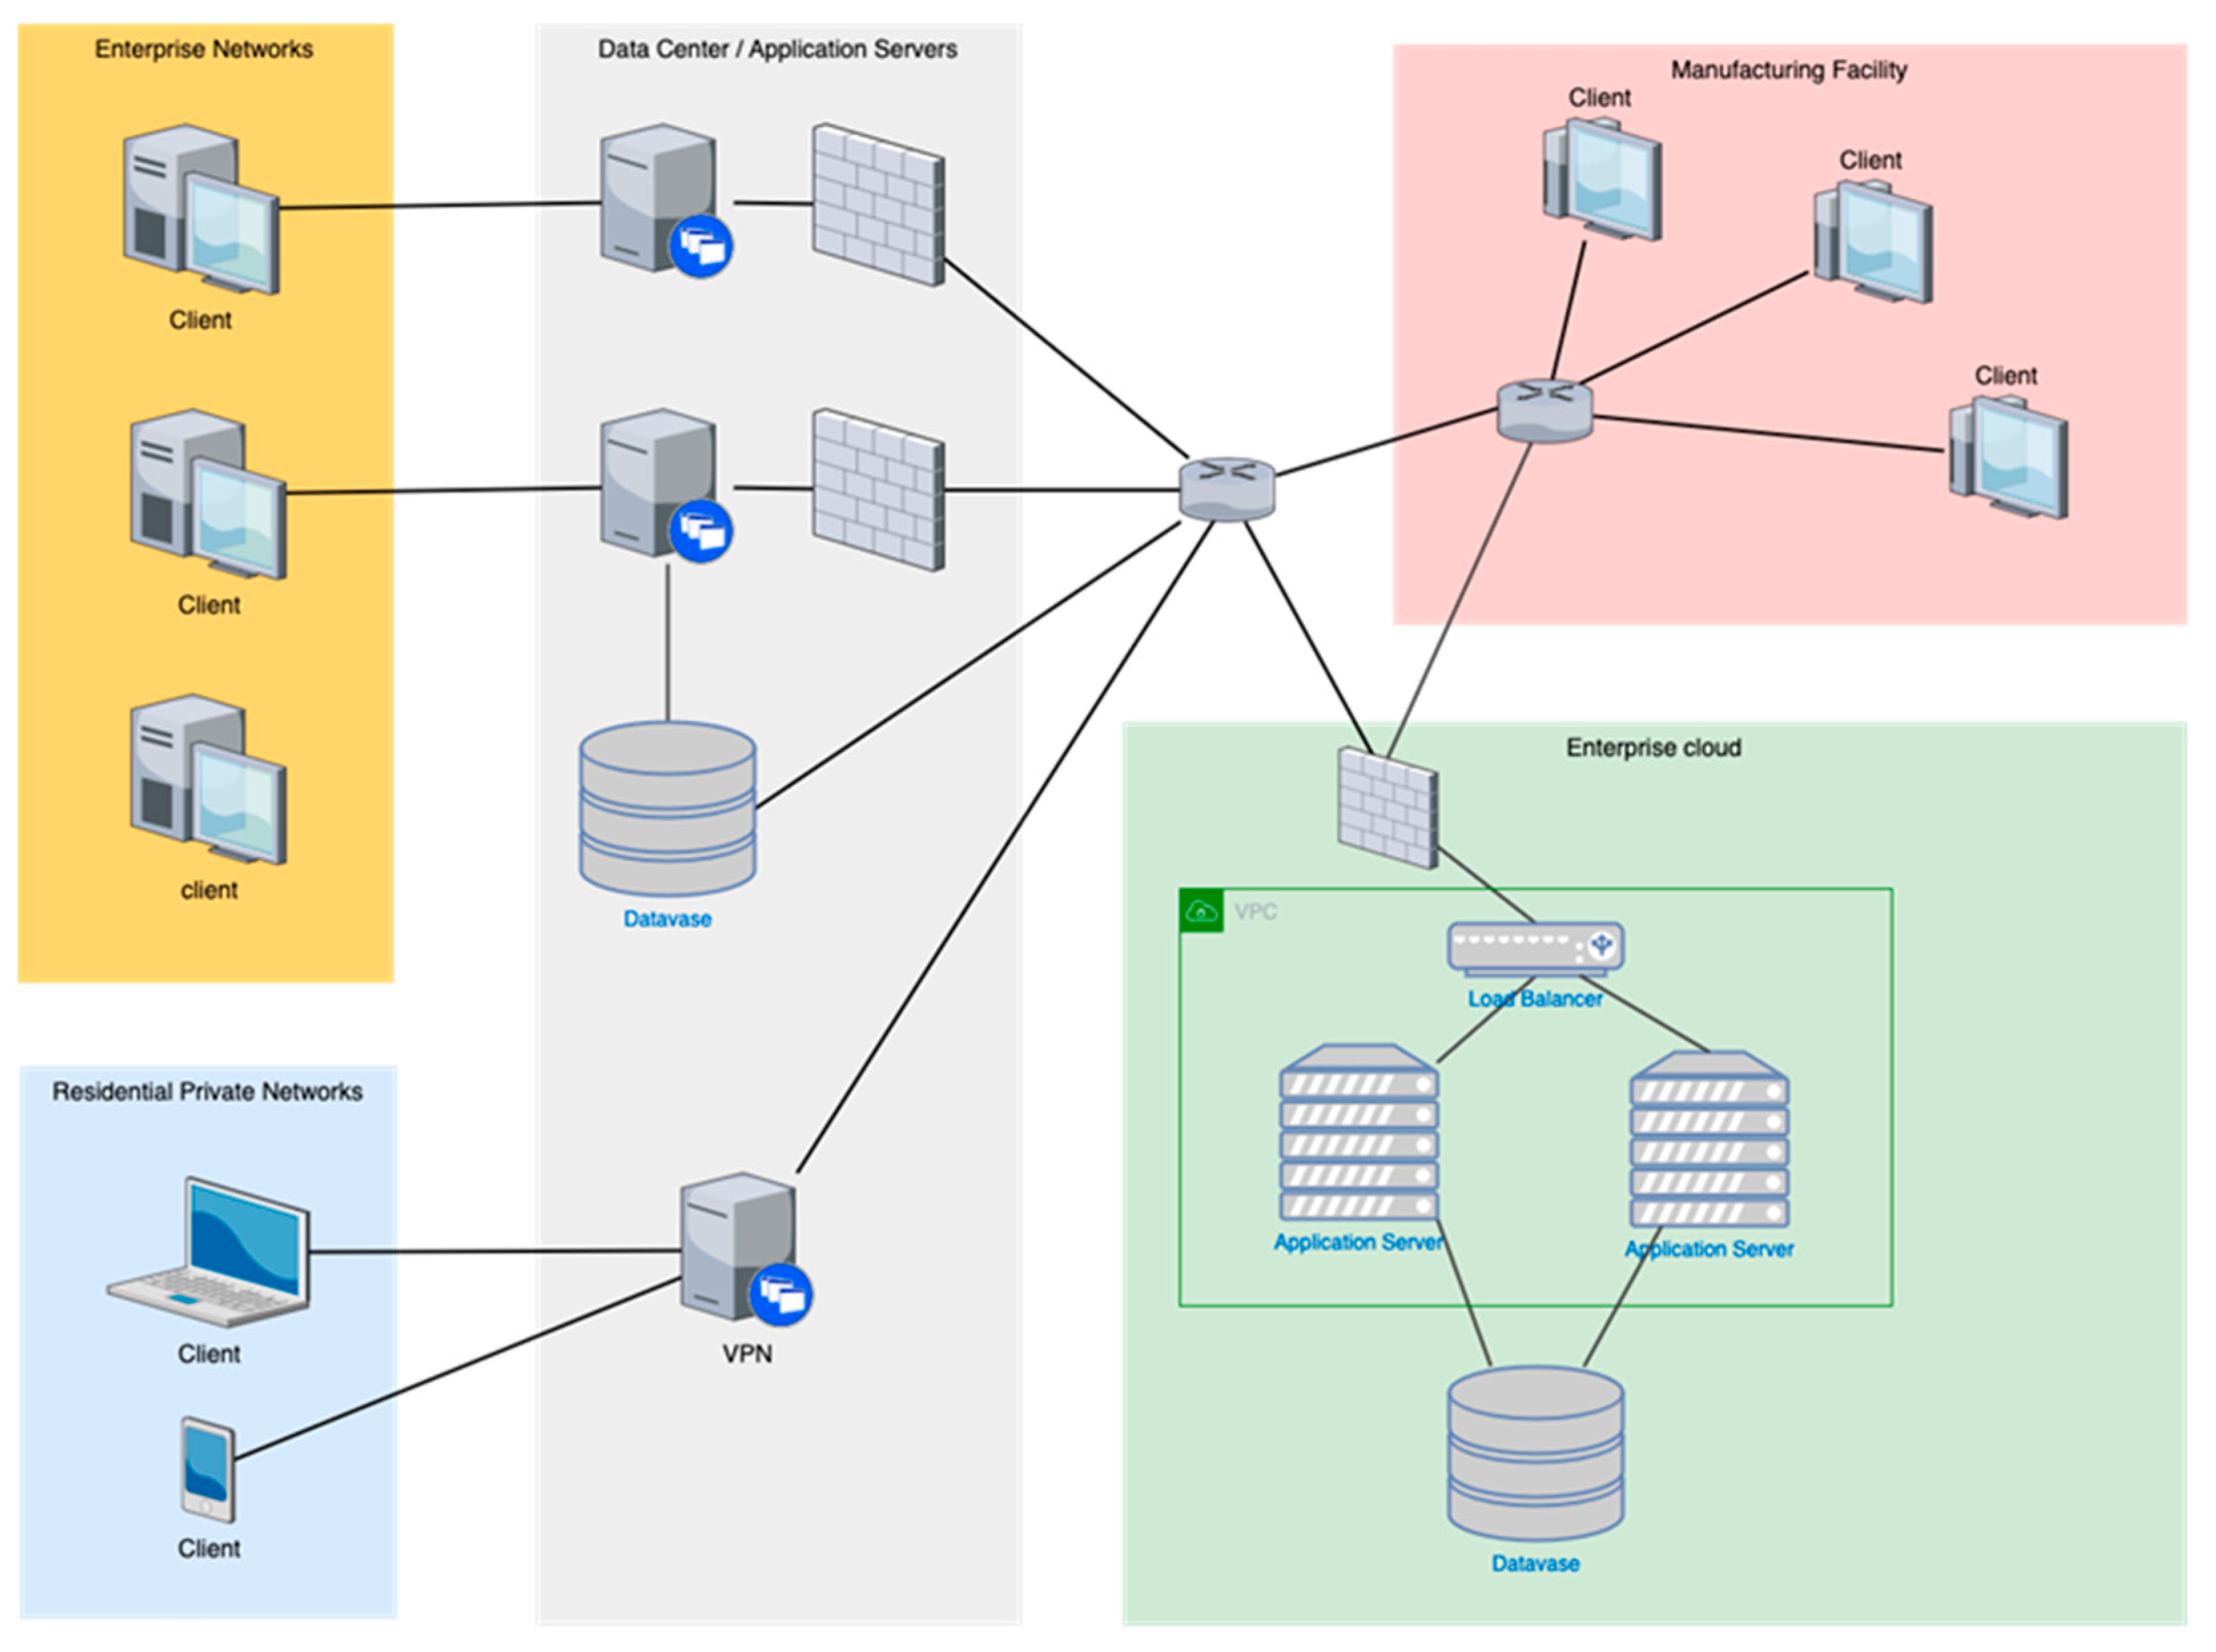
Network diagrams typically show the logical and sometimes physical segmentation of a network. This network diagram (Figure 2) illustrates an architecture that efficiently segregates various components of an organization’s IT infrastructure across different network zones, optimizing performance and security. It visually divides the network into distinct sections, including enterprise networks, a data center with application servers, a manufacturing facility, residential private networks, and an enterprise cloud, each serving a unique role within the broader network ecosystem.
Multiple client computers are connected in the enterprise networks, indicating a typical office setup. The data center is the core hub that houses application servers and a central database, emphasizing its role in data storage and application management. It is connected to enterprise and manufacturing facility clients, demonstrating centralized access to computational resources.
Residential private networks connect through a VPN, highlighting the security measures for remote access, which is increasingly relevant in modern network designs that accommodate telecommuting. The enterprise cloud section, encased within a Virtual Private Cloud (VPC), features redundant application servers behind a load balancer, illustrating high availability and fault tolerance strategies essential for maintaining continuous service delivery.

2.4. Cloud Architecture Diagrams

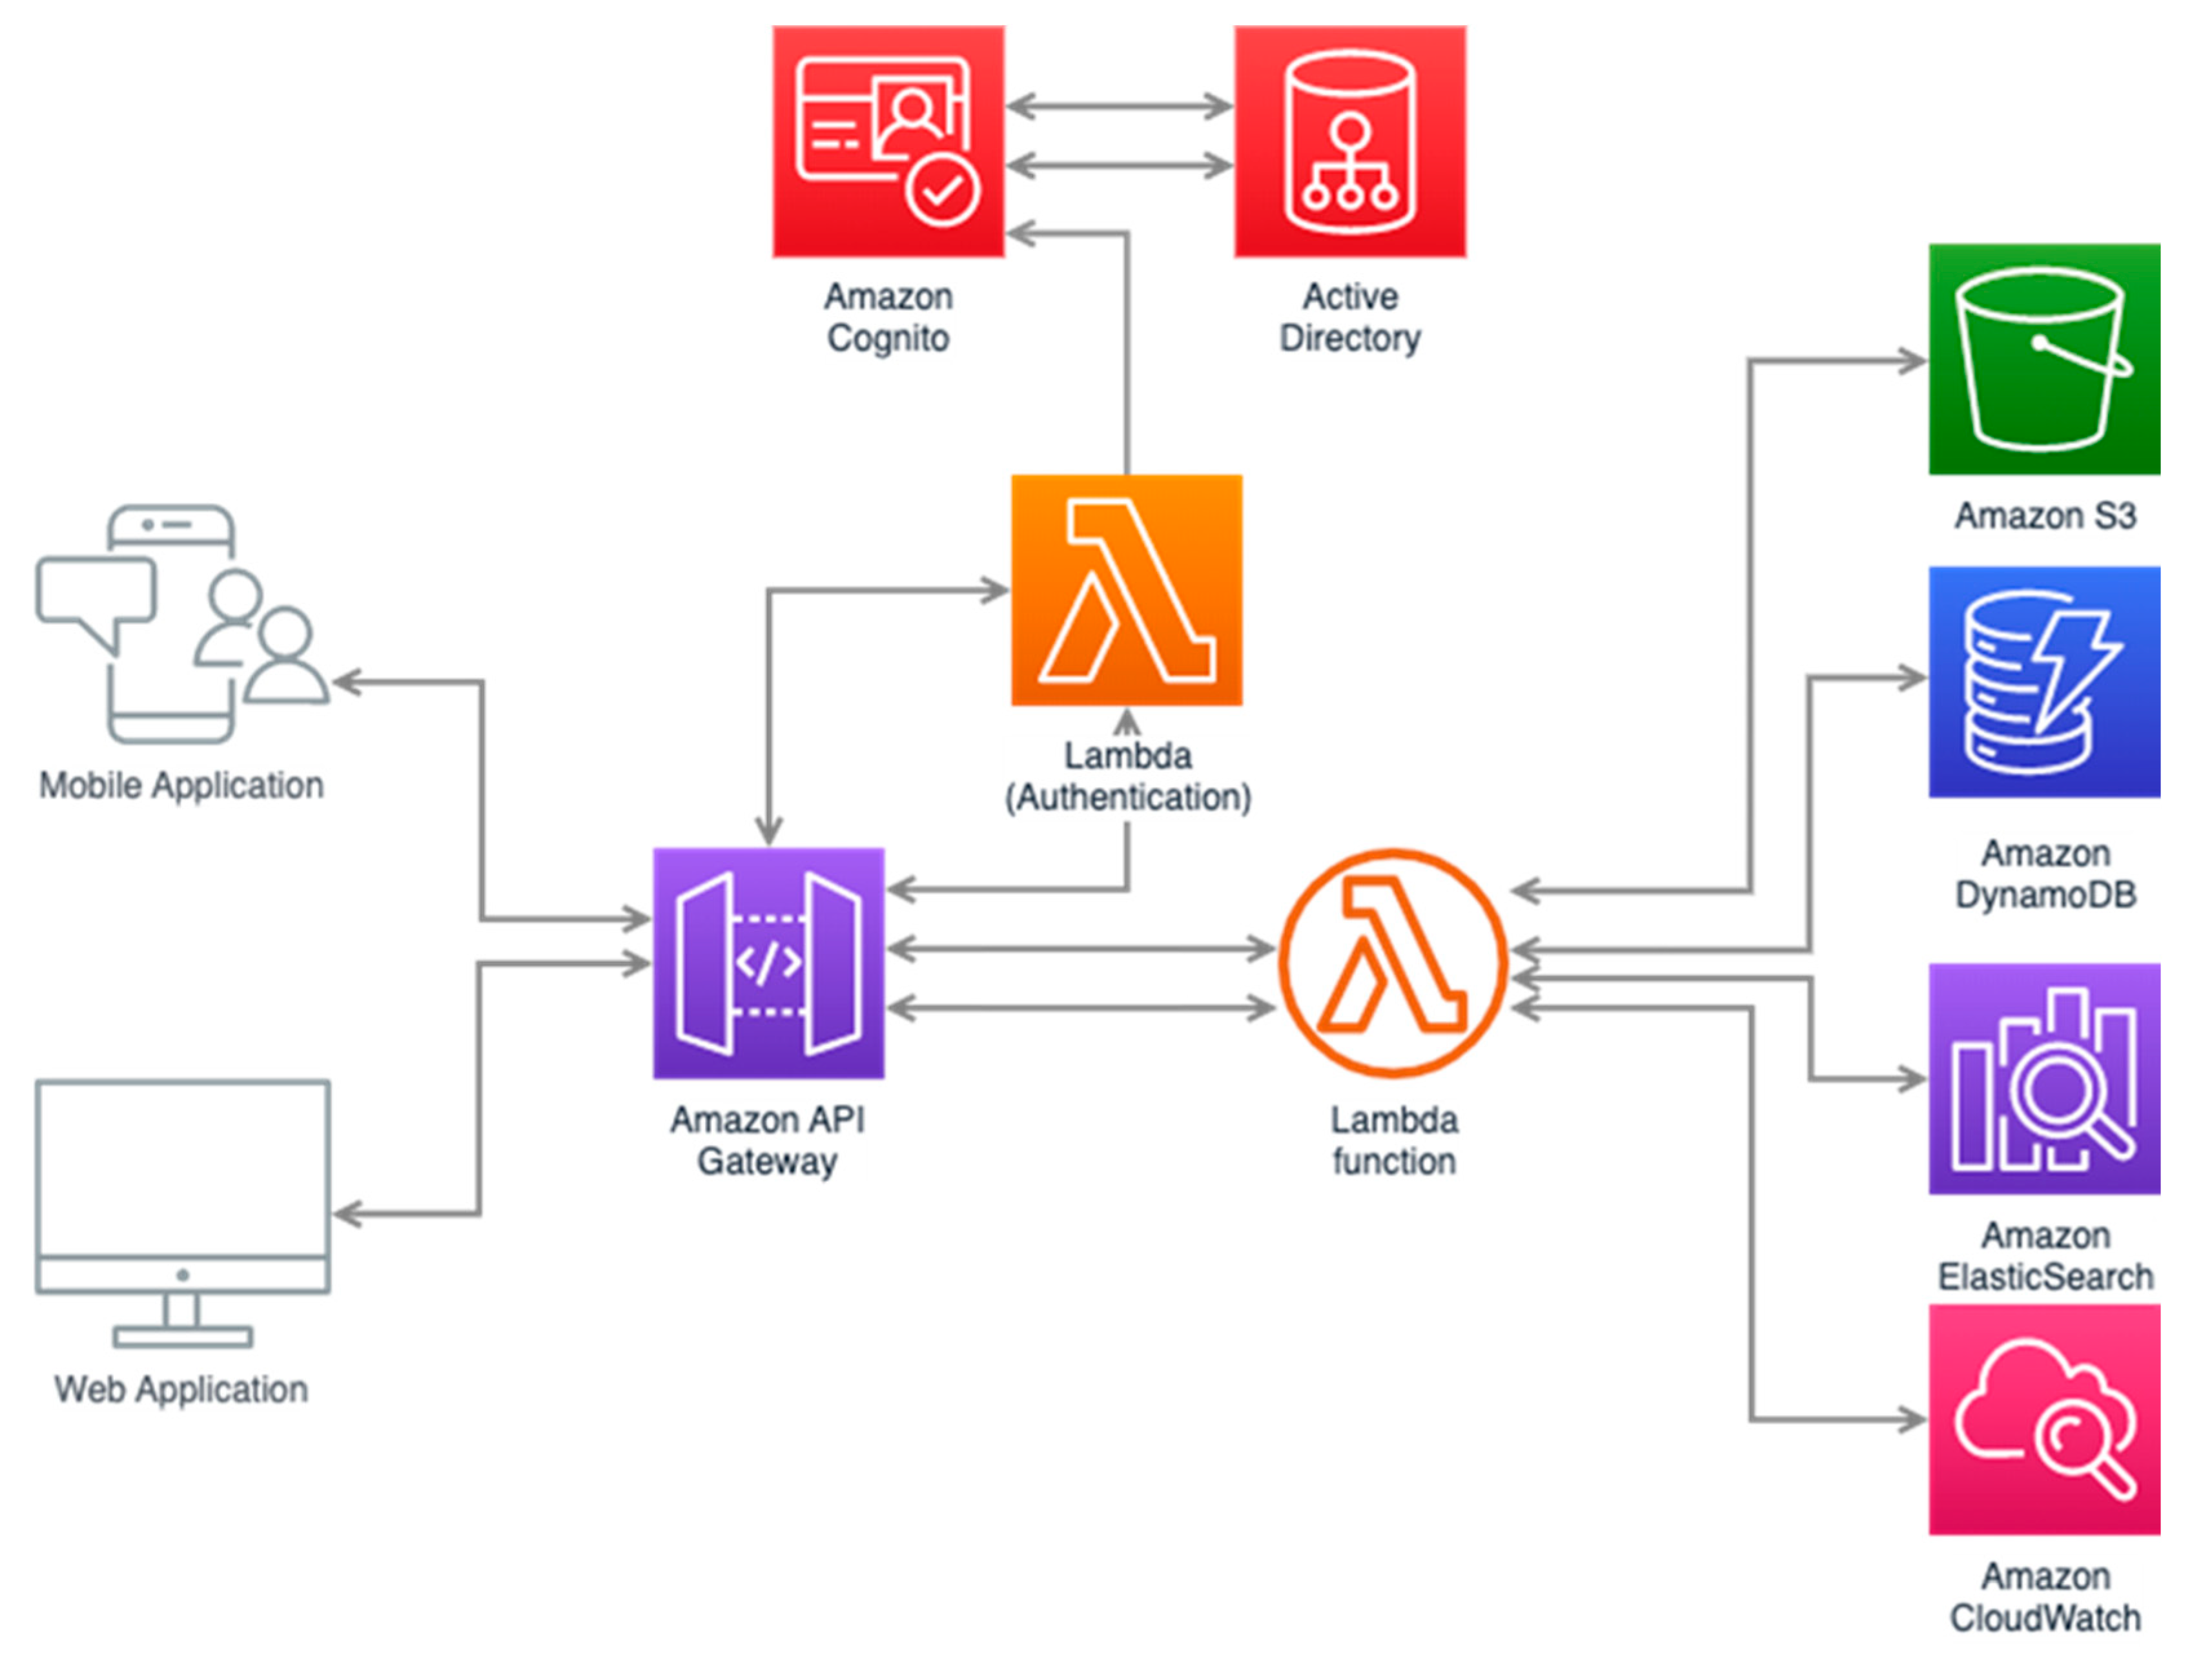
Cloud architecture diagrams are frequently used to communicate the cloud computing services used in a system and the connections between those services. Like a network diagram, a cloud architecture shows logical network connections. However, a cloud architecture diagram tends to focus more on logical data flow and specific use of cloud technologies.
In Figure 3, the provided cloud architecture diagram effectively illustrates the integration and interaction of various cloud services within a sophisticated infrastructure. Central to this architecture is a primary API gateway, facilitating communication between mobile and web applications and ensuring streamlined interactions across different services. Authentication is robustly managed through serverless functions that interface with identity management systems, providing a secure and flexible authentication framework suitable for diverse user environments.
This diagram also highlights the orchestration of multiple cloud services to enhance functionality and performance. Distributed storage systems, scalable databases, and search engines handle data storage and processing, ensuring high availability and quick access to data. Comprehensive monitoring and operational health checks are integrated to demonstrate the system’s ability to maintain performance and reliability efficiently. This architectural visualization showcases the system’s operational workflows and emphasizes the strategic use of cloud technologies to optimize data flow and resource management within the cloud ecosystem.

2.5. Structural Diagrams

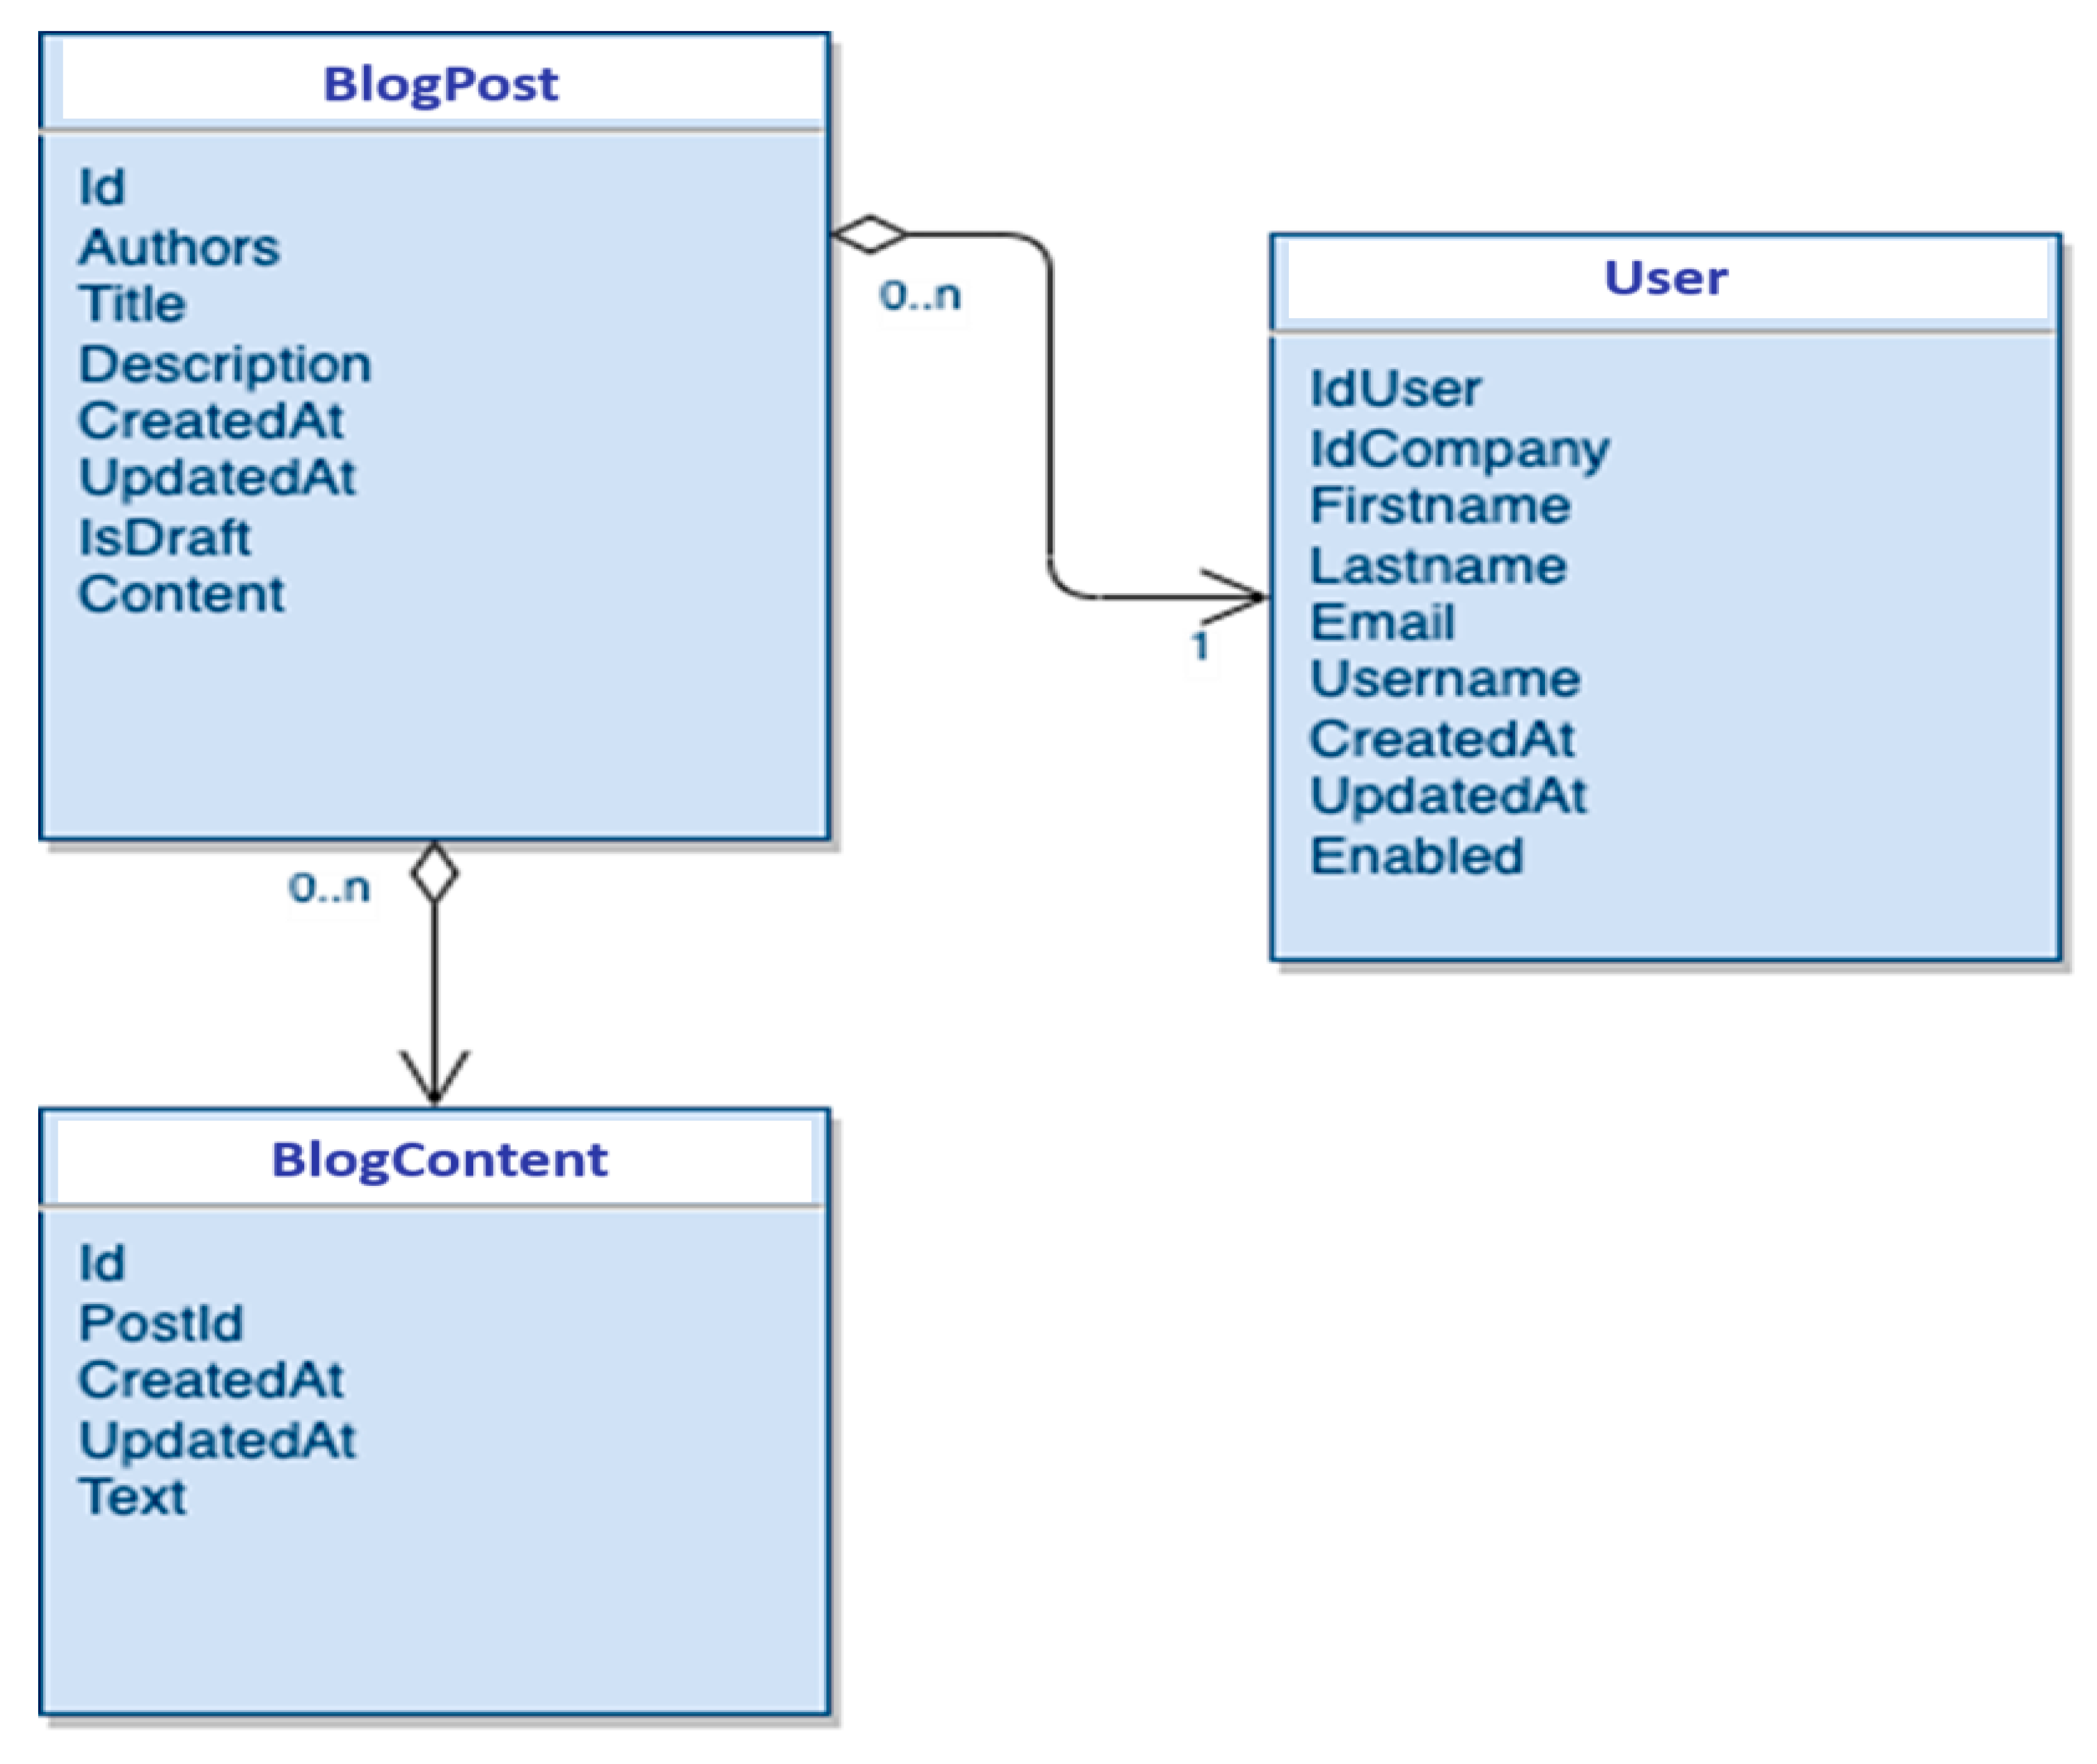
An Entity Relationship Diagram (ERD) communicates the structure and relationships between data tables [8]. For example, the ERD example (Figure 4) outlines the data relationships within a blog management system featuring three primary entities: User, BlogPost, and BlogContent. The User entity stores comprehensive user details and has a one-to-many relationship with the BlogPost entity, indicating that a single user can author multiple blog posts. Each blog post includes attributes such as title, description, and content status (draft or published) and can be associated with multiple BlogContent records, which handle potentially large or segmented text elements of each post. This ERD effectively showcases the structured data interactions fundamental to the platform’s operation, emphasizing how content is authored, stored, and updated.
This diagram style has different syntaxes depending on the language (e.g., UML and SysML), but the general purpose is the same [8,9]. This type of diagram shows the objects or data entities in a system. It can be used to represent database tables or class relationships. Similar diagrams can be used in cyber-physical domains using SysML to show the logical structure of a system [8].

2.6. Other Diagram Types

There are many other types of diagrams used in software and systems engineering. These sometimes overlap in purpose or syntax and lack consistency in notation. The examples above illustrate the variety of these diagram types in syntax and purpose.
Other diagrams that could be considered are [8,9]:
  • Sequence Diagrams
  • Use Case Diagrams
  • Deployment Diagrams
  • Component Diagrams
  • State Machine Diagrams
  • Class Diagrams
  • Package Diagrams
It is important to note that the methodology presented in this documentation is not just a solution to a single diagram type but a comprehensive approach to data extraction and modeling. It is designed to be a general solution, providing a broad understanding and application of these concepts in various scenarios.

3. Research on Diagramming Tools

3.1. Overview of Diagramming Tools

Various tools are available for creating software diagrams, each offering unique features for different use cases. One prominent tool is Diagrams.net, previously known as Draw.io. This web-based tool can generate various general-purpose diagrams [10]. A desktop version (Draw.io Desktop [11]) and an unofficial Visual Studio Code (VSCode) extension [12,13] are available, enabling software developers to edit diagrams directly within their development environment.
Diagrams created with Diagrams.net use the ‘.drawio’ format, an XML-based format specifically designed for storing graph data structures [14]. This format is highly parsable, making it suitable for embedding diagrams in Markdown files and facilitating data extraction for further analysis.

3.2. Integration with Visual Studio Code

One method explored for diagramming is using the Draw.io VSCode extension by Henning Dieterichs [12]. This extension embeds the Draw.io application into VSCode so that files with ‘.drawio’, ‘.drawio.svg’, or ‘.drawio.png’ extensions will be opened in a Draw.io tab rather than a text file.

3.3. Evaluation and Selection of Diagramming Tools

Other tools considered for this research include Microsoft Visio, Lucidchart, and Gliffy. Each of these tools offers various features and capabilities. However, Diagrams.net was selected for its accessibility, open-source nature, and widespread use in the software engineering community. Both the desktop application and the VSCode extension were employed in this study to generate diagrams, highlighting the tool’s versatility and general-purpose use case.
The selection process is critical to this research, as it underscores the importance of choosing tools that meet the technical requirements and support open standards and community-driven development. This ensures the long-term viability and ease of integration into diverse workflows, providing a sense of security about the tools’ suitability for your needs.

4. Methodology

This section outlines a comprehensive method for creating structured models from informal diagrams, focusing on practical applications in software architecture documentation and analysis. The methodology bridges the gap between informal design artifacts and structured models, enhancing the precision and utility of architectural documentation.
The proposed methodology is grounded in graph theory and model-driven engineering principles. It leverages the concept of model transformation, where an informal visual representation (the source model) is systematically converted into an analyzable representation (the target model). This approach aligns with the Model-Driven Architecture (MDA) paradigm [15], enabling the separation of design from architecture.
1.
Step 1: Informal Diagram Creation: Begin with a diagram demonstrating the system’s features. This step relies on visual thinking, which has been shown to enhance the understanding and communication of complex systems [16]. While various diagramming tools can be used, the focus is on tools that embed structural metadata within the diagram file.
Key considerations:
  • Choose a diagramming tool that supports metadata embedding
  • Ensure the diagram captures essential system elements and relationships
  • Consider using standardized notations (e.g., UML or ArchiMate) for improved interoperability
For example, we can use the .png format due to its ease of use and the ability to embed metadata within the image file. Draw.io can create a simple activity diagram (see Figure 5) and save it as a draw .png file.
2.
Step 2: Structural Data Extraction: Extract the embedded structural data from the diagram file. This step is crucial for preserving the semantic information inherent in the visual representation.
Theoretical basis:
  • Information theory concepts of data encoding and decoding [17,18]
  • Metadata standards and their role in knowledge representation [18,19]
Extraction techniques may vary based on the file format but generally involve:
  • Parsing the file structure
  • Identifying and isolating the metadata section
  • Decoding the metadata into a machine-readable format
For example, we can extract the MxFile data from an image. The MxFile XML contains the diagram’s structural data and is embedded as metadata within the .drawio.png file. This metadata can be extracted using appropriate tools or libraries capable of reading and parsing the image file’s metadata section.
3.
Step 3: Intermediate Format Conversion (Optional): If needed, convert the extracted data into an intermediate format for easier processing. This step adheres to the principle of separation of concerns, isolating the complexities of different file formats from the core transformation logic.
Considerations:
  • Choose a format that balances human readability with machine processability (e.g., JSON or YAML)
  • Ensure the chosen format can adequately represent all relevant diagram elements and their properties
  • Consider using established data exchange formats such as XMI (XML Metadata Interchange) for improved interoperability [20]
For example, convert the MxFile XML to JSON as an intermediate step. This is done primarily for the convenience of working with JSON over XML and can be skipped if needed.
4.
Step 4: Graph Model Creation: Transform the data into a graph-based model using a library such as NetworkX. This step leverages graph theory to represent the system structure.
Theoretical underpinnings:
  • Graph theory concepts (nodes, edges, and properties) [21]
  • Isomorphism between visual diagrams and graph structures
Key aspects:
  • Node creation: Represent system elements as graph nodes
  • Edge creation: Represent relationships between elements as graph edges
  • Property mapping: Attach relevant metadata to nodes and edges
  • Preservation of structural semantics from the original diagram
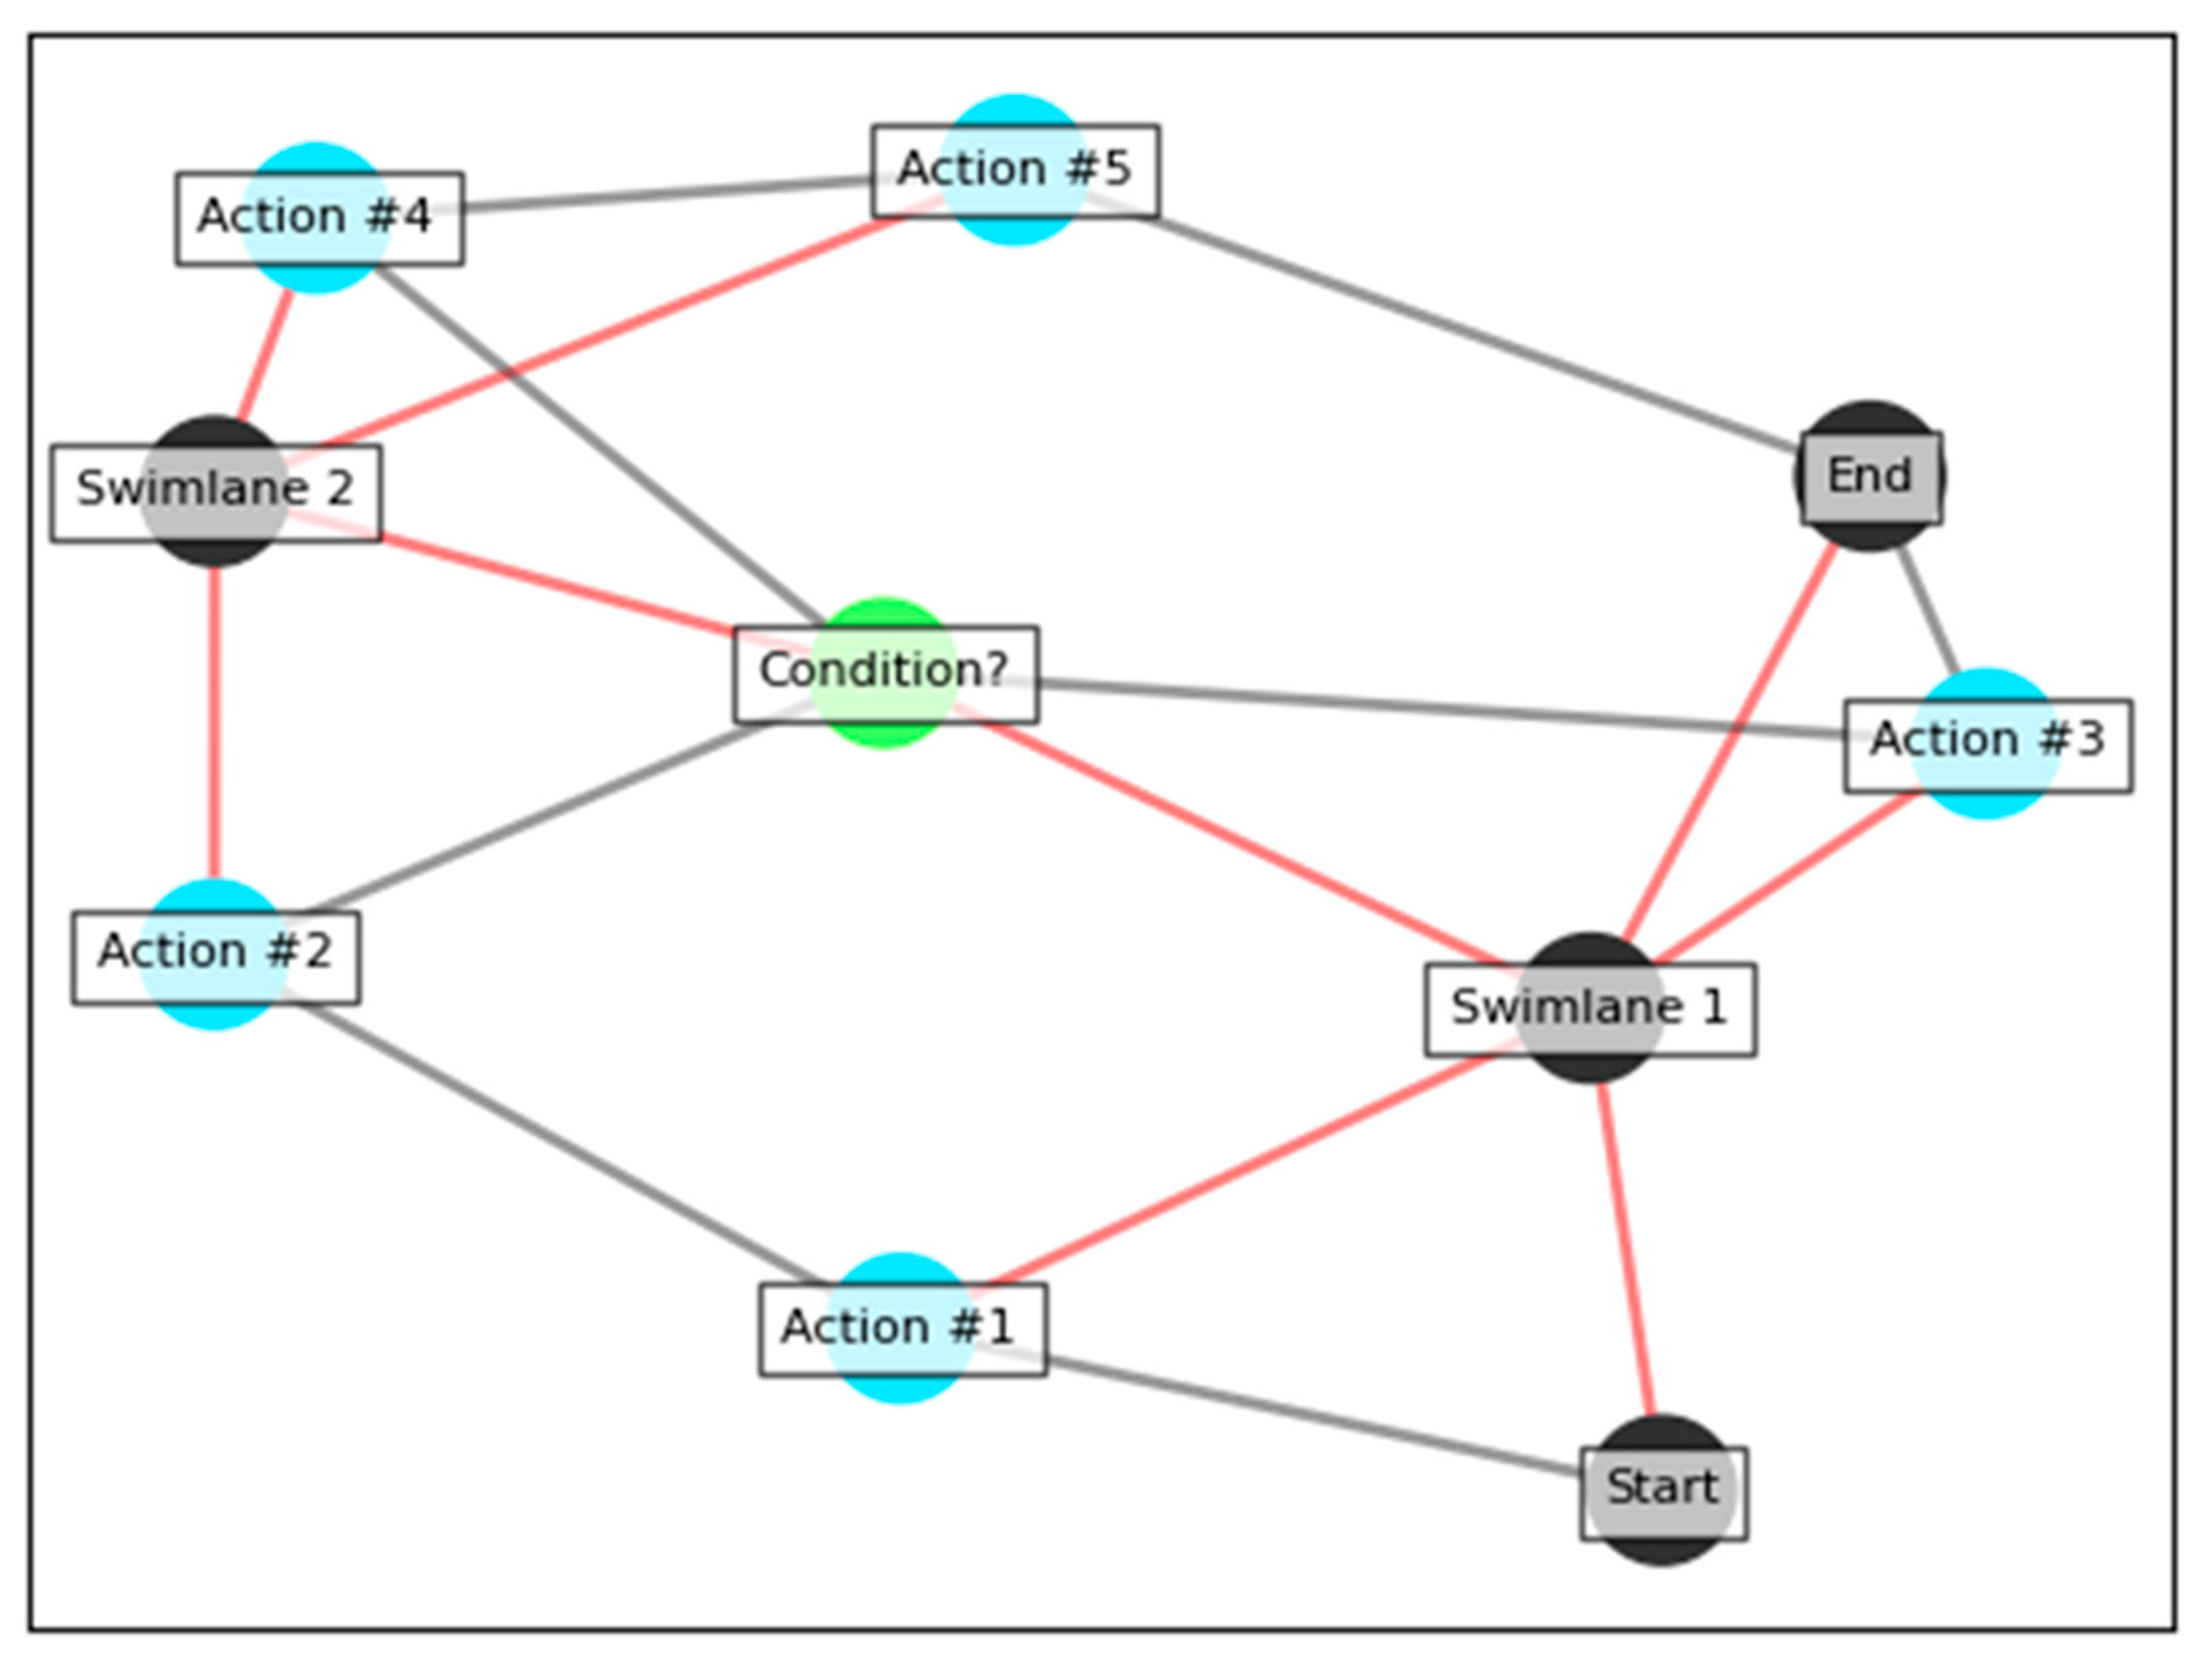
For example, we can use the primary method for demonstration, Draw.io, but the format has no technical limitations. A NetworkX model (see Figure 6) makes a usable format available for analysis or visualization.
5.
Step 5: Information Inference (Optional): Analyze the graph model to infer additional information not explicitly present in the original diagram. This step employs various analytical techniques to enhance the model’s utility.
Theoretical basis:
  • Graph analysis algorithms (e.g., centrality measures and community detection) [22]
  • Spatial reasoning for geometric inferences [23]
  • Ontological reasoning for semantic enrichment [24]
Inference techniques may include:
  • Geometric analysis for containment and proximity relationships
  • Hierarchical structure detection
  • Path analysis for indirect relationships
  • Pattern recognition for identifying common architectural styles or design patterns
These steps allow informal diagrams to be systematically transformed into structured, analyzable models. This methodology enhances the precision and utility of architectural documentation and bridges the gap between informal design artifacts and structured models.
The remaining sections of this paper will cover each of these steps in detail. First, data extraction and format conversion are discussed, followed by inferences. Finally, an end-to-end example demonstrates indexing, query, and analysis concepts.

5. Data Extraction from Informal Artifacts (Example Case)

In alignment with the methodology presented in Section 4, this section illustrates transforming a simple diagram into a structured model. We follow the steps of informal diagram creation, data extraction, format conversion, and model creation as detailed in the methodology.

5.1. File Formats

Step 1 of the methodology emphasizes creating an informal diagram that captures essential system elements and relationships. For our illustrative example, we use a basic “Hello World” diagram (Figure 7) consisting of two nodes labeled “Hello” and “World.” The “Hello” node includes a data property named ‘foo.’ Although simplistic, this example is a clear starting point for understanding the subsequent steps in data extraction and model transformation.

5.2. The .drawio File Format

Following the creation of the informal diagram, Step 2 involves extracting structural data. The ‘.drawio’ format, which uses the MxGraph library, stores graph data within MxFiles. These MxFiles are XML documents that represent the diagram’s structure. Listing 1 shows how the ‘hello.drawio’ file is encoded in XML.
Listing 1. XML Representation of Diagram from draw.io (Diagrams.net).
<mxfile>
  <diagram id=“juJWlWKBKwTHVthH_bm8” name=“Page-1”>
    <mxGraphModel dx=“684” dy=“351”
           grid=“1” gridSize=“10”
           guides=“1” tooltips=“1” connect=“1” arrows=“1”
           fold=“1” page=“1” pageScale=“1”
           pageWidth=“850” pageHeight=“1100”>
      <root>
        …
      </root>
    </mxGraphModel>
  </diagram>
</mxfile>

5.3. The .drawio.svg File Format

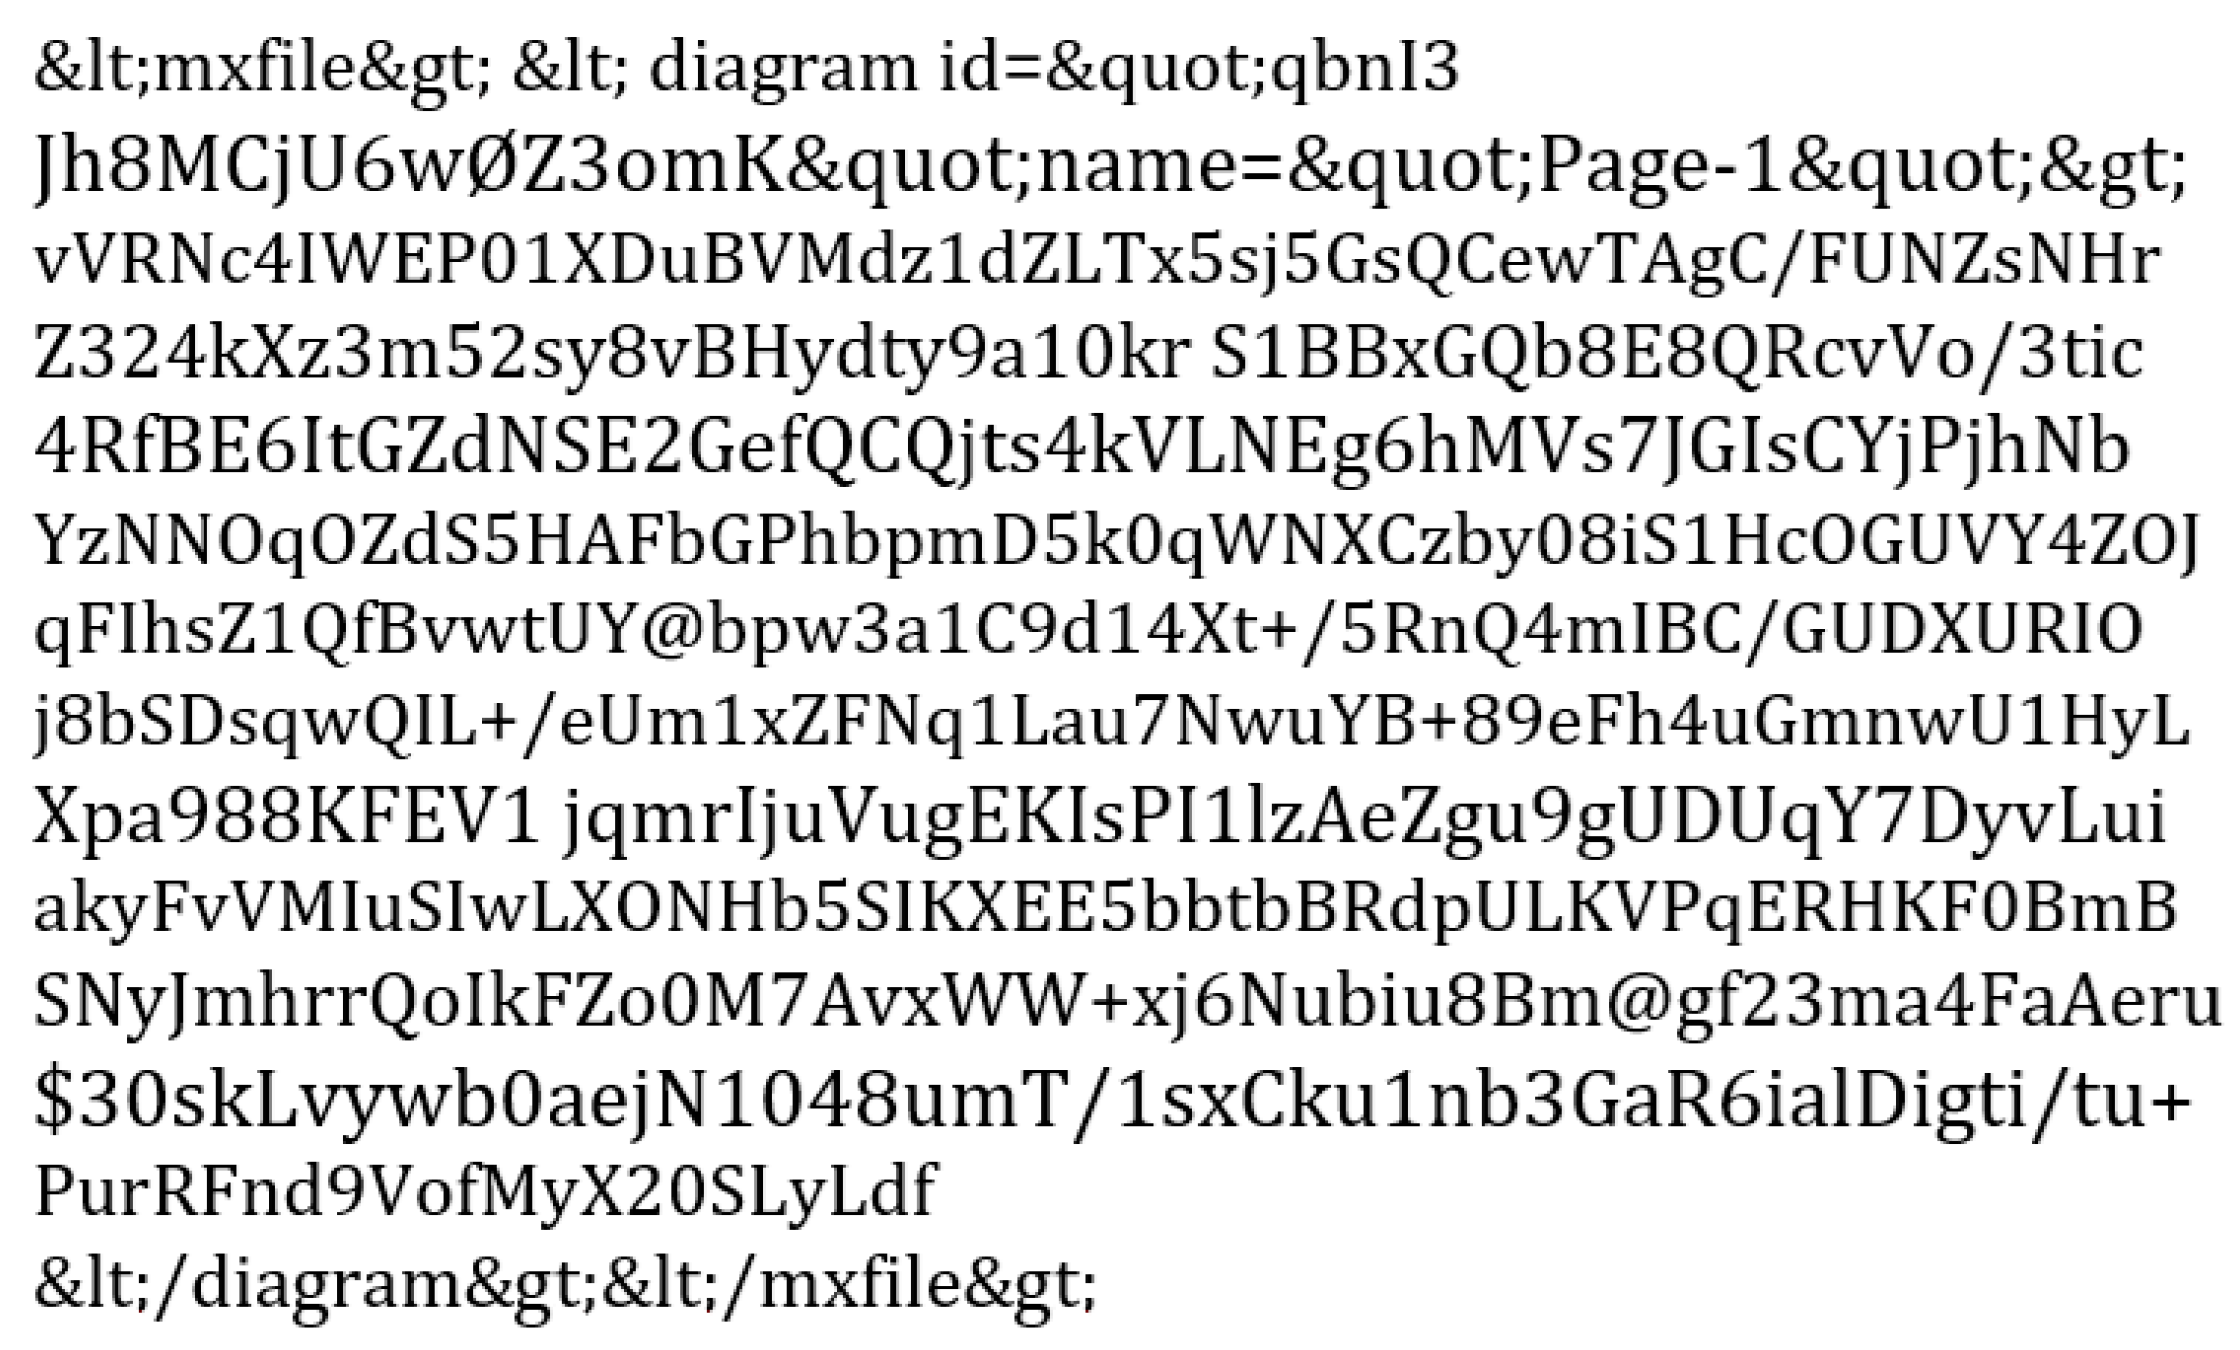
Continuing with Step 2, we explore another format: ‘.drawio.svg.’ This format encodes the diagram as an SVG file, an XML-based document that describes the image’s geometry and style. The MxFile is embedded as a string within the ‘content’ attribute of the top-level SVG tag. The Hello World example’s data are shown in Figure 8.
A series of decoding steps are required to retrieve the MxGraph XML from the SVG file, including URL decoding, deflation, and base-64 decoding. This process aligns with the methodology’s focus on preserving the semantic information inherent in the diagram through proper data extraction (Listing 2).
Listing 2. XML/SVG Content Extraction and Transformation Pipeline with Decoding.
XPath_expression(‘/svg/@content, ‘\\n)
Find_/Replace(
  {option: Regex, string: content=“‘},
  ‘‘, true, false, true, false
)

Find_/Replace(
  {‘option’: ‘Regex’, ‘string’: ‘“‘},
  ‘‘, true, false, true, false
)

From_HTML_Entity()
XML_Beautify(‘\\t, disabled)
XPath_expression(‘/mxfile/diagram[text()]’, ‘\\n)
Strip_HTML_tags(true, true)
From_Base64(A-Za-z0-9+/=‘, true, false)
Raw_Inflate(0, 0, Adaptive, false, false)
URL_Decode()
XML_Beautify(‘\\t)

5.4. The .drawio.png File Format

As per Step 2, the ‘.drawio.png’ format provides another method for embedding diagram data. This format is URL encoded, making the extraction process straightforward [25]. By applying a simple URL decode operation, the MxFile XML data can be retrieved, followed by extraction using a regular expression, as shown in Listing 3.
Listing 3. URL Decoding, Regex Matching, and XML Beautification Workflow.
URL_Decode()
Regular_expression(
  User defined,
  ‘<mxfile>.*</mxfile>‘,
  true, true, false, false, false, false,
  List matches
)
XML_Beautify(‘\\t)
This step is consistent with the methodology’s emphasis on selecting formats that support metadata embedding and efficient extraction techniques.

6. Extracting Data from PNGs

Continuing with Step 2 of the methodology, this section details how to extract the MxFile from a ‘.drawio.png’ file and convert it into a more processable format.

6.1. Retrieving the MxFile

The following Python function extracts the MxFile XML data. This function takes the file path (‘fpath’) of the ‘.drawio.png’ file as input and returns the MxFile XML as a string (Listing 4). This step ensures the preservation of the structural semantics embedded within the diagram, as described in Step 2 of the methodology.
Listing 4. Extracting mxfile Content from PNG with URL Decoding and Regex.
def get_mxfile(fpath):
  pngbytes = open(fpath, mode=‘rb’).read()
  png = pngbytes.decode(‘utf-8’, errors=‘ignore’)
  decoded = unquote(png, encoding=‘utf-8’)
  match = re.search(‘<mxfile>.*</mxfile>’, decoded)
  mxfile = match.group(0)
  return mxfile

6.2. Intermediate Format Conversion

Step 3 of the methodology involves converting the extracted data into an intermediate format for easier processing. The Python code in Listing 5 demonstrates converting the MxFile contents into JSON format.
Listing 5: Parsing and Converting mxGraph XML to JSON Using xmltodict.
xml = get_xml(fpath)
d = xmltodict.parse(xml)
mxgraph = d[mxfile][diagram][mxGraphModel]
graph = MxGraph(mxgraph)
print(json.dumps(graph.g, indent=4))
This conversion aligns with the methodology’s principle of separation of concerns, where the complexities of the original file format are isolated from the core transformation logic.
This step utilizes a custom MxGraph class to parse the MxGraph into a flattened list of dictionaries, ensuring the data remain machine-readable and ready for further processing.

7. Creating Models

With the data in a manageable format, Step 4 of the methodology involves transforming these data into a graph-based model using NetworkX. This step created the system structure, adhering to the graph theory concepts discussed in the methodology.

Intermediate Format Conversion

The Python code in Listing 6 illustrates how the extracted and converted data are traversed to identify diagram elements as nodes or edges:
Listing 6. Converting Diagram Elements to a NetworkX Graph with Nodes and Edges.
def to_networkx(elements):
  G = nx.Graph()
  nodes = []
  edges = []

  # Loop over all diagram elements
  for element in elements:
    # Get the element ID
    _id = element.get(‘@id, None)

    # If the element is a vertex
    if element.get(‘@vertex, None) == 1’:
      nodes.append((element.get(‘@id’), element))

    # If the element is an edge
    elif element.get(‘@edge’, None) == 1’:
      src = element.get(‘@source, None)
      tgt = element.get(‘@target, None)
      edges.append((src, tgt, element))

  # Add the nodes
  G.add_nodes_from(nodes)

  # Add the edges
  for e in edges:
    print(fAdding edge {e[0]} --> {e[1]}’)
    G.add_edge(e[0], e[1], **e[2])

  return G
These elements are then added to a NetworkX graph, representing the system’s structure. This process follows the methodology’s guidance on node creation, edge creation, and property mapping, ensuring that the structural semantics from the original diagram are preserved.

8. Inferring Additional Information

After completing Step 4, we proceed to optional Step 5, which involves analyzing the graph model to infer additional information. This step enhances the utility of the model by leveraging various analytical techniques.

8.1. Geometric Inferences

One type of inference involves identifying geometric relationships within the diagram, such as containment or proximity. For example, nodes within a container (such as a network enclave) can be identified and linked in a network diagram based on their geometric relationships. Listing 7 demonstrates a simple geometric filtering technique.
Listing 7. Determining Containment Relationships Between Graph Nodes Based on Bounds.
for i in graph.nodes:
  for j in graph.nodes:
    # The bounds of element i
    xi_lim = (i.x, i.x + i.width)
    yi_lim = (i.y, i.y + i.height)

    # The bounds of element j
    xj_lim = (j.x, j.x + j.width)
    yj_lim = (j.y, j.y + j.height)

    # True if element j’s x bounds are inside element i’s x bounds
    xj_in_xi = (xi_lim[0] < xj_lim[0] and xj_lim[1] < xi_lim[1])

    # True if element j’s y bounds are inside element i’s y bounds
    yj_in_yi = (yi_lim[0] < yj_lim[0] and yj_lim[1] < yi_lim[1])

    # If element j‘s X and Y bounds are inside elementi’s bounds,
    # create a relationship identifying element j is inside i
    if xj_in_xi and yj_in_yi:
      graph.add_edge(j, i, relationship=in)
In this example, the graph is analyzed for nodes that are inside other nodes. By comparing each node to each other node, elements whose bounds lie entirely within the bounds of another element are identified. If this condition is true, a relationship is added between those two elements. While this may be an inefficient approach to this problem at scale, diagrams are designed to be visual. They, therefore, should not reach a scale where this becomes a computationally hard problem.

8.2. Parent–Child Relationships

Similarly, hierarchical relationships, such as parent–child connections, can be inferred using the Python code depicted in Listing 8.
Listing 8. Establishing Parent–Child Relationships Between Graph Nodes.
for i in graph.nodes:
  for j in graph.nodes:
     if i.parent == j:
      graph.add_edge(i, j, relationship=parent)
      graph.add_edge(j, i, relationship=child)
This approach is particularly useful when elements are nested within others, a common feature in MxGraph diagrams. The code creates bi-directional relationships between the parent and child elements, consistent with the methodology’s emphasis on preserving logical relationships within the model.

8.3. Other Inferences

Other inferences that can be made from the graph model include:
  • Traversing Intermediate Connections: This technique allows for an understanding of the indirect relationships between diagram elements, as suggested in the methodology’s discussion of path analysis.
  • Grouping by Proximity: This method groups related elements based on their spatial proximity, enhancing the model’s interpretability.
  • Element Type Identification and Edge Labeling: Future work could involve refining the model by identifying different diagram elements and incorporating edge labels, adding further granularity to the analysis.

9. End-to-End Example

In this section, an end-to-end example begins with an architecture diagram and uses the data extraction methods presented to generate models that can be queried. Analysis techniques are demonstrated to answer representative real-world questions and provide insight into a system.

9.1. Creating the Model

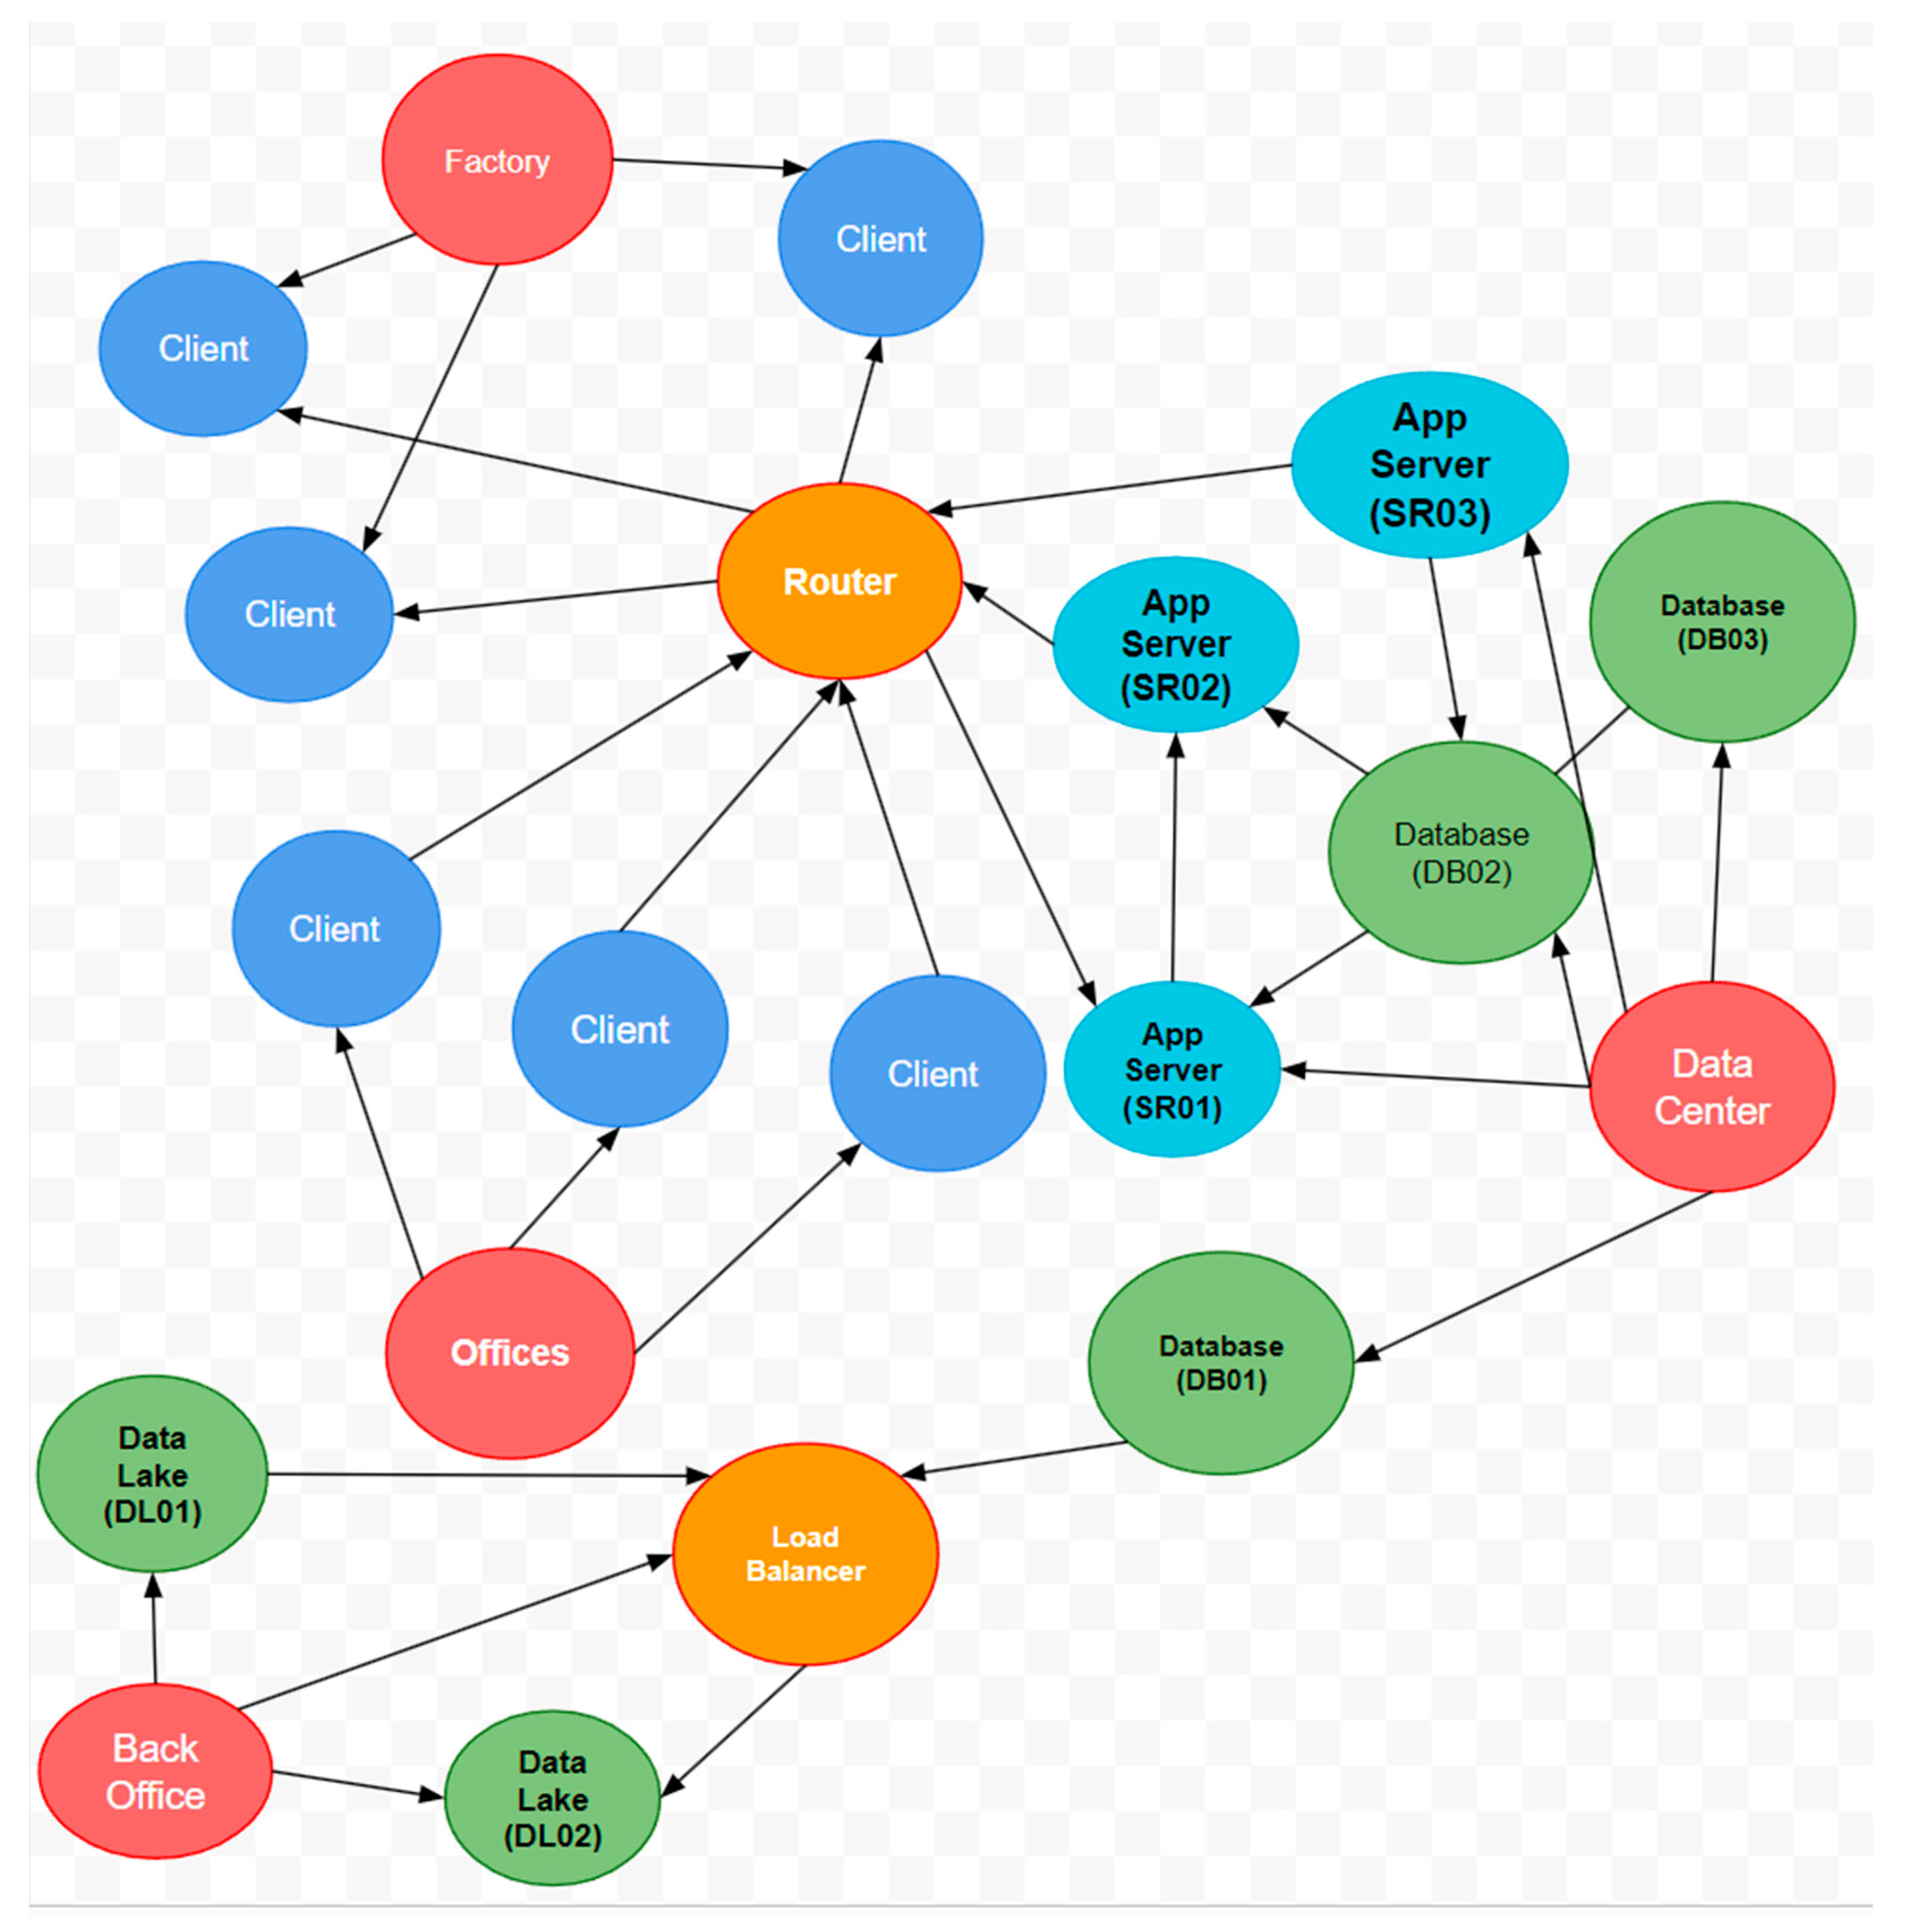
This network diagram (Figure 9) provides a detailed visualization of the infrastructure typically deployed in a small business, segmenting the network into four distinct enclaves: Enterprise Offices, Manufacturing Facility, Data Center, and Cloud-Based Back-Office Analytics. The Enterprise Offices are connected through a router, illustrating the flow of information from multiple client computers within the office environment. This setup is essential for office staff’s day-to-day operations, providing them access to centralized data and on-site applications.
The diagram further shows the Data Center, which houses multiple application servers and database nodes labeled SRV01, SRV02, and SRV03 and DB01, DB02, and DB03, respectively, indicating a robust setup for handling various business applications and data storage needs. Back-office analytics are handled in the cloud, featuring a load-balanced environment with Data Lake nodes for advanced data processing and analytics. This separation highlights the specialized use of cloud resources for handling large-scale data processing separate from the everyday operational data, optimizing performance and scalability. Additionally, the Manufacturing Facility is depicted with fewer details, showing connections between the workstation and mobile clients, emphasizing its operational independence but integration into the broader network architecture.
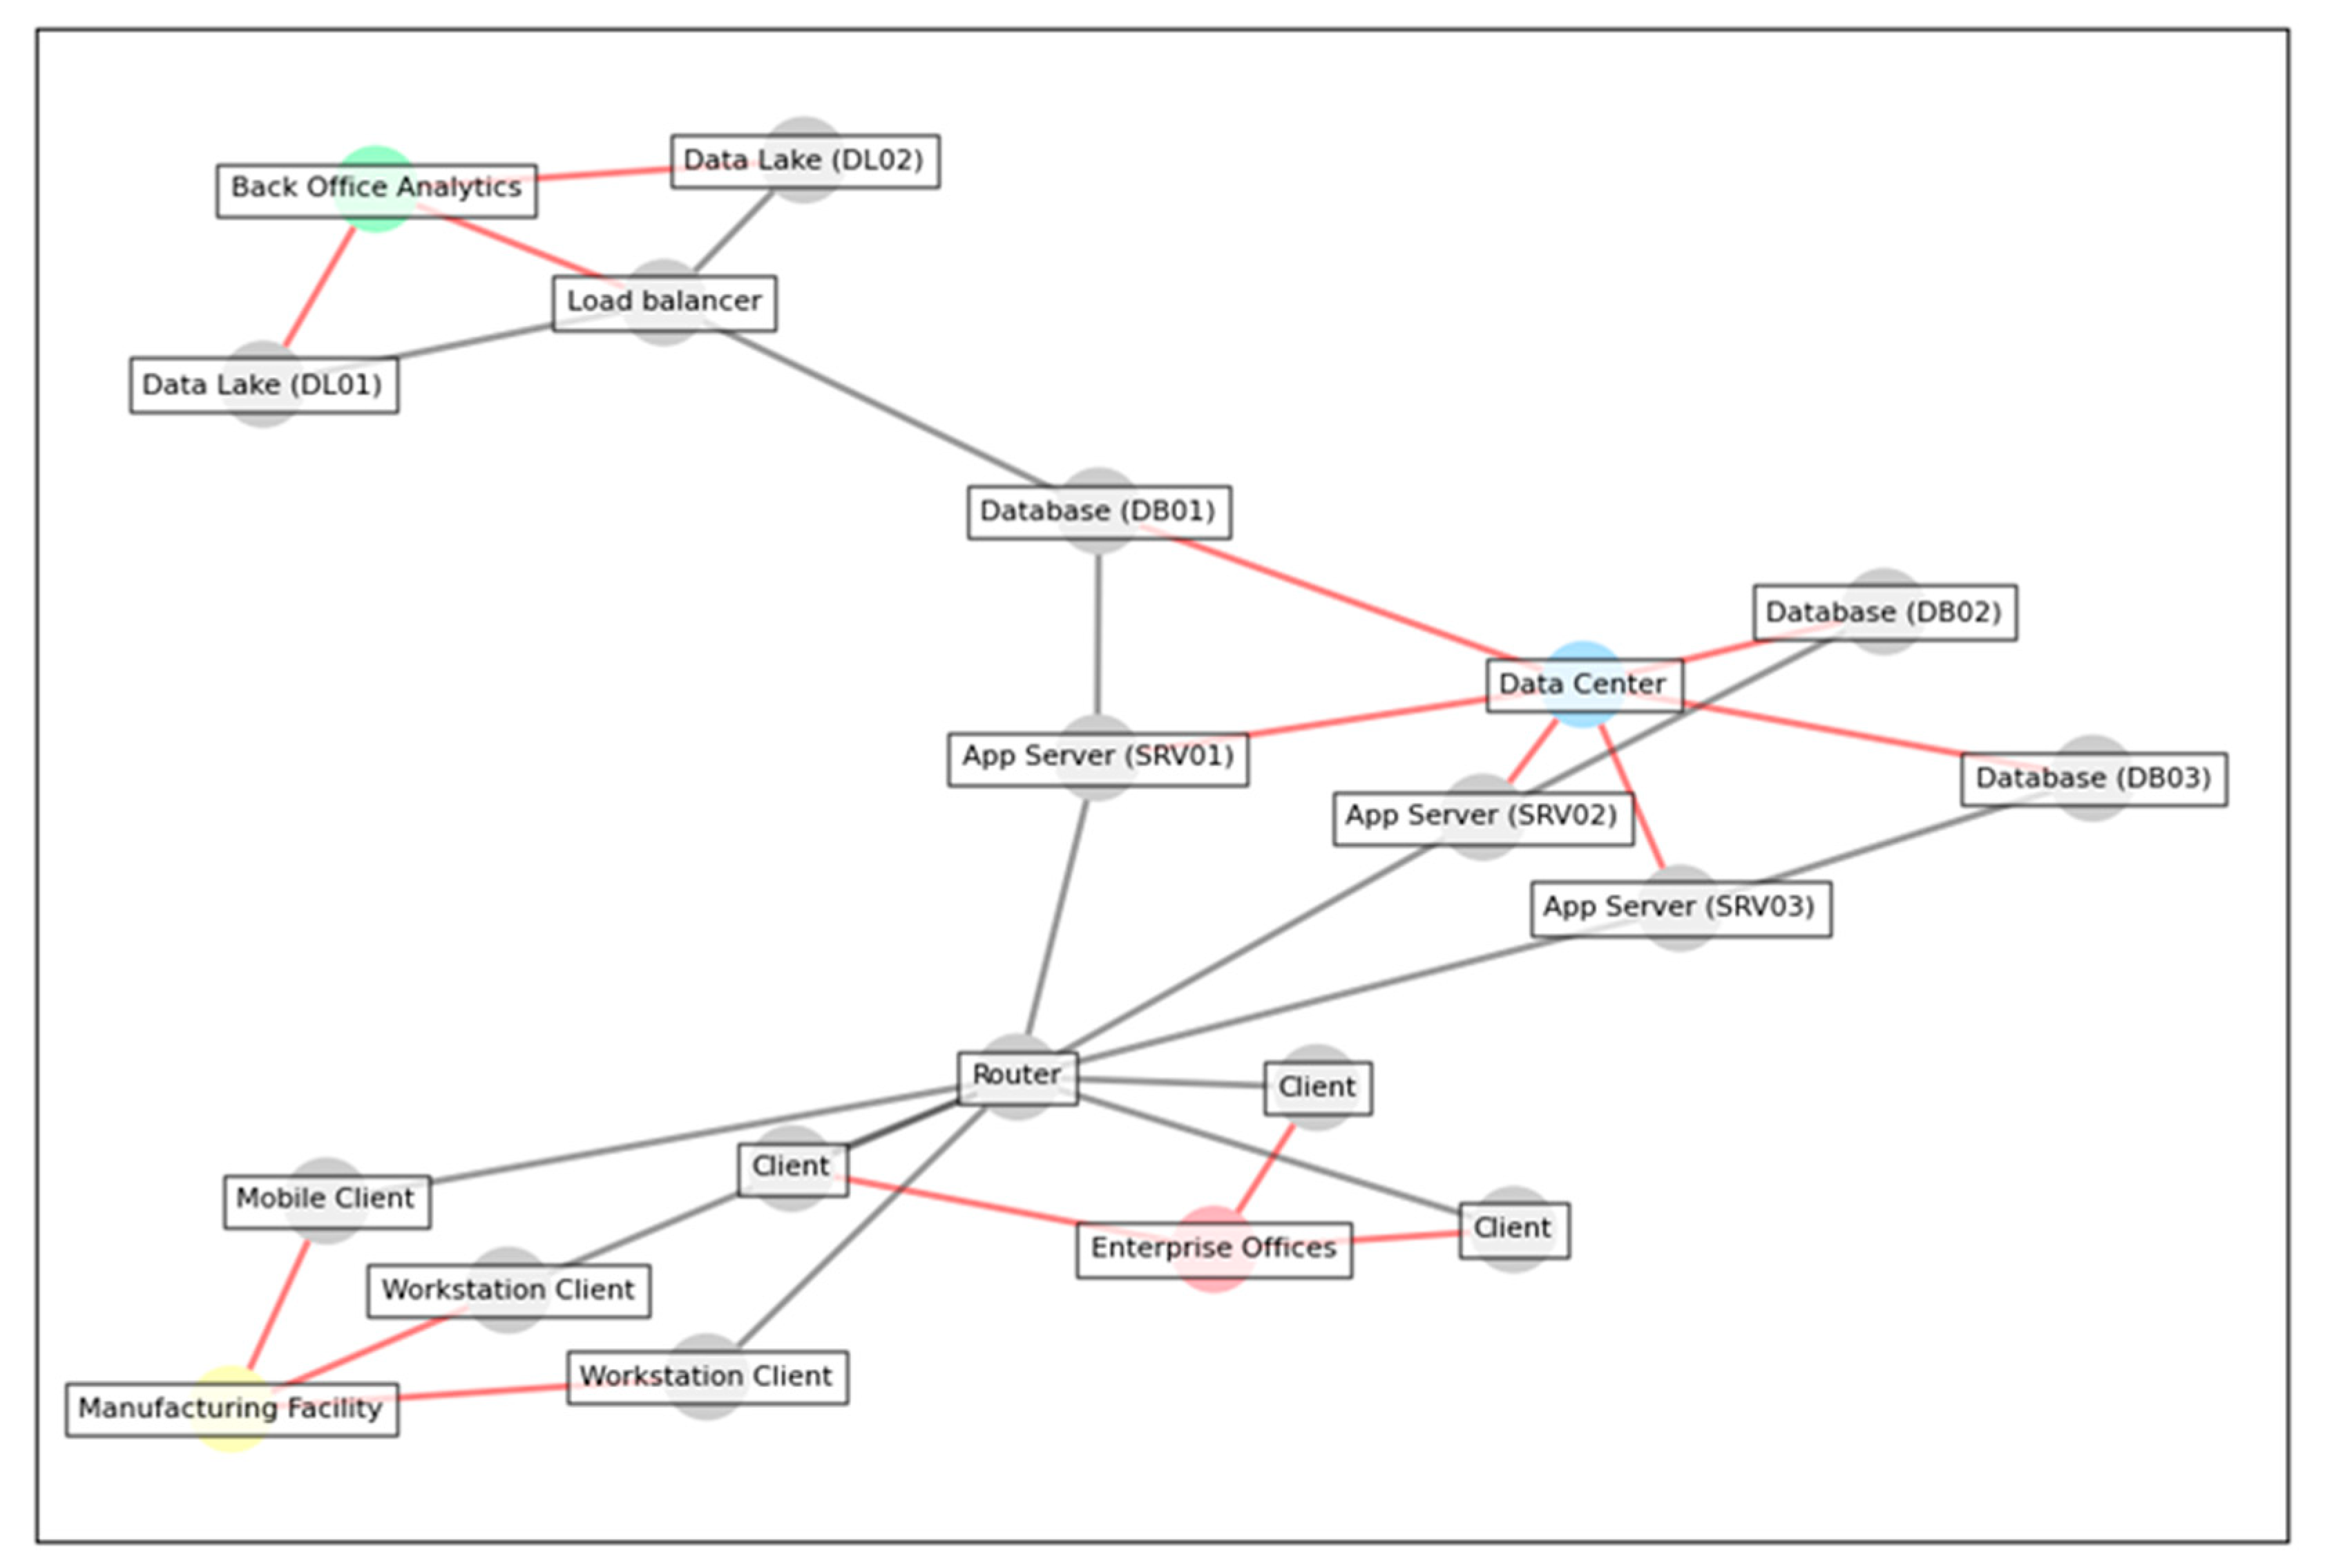
This example will demonstrate how one might analyze a network to understand interactions between systems, analyze impacts, or assess risk. Next, the diagram is converted to a NetworkX graph, and additional information is inferred, as described in the previous sections. The edges colored red are the inferred relationships that capture the geometric containment (“in” relationships”) of diagram elements inside the network enclaves (Figure 10). In the following sections, this information is used to show how to query the model.

9.2. Indexing with Graph Databases

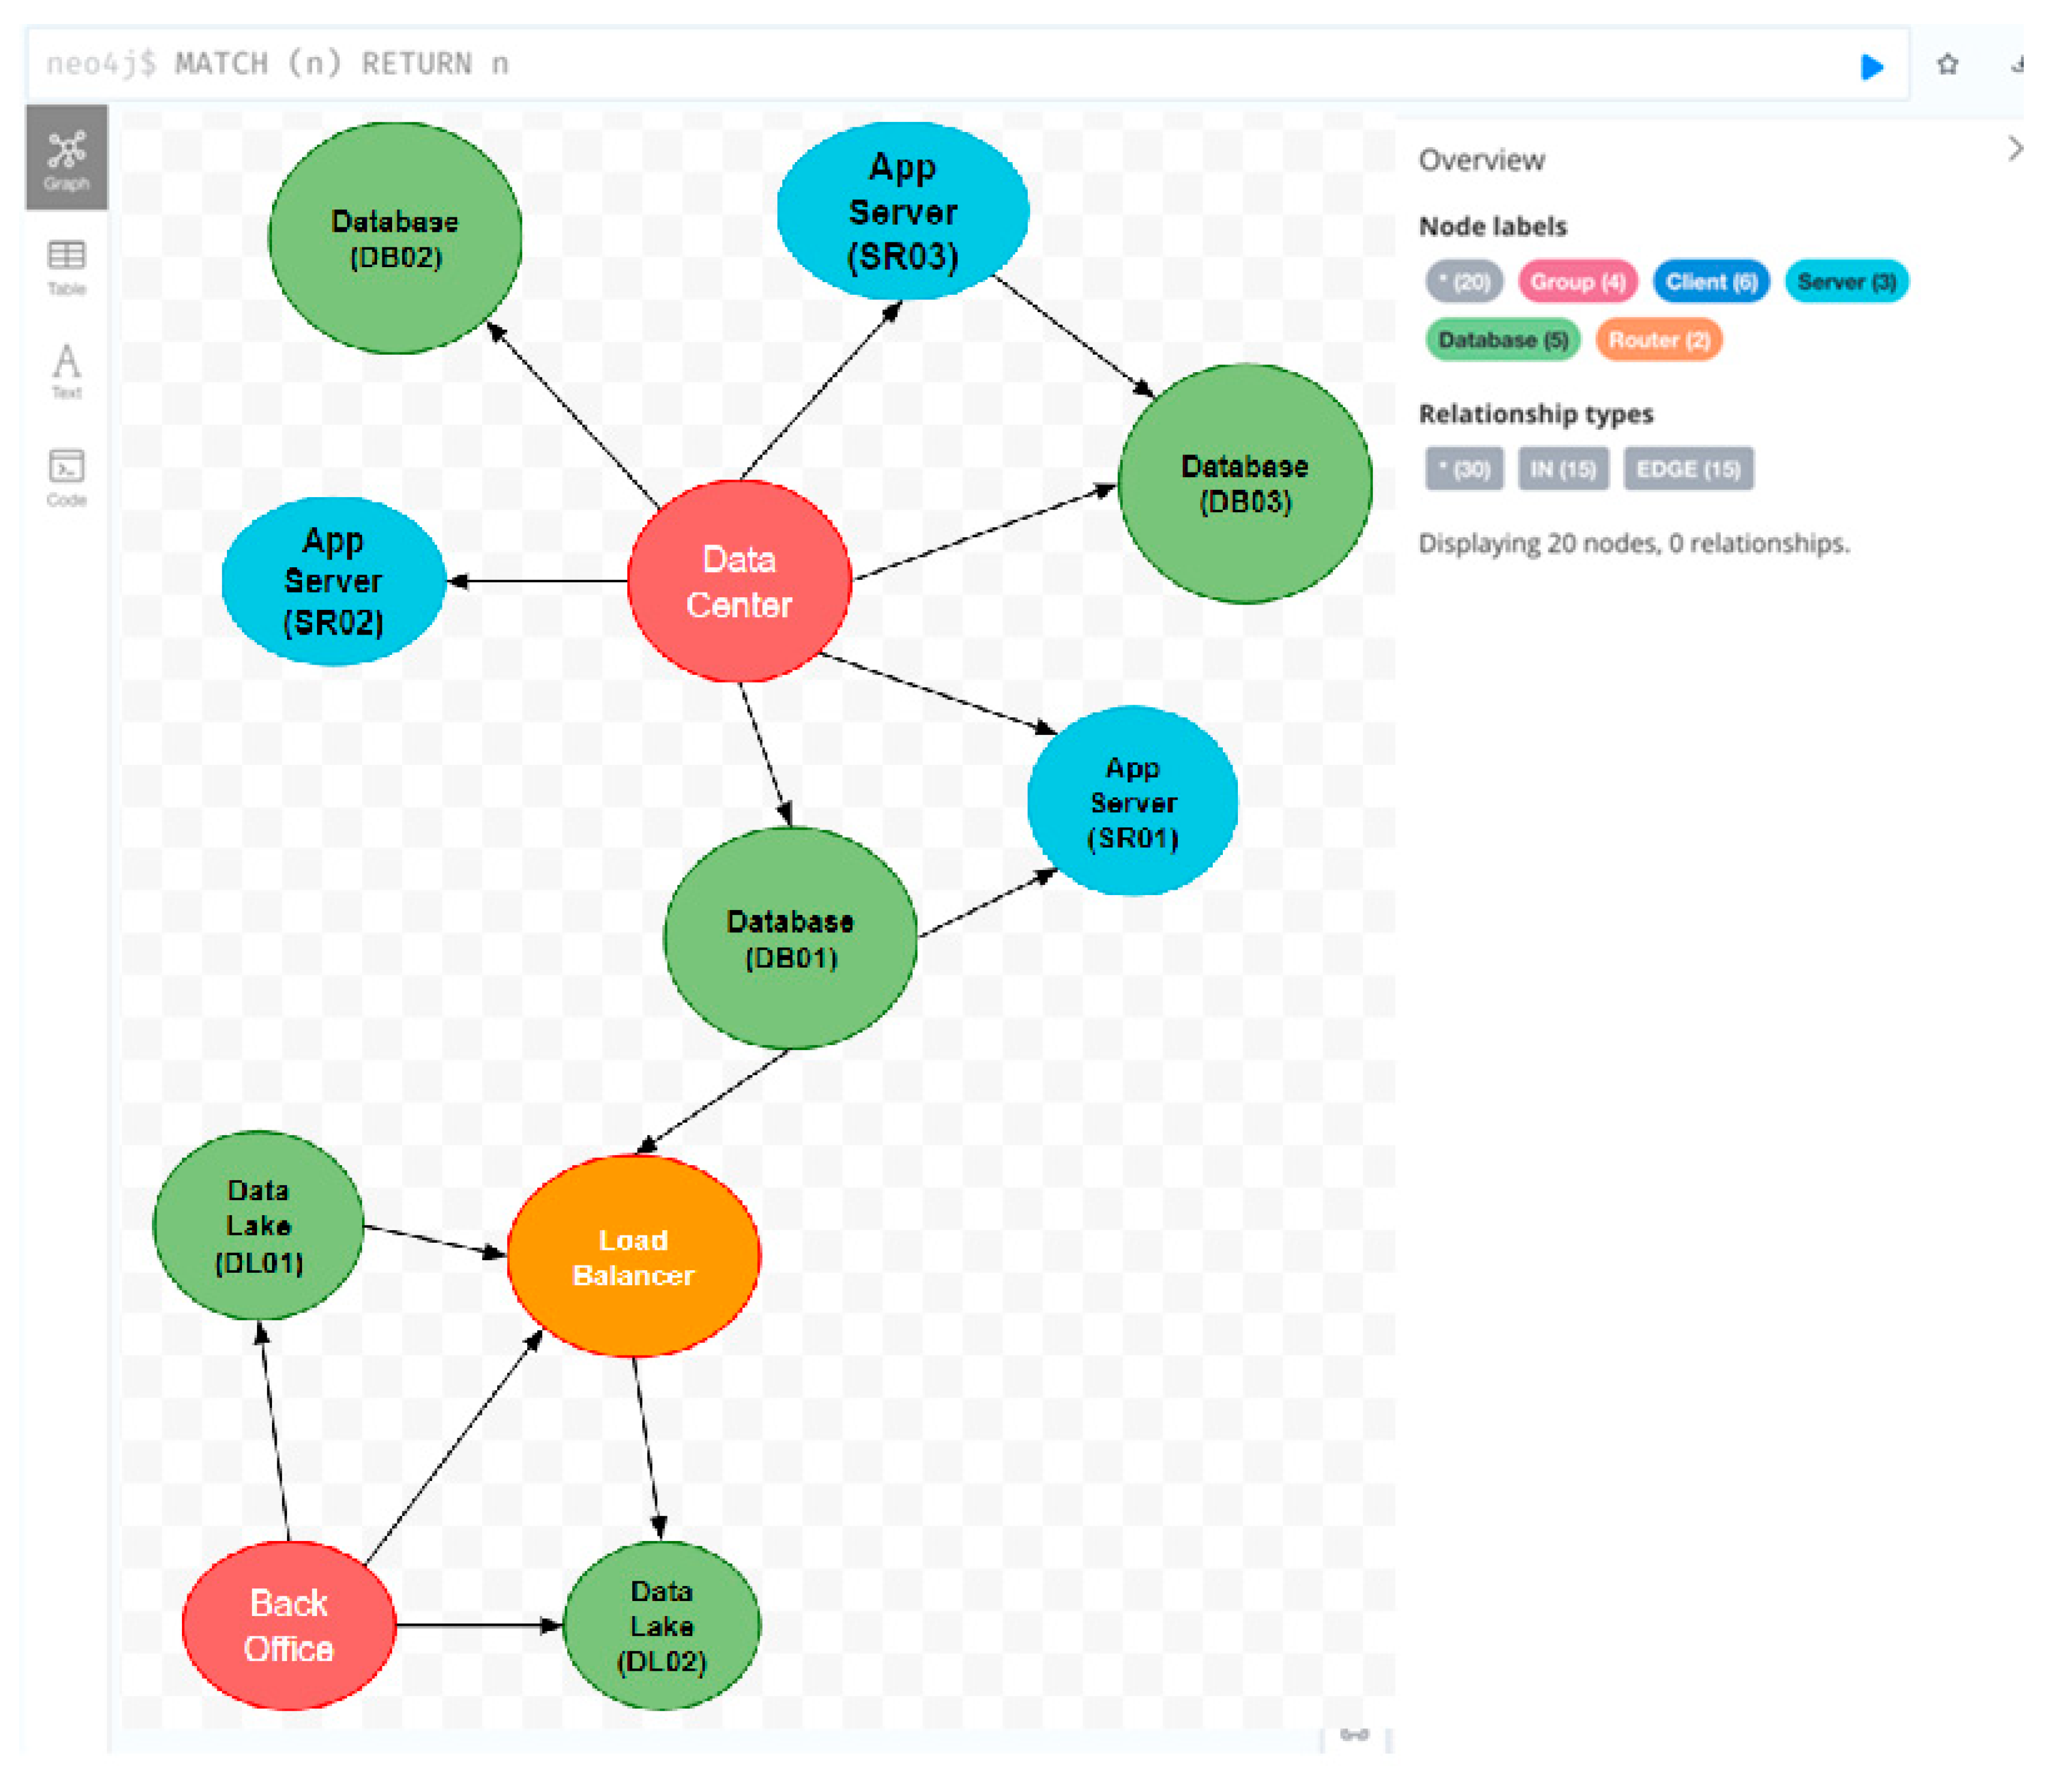
Indexing the graph using a Graph database allows more complex queries to be performed using the Cypher query language. Figure 11 shows a simple representation of the graph in Neo4j.
Graph databases are optimized for indexing and querying graphs [26]. For this paper, Neo4j Community Edition was chosen because it is widely accessible and easy to set up. The Cypher query language was intuitive and well-suited to the types of analyses intended for this example. In this case, a simple match query (e.g., MATCH (n) RETURN n) returns all elements in the graph. The following section explores more complex queries that leverage Cypher’s pattern-matching capability to answer questions about the system.

9.3. Querying with Cypher

The following query demonstrates how to query the model for all databases and nodes they are connected to: MATCH (db:Database)<-[r]->(n) RETURN db, n.
This query returns all nodes of type Database (e.g., (db:Database)) and all nodes they connect to (e.g., (n)) with no regard for the relationship direction (e.g., <-[r]->). This yields the results depicted in Figure 12.
Consider a practical scenario where an enterprise has identified a critical or sensitive asset. The graph model can identify high-risk components in the architecture (e.g., nodes that connect to that asset directly or indirectly). The Cypher query of Listing 9 demonstrates how to do this.
Listing 9. Querying Data Lake Relationships in a Graph Database Using Cypher.
MATCH (db:Database)<-[r:EDGE*0..4]->(n)
WHERE db.label STARTS WITH Data Lake
RETURN db, n
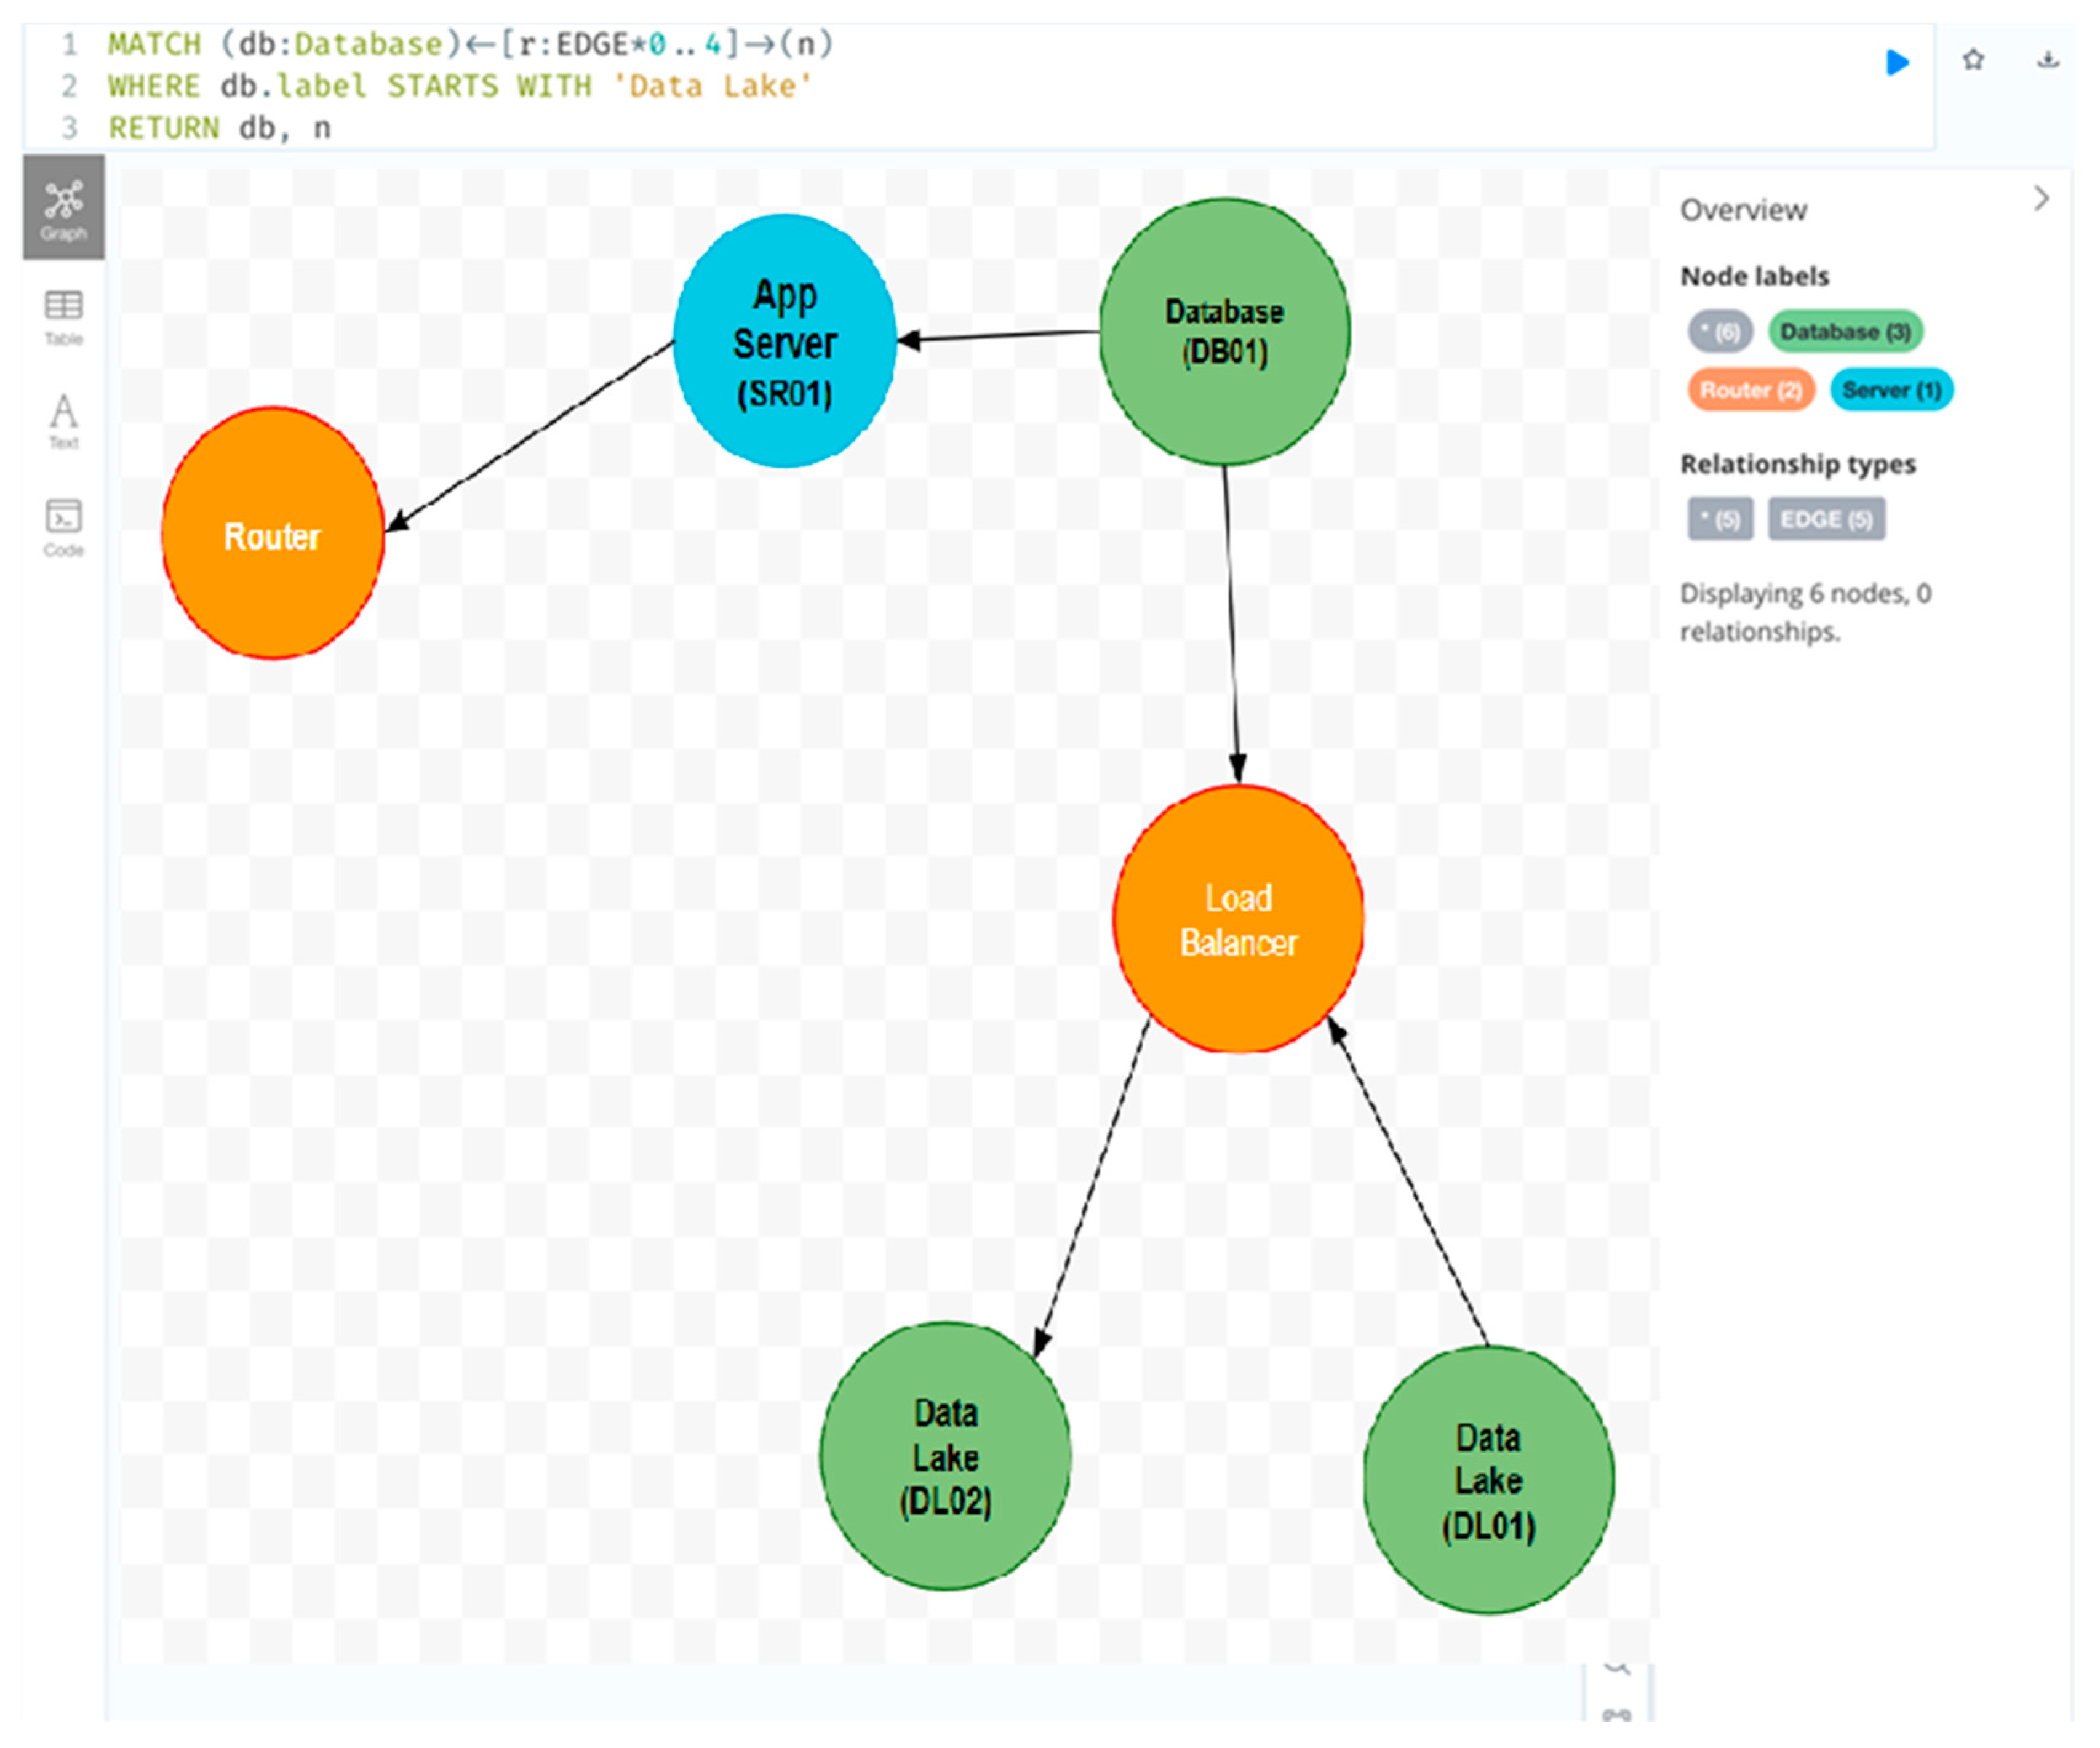
In this case, a similar MATCH pattern is used, with one notable exception: the relationship is specified as a variable-length path (e.g., r:EDGE*0..4) and only includes the EDGE type (ignoring the inferred IN relationships shown in previous sections) (Figure 13). The query then applies a WHERE condition to limit the database match to only the high-value asset.

10. Results and Comparison with Other Methods

The proposed methodology effectively bridges the gap between informal architecture diagrams and structured models, offering a streamlined data extraction, conversion, and analysis process [27]. By leveraging tools such as Draw.io and utilizing Python libraries such as NetworkX, this approach democratizes the creation of structured models, making them accessible to professionals without deep expertise.

10.1. Methodology Effectiveness

The step-by-step process outlined in this paper—from the initial creation of an informal diagram to the extraction and conversion of data into a graph-based model—has proven efficient and practical [28]. The use of intermediate format conversion and the application of graph theory principles ensure that the integrity of the original diagram is maintained while transforming it into a format suitable for advanced analysis.
Key strengths of this methodology include:
  • Accessibility and Ease of Use: The methodology employs widely available tools (e.g., Draw.io) and Python libraries, making it accessible to many users.
  • Flexibility: The process can handle various file formats and diagram types, accommodating different needs and preferences in software architecture modeling.
  • Scalability: The approach is scalable, allowing users to analyze large and complex systems by converting informal diagrams into structured models that can be easily queried and analyzed.

10.2. Comparison with Other Methods

When comparing this methodology to other approaches, several distinctions and advantages become apparent:
Traditional Methods vs. Informal Diagram Conversion:
  • Traditional Methods: Traditional methods, such as those using UML (Unified Modeling Language) or SysML (Systems Modeling Language) [9], require specialized knowledge and tools to create semantically precise models. These methods ensure a high level of rigor but can be inaccessible to those without specific training in these languages.
  • This Methodology: By contrast, the approach described here allows users to start with informal diagrams and gradually transition to formal models. This lowers the barrier to entry, enabling a wider range of professionals to participate in model creation and analysis.
Tool-Specific Approaches:
  • Microsoft Visio and Lucidchart: Tools such as Microsoft Visio and Lucidchart are popular for creating diagrams. However, they often lack the integration to convert these diagrams into formal models that can be analyzed using advanced techniques such as graph theory. Additionally, these tools are proprietary, which may limit accessibility and flexibility.
  • This Methodology: Combining Draw.io, an open-source tool with Python’s NetworkX, offers a more flexible and cost-effective solution. Users are not locked into a specific ecosystem and can easily integrate this methodology with other open-source tools.
Model-Based Systems Engineering (MBSE):
  • MBSE Approaches: MBSE frameworks, such as those following the Model-Driven Architecture (MDA) paradigm, provide a rigorous approach to model creation, focusing on separating design and architecture. These methods are powerful but can be complex and resource-intensive.
  • This Methodology: While this methodology aligns with some principles of MBSE (e.g., the separation of concerns during format conversion), it offers a more lightweight and user-friendly alternative. It is particularly well-suited for organizations or projects where full-scale MBSE adoption is impractical due to time, cost, or expertise constraints.

11. Conclusions and Further Work

This paper introduced a method for transforming informal architectural artifacts into structured models, demonstrating the feasibility of bridging the gap between informal diagramming and structured analysis. While the approach shows significant promise, several avenues for further research and development remain.
First, it is essential to validate the versatility of this methodology across different tools beyond Draw.io. Although Draw.io is widely used, it is just one of many tools for creating informal diagrams. Expanding this methodology to accommodate other popular diagramming tools will enhance its applicability and relevance. Such diversification would make the methodology more robust, allowing it to be applied in various contexts.
Second, the potential for more advanced, intelligent inferences from diagrams warrants further exploration. By incorporating deeper levels of analysis and inference, this technique could become even more powerful and practical for complex systems. One promising direction is the application of this methodology at scale, involving the analysis of numerous diagrams representing a system. This would identify and link common elements across multiple diagrams, providing a holistic view of the system’s architecture. As systems become more complex, the ability to scale this methodology and derive meaningful insights from a network of interconnected diagrams will be crucial.
Moreover, the path to industry adoption hinges on developing user-friendly, robust software tools that integrate seamlessly into existing workflows. Without such tools, this methodology risks remaining a theoretical exercise rather than a practical solution. Developing accessible and intuitive tools ensures this technique can be widely adopted and utilized in real-world scenarios. These tools should aim to reduce the cognitive load on users, enabling them to focus on higher-level architectural considerations while the software handles the complexities of model transformation.
A future direction lies in integrating artificial intelligence, particularly pattern recognition, deep learning, and large language models. AI offers the potential to automate and optimize many aspects of the model transformation process, reducing manual effort and improving accuracy. For example, AI could automatically recognize and classify elements within informal diagrams, converting them into formal models with minimal human intervention [29]. Deep learning models could learn from vast datasets of diagrams and their corresponding formal models, continuously improving their ability to perform these transformations with greater precision.
A very interesting possibility is developing a system that can automatically transform any image or informal diagram into an MxGraph representation using advanced image recognition techniques. This would allow for the conversion of hand-drawn sketches, photographs of whiteboard sessions, or any other visual representation into a structured model that can be analyzed and manipulated digitally. Such an advancement would significantly expand the utility of this methodology, making it applicable to a wide range of scenarios where informal diagrams are used but not easily digitized.
However, it is important to acknowledge that the methodology presented in this paper is just one of the initial steps in a more extensive process. While it effectively transforms informal models into more structured forms, it does not yet provide a complete solution for the entire chain of architectural modeling. Further research is needed to refine these techniques and explore how they can be integrated into broader workflows, including formal methods, automated reasoning, and comprehensive system analysis.
In conclusion, this paper lays the groundwork for a practical approach to architectural modeling. Continued research and development are essential to fully realizing its capabilities. By embracing advancements in AI, deep learning, and image recognition, future iterations of this methodology could offer a comprehensive and fully automated solution for transforming informal architectural artifacts into structured, analyzable models, ultimately bridging the gap between informal and structured methods in software engineering.

Author Contributions

J.K. contributed to the conceptualization and methodology. L.R. reviewed, enhanced, edited, and improved with a more research orientation and added the future of Artificial Intelligence. All authors have read and agreed to the published version of the manuscript.

Funding

This research received no external funding.

Institutional Review Board Statement

Not applicable.

Informed Consent Statement

Not applicable.

Data Availability Statement

The complete source code for this paper is publicly available at https://github.com/josh-kaplan/extracting-data-from-diagrams (accessed on 10 April 2024).

Conflicts of Interest

The authors declare no conflicts of interest.

References

  1. Basili, V.; Briand, L.; Bianculli, D.; Nejati, S.; Pastore, F.; Sabetzadeh, M. Software Engineering Research and Industry: A Symbiotic Relationship to Foster Impact. IEEE Softw. 2018, 35, 44–49. [Google Scholar] [CrossRef]
  2. Richards, M.; Ford, N. Fundamentals of Software Architecture. O’Reilly Media, Inc. Available online: https://learning.oreilly.com/library/view/fundamentals-ofsoftware/9781492043447/ (accessed on 10 April 2024).
  3. Carroll, E.; Malins, R. Systematic Literature Review: How is Model-Based Systems Engineering Justifed? Sandia National Laboratories: Albuquerque, NM, USA, 2016. [Google Scholar] [CrossRef]
  4. Ozkaya, M. Do the informal & formal software modeling notations satisfy practitioners for software architecture modeling? Inf. Softw. Technol. 2018, 95, 15–33. [Google Scholar] [CrossRef]
  5. Keim, J.; Schneider, Y.; Koziolek, A. Towards consistency analysis between formal and informal software architecture artefacts. In Proceedings of the 2019 IEEE/ACM 2nd International Workshop on Establishing the Community-Wide Infrastructure for Architecture-Based Software Engineering (ECASE), Montreal, QC, Canada, 27 May 2019; pp. 6–12. [Google Scholar] [CrossRef]
  6. Ali, N.; Baker, S.; O’Crowley, R.; Herold, S.; Buckley, J. Architecture consistency: State of the practice, challenges and requirements. Empir. Softw. Eng. 2018, 23, 224–258. [Google Scholar] [CrossRef]
  7. Fowler, M. Software Architecture Guide. Available online: https://martinfowler.com/architecture/ (accessed on 10 April 2024).
  8. Object Management Group. OMG® Uni ed Modeling Language® (OMG UML®), Versionb2.5.1. 2023. Available online: https://www.omg.org/spec/UML/2.5.1/PDF (accessed on 10 April 2024).
  9. Object Management Group. OMG Systems Modeling Language™ (SysML®), Version 2.0 Beta, Part 1 Language Specification. 2023. Available online: https://www.omg.org/spec/SysML/2.0/Beta1/Language/PDF (accessed on 1 March 2024).
  10. JGraph Ltd. draw.io. July 2023. Available online: https://www.drawio.com/ (accessed on 1 March 2024).
  11. JGraph Ltd. Github—jgraph/drawio-desktop (Source Code). July 2023. Available online: https://github.com/jgraph/drawio-desktop (accessed on 1 March 2024).
  12. Henning Dieterichs. Github—hediet/vscode-drawio (Source Code). July 2023. Available online: https://github.com/hediet/vscode-drawio (accessed on 10 February 2024).
  13. Henning Dieterichs. Draw.io Integration—Visual Studio Marketplace. July 2023. Available online: https://marketplace.visualstudio.com/items?itemName=hediet.vscode-drawio (accessed on 10 April 2024).
  14. JGraph Ltd. MxGraph. Available online: https://jgraph.github.io/mxgraph/ (accessed on 10 April 2024).
  15. Pastor, O.; Molina, J.C. Model-Driven Architecture in Practice: A Software Production Environment Based on Conceptual Modeling; Springer Science & Business Media: Berlin/Heidelberg, Germany, 2007. [Google Scholar]
  16. Franconeri, S.L.; Padilla, L.M.; Shah, P.; Zacks, J.M.; Hullman, J. The Science of Visual Data Communication: What Works. Psychol. Sci. Public Interest 2021, 22, 110–161. [Google Scholar] [CrossRef]
  17. Bentrad, S.; Meslati, D. Visual Programming and Program Visualization—Toward an Ideal Visual Software Engineering System. ACEEE Int. J. Inf. Technol. 2011, 1, 43–49. [Google Scholar]
  18. Kaplan, J. Agile Architecture in Practice. 2023. Available online: https://jdkaplan.com/articles/agile-architecture-in-practice (accessed on 15 March 2024).
  19. Leipzig, J.; Nüst, D.; Hoyt, C.T.; Ram, K.; Greenberg, J. The role of metadata in reproducible computational research. Patterns 2021, 2, 100322. [Google Scholar] [CrossRef] [PubMed] [PubMed Central]
  20. Object Management Group. XML Metadata Interchange (XMI), Version 2.5.1. 2015. Available online: https://www.omg.org/spec/XMI/2.5.1/PDF (accessed on 10 April 2024).
  21. Majeed, A.; Rauf, I. Graph Theory: A Comprehensive Survey about Graph Theory Applications in Computer Science and Social Networks. Inventions 2020, 5, 10. [Google Scholar] [CrossRef]
  22. Leskovec, J.; Lang, K.J.; Mahoney, M. Empirical comparison of algorithms for network community detection. In Proceedings of the 19th International Conference on World Wide Web, Raleigh, NA, USA, 26–30 April 2010; pp. 631–640. [Google Scholar]
  23. Li, W.; Zhou, X.; Wu, S. An Integrated Software Framework to Support Semantic Modeling and Reasoning of Spatiotemporal Change of Geographical Objects: A Use Case of Land Use and Land Cover Change Study. ISPRS Int. J. Geo-Inf. 2016, 5, 179. [Google Scholar] [CrossRef]
  24. Würsch, M.; Ghezzi, G.; Hert, M.; Reif, G.; Gall, H. SEON: A pyramid of ontologies for software evolution and its applications. Computing 2012, 94, 857–885. [Google Scholar] [CrossRef]
  25. GCHQ. CyberChef. Available online: https://gchq.github.io/CyberChef/ (accessed on 10 April 2024).
  26. Robinson, I.; Webber, J.; Eifrim, E. Graph Databases, 2nd ed.; O’Reilly Media, Inc.: Sebastopol, CA, USA, 2015; Available online: https://learning.oreilly.com/library/view/graph-databases-2nd/9781491930885/ (accessed on 10 April 2024).
  27. Kassab, M.; Mazzara, M.; Lee, J.; Succi, G. Software architectural patterns in practice: An empirical study. Innov. Syst. Softw. Eng. 2018, 14, 263–271. [Google Scholar] [CrossRef]
  28. Schilling, R.D.; Aier, S.; Winter, R. Designing an Artifact for Informal Control in Enterprise Architecture Management. In Proceedings of the ICIS, 2019, Munich, Germany, 15–18 December 2019. [Google Scholar]
  29. Rabelo, L.; Bhide, S.; Gutierrez, E. Artificial Intelligence: Advances in Research and Applications; Nova Science Publishers, Inc.: Sebastopol, CA, USA, 2018. [Google Scholar]
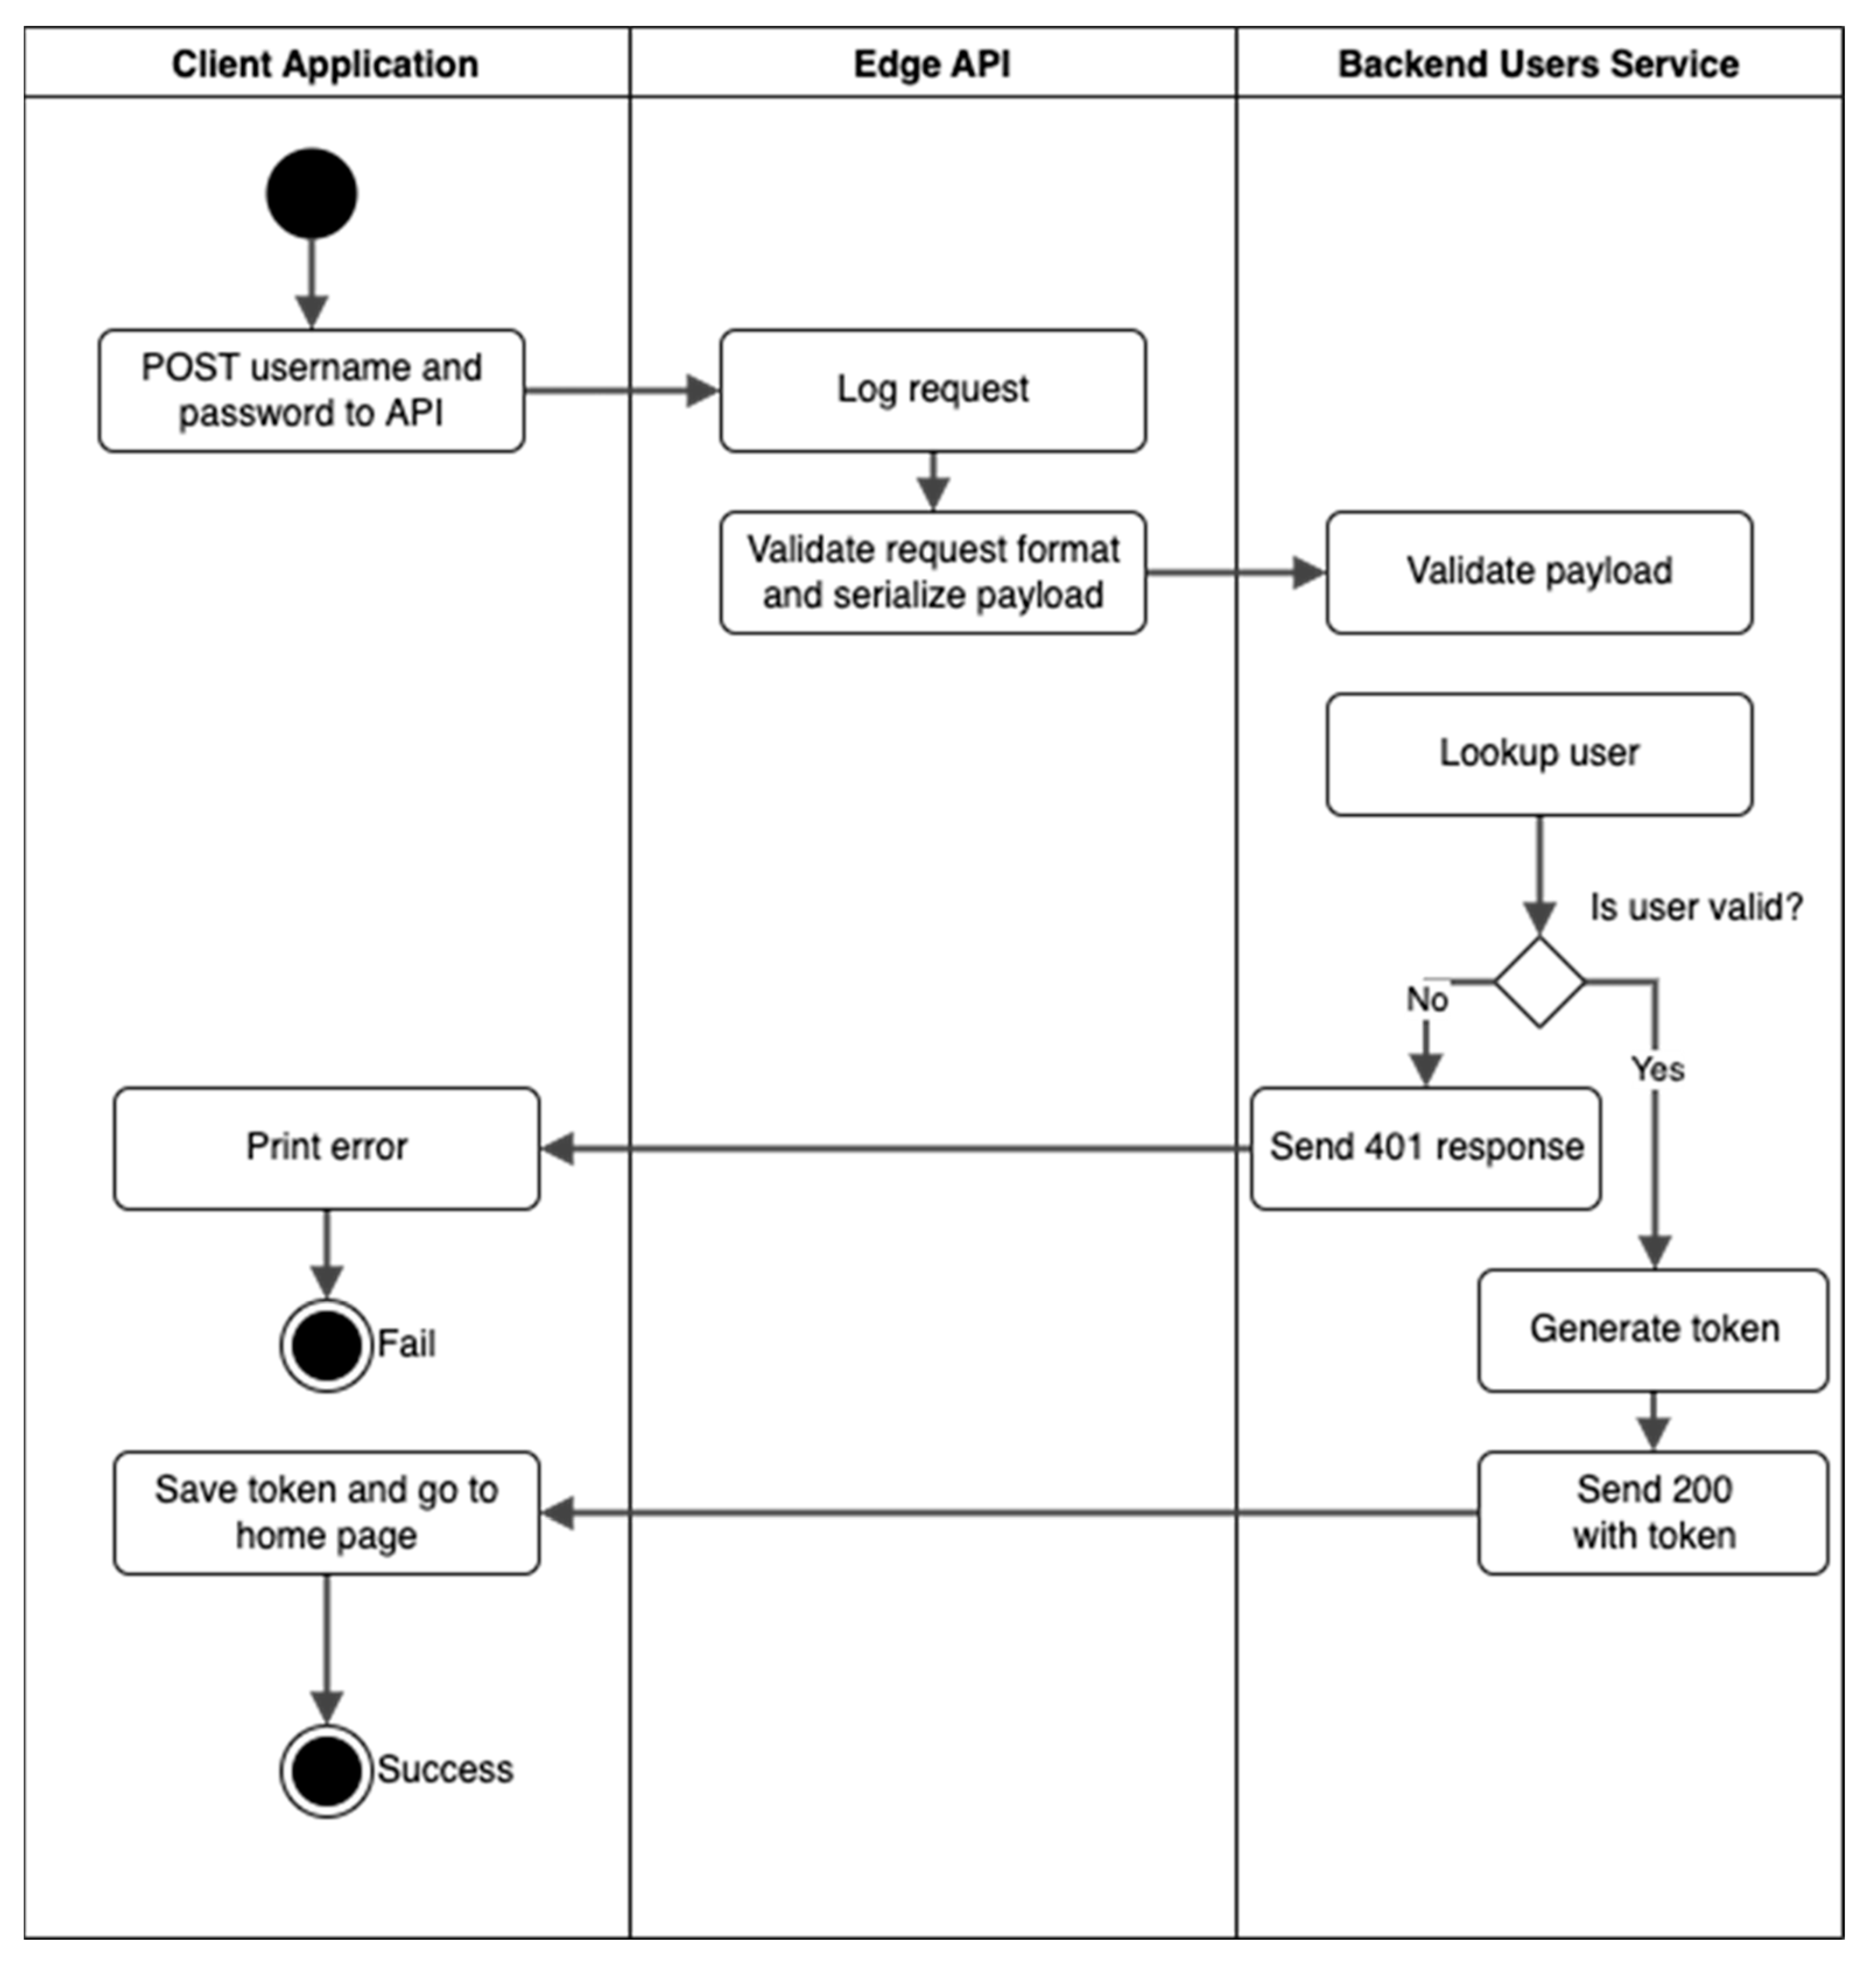
Figure 1. UML activity diagram.
Information 15 00642 g001
Figure 2. A sample diagram of a network.
Information 15 00642 g002
Figure 3. A sample informal diagram of a cloud infrastructure architecture.
Information 15 00642 g003
Figure 4. A sample diagram of a database schema.
Information 15 00642 g004
Figure 5. A sample activity diagram.
Information 15 00642 g005
Figure 6. A NetworkX model of the sample activity diagram.
Information 15 00642 g006
Figure 7. The Hello World diagram.
Information 15 00642 g007
Figure 8. Hello World Example in .drawio.svg Format.
Information 15 00642 g008
Figure 9. Simplified representation of a network that might be used in a small business.
Information 15 00642 g009
Figure 10. Inferred relationships of diagram elements inside network enclaves.
Information 15 00642 g010
Figure 11. Simple representation of the graph in Neo4j.
Information 15 00642 g011
Figure 12. Obtaining all database nodes in the system.
Information 15 00642 g012
Figure 13. Get all items up to four steps from the Data Lake nodes.
Information 15 00642 g013
Disclaimer/Publisher’s Note: The statements, opinions and data contained in all publications are solely those of the individual author(s) and contributor(s) and not of MDPI and/or the editor(s). MDPI and/or the editor(s) disclaim responsibility for any injury to people or property resulting from any ideas, methods, instructions or products referred to in the content.