Article

Neurophysiological Approach for Psychological Safety: Enhancing Mental Health in Human–Robot Collaboration in Smart Manufacturing Setups Using Neuroimaging

Department of Engineering, School of Science & Technology, Nottingham Trent University, Clifton, Nottingham NG11 8NS, UK
*
Author to whom correspondence should be addressed.
Information 2024, 15(10), 640; https://doi.org/10.3390/info15100640
Submission received: 4 September 2024 / Revised: 7 October 2024 / Accepted: 8 October 2024 / Published: 15 October 2024
(This article belongs to the Special Issue Machine Learning and Artificial Intelligence with Applications)

Abstract

:
Human–robot collaboration (HRC) has become increasingly prevalent due to innovative advancements in the automation industry, especially in manufacturing setups. Although HRC increases productivity and efficacy, it exposes human workers to psychological stress while interfacing with collaborative robotic systems as robots may not provide visual or auditory cues. It is crucial to comprehend how HRC impacts mental stress in order to enhance occupational safety and well-being. Though academics and industrial interest in HRC is expanding, safety and mental stress problems are still not adequately studied. In particular, human coworkers’ cognitive strain during HRC has not been explored well, although being fundamental to sustaining a secure and constructive workplace environment. This study, therefore, aims to monitor the mental stress of factory workers during HRC using behavioural, physiological and subjective measures. Physiological measures, being objective and more authentic, have the potential to replace conventional measures i.e., behavioural and subjective measures, if they demonstrate a good correlation with traditional measures. Two neuroimaging modalities including electroencephalography (EEG) and functional near-infrared spectroscopy (fNIRS) have been used as physiological measures to track neuronal and hemodynamic activity of the brain, respectively. Here, the correlation between physiological data and behavioural and subjective measurements has been ascertained through the implementation of seven different machine learning algorithms. The results imply that the EEG and fNIRS features combined produced the best results for most of the targets. For subjective measures being the target, linear regression has outperformed all other models, whereas tree and ensemble performed the best for predicting the behavioural measures. The outcomes indicate that physiological measures have the potential to be more informative and often substitute other skewed metrics.

1. Introduction

In today’s continually developing world, there has been a significant surge in the demand for bespoke products. Customisable and autonomous roles employing orthodox resources are not possible with a traditional factory (TF) setup [1]. Personalised and small-lot items cannot be manufactured economically and efficiently by conventional manufacturing as it is unable to monitor and regulate automated and complex operations. Consequently, the challenges posed by rapidly evolving technologies are beyond the reach of conventional manufacturing [2]. The advent of Industry 4.0 has completely transformed the paradigm of the industrial sector by bring automation and digitization in smart factories to attention. A fundamental component of smart factories is the integration of cutting-edge technology, such as big data analytics, digital information and predictive analytics, which provides opportunities for improved production and operational efficiency [3].
Robots have historically been employed for industrial processes to carry out laborious, precise and repetitive tasks. However, as technology has advanced, researchers have begun to discover ways to merge human skills, decision-making and critical thinking with the strength, repeatability and accuracy of robots to achieve intelligent systems able to execute complex tasks [4]. There exists a requirement for robots to coexist with humans to achieve desired levels of efficiency, quality and customisation as automation technologies are used in industrial setups progressively [5]. A practical solution for fulfilling these goals is human–robot collaboration (HRC), where humans and robots collaborate, and their respective capabilities can be merged to maximise productivity and achieve the required level of automation. The conventional method of using primitive robots is therefore being altered by the inclusion of HRC in manufacturing setups [6]. To adapt to variable consumer needs and requirement for bespoke products, manufacturers are upgrading their workplaces. HRC strategies with adaptable solutions can substantially boost productivity and efficiency in smart manufacturing setups [7].
Cobots, or collaborative robotic systems, are made to operate safely alongside human workers in collaborative workspaces [8]. In contrast to conventional robots, cobots use advanced sensors, intelligent algorithms and safety features to avoid collisions and enable safe interaction. Their versatility, ease of programming and adaptability to variable tasks make them appropriate for a wide range of applications in sectors like manufacturing, healthcare and logistics [9].
Even though HRC is one of the emerging fields among researchers, there is still a lack of knowledge about the psycho-physical impact of close interaction of humans with cobots on human workers’ efficiency and productivity [10]. There can be several causes of HRC leading to cognitive stress and ergonomic issues. Psychological stress and compromised performance of human workers while working in close proximity to cobots can be a consequence of cobots’ inability to give cues and respond to unforeseen circumstances [11], however, cobots may become capable of giving audio and visual reactions as technology is advancing. The inability to immediately control the undesired rapid movement of robots may be overwhelming for human employees. Enhancing human productivity and occupational safety in the context of HRC requires digging deep to understand these stressors and proposing ways to mitigate them.
Mental stress assessment has been done by many researchers using traditional measures which include subjective and behavioural measures. Behavioural measures focus on observable actions such as changes in task performance and physical actions like speech patterns, facial expressions and gaze variables, indicating how mental stress manifests physically [12,13,14]. In 2017, Aylward, J. and Robinson, O. J. have used behavioural measures like accuracy and target response time to analyse the threat-intensified performance on an inhibitory control task [15]. Assessments of psychological domains related to attention, execution and psychomotor speed are often conducted using reaction time (RT) as the behavioural assessment method. Auditory and visual reaction times have been examined by Khode, V. et al. to assess the mental state of hypertensive and non-hypertensive participants using mini-mental state examination (MMSE) as the task [16]. In a study done in 2016, Huang, M., et al. explored the impact of mental stress on the gaze-click pattern by investigating the trends in gaze data, as a behavioural parameter, during a mouse-click task [17]. On the other hand, subjective measures depend on self-reported information from individuals administering tools such as questionnaires, interviews, surveys, self-report diaries, rating scales and psychological evaluations to gauge their degree of cognitive stress [18]. Perceived stress and mental workload are frequently measured using tools like the Perceived Stress Scale (PSS) [19] and the NASA Task Load Index (NASA-TLX) questionnaire [20]. A 14-item PSS self-report questionnaire, to gauge respondents’ feelings of overload, unpredictability and uncontrollability, has been used by Lesage, F. X., and Berjot, S. to validate visual analogue scale (VAS) for stress assessment in clinical occupational health setups [19,21]. Instantaneous Self-Assessment (ISA) is another subjective assessment tool for mental workload, validated by Leggatt, A., et al. in 2023 [22]. To investigate how human behaviour towards other humans can be translated into robot behaviour, Jost, J., et al. administered the user experience questionnaire (UEQ) [23], the negative attitude towards robots scale (NARS) [24] and the godspeed questionnaire [25] in 2019 [26]. To analyse versatility and validity, the state-trait anxiety inventory (STAI) has been used by Legler, F., et al. in a virtual-reality (VR) experiment, creating a human–robot collaborative environment, to compare the outcome to a real-world experiment [27]. Using the technology acceptance model (TAM) and NASA-TLX, which measure a user’s acceptance of technology and cognitive task load, respectively, Rossato et al. compared the subjective experiences of senior and younger employees in HRC [28].
While subjective and behavioural assessments provide genuine insights into cognitive stress, physiological measures are a more objective way to monitor mental stress by tracking physical changes in the human body. Since the last decade, researchers have been using either physiological measures or multimodal approaches to combine conventional measures with physiological measures to achieve a comprehensive understanding of the mental state of humans [29,30]. Heart rate variability (HRV) is one of the physiological measures that is usually reduced due to cognitive stress, indicating reduced parasympathetic activity [31]. Cortisol levels, the stress hormone elevate as a result of mental stress and can be measured through saliva, blood or urine [32]. Other physiological measures include electrodermal activity (EDA), gaze variables, body temperature etc. [33,34]. In 2021, ECG signals have been administered for real-time stress monitoring using deep learning methods including convolutional neural networks (CNN) and bidirectional long short-term memory (BiLSTM) [35]. In another study of 2022, ECG, voice and facial expressions have been employed for acute stress detection using a real-time deep learning framework, where stress-related features are extracted using ResNet50 and I3D and the temporal attention module highlighting the differentiating temporal representation for facial expressions about stress [36]. Brain signals are one of the most important physiological indicators for evaluating mental stress, offering insights into the neurological processes involved in mental stress responses. Several techniques including electroencephalography (EEG) [37], functional magnetic resonance imaging (fMRI) [38] and functional near-infrared spectroscopy (fNIRS) [39], can be used to monitor the electrical and hemodynamic activity of the brain.
The assessment of mental stress has been a long-standing challenge in the field of psychology and healthcare. As stated earlier, traditional measures can produce inaccurate results due to problems such as issues of recall, attention, falsification and fabrication, specifically in case of subjective measures [40]. The participant has full control over his responses when filling out a subjective assessment questionnaire as well as his actions during behavioural assessment. While using the behavioural measures, results can come out to be inaccurate as a consequence of biased behaviour and intentional false performance of the participant [41]. As subjective and behavioural measures lack the ability to provide real-time assessment of the perceptual state of a person, the need for physiological measures arises there. The aim of this analysis is to determine whether physiological measures are powerful enough to replace the conventional measures for monitoring the cognitive stress of factory workers. If physiological measures (neuroimaging variables) have the potential to quantify cognitive stress, they can circumvent the limitations of using conventional measures. To explore this potential of neuroimaging, a correlation study is required for physiological measures and conventional measures. Therefore, the main goal of this study is to predict subjective and behavioural measures using physiological variables. There are 3 categories of data-driven decision models including rule-based (using a set of rules or a decision tree), shallow statistical (shallow models like linear regression) and deep learning models (several-layered classification, regression and reinforcement models) [42]. Rule-based and shallow statistical models are often outperformed in performance by deep learning models, but the implementation of deep learning techniques requires big datasets [42]. For this research the dataset is not large enough to get the desired results using deep learning models, therefore rule-based and shallow statistical models are selected [42]. In our previous study, the correlation between physiological measures and conventional measures was found using only 2 machine learning algorithms including linear regression and artificial neural networks (ANN) [43]. Regression proved to be the better one for most of the targets but there was still a requirement to test multiple machine learning models and deploy the best one for each target [43]. Therefore, this research intends to find a correlation between physiological (EEG and fNIRS) and traditional measures (i.e., behavioural and subjective measures) using rule-based and shallow statistical models and learn the impact of using individual EEG and fNIRS features and combinations of EEG and fNIRS features on the prediction of targets. As per the authors’ knowledge, this is the first study to explore and compare all these machine-learning techniques, especially for multimodal brain data. Another novelty of this analysis is that a unique and personalised model has been chosen for each target instead of using a single model for predicting all targets. The strengths of the chosen machine learning algorithms for predicting different targets are also evident from this research.

2. Methodology

The experiment for this research has been designed to simulate a factory worker’s experience in an automated industrial setup using cobots. Throughout the experiment, physiological signals, i.e., EEG and fNIRS brain signals, have been recorded to obtain neural and hemodynamic activity in the brain. Subjective and behavioural data have also been collected during the task execution for validation of results obtained through physiological measures.

2.1. Experimental Paradigm

A pick-and-place task that requires decision-making by the human worker has been selected for this study. The setup of the experiment is such that a human operator works in collaboration with a cobot, adjusting their performance speed to correspond with the cobot’s. Participants in the experiment are required to do two tasks simultaneously, potentially causing cognitive stress. The selection criteria for participants include healthy adults, male or female, between the ages of 18 and 55, with no history of neurological conditions, head trauma or head injuries. Since children’s and older adults’ brains are different from typical adult brains, age has been selected as a criterion. Due to the bimanual nature of the motor activity during the task, participants with any motor disabilities, i.e., those affecting upper or lower limbs, were excluded from the experiment. Thirteen participants contributed to this study, including university students and PepsiCo International Limited employees; however, due to quality concerns, only the data from 9 of them was utilised for further analysis. Data for 1 of the 4 participants was rejected because of the poor connectivity of EEG electrodes on the scalp whereas the systematic/device noise was introduced to the EEG data, resulting in very noisy data of poor quality, for the remaining 3 participants. The technical know-how of the participants was such that 4 of them had prior experience interacting with the robots, 11 had social media experience and all of them had used smartphones. Each participant attended a session of approximately 60 min. The main task in the experiment is the Stroop task, which is a commonly used measure of cognitive control [44]. Forty cubic boxes are used in the experiment. On each box, an equation and a colour name (green, blue or red) in a different ink colour, are printed. For example, “green” might be printed on the box with blue ink. The Stroop task, performed in a human–robot collaborative setup, is depicted in Figure 1 and has been chosen as the primary task of this study. Participants have to classify the boxes according to the correctness of the equations. If correct, the colour of the text otherwise, the written name of the colour, is considered for the categorisation of the boxes. The role of the cobot in the experiment is to pick a cubic box from a corner where all of the boxes are initially placed and hand it to the human participant. Each box must be taken by the participant to put it in the designated location on the workstation following the aforementioned rule [45]. If participants do not pace themselves in line with the cobot, they may still be laying a block when the cobot drops the subsequent one. This temporal inconsistency is seen as a human error that might degrade performance as a consequence of delayed decision-making. Every participant has to complete the task under eight distinct experimental conditions, or episodes, which are based on varying combinations of the cobot’s movement speeds, task complexities and payload capacities.
The cobot–Stroop task is accompanied by a basic secondary task to mimic an industrial environment where employees must multitask while making decisions. Alongside the main cobot–Stroop task, this secondary task is introduced to increase the task complexity from low to high in different task episodes. This additional task must be present in the episodes requiring high complexity. In the secondary task, participants are instructed to respond by pressing a foot pedal in response to beeps that are played at intervals of 300 to 10,000 milliseconds with durations ranging from 500 to 1000 milliseconds. The number of beeps missed is a measure of human error. Behavioural measures for this study include the beep response rates and reaction times of the participants [43].
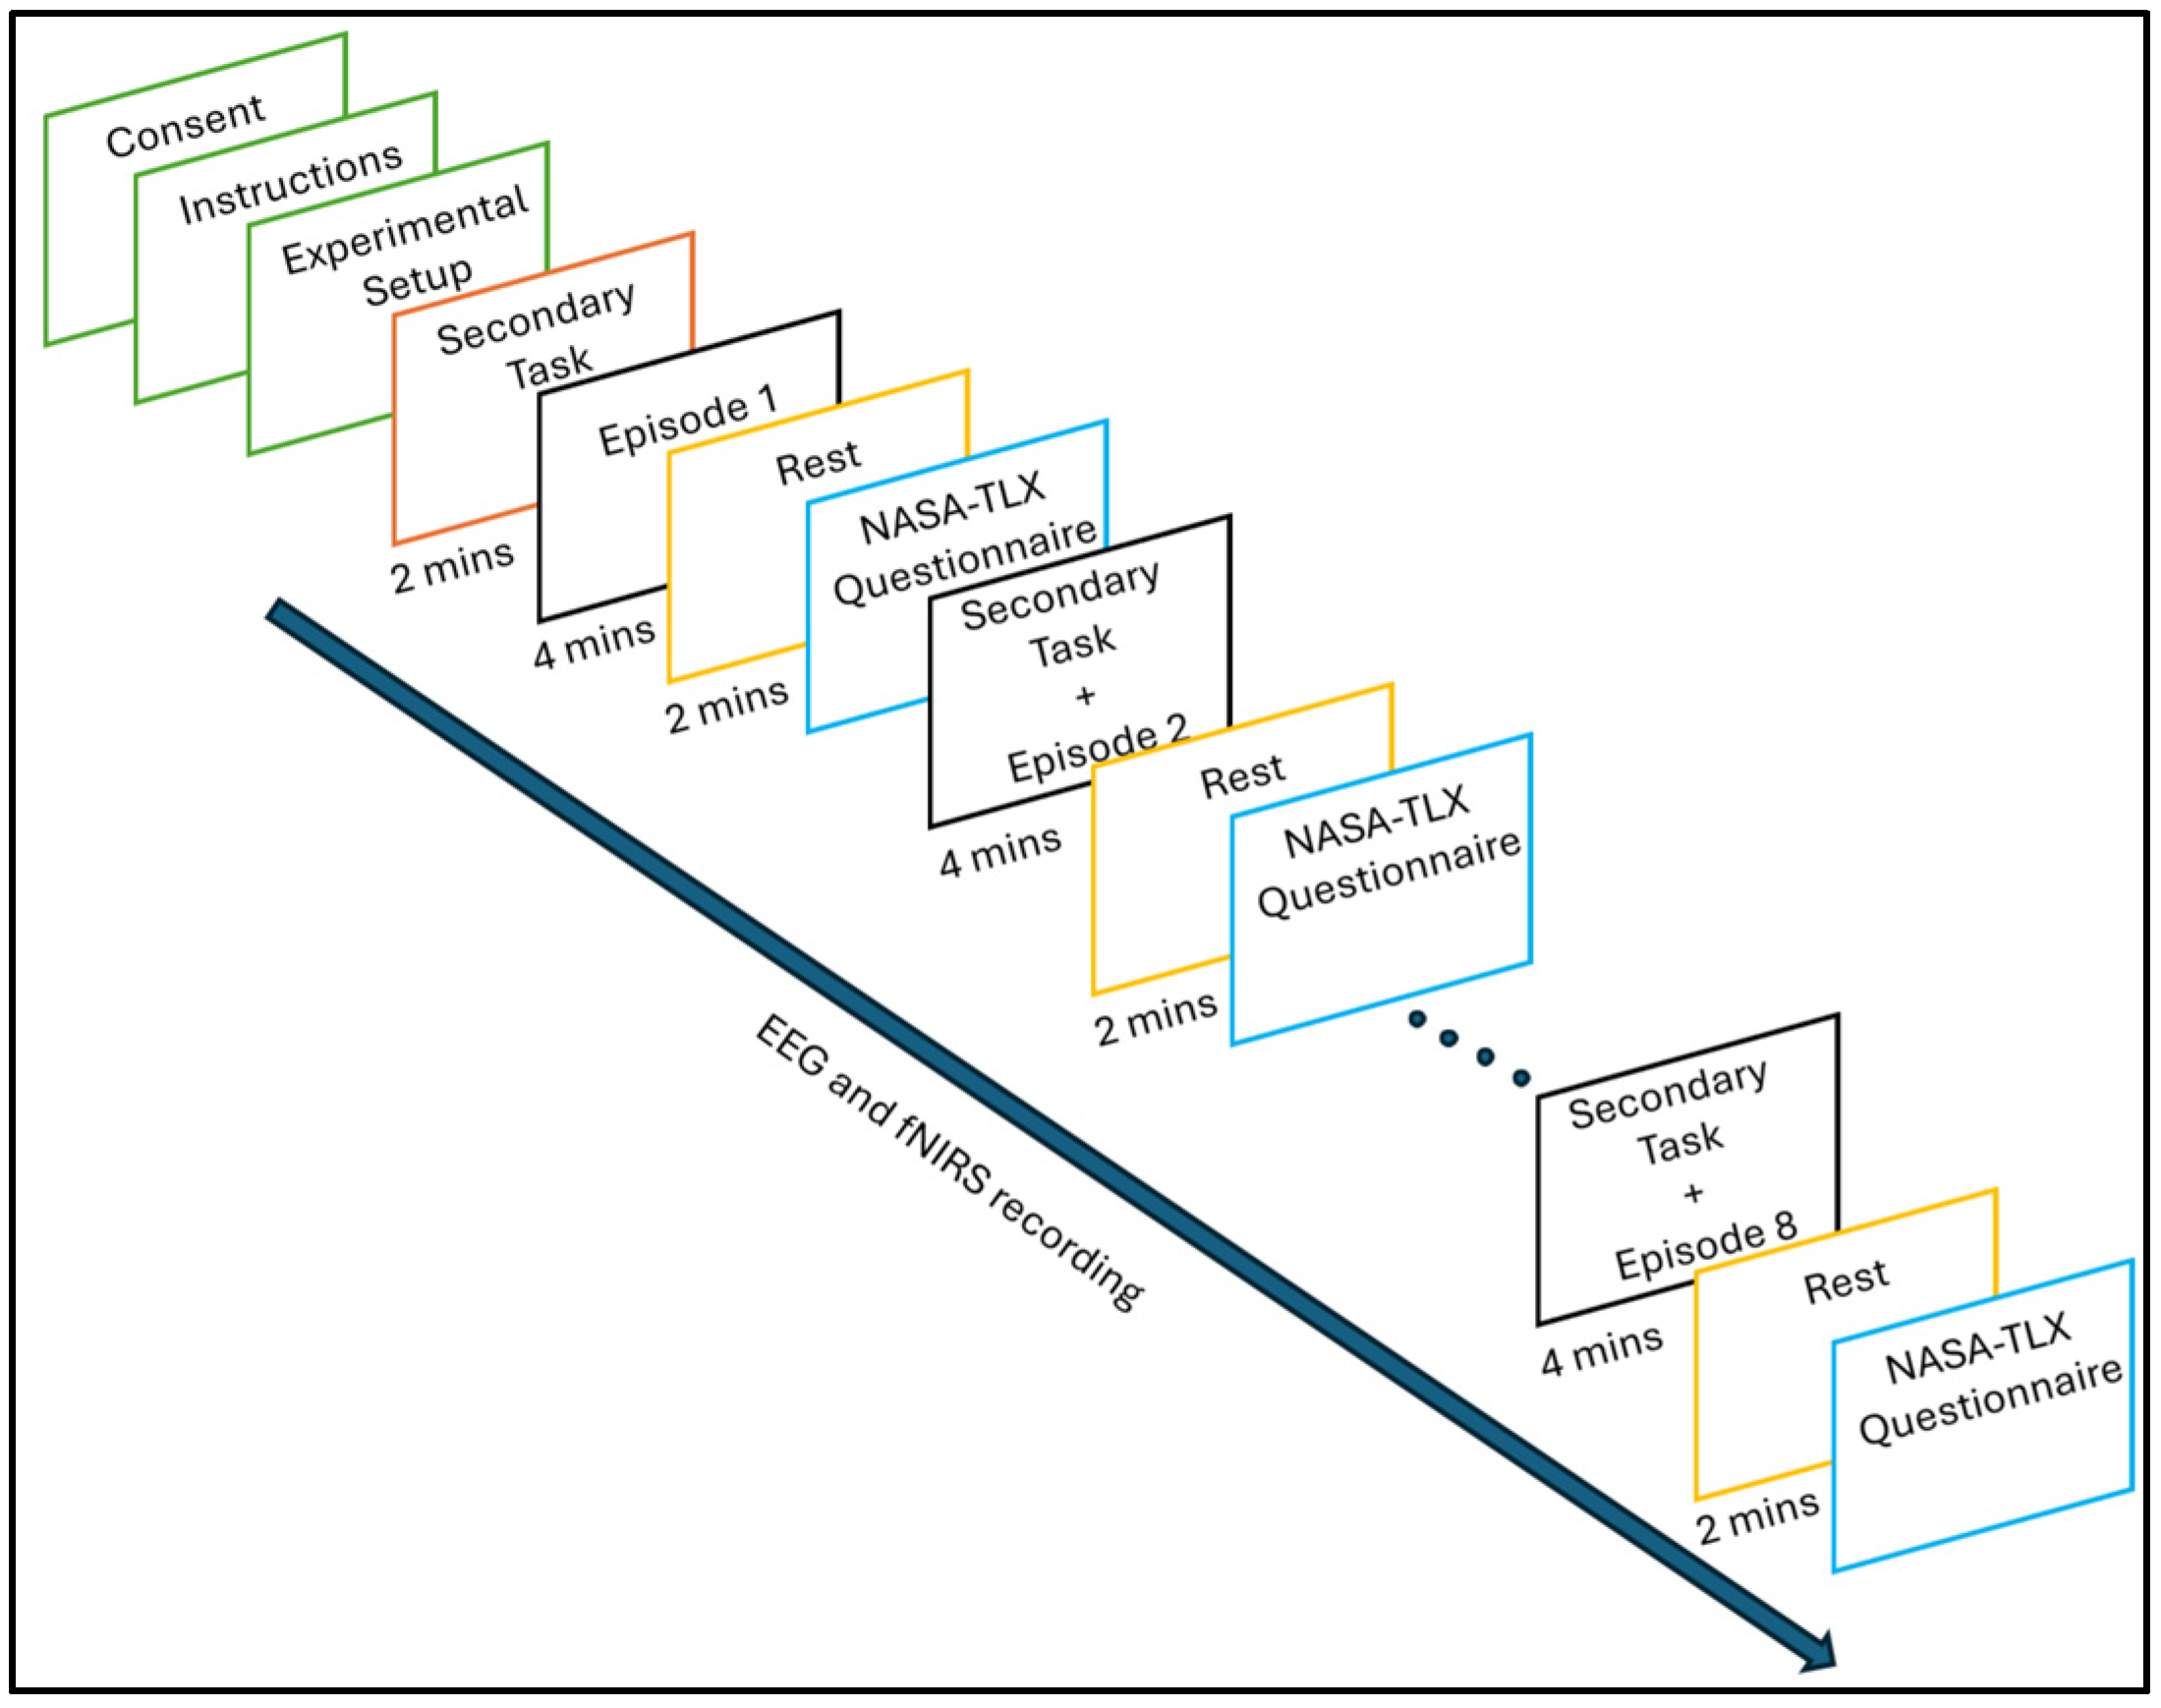
The experiment involves collecting the participant’s brain data along with behavioural and subjective data continuously for a duration of 60 min. At the onset of the experiment, written consent is taken from the participant and instructions about the complete experiment are given to the participant followed by a complete setup of hardware devices and softwares. As a baseline, only the secondary foot-pedalling task is carried out for two minutes. Afterwards, for four minutes, episode 1 of the cobot–Stroop job is executed, characterised by low levels of task complexity, payload capacity and task speed. Subsequently, the subject is required to sit in a relaxed state for two minutes and then complete the NASA-TLX form after a rest episode. The participant is required to complete the NASA-TLX form following each experiment episode, which serves as a subjective measure. The experiment then proceeds as depicted in Figure 2. The process parameters are set to either low or high in each episode as shown in Table 1. The high and low values for cobot’s speed correspond to 1 m/s and 0.6 m/s, respectively. For this research, two robots (universal robots) with distinct payload capacities of 3 kg (low) and 5 kg (high) are used. A low task complexity episode contains just the primary task whereas the high task complexity episodes comprise both the primary task and the supplementary task.

2.2. Data Acquisition

In this study, EEG and fNIRS signals are recorded to acquire the electrical and haemodynamic activity of the brain. The TMSi Mobita wireless data acquisition system is utilised to acquire EEG signals at a 2000 Hz sampling frequency [47]. Data from 19 EEG electrodes positioned on the scalp following the Internation 10–20 system have been recorded. fNIRS data has been acquired by employing 8 channels with Artinis Octamon at the sample rate of 10 Hz [48]. The transmitter-receiver pairs are separated by a distance of 20–30 mm. The left frontal region between FP1-F3-F7 and a corresponding frontal region on the right are both covered by the chosen 8 channels.
Three behavioural parameters are measured during the experiment including Stroop task error rate, missed beeps and reaction time. Since the Stroop task error rate did not significantly vary between episodes, it is not used for this analysis. Reaction time and missed beeps are the ones utilised as the behavioural data. Reaction time is measured during high-complexity episodes including secondary tasks for each beep the subject heard when pressing the pedal. Every episode has a record of these values. Additionally, if a participant misses a beep, it is logged and the total number of missed beeps is counted for every participant as each episode is completed. The importance of reaction time stems from its ability to indicate stress, particularly in high-complexity episodes involving secondary tasks, as it reflects delayed response time caused due to cognitive stress. Throughout these high-complexity episodes, missed beeps are also recorded. An increase in missed beeps indicates a rise in cognitive effort since it makes it difficult for participants to respond to the beeps when they are mentally occupied with the primary activity. The Stroop task error, calculated for the entire experiment, would highlight heightened mental stress if there is a rise in erroneous categorisations. However, as Stroop task error did not yield informative results, they are excluded from this study.
A multidimensional standard scale used to evaluate stress, exhaustion, alertness and other mental workload factors is NASA-TLX [49]. The participant’s weighted average of the six factors, as rated at the end of each episode, determines the final cognitive workload score. These factors include mental, physical and temporal demands, performance, effort and amount of frustration [50]. The participant has to assign a score for each factor on a scale from 0 to 100 with steps of 5 [51]. The NASA-TLX score has been employed in this study for subjective assessment, requiring each subject to mark each element on the form towards the end of each episode. Finally, the total score for each participant is determined by averaging the score of six elements.

2.3. Data Pre-Processing

Pre-processing is done for both the EEG and fNIRS data to yield clean signals for feature extraction. Non-brain signals and artefacts are eliminated from the raw EEG data using an ICA-based technique [52]. To minimise the effects of EEG drift and high-frequency artefacts, a zero-phase Hamming windowed sinc FIR filter, i.e., a band-pass filter with a frequency range of 0.16–40 Hz, has been applied to the data. Furthermore, the sampling rate for all channels’ EEG signals has been reduced from 2000 Hz to 200 Hz. Delta (0.5–4 Hz), theta (4–8 Hz), alpha (8–12 Hz), beta (12–28 Hz) and gamma (28–50 Hz) are among the several frequency bands that make up an EEG [53]. The beta band has been used as 4 distinct frequency bands including, b1 (12–16 Hz), b2 (16–20 Hz), b3 (20–24 Hz) and b4 (24–28 Hz). The anticipated behavioural states of deep sleep, deep meditation, awake but relaxed, cognitive thinking and unifying awareness are correlated with delta, theta, alpha, beta and lower gamma bands, respectively [54]. Figure 3 displays the results of the analysis of frequency band power (FBP) for these five bands.
Similarly, a variety of biological and technical artefacts might distort fNIRS signals [55]. Different optode calibration and coupling can result in variations in the average channel amplitudes, which may remain constant throughout the recording, as one of the technical artefacts. Head motions are an example of biological artefacts resulting in abrupt distortions because of the disturbed optode coupling [45]. Then there is muscular oxygenation which occurs specifically near the temporalis muscle producing a large amplitude, prolonged peak [56]. The participant’s upper body movement results in transient substantial deflections due to differences in blood perfusions. Biological artefacts include blood flow in superficial (non-cerebral) tissue, the Mayer waves artefact at a frequency of around 0.1 Hz and the systemic heartbeat at about 1 Hz [45].
To yield accurate and artefact-free data, each channel’s signal is first processed with a band-pass filter spanning from 0.15 Hz to 0.5 Hz, which reduces cardiac heartbeat activity and some slow components. The filtered signals are then subjected to the Beer-Lambert law, converting those into oxy-hemoglobin (HbO) and deoxy-hemoglobin (HbR) concentrations [46]. Bandpass filtering cannot be used to reduce Mayer waves as their time scales overlap with those of cerebral activity. Mayer waves are not task-driven and participant waves are asynchronised, therefore, their effects are not probable to have an impact on our study and instead tend to cancel out in group averages [57,58]. Outliers in all channels’ recordings were detected and removed based on the criterion that if it is more than three scaled median absolute deviations (MAD) distant from the median, it is considered to be a high peaked artefact induced by movement or muscles [45].By dividing the haemoglobin concentration signals by the standard deviation (SD) of the subsequent rest time, the amplitude differences between channels are reduced which may be attributed to a specific subject or optical coupling. The first episode’s signals are normalised using the initial rest interval. To reduce systematic elements that may manifest over the entire recording, the complete signal for every channel has been divided by its mean [45]. By using the aforementioned measures, the artefacts listed can be eliminated from the data and an increase in the accuracy of the data, indicating only cerebral activity, can be achieved. Figure 3 shows the full feature extraction and artefact reduction procedure for EEG and fNIRS data.
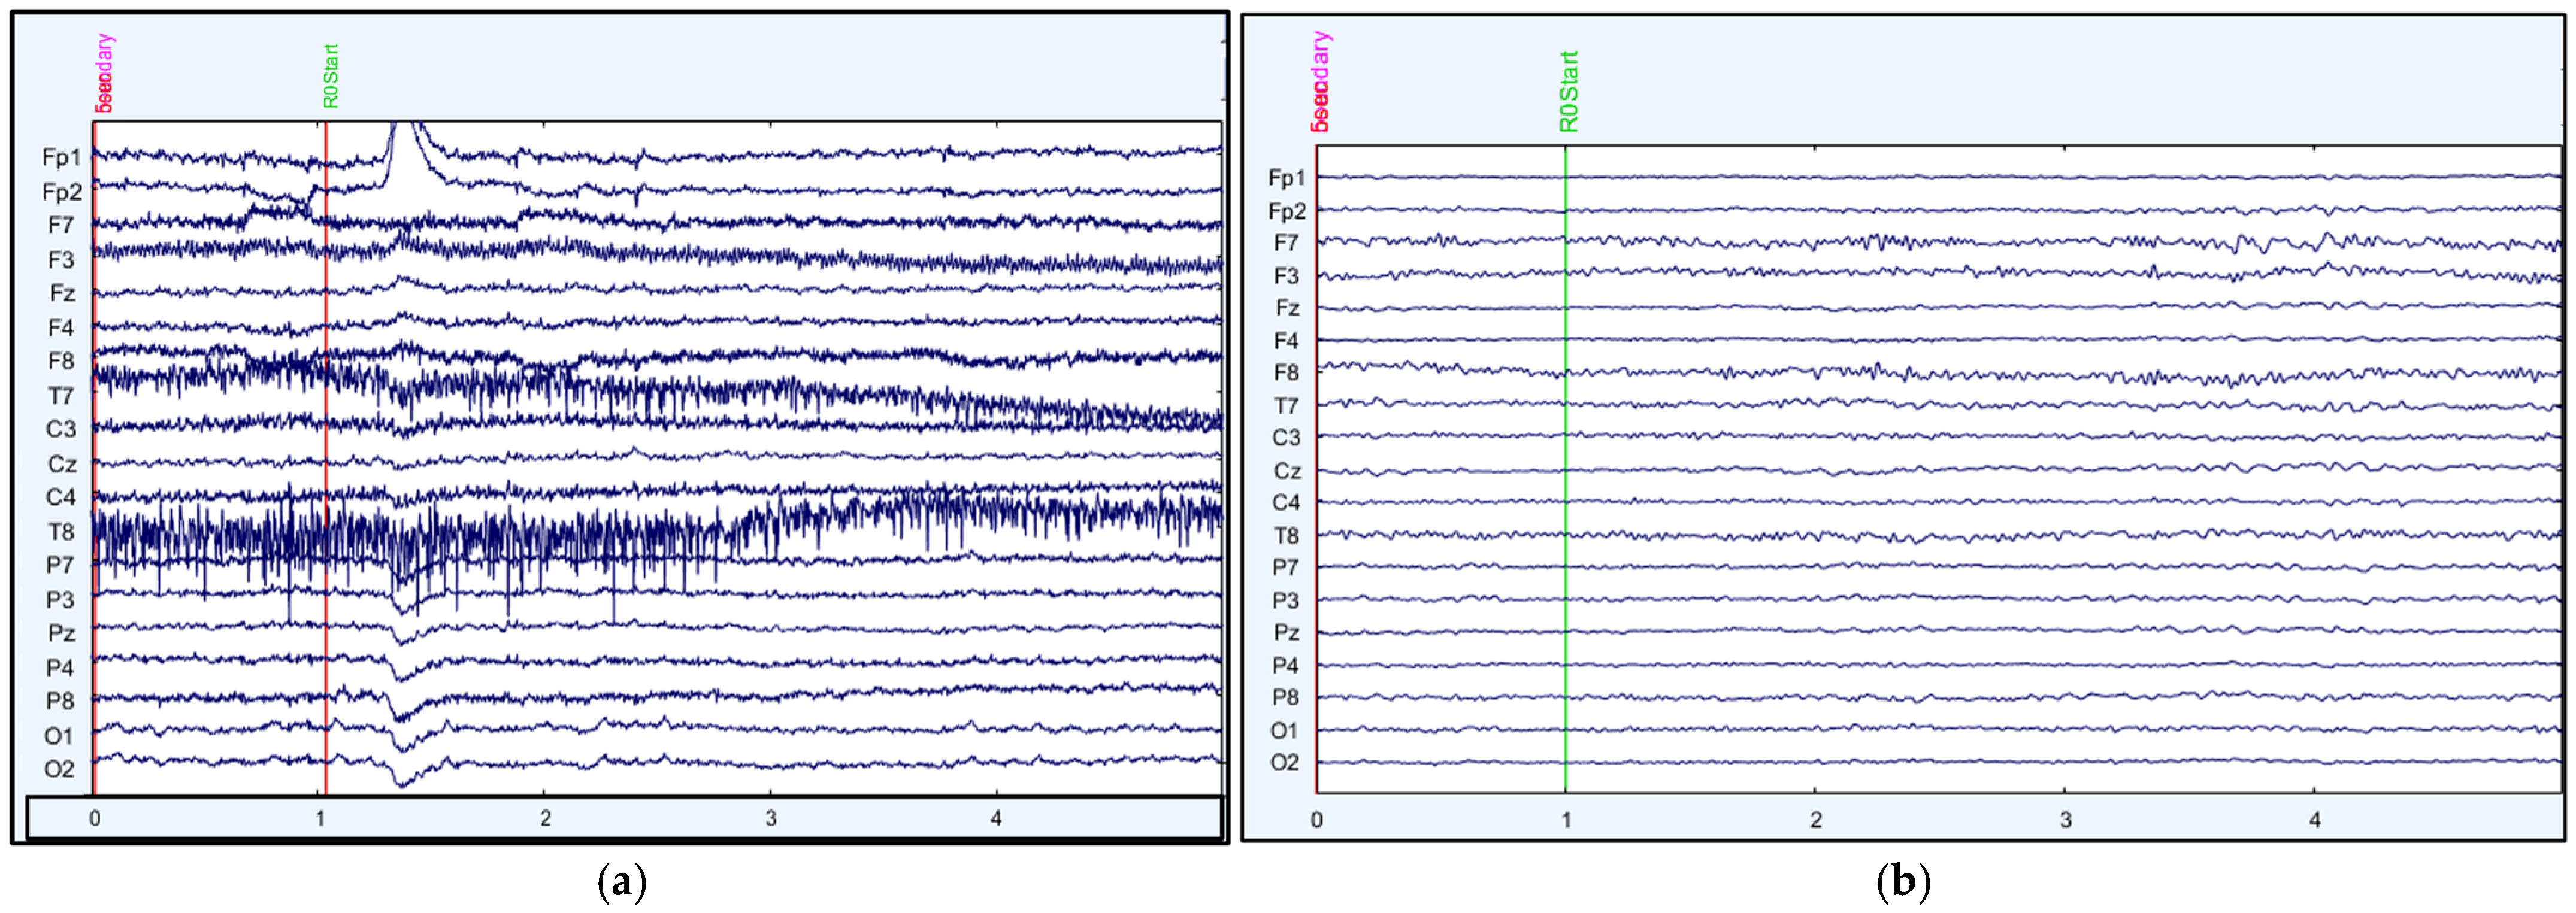
A difference in the raw and processed signals for EEG and fNIRS is shown in Figure 4 and Figure 5, respectively. Figure 4a illustrates the raw EEG signals across all 19 channels, while Figure 4b shows the artifact-free EEG signals. The raw fNIRS data is shown in Figure 5a, and the oxygenated haemoglobin concentration changes for channels 1–8 during subject 8’s second episode are shown in Figure 5b, with a y-offset for clarity. Grey shaded region indicates signal segments that are considered artefacts and removed from further analysis.

2.4. Use of Machine Learning for Prediction of Traditional Measures Using Physiological Measures

Machine learning is an area of artificial intelligence (AI) that focuses on developing models and algorithms that let computers learn from their surroundings and make predictions or judgements without explicit programming [59]. Machine learning techniques can be effectively used to find the correlation between physiological data and conventional measures (subjective and behavioural measures). To employ machine learning techniques, the steps required to be followed, as shown in Figure 6, include data acquisition, feature extraction, model selection, training and testing, prediction and deployment of the best model. For this study, seven machine learning algorithms including linear regression, tree, support vector machine (SVM), ensemble, gaussian process regression, neural networks and kernel have been tested with the extracted features.
For applying these techniques, a set of EEG and fNIRS features has been used to predict the targets (NASA-TLX score, missed beeps, reaction time). EEG features include frequency band powers of 5 EEG bands for each episode. Standard deviations and time derivatives calculated amplitude time series, time series normalized with respect to standard deviation of rest and time series normalised by subtracting channel average at each instant, have been used as fNIRS features. For Missed beeps and reaction time as targets the total number of samples is 36 and for each participant features for episodes 2, 3, 5 and 8 are considered (9 × 4 = 36). The reason behind using the features for just these 4 episodes for each participant is that only these episodes are high-complexity episodes with the secondary task where missed beeps and reaction time are recorded. For NASA-TLX as the target, the total number of samples is 72. For each participant features for all episodes are considered (9 × 8 = 72) as this is recorded in all episodes. For all targets, 70% of the overall data is kept for training and 30% for testing. A 5-fold cross-validation method has been used for all targets. All the above-listed algorithms have been applied for multiple combinations of features. Various combinations of features, including EEG features individually, fNIRS features individually and different combinations of EEG and fNIRS features, have been tested. To evaluate the performance of different models, root mean square error (RMSE) has been used as a metric, which presents the distance between the predicted values and the actual values for each model. Low RMSE values depict that the model has more accurate predictions and fits the data well. On the contrary, higher values indicate a higher error value and less accurate predictions. The best model with minimum error has been selected for each feature combination. Moreover, the best feature combination among all is selected for each target.

3. Results and Discussion

Multiple machine-learning techniques have been used in this analysis to find the correlation between traditional measures and physiological measures, in order to test the potential of neural measures to evaluate cognitive stress. For using this approach multiple sets of EEG and fNIRS features have been used as predictors for behavioural (missed beeps and reaction time) and subjective measures (NASA-TLX score) as targets. Initially, EEG and fNIRS features are separately tested followed by the combination of both for all targets. Results for all targets and feature combinations are discussed below.

3.1. Target: NASA-TLX

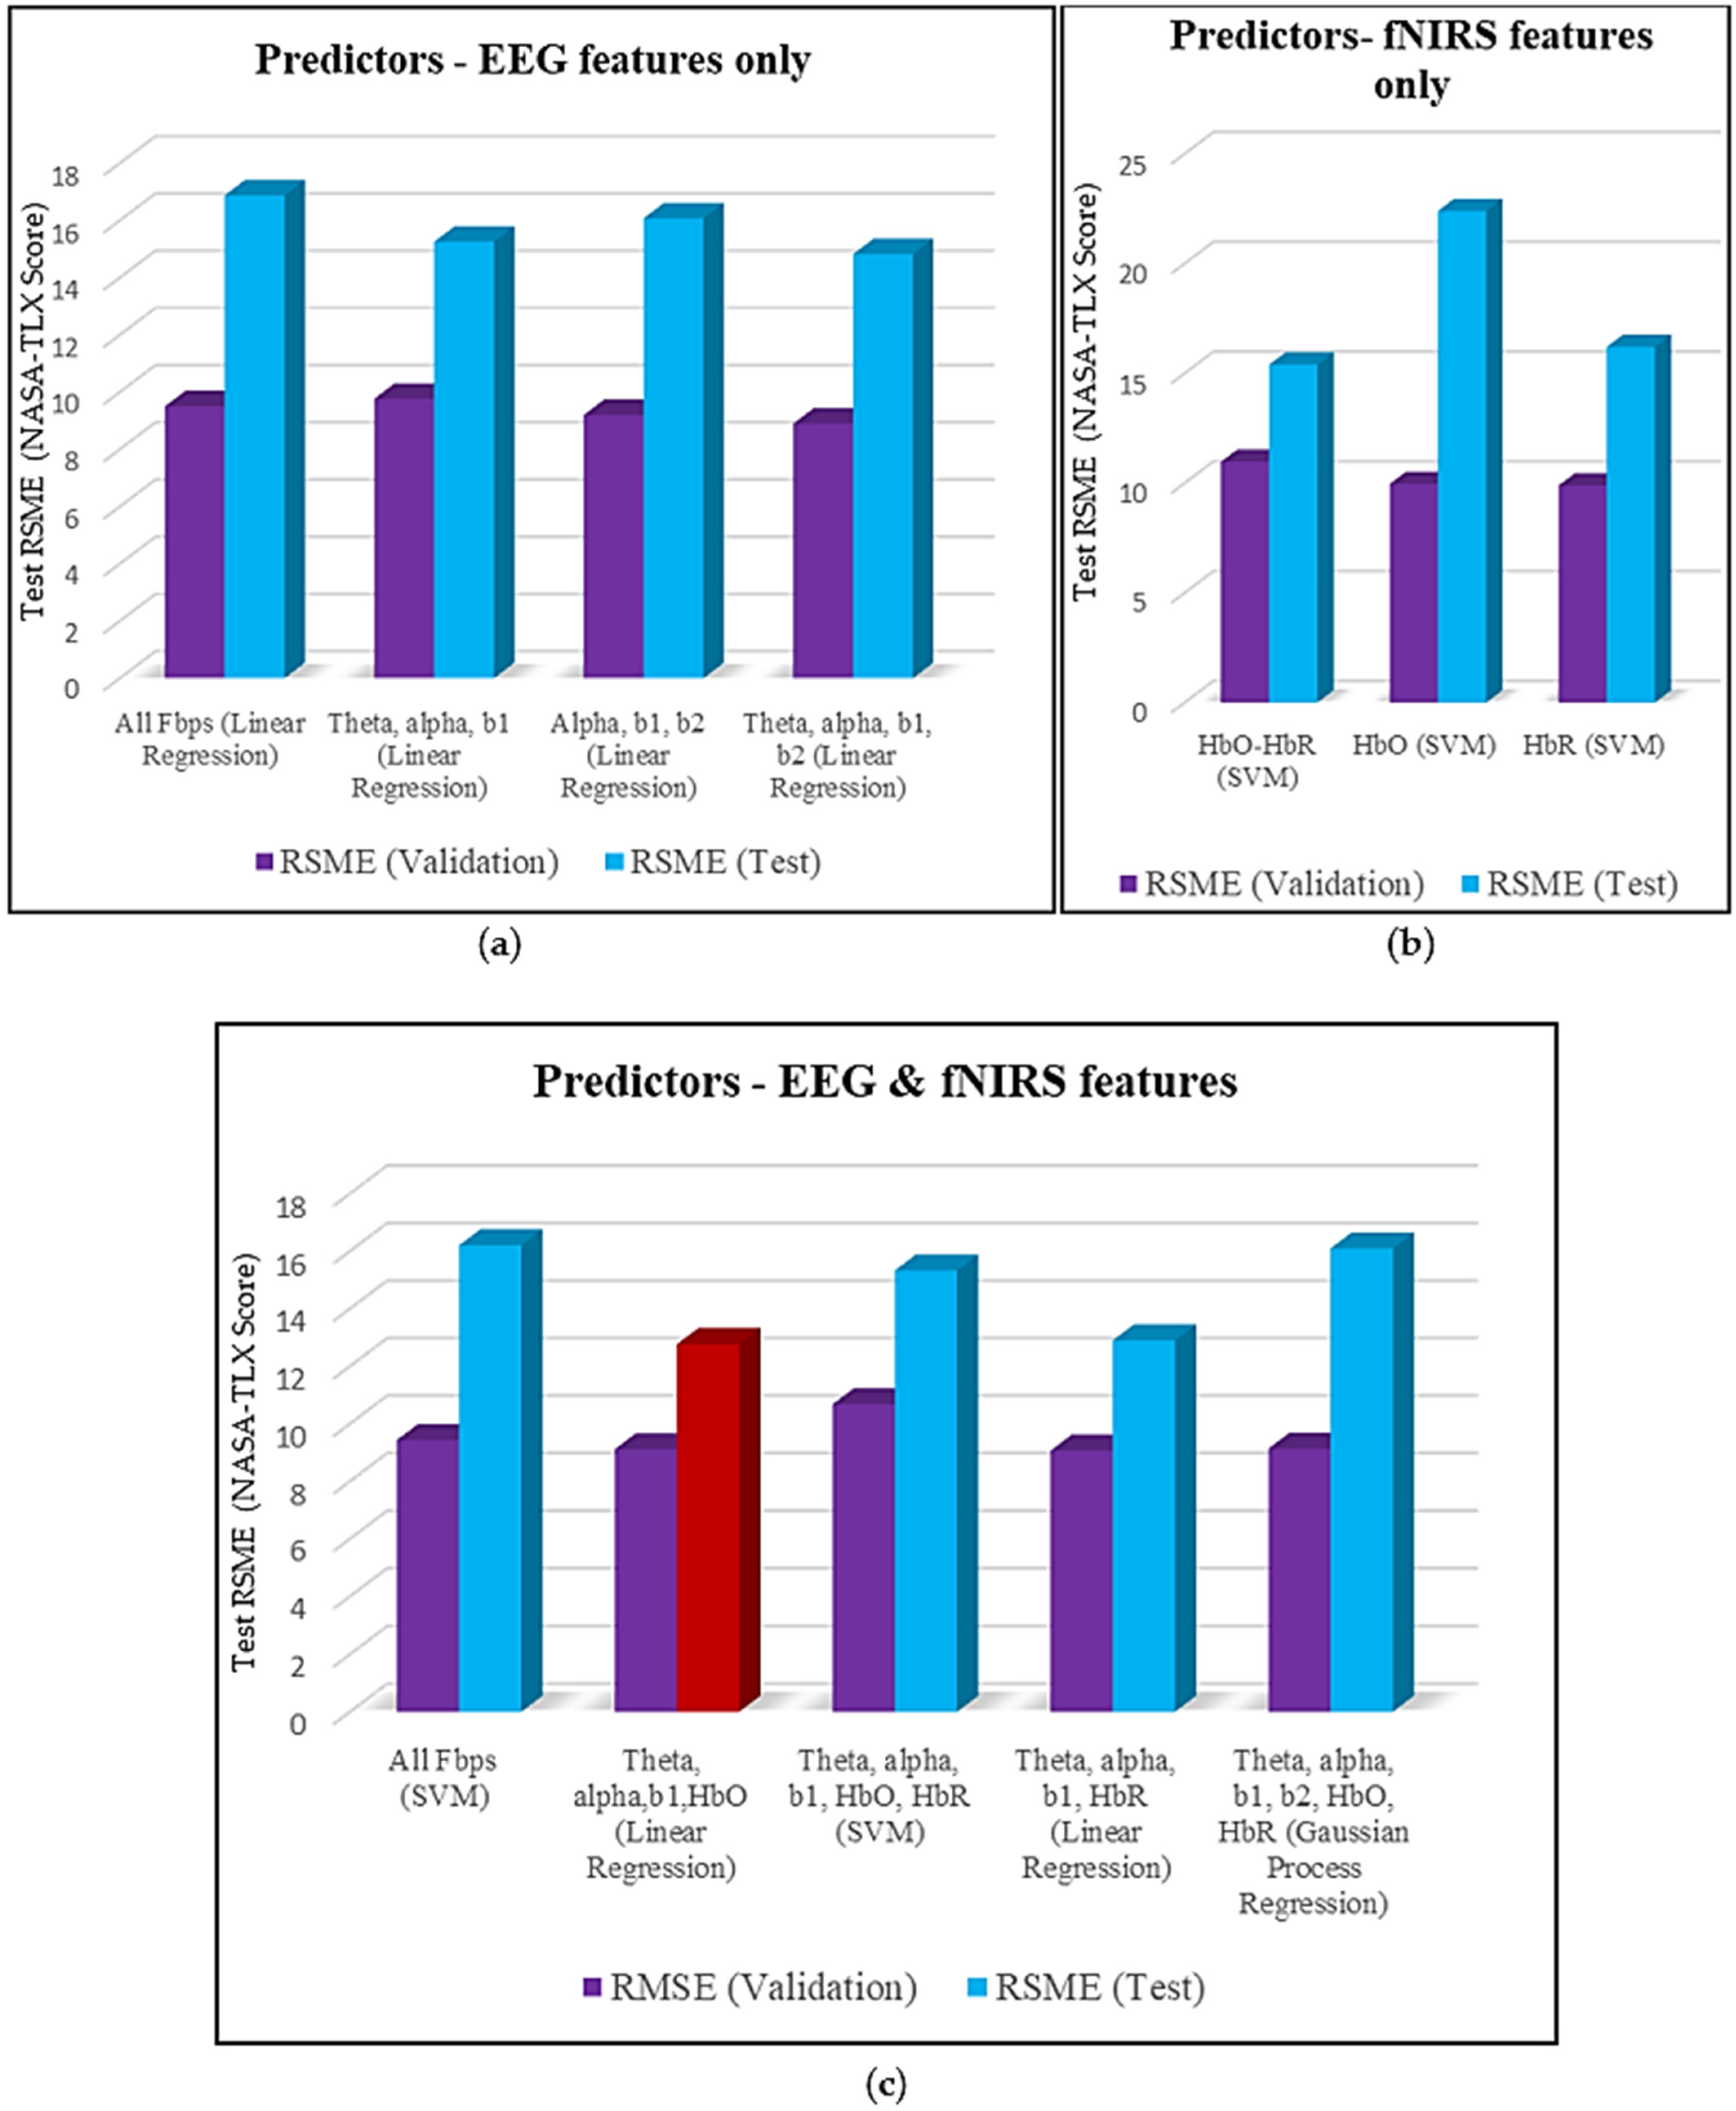
With the NASA-TLX score as the target, for all participants and episodes, four combinations of EEG features have been initially used. For each combination, all seven machine learning techniques have been applied and the best-performing model has been mentioned in Table 2. For instance, for all frequency band powers of EEG bands as features, all seven machine learning techniques have been applied. Minimum validation RMSE has been acquired for linear regression (9.5017) for which test RMSE has come out to be 16.873. Similarly, results for all combinations are listed in Table 2.
Likewise, using the same procedure, results have been mentioned for only fNIRS features (HbO and HbR) in Table 3. Finally results for combinations of EEG and fNIRS features have been stated in Table 4.
By looking at Figure 7a, representing the results using only EEG features, in a chart format, it can be observed that the second and fourth combination of EEG features produced better results indicating the importance of the theta band. Test RMSE for all EEG features’ combinations remained between 14 and 17 NASA-TLX scores. Furthermore, the best result has been produced by fourth combination, with linear regression as the best-performing model. For fNIRS features, the combination of HbO and HbR features has performed the best with the support vector machine (SVM) as the best-fitting algorithm, as shown in Figure 7b. Test RMSE for all combinations of HbO and HbR remained between 15 and 23 NASA-TLX scores.
Figure 7c demonstrates the performance by using combinations of EEG and fNIRS features. The second and fourth combinations have yielded better results, showing the importance of theta band, HbO and HbR concentrations. Here the test RMSE has been found to be between 12 and 17 NASA-TLX scores. The range for NASA-TLX score is between 0 to 100 and by looking at Figure 7a–c, the overall best performance, among all combinations of features, has been presented by theta, alpha, b1 and HbO using the linear regression model with minimum test RMSE of 12.764 (highlighted in red color in Table 4 and Figure 7c). This validates the strength of the linear regression model performing the best with a relatively smaller dataset. Linear regression is an easy-to-understand and less complex machine-learning model [60].

3.2. Target: Missed Beeps

Similarly, for missed beeps as a target, EEG features alone have been initially considered predictors. After applying all aforementioned machine learning techniques to each combination, the best model has been selected based on minimum validation RMSE value and has been presented in Table 5. Following similar steps, the best models have been reported for all considered combinations of fNIRS features only in Table 6. Eventually, multiple combinations of EEG and fNIRS features have been considered and best-fitting models are stated in Table 7.
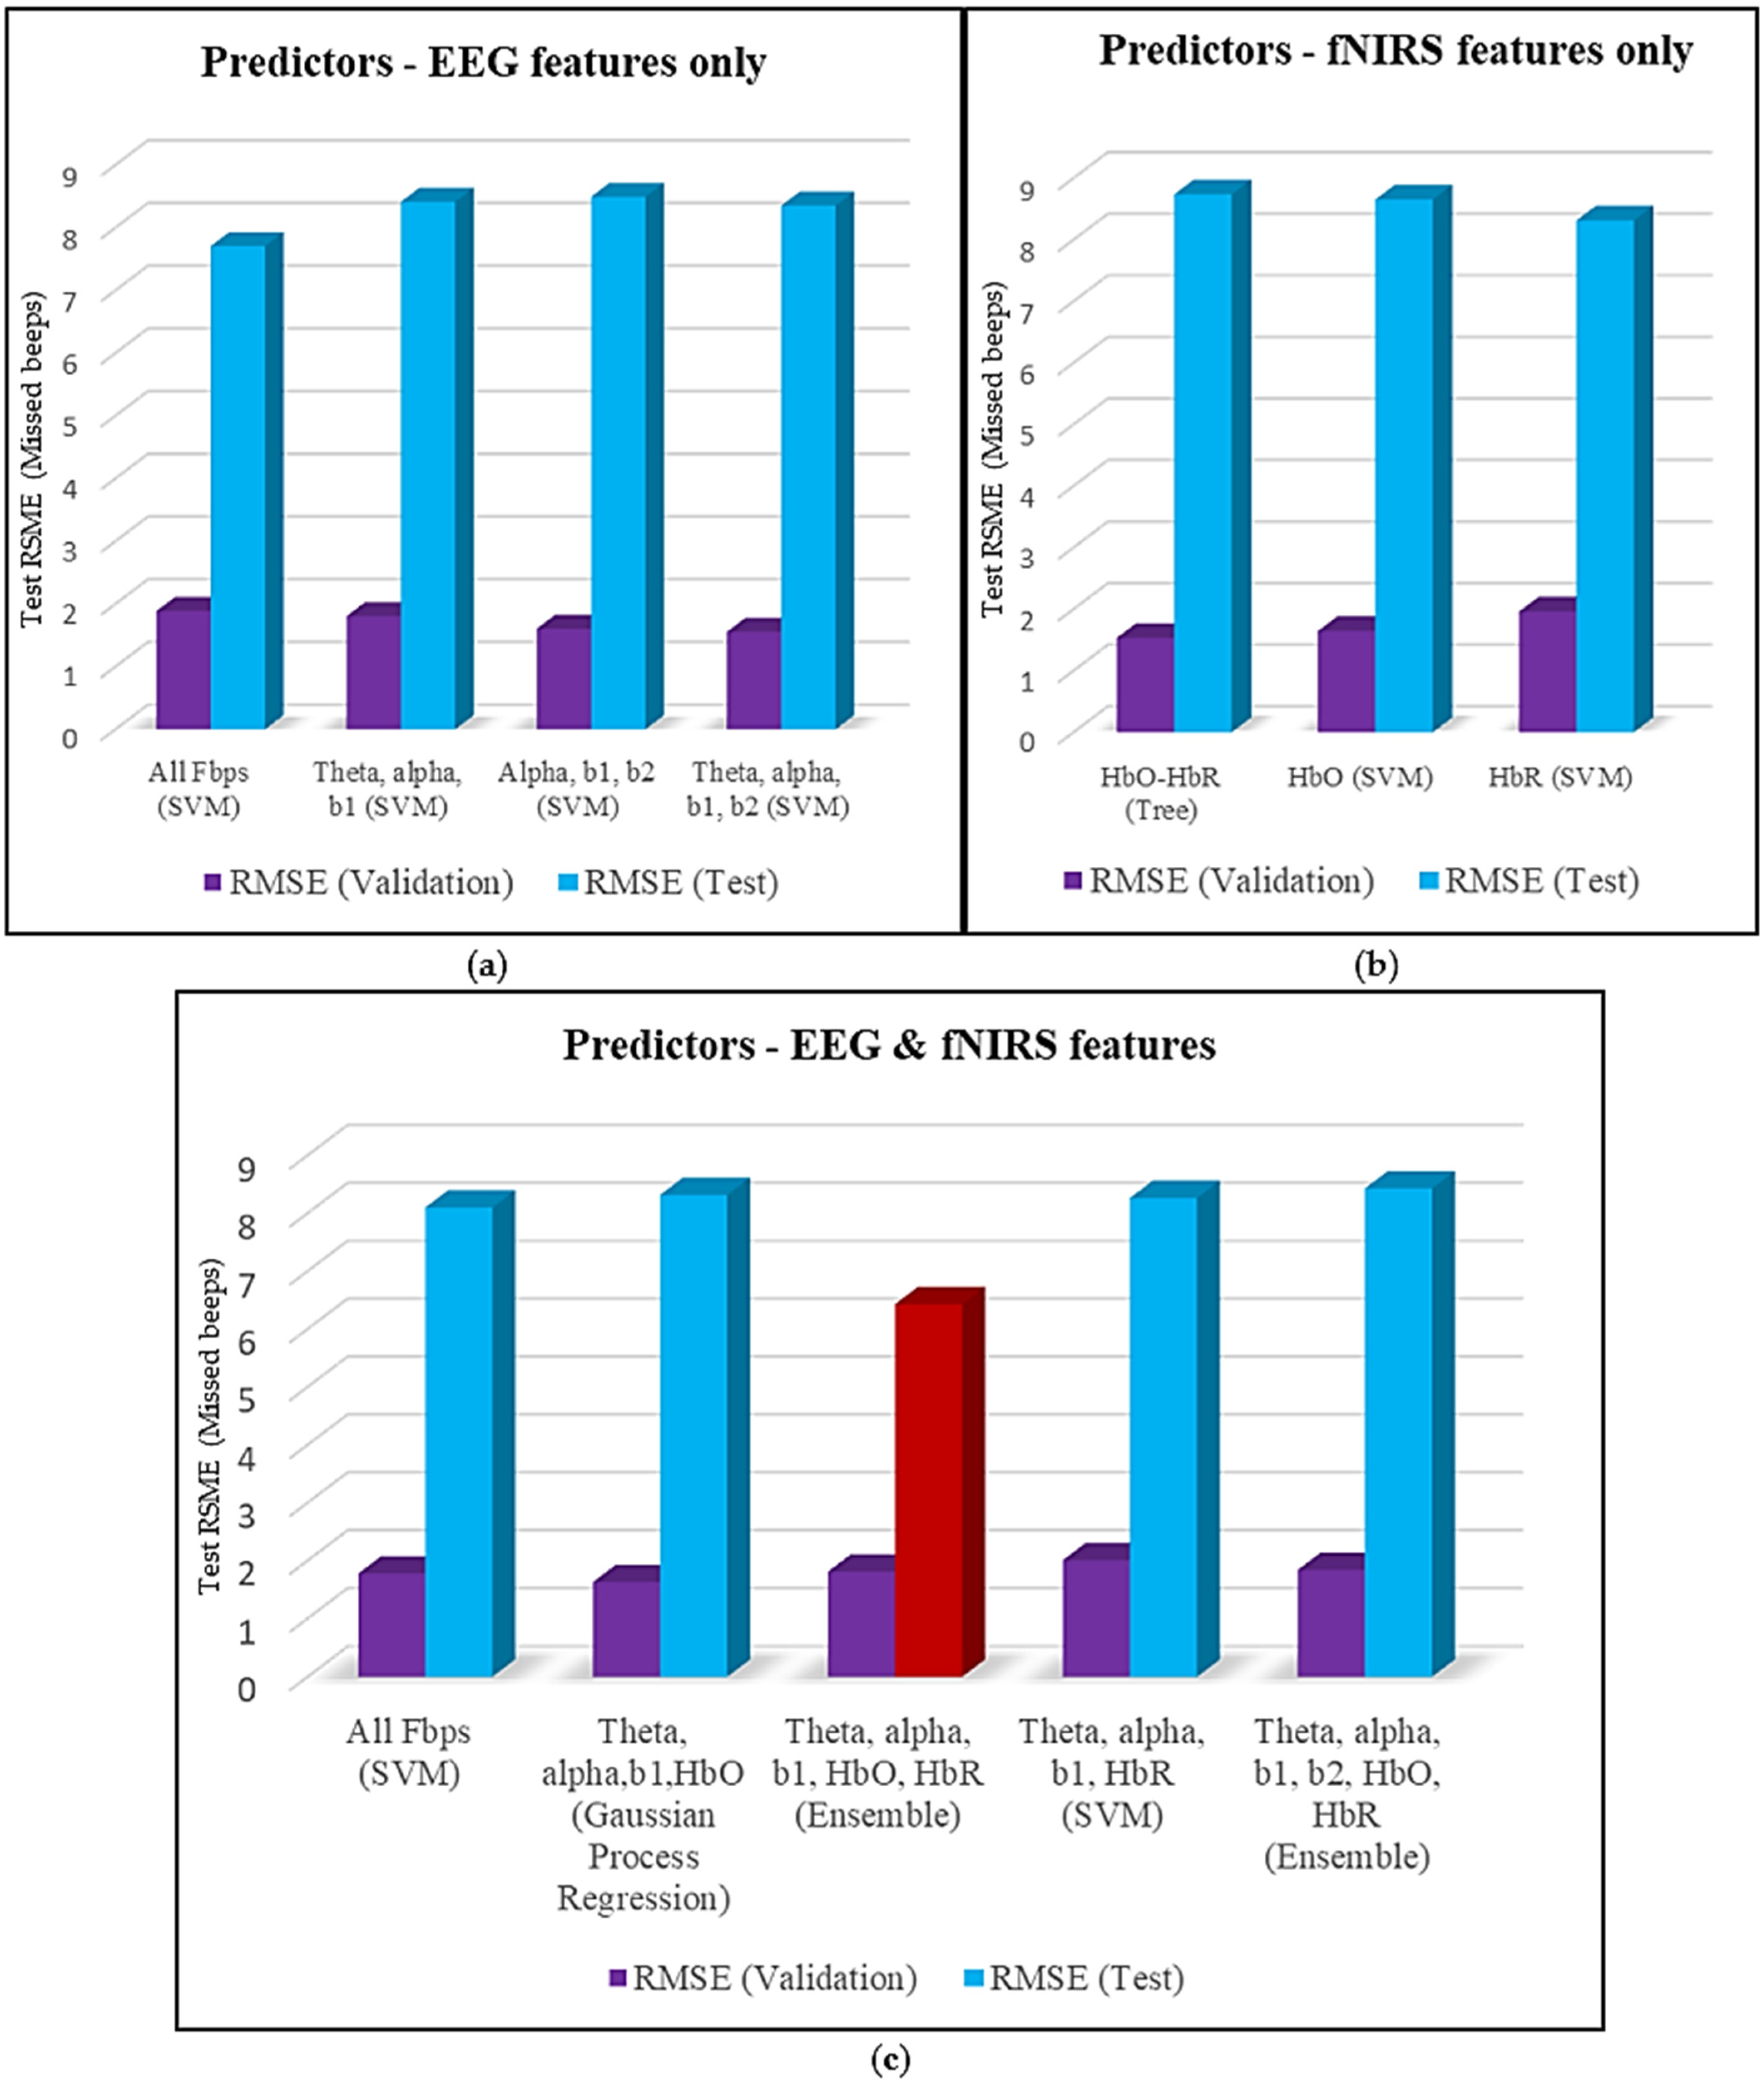
Figure 8a demonstrates that the best performance among all combinations of EEG features only, has been achieved by first set using SVM as the finest model, indicating the importance of information in all EEG bands. Test RMSE for all sets of EEG features only, lie in between 7–9 missed beeps. By observing Figure 8b, the minimum error can be seen by employing only HbR features to apply SVM, proving it to be an information-carrying feature. Here, the test RMSE resides between 8 and 9 missed beeps.
Among all combinations, the third set of EEG and fNIRS features combined (theta, alpha, b1, HbO and HbR), as shown in Figure 8c by the red bar, has outperformed. This shows the significance of initial EEG frequency bands and HbO and HbR features. The total number of beeps played in every episode is different between a range of 24 to 80 depending on the intervals between them. The best machine learning algorithm among all for missed beeps as the target is ensemble with a minimum test RMSE of 6.4269 beeps (highlighted in red color in Table 7 and Figure 8c), as it improves the performance and prediction accuracy by sequentially adding new models. This powerful machine-learning technique helps reduce overfitting, variance and bias [61].

3.3. Target: Reaction Time

When reaction time has been used as a target, again similar procedure has been followed. In the beginning, EEG predictors are considered followed by fNIRS predictors. Eventually, various combinations of both are administered to analyse which set is the best one to predict the reaction time as the target. Table 8, Table 9 and Table 10 present the results achieved for EEG predictors only, fNIRS predictors only and EEG-fNIRS predictors, respectively, indicating the best-performing algorithm, validation RMSE and test RMSE for each set of features.
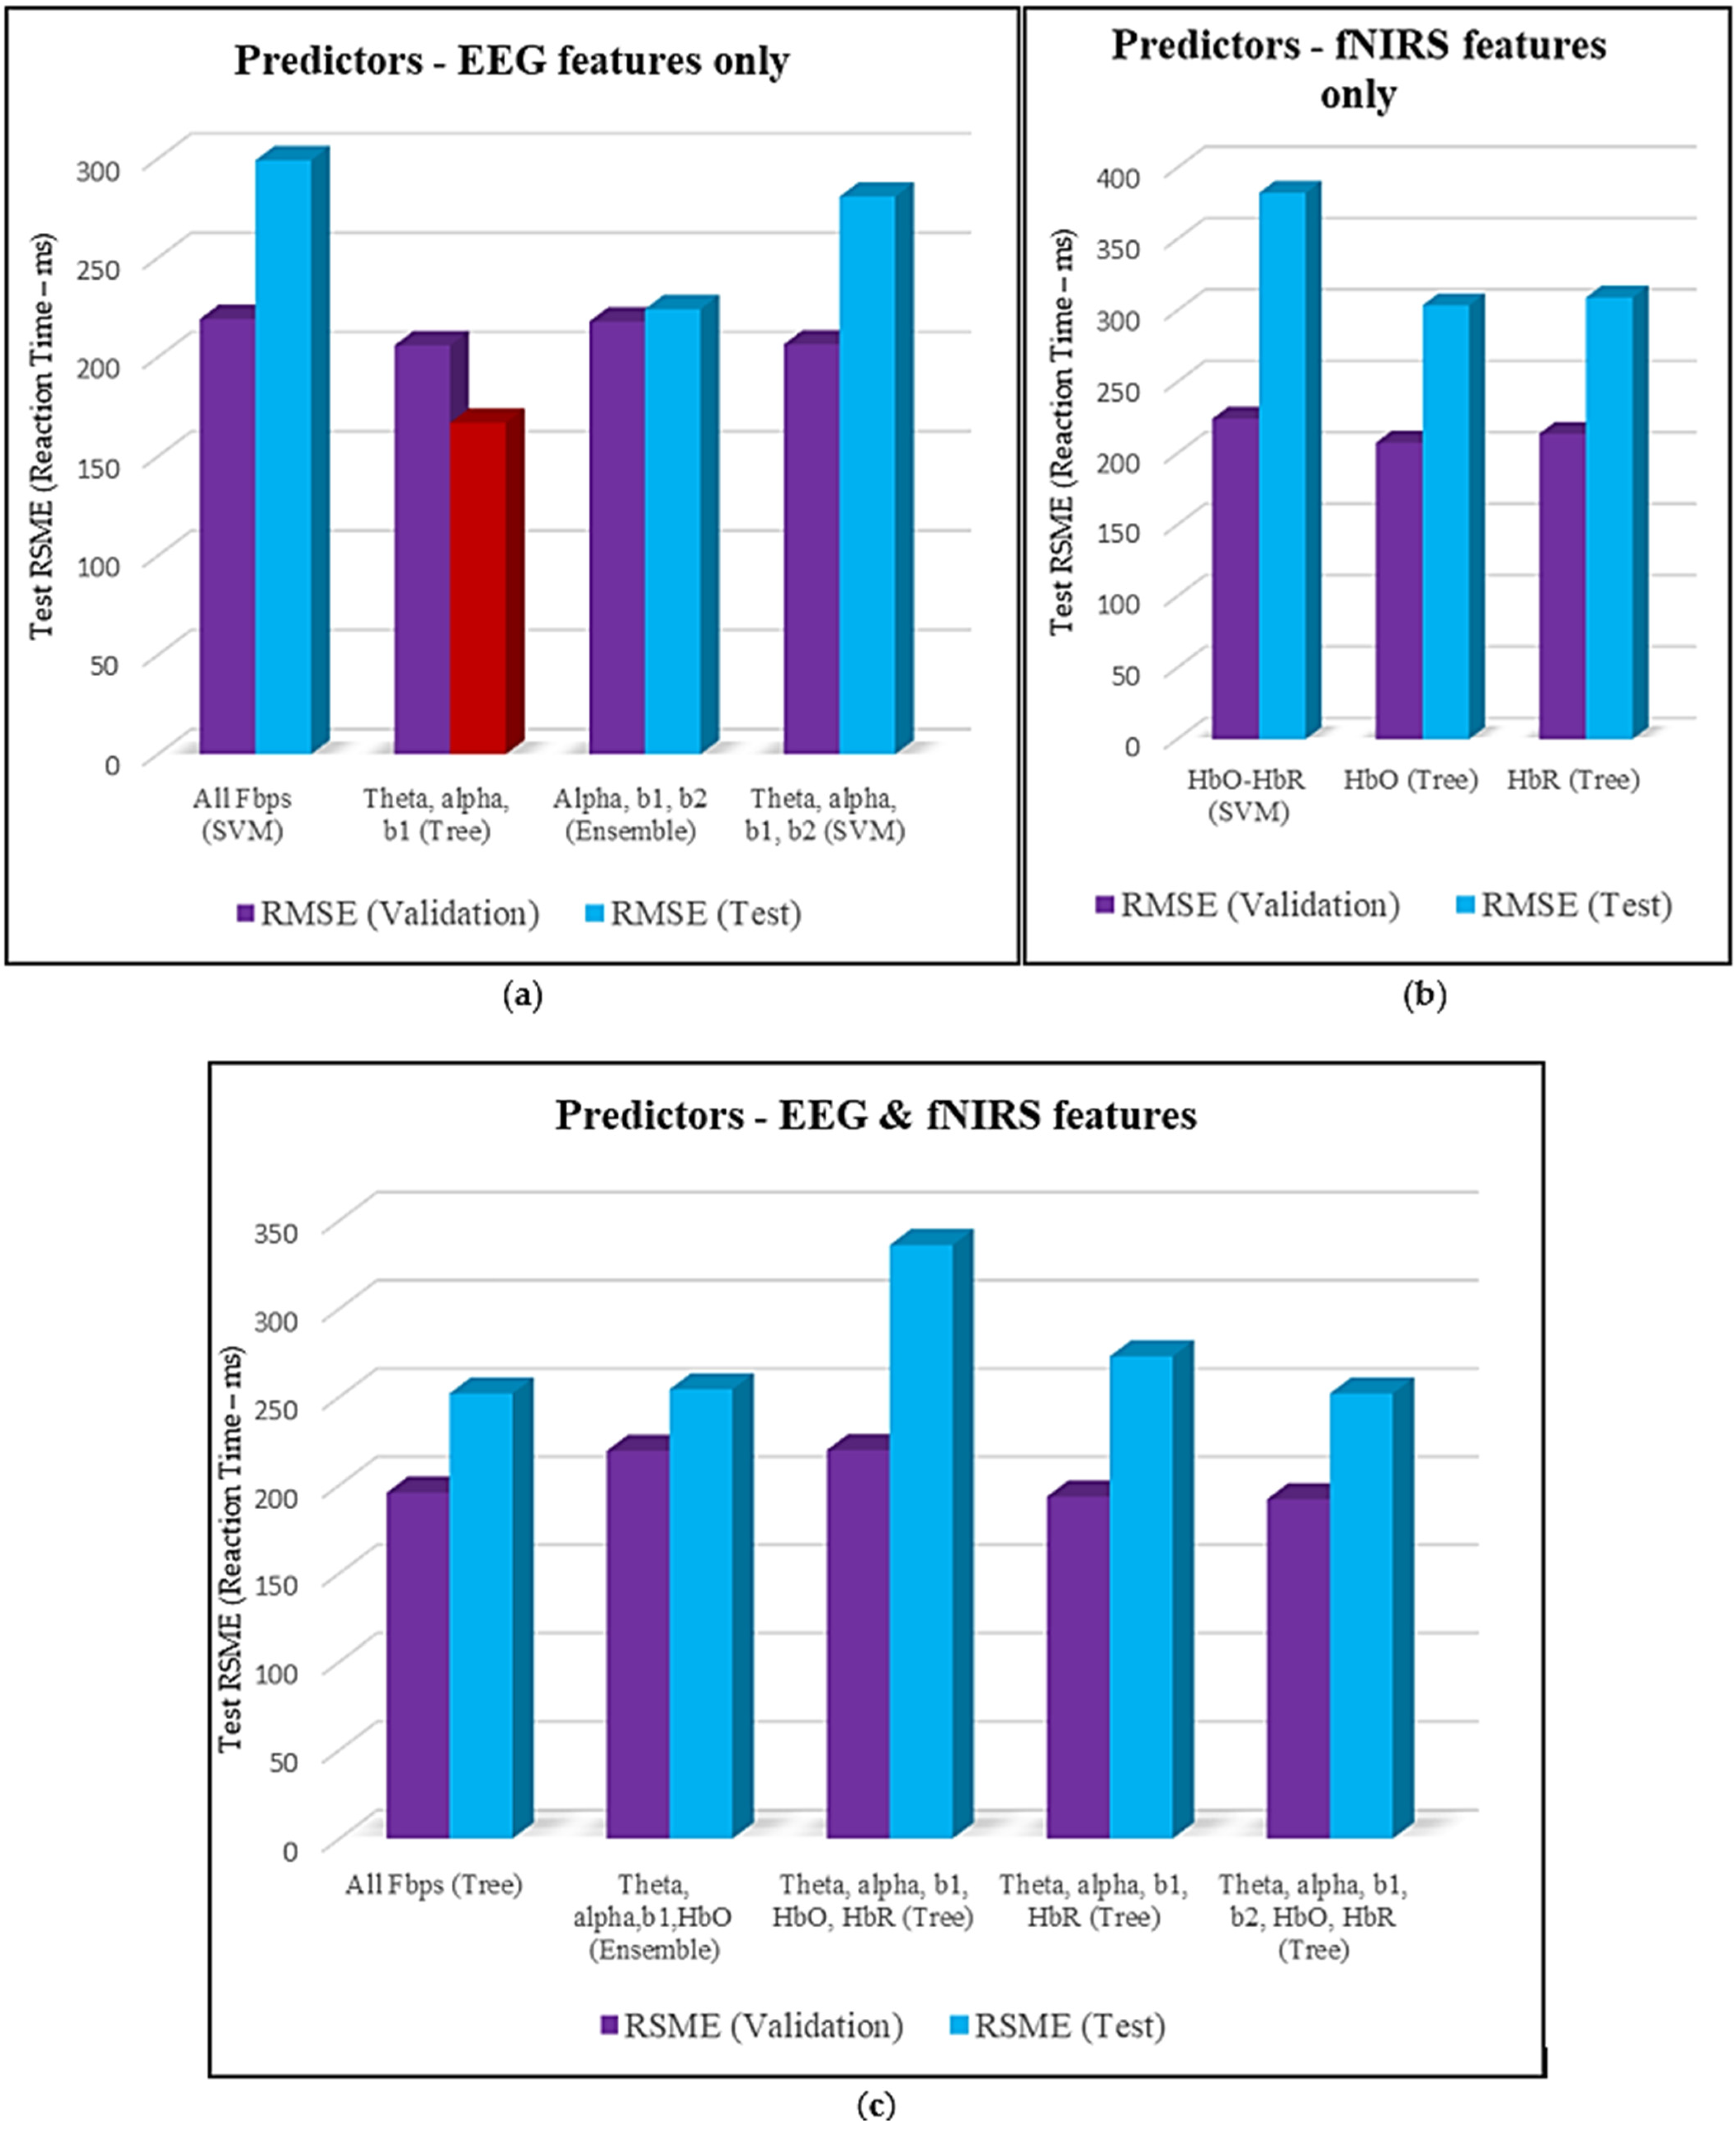
Figure 9a shows the performance of multiple predictor combinations made by EEG features only. The second combination of EEG features (Theta, alpha and b1) has outperformed all other predictor combinations (highlighted in red color in Table 8 and Figure 9a). Here, the tree has produced the minimum RMSE of 166.9 ms where the interval between two consecutive beeps ranges from 300 to 10,000 milliseconds. Test RMSE by considering EEG features only, lies between 166 and 300. Figure 9b illustrates the outcomes of using fNIRS features only. The finest results among these combinations of fNIRS predictors are achieved by employing HbO features for tree, as a well-suited algorithm. Here, test RMSE can be observed to be between 303 and 383. In the end, the impact of using combinations of both, EEG and fNIRS features, can be seen in Figure 9c. The first and fifth sets of predictors have performed better, highlighting the importance of initial EEG bands, HbO and HbR features. Tree has again performed the best for reaction time as target and combinations of EEG and fNIRS as predictors. Test RMSE for these five combinations can be seen to be between 251 and 337. This shows the strengths of using tree, especially with numerical and categorical data by producing the best results. It is an easy-to-understand and comprehendible machine learning algorithm [62].
One of the shortcomings of our previous work was that it only compared 2 machine learning techniques to find the correlation between physiological and conventional measures which restricted the results to be among 2 techniques [43]. As stated in our previous study [43], linear regression worked better than ANN for most of the targets, our results are also in line with these statements as linear regression has worked better for NASA-TLX as the target but for behavioural measures (missed beeps and reaction time) as targets, ensemble and tree have outperformed, serving the purpose of this study by showing the comparison of testing multiple machine-learning algorithms and selecting the best ones for all targets. As verified from the outcomes of the earlier research [43], the hybrid approach of using EEG and fNIRS features produced the best results for most of the cases in this analysis as well. This is due to the fact EEG has lower spatial resolution but higher temporal resolution whereas fNIRS has higher spatial resolution but lower temporal resolution. When these are combined to create a hybrid model, the best results are yielded [63]. Conversely, for reaction time EEG features alone produced the best results compared to multimodal (EEG-fNIRS) features. The hybrid approach did not work the best here as reaction time was proved to be a weak target as compared to missed beeps and NASA-TLX score in the previous study [43]. Overall, the observations of this research are in line with the previous work, but a more comprehensive comparison has been made here to provide individualised machine learning models for all targets.
This research has a few limitations. As mentioned in the methodology section, the number of participants was initially 13, but the data for only 9 of them could be used for this analysis due to quality concerns of data. Therefore, the size of the dataset was reduced making it a constraint to accurately reflect a larger population. A small dataset can also be prone to overfitting, but a 5-fold cross-validation method has been used in this analysis to mitigate the potential risk of overfitting. A limited set of features has been used for both EEG and fNIRS data. The results of this study show that a combination of physiological parameters can improve the accuracy of cognitive stress assessment and these indicators can reliably predict behavioural and subjective measures. The significance of taking into account extra physiological factors when assessing cognitive workload is emphasised by the outcomes of this study. Future research on the mental workload could benefit from the incorporation of more physiological, subjective and behavioural markers, such as galvanic skin response (GSR), gaze and facial expression monitoring etc. To get more persuasive results, larger datasets can be used. Feature sets for both neuroimaging modalities can be expanded or different features can be compared to highlight the best ones. Model optimisation using hyperparameter tuning can also be done as the next step of this study. Furthermore, this research can be extended to the localisation of cognitive stress on the brain regions. This study could represent a step forward in the investigation of cognitive stress in real time, with the feature of feedback for workers performing in stressful work environments.

4. Conclusions

Human–robot collaboration (HRC) is an essential focal point in the field of smart manufacturing. To discover the potential of neuroimaging techniques to reflect the cognitive state of human workers performing in a human–robot collaborative environment, an experiment has been conducted where subjective, objective and behavioural measures have been observed. To find the correlation between physiological and conventional measures, seven machine learning algorithms have been employed with multiple sets of features. EEG and fNIRS features, alone and in combination, have been used as predictors whereas NASA-TLX score, missed beeps and reaction time have been chosen as the targets. The results indicate that the combination of EEG-fNIRS features resulted in better correlation value than individual EEG and fNIRS features for NASA-TLX score and missed beeps whereas for reaction time, using EEG features only (theta, alpha and b1 band powers) proved to be better for selecting and training the model with the best correlation results among all others. A combination of EEG and fNIRS might not have performed well for reaction time because it is known to be a weak target as concluded from previous research. Overall best-performing EEG features include Theta, alpha and b1 bands whereas in case of fNIRS features, HbO and HbR combined have produced the best results. Among the machine learning models tested, the best performing ones with the lowest error rates are linear regression, ensemble and tree for NASA-TLX, missed beeps and reaction time, respectively. The study concludes that the physiological parameters have the tendency to predict cognitive stress and replace traditional measures. This research provides a step forward in improving the human workers’ experience while interfacing with the robots, especially in smart manufacturing setups.

Author Contributions

Conceptualisation, A.K. and A.O.; methodology, A.K., A.O., Z.Z. and A.A.; software, A.A. and Z.Z.; validation, Z.Z. and A.A.; formal analysis, A.A., Z.Z., A.K. and A.O.; investigation, A.A., A.O. and Z.Z.; resources, A.K. and P.B.; data curation, Z.Z. and A.A.; writing—original draft preparation, A.A.; writing—review and editing, A.O., A.K., P.B. and Z.Z.; visualisation, A.A.; supervision, A.O., Z.Z., A.K. and P.B.; project administration, Z.Z., A.K. and P.B.; funding acquisition, A.K., A.O. and P.B. All authors have read and agreed to the published version of the manuscript.

Funding

This research was funded by Connected Everything (CE II) Feasibility Studies, Engineering & Physical Science Research Council (EPSRC Award reference No. 4811539) and PepsiCo Europe (Funder Award Reference: M410809752) and “The APC was partly funded by PepsiCo International Limited”.

Institutional Review Board Statement

The study was conducted in accordance with the Declaration of Helsinki and approved by the Non-Invasive Human Ethics Committee of the School of Science and Technology, Nottingham Trent University (Notification of Decision—20/21-03V2 and date of approval: 1 March 2021).

Informed Consent Statement

Informed consent was obtained from all subjects involved in the study.

Data Availability Statement

Data supporting reported results can be found published in this paper.

Conflicts of Interest

The authors declare no conflicts of interest. The funders had no role in the design of the study; in the collection, analyses or interpretation of data; in the writing of the manuscript; or in the decision to publish the results.

References

  1. Fortoul-Diaz, J.A.; Carrillo-Martinez, L.A.; Centeno-Tellez, A.; Cortes-Santacruz, F.; Olmos-Pineda, I.; Flores-Quintero, R.R. A Smart Factory Architecture Based on Industry 4.0 Technologies: Open-Source Software Implementation. IEEE Access 2023, 11, 101727–101749. [Google Scholar] [CrossRef]
  2. Shi, Z.; Xie, Y.; Xue, W.; Chen, Y.; Fu, L.; Xu, X. Smart factory in Industry 4.0. Syst. Res. Behav. Sci. 2020, 37, 607–617. [Google Scholar] [CrossRef]
  3. Ghobakhloo, M. The future of manufacturing industry: A strategic roadmap toward Industry 4.0. J. Manuf. Technol. Manag. 2018, 29, 910–936. [Google Scholar] [CrossRef]
  4. Ajoudani, A.; Zanchettin, A.M.; Ivaldi, S.; Albu-Schäffer, A.; Kosuge, K.; Khatib, O. Progress and prospects of the human–robot collaboration. Auton. Robot. 2018, 42, 957–975. [Google Scholar] [CrossRef]
  5. Umbrico, A.; Orlandini, A.; Cesta, A.; Faroni, M.; Beschi, M.; Pedrocchi, N.; Scala, A.; Tavormina, P.; Koukas, S.; Zalonis, A.; et al. Design of advanced human–robot collaborative cells for personalized human–robot collaborations. Appl. Sci. 2022, 12, 6839. [Google Scholar] [CrossRef]
  6. Othman, U.; Yang, E. Human–robot collaborations in smart manufacturing environments: Review and outlook. Sensors 2023, 23, 5663. [Google Scholar] [CrossRef]
  7. Othman, U.; Yang, E. An overview of human-robot collaboration in smart manufacturing. In Proceedings of the 2022 27th International Conference on Automation and Computing (ICAC), Bristol, UK, 1–3 September 2022. [Google Scholar]
  8. Vagaš, M.; Galajdová, A.; Šimšík, D. Techniques for secure automated operation with cobots participation. In Proceedings of the 2020 21th International Carpathian Control Conference (ICCC), High Tatras, Slovakia, 27–29 October 2020. [Google Scholar]
  9. Patil, S.; Vasu, V.; Srinadh, K.V.S. Advances and perspectives in collaborative robotics: A review of key technologies and emerging trends. Discov. Mech. Eng. 2023, 2, 13. [Google Scholar] [CrossRef]
  10. De Simone, V.; Di Pasquale, V.; Giubileo, V.; Miranda, S. Human-Robot Collaboration: An analysis of worker’s performance. Procedia Comput. Sci. 2022, 200, 1540–1549. [Google Scholar] [CrossRef]
  11. Sun, Y.; Jeelani, I.; Gheisari, M. Safe human-robot collaboration in construction: A conceptual perspective. J. Saf. Res. 2023, 86, 39–51. [Google Scholar] [CrossRef]
  12. Braarud, P.; Bodal, T.; Hulsund, J.E.; Louka, M.N.; Nihlwing, C.; Nystad, E.; Svengren, H.; Wingstedt, E. An Investigation of Speech Features, Plant System Alarms, and Operator–System Interaction for the Classification of Operator Cognitive Workload During Dynamic Work. Hum. Factors 2021, 63, 736–756. [Google Scholar] [CrossRef]
  13. Upasani, S.; Srinivasan, D.; Zhu, Q.; Du, J.; Leonessa, A. Eye-tracking in physical human–robot interaction: Mental workload and performance prediction. Human. Factors 2023, 66, 2104–2119. [Google Scholar] [CrossRef] [PubMed]
  14. Jaiswal, A. An Intelligent Multi-Modal Framework Towards Assessing Human Cognition. Ph.D. Thesis, The University of Texas at Austin, Austin, Texas, 2023. [Google Scholar]
  15. Aylward, J.; Robinson, O.J. Towards an emotional ‘stress test’: A reliable, non-subjective cognitive measure of anxious responding. Sci. Rep. 2017, 7, 40094. [Google Scholar] [CrossRef] [PubMed]
  16. Khode, V.; Patil, S.; Babu, G.; Ruikar, K.; Patel, S. Detection of cognitive impairment by choice auditory reaction time (ART) and visual reaction time (VRT)s during acute mental stress in young hypertensives: A case control study. Curr. Hypertens. Rev. 2022, 18, 64–69. [Google Scholar] [CrossRef] [PubMed]
  17. Huang, M.X.; Li, J.; Ngai, G.; Leong, H.V. StressClick. In Proceedings of the MM ‘16: ACM Multimedia Conference, Amsterdam, The Netherlands, 15–19 October 2016; pp. 1395–1404. [Google Scholar]
  18. Thoen, A.; Steyaert, J.; Alaerts, K.; Evers, K.; Van Damme, T. A systematic review of self-reported stress questionnaires in People on the autism spectrum. Rev. J. Autism Dev. Disord. 2021, 10, 295–318. [Google Scholar] [CrossRef]
  19. Cohen, S.; Kamarck, T.; Mermelstein, R. A global measure of perceived stress. J. Health Soc. Behavior. 1983, 24, 385–396. [Google Scholar] [CrossRef]
  20. Braarud, P. An efficient screening technique for acceptable mental workload based on the NASA Task Load Index—Development and application to control room validation. Int. J. Ind. Ergon. 2020, 76, 102904. [Google Scholar] [CrossRef]
  21. Lesage, F.X.; Berjot, S. Validity of occupational stress assessment using a visual analogue scale. Occup. Med. 2011, 61, 434–436. [Google Scholar] [CrossRef]
  22. Leggatt, A. Validation of the ISA (instantaneous self assessment) subjective workload tool. In Contemporary Ergonomics; Taylor & Francis: Oxfordshire, UK, 2005; pp. 74–78. [Google Scholar]
  23. Laugwitz, B.; Held, T.; Schrepp, M. Construction and evaluation of a user experience questionnaire. In HCI and Usability for Education and Work; Holzinger, A., Ed.; Springer: Berlin/Heidelberg, Germany, 2008; pp. 63–76. [Google Scholar] [CrossRef]
  24. Nomura, T.; Kanda, T.; Suzuki, T.; Kato, K. Psychology in human-robot communication: An attempt through investigation of negative attitudes and anxiety toward robots. In In Proceedings of the RO-MAN 2004. 13th IEEE International Workshop on Robot and Human Interactive Communication, Kurashiki, Japan, 22 September 2004. [Google Scholar]
  25. Bartneck, C.; Kulić, D.; Croft, E.; Zoghbi, S. Measurement instruments for the anthropomorphism, animacy, likeability, perceived intelligence, and perceived safety of robots. Int. J. Soc. Robot. 2008, 1, 71–81. [Google Scholar] [CrossRef]
  26. Jost, J.; Kirks, T.; Chapman, S.; Rinkenauer, G. Examining the effects of height, velocity and emotional representation of a social transport robot and human factors in human-robot collaboration. In Human Computer Interaction–INTERACT 2019: 17th IFIP TC 13 International Conference, Paphos, Cyprus, September 2–6, 2019, Proceedings, Part II 17; Springer International Publishing: Berlin/Heidelberg, Germany, 2019; pp. 517–526. [Google Scholar]
  27. Legler, F.; Trezl, J.; Langer, D.; Bernhagen, M.; Dettmann, A.; Bullinger, A.C. Emotional Experience in Human–Robot Collaboration: Suitability of Virtual Reality Scenarios to Study Interactions beyond Safety Restrictions. Robotics 2023, 12, 168. [Google Scholar] [CrossRef]
  28. Rossato, C.; Pluchino, P.; Cellini, N.; Jacucci, G.; Spagnolli, A.; Gamberini, L. Facing with collaborative robots: The subjective experience in senior and younger workers. Cyberpsychology Behav. Soc. Netw. 2021, 24, 349–356. [Google Scholar] [CrossRef]
  29. Vanneste, P.; Raes, A.; Morton, J.; Bombeke, K.; Van Acker, B.B.; Larmuseau, C.; Depaepe, F.; Noortgate, W.V.D. Towards measuring cognitive load through multimodal physiological data. Cogn. Technol. Work. 2021, 23, 567–585. [Google Scholar] [CrossRef]
  30. Ayres, P.; Lee, J.Y.; Paas, F.; van Merriënboer, J.J.G. The Validity of Physiological Measures to Identify Differences in Intrinsic Cognitive Load. Front. Psychol. 2021, 12. [Google Scholar] [CrossRef] [PubMed]
  31. Tiwari, R.; Kumar, R.; Malik, S.; Raj, T.; Kumar, P. Analysis of heart rate variability and implication of different factors on heart rate variability. Curr. Cardiol. Rev. 2021, 17, e160721189770. [Google Scholar] [CrossRef] [PubMed]
  32. Chojnowska, S.; Ptaszyńska-Sarosiek, I.; Kępka, A.; Knaś, M.; Waszkiewicz, N. Salivary biomarkers of stress, anxiety and depression. J. Clin. Med. 2021, 10, 517. [Google Scholar] [CrossRef] [PubMed]
  33. Jerčić, P.; Sennersten, C.; Lindley, C. Modeling cognitive load and physiological arousal through pupil diameter and heart rate. Multimed. Tools Appl. 2020, 79, 3145–3159. [Google Scholar] [CrossRef]
  34. Kumar, A.; Sharma, K.; Sharma, A. Hierarchical deep neural network for mental stress state detection using IoT based biomarkers. Pattern Recognit. Lett. 2021, 145, 81–87. [Google Scholar] [CrossRef]
  35. Zhang, P.; Li, F.; Zhao, R.; Zhou, R.; Du, L.; Zhao, Z.; Chen, X.; Fang, Z. Real-Time Psychological Stress Detection According to ECG Using Deep Learning. Appl. Sci. 2021, 11, 3838. [Google Scholar] [CrossRef]
  36. Zhang, J.; Yin, H.; Zhang, J.; Yang, G.; Qin, J.; He, L. Real-time mental stress detection using multimodality expressions with a deep learning framework. Front. Neurosci. 2022, 16, 947168. [Google Scholar] [CrossRef]
  37. Katmah, R.; Al-Shargie, F.; Tariq, U.; Babiloni, F.; Al-Mughairbi, F.; Al-Nashash, H. A review on mental stress assessment methods using eeg signals. Sensors 2021, 21, 5043. [Google Scholar] [CrossRef]
  38. Causse, M.; Lepron, E.; Mandrick, K.; Peysakhovich, V.; Berry, I.; Callan, D.; Rémy, F. Facing successfully high mental workload and stressors: An fMRI study. Hum. Brain Mapping. 2021, 43, 1011–1031. [Google Scholar] [CrossRef]
  39. Molina-Rodríguez, S.; Hidalgo-Muñoz, A.R.; Ibáñez-Ballesteros, J.; Tabernero, C. Stress estimation by the prefrontal cortex asymmetry: Study on fNIRS signals. J. Affect. Disord. 2023, 325, 151–157. [Google Scholar] [CrossRef] [PubMed]
  40. Goyal, A.; Singh, S.; Vir, D.; Pershad, D. Automation of Stress Recognition Using Subjective or Objective Measures. Psychol. Stud. 2016, 61, 348–364. [Google Scholar] [CrossRef]
  41. Garcia-Ceja, E.; Riegler, M.; Nordgreen, T.; Jakobsen, P.; Oedegaard, K.J.; Tørresen, J. Mental health monitoring with multimodal sensing and machine learning: A survey. Pervasive Mob. Comput. 2018, 51, 1–26. [Google Scholar] [CrossRef]
  42. Arif, A.; Alanazi, E.; Zeb, A.; Qureshi, W.S. Analysis of rule-based and shallow statistical models for COVID-19 cough detection for a preliminary diagnosis. In Proceedings of the 2022 13th Asian Control Conference (ASCC), Jeju, South Korea, 4–7 May 2022; pp. 465–469. [Google Scholar]
  43. Zakeri, Z.; Arif, A.; Omurtag, A.; Breedon, P.; Khalid, A. Multimodal assessment of cognitive workload using neural, subjective and behavioural measures in smart factory settings. Sensors 2023, 23, 8926. [Google Scholar] [CrossRef] [PubMed]
  44. Bugg, J.M.; Jacoby, L.L.; Toth, J.P. Multiple levels of control in the Stroop task. Mem. Cogn. 2008, 36, 1484–1494. [Google Scholar] [CrossRef]
  45. Zakeri, Z.; Khalid, A.; Omurtag, A.; Hilliard, G.; Breedon, P. Building trust and safety correlates for autonomous systems using physiological, behavioral, and subjective measures. In Proceedings of the 13th International Conference on Applied Human Factors and Ergonomics (AHFE 2022), New York, NY, USA, 25–28 July 2022. [Google Scholar]
  46. Zakeri, Z.; Omurtag, A.; Breedon, P.; Hilliard, G.; Khalid, A. Studying Mental Stress Factor in Occupational Safety in the Context of the Smart Factory. In Proceedings of the 31st European Safety and Reliability Conference, Angers, France, 19–23 September 2021; pp. 92–99. [Google Scholar] [CrossRef]
  47. Jin, K.; Rubio-Solis, A.; Naik, R.; Onyeogulu, T.; Islam, A.; Khan, S.; Teeti, I.; Kinross, J.; Leff, D.R.; Cuzzolin, F.; et al. Identification of Cognitive Workload during Surgical Tasks with Multimodal Deep Learning. arXiv 2022, arXiv:2209.06208. [Google Scholar]
  48. Argyle, E.M.; Marinescu, A.; Wilson, M.L.; Lawson, G.; Sharples, S. Physiological indicators of task demand, fatigue, and cognition in future digital manufacturing environments. Int. J. Hum. Comput. Stud. 2020, 145, 102522. [Google Scholar] [CrossRef]
  49. Hart, S.G. Nasa-Task Load Index (NASA-TLX); 20 Years Later. In Proceedings of the Human Factors and Ergonomics Society Annual Meeting; Sage Publications: Los Angeles, CA, USA, 2006; pp. 904–908. [Google Scholar]
  50. Cao, A.; Chintamani, K.K.; Pandya, A.K.; Ellis, R.D. NASA TLX: Software for assessing subjective mental workload. Behav. Res. Methods 2009, 41, 113–117. [Google Scholar] [CrossRef]
  51. Rubio, S.; Diaz, E.; Martin, J.; Puente, J.M. Evaluation of subjective mental workload: A comparison of SWAT, NASA-TLX, and workload profile methods. Appl. Psychol. 2004, 53, 61–86. [Google Scholar] [CrossRef]
  52. Zakeri, Z.; Assecondi, S.; Bagshaw, A.P.; Arvanitis, T.N. Influence of signal preprocessing on ICA-based EEG decomposition. In Proceedings of the XIII Mediterranean Conference on Medical and Biological Engineering and Computing 2013, Seville, Spain, 25–28 September 2013. [Google Scholar]
  53. Zheng, W.L.; Lu, B.L. Investigating critical frequency bands and channels for EEG-based emotion recognition with deep neural networks. IEEE Trans. Auton. Ment. Dev. 2015, 7, 162–175. [Google Scholar] [CrossRef]
  54. Oon, H.N.; Saidatul, A.; Ibrahim, Z. Analysis on Non-linear features of electroen-cephalogram (EEG) signal for neuromarketing application. In Proceedings of the 2018 International Conference on Computational Approach in Smart Systems Design and Applications (ICASSDA), Kuching, Malaysia, 15–17 August 2018. [Google Scholar]
  55. Herff, C.; Heger, D.; Fortmann, O.; Hennrich, J.; Putze, F.; Schultz, T. Mental workload during n-back task—Quantified in the prefrontal cortex using fNIRS. Front. Human. Neurosci. 2014, 7, 935. [Google Scholar] [CrossRef] [PubMed]
  56. Keles, H.O.; Barbour, R.L.; Omurtag, A. Hemodynamic correlates of spontaneous neural activity measured by human whole-head resting state EEG+ fNIRS. Neuroimage 2016, 138, 76–87. [Google Scholar] [CrossRef] [PubMed]
  57. Scholkmann, F.; Kleiser, S.; Metz, A.J.; Zimmermann, R.; Pavia, J.M.; Wolf, U.; Wolf, M. A review on continuous wave functional near-infrared spectroscopy and imaging instrumentation and methodology. NeuroImage 2014, 85, 6–27. [Google Scholar] [CrossRef] [PubMed]
  58. Omurtag, A.; Aghajani, H.; Keles, H.O. Decoding human mental states by whole-head EEG+fNIRS during category fluency task performance. J. Neural Eng. 2017, 14, 066003. [Google Scholar] [CrossRef] [PubMed]
  59. Bell, J. What is machine learning. In Machine Learning and the City: Applications in Architecture and Urban Design; Wiley: Hoboken, NJ, USA, 2022; pp. 209–216. [Google Scholar]
  60. Dai, X.; Liu, J.; Zhang, X. A review of studies applying machine learning models to predict occupancy and window-opening behaviours in smart buildings. Energy Build. 2020, 223, 110159. [Google Scholar] [CrossRef]
  61. Zounemat-Kermani, M.; Batelaan, O.; Fadaee, M.; Hinkelmann, R. Ensemble machine learning paradigms in hydrology: A review. J. Hydrol. 2021, 598, 126266. [Google Scholar] [CrossRef]
  62. Machello, C.; Baghaei, K.A.; Bazli, M.; Hadigheh, A.; Rajabipour, A.; Arashpour, M.; Rad, H.M.; Hassanli, R. Tree-based machine learning approach to modelling tensile strength retention of Fibre Reinforced Polymer composites exposed to elevated temperatures. Compos. Part B Eng. 2024, 270, 111132. [Google Scholar] [CrossRef]
  63. Liu, Z.; Shore, J.; Wang, M.; Yuan, F.; Buss, A.; Zhao, X. A systematic review on hybrid EEG/fNIRS in brain-computer interface. Biomed. Signal Process. Control. 2021, 68, 102595. [Google Scholar] [CrossRef]
Figure 1. (a) Cobot–Stroop Task [46] (b) A demonstration of coworking with a cobot while doing cobot Stroop task [45].
Information 15 00640 g001
Figure 2. Cobot–Stroop task experimental paradigm with supplementary foot pedalling task [43].
Information 15 00640 g002
Figure 3. Pre-processing and artefact removal of EEG and fNIRS data [43].
Information 15 00640 g003
Figure 4. (a) Raw EEG data; (b) EEG data after artifact removal and preprocessing [43].
Information 15 00640 g004
Figure 5. (a) Raw fNIRS data (red and blue showing two light intensities); (b) fNIRS data after artifact removal and preprocessing [43].
Information 15 00640 g005
Figure 6. Machine learning for predicting traditional measures using physiological measures.
Information 15 00640 g006
Figure 7. Target: NASA-TLX. (a) Predictors: EEG features only. (b) Predictors: fNIRS features only. (c) Predictors: EEG and fNIRS features. Red bar highlights the best result for NASA-TLX as the target.
Information 15 00640 g007
Figure 8. Target: missed beeps. (a) Predictors: EEG features only. (b) Predictors: fNIRS features only. (c) Predictors: EEG and fNIRS features. The red bar highlights the best result for missed beeps as the target.
Information 15 00640 g008
Figure 9. Target: reaction time. (a) Predictors: EEG features only. The red bar highlights the best results for reaction time as the target. (b) Predictors: fNIRS features only (c) Predictors: EEG and fNIRS features.
Information 15 00640 g009
Table 1. Eight distinct episodes can be seen ranging from high (H) to low (L) levels and vice versa for performance metrics, such as the task complexity, payload complexity and cobot’s motion speed [43].
Episode No.Cobot’s SpeedPayload CapacityTask Complexity
1LLL
2LHH
3HLH
4HHL
5LLH
6LHL
7HLL
8HHH
Table 2. Target: NASA-TLX, predictors: EEG features only.
Sr. No.EEG Features OnlyBest Performing Machine Learning TechniqueRMSE (Validation)RMSE (Test)
1All FbpsLinear Regression9.501716.873
2Theta, alpha, b1Linear Regression9.76715.252
3Alpha, b1, b2Linear Regression9.201916.073
4Theta, alpha, b1, b2Linear Regression8.895814.482
Table 3. Target: NASA-TLX, predictors: fNIRS features only.
Sr. No.fNIRS Features OnlyBest Performing Machine Learning TechniqueRMSE (Validation)RMSE (Test)
1HbO, HbRSVM10.96715.394
2HbOSVM9.959222.394
3HbRSVM9.886916.204
Table 4. Target: NASA-TLX, predictors: EEG and fNIRS features. The best result for NASA_TLX as target is highlighted in red colour.
Sr. No.EEG-fNIRS FeaturesBest Performing Machine Learning TechniqueRMSE (Validation)RMSE (Test)
1All Fbps, HbO, HbRSVM9.434716.2
2Theta, alpha, b1, HbOLinear Regression9.114912.764
3Theta, alpha, b1, HbO, HbRSVM10.67715.327
4Theta, alpha, b1, HbRLinear Regression9.063712.895
5Theta, alpha, b1, b2, HbO, HbRGaussian Process Regression9.132816.096
Table 5. Target: missed Beeps; predictors: EEG features only.
Sr. No.EEG Features OnlyBest performing Machine Learning TechniqueRMSE (Validation)RMSE (Test)
1All FbpsSVM1.88487.7047
2Theta, alpha, b1SVM1.80398.4108
3Alpha, b1, b2SVM1.6048.4906
4Theta, alpha, b1, b2SVM1.55418.3504
Table 6. Target: missed beeps; predictors: fNIRS features only.
Sr. No.fNIRS Features OnlyBest Performing Machine Learning TechniqueRMSE (Validation)RMSE (Test)
1HbO, HbRTree1.53298.7363
2HbOSVM1.64368.6522
3HbRSVM1.95938.3124
Table 7. Target: missed beeps; predictors: EEG and fNIRS features. The best result for missed beeps is highlighted in red colour.
Sr. No.EEG-fNIRS FeaturesBest Performing Machine Learning TechniqueRMSE (Validation)RMSE (Test)
1All Fbps, HbO, HbRSVM1.77418.0968
2Theta, alpha, b1, HbOGaussian Process Regression1.628878.3144
3Theta, alpha, b1, HbO, HbREnsemble1.80846.4269
4Theta, alpha, b1, HbRSVM2.0078.2621
5Theta, alpha, b1, b2, HbO, HbREnsemble1.83948.4269
Table 8. Target: reaction time; predictors: EEG features only. The best result for reaction time as the target is highlighted in red colour.
Sr. No.EEG Features OnlyBest Performing Machine Learning TechniqueRMSE (Validation)RMSE (Test)
1All FbpsSVM219.24299.14
2Theta, alpha, b1Tree205.98166.9
3Alpha, b1, b2Ensemble217.96224.16
4Theta, alpha, b1, b2SVM206.45280.84
Table 9. Target: reaction time; predictors: fNIRS features only.
Sr. No.fNIRS Features OnlyBest Performing Machine Learning TechniqueRMSE (Validation)RMSE (Test)
1HbO, HbRSVM224.29382.36
2HbOTree207.47303.69
3HbRTree213.76309.08
Table 10. Target: reaction time; predictors: EEG and fNIRS features.
Sr. No.EEG-fNIRS FeaturesBest Performing Machine Learning TechniqueRMSE (Validation)RMSE (Test)
1All Fbps, HbO, HbRTree195.75251.9
2Theta, alpha, b1, HbOEnsemble219.49254.29
3Theta, alpha, b1, HbO, HbRTree219.85336.06
4Theta, alpha, b1, HbRTree193.47272.97
5Theta, alpha, b1, b2, HbO, HbRTree192.01251.9
Disclaimer/Publisher’s Note: The statements, opinions and data contained in all publications are solely those of the individual author(s) and contributor(s) and not of MDPI and/or the editor(s). MDPI and/or the editor(s) disclaim responsibility for any injury to people or property resulting from any ideas, methods, instructions or products referred to in the content.