Abstract
Automated Machine Learning (AutoML) enhances productivity and efficiency by automating the entire process of machine learning model development, from data preprocessing to model deployment. These tools are accessible to users with varying levels of expertise and enable efficient, scalable, and accurate classification across different applications. This paper evaluates two popular AutoML tools, the Tree-Based Pipeline Optimization Tool (TPOT) version 0.10.2 and Konstanz Information Miner (KNIME) version 5.2.5, comparing their performance in a classification task. Specifically, this work analyzes autism spectrum disorder (ASD) detection in toddlers as a use case. The dataset for ASD detection was collected from various rehabilitation centers in Pakistan. TPOT and KNIME were applied to the ASD dataset, with TPOT achieving an accuracy of 85.23% and KNIME achieving 83.89%. Evaluation metrics such as precision, recall, and F1-score validated the reliability of the models. After selecting the best models with optimal accuracy, the most important features for ASD detection were identified using these AutoML tools. The tools optimized the feature selection process and significantly reduced diagnosis time. This study demonstrates the potential of AutoML tools and feature selection techniques to improve early ASD detection and outcomes for affected children and their families.
1. Introduction
Machine learning (ML) has gradually permeated every part of our lives, and the beneficial impact has been amazing, but Automated Machine Learning (AutoML) is an emerging method of speeding up the integration of ML into additional applications and real-world scenarios. To increase the efficiency and effectiveness of ML models, feature selection approaches are used to determine the most important features for modeling. AutoML methods have gained importance in recent years because they can automate model selection, hyperparameter tuning, and the feature selection process. The process of generating models has been completely transformed by AutoML systems, which automate the selection of features, methods, and hyperparameters. AutoML techniques can handle large, complex datasets and efficiently select important characteristics for model building [1,2].
Feature selection is a critical step in the AutoML process. Its purpose is to identify the most relevant features for predicting outcomes, particularly when dealing with high-dimensional data. By reducing the number of dimensions, feature selection helps to prevent overfitting and enhances the interpretability of models [3]. The key concept behind feature selection is to retain features that are strongly correlated with the prediction target while minimizing overlap among them [4].
In the past few years, AutoML tools have made feature selection and other ML tasks easier. JADBIO is an AutoML platform that simplifies model development for prediction by automating tasks such as feature selection and model training. It places special emphasis on the algorithm and hyperparameter space (AHPS) method, which JADBIO uses to adapt to the size and complexity of the dataset [5]. This study, as discussed in [6], examines supervised, unsupervised, and semi-supervised methods side by side for handling data with many features.
Feature selection has impacted many fields, such as sentiment analysis [7], intrusion detection [8], disease diagnosis [9,10], and stock price prediction [11]. In healthcare, it boosts the accuracy of predicting conditions like Polycystic Ovary Syndrome (PCOS) [12] and autism spectrum disorder (ASD) [13]. ASD is a neurodevelopmental disorder characterized by difficulties in speech, behavior, and social interactions. Early detection and intervention are critical to improving outcomes for children with ASD. Specifically, in this study, different AutoML frameworks are used to detect ASD in a dataset gathered from various rehabilitation centers in Pakistan. Formal diagnosis of ASD is an extensive process, with the average wait time for ASD detection in United Kingdom being over three years. ASD diagnosis can be made at any age, but early diagnosis is highly beneficial for both the patient and family as it facilitates improved management of the disorder [14,15].
Early intervention to enhance language and communication skills, as well as the overall development of children with autism, is crucial [16,17]. An ASD diagnosis can be made as early as 18–24 months, yet formal diagnosis is frequently delayed until the age of four years due to variation in symptoms. There are several screening methods for ASD, such as AQ, SCQ, M-CHAT, CARS-2, and STAT [18]. Early diagnosis leads to early treatment, which in return enhances the life of those with ASD. Data from various screening methods have been used to detect autism with the help of ML techniques. In various studies, Q-CHAT-10 has been used for ASD screening in children [19,20].
Diagnosing autism spectrum disorder (ASD) is challenging and takes a long time, even though early diagnosis is crucial for effective treatment. By comparing and analyzing prominent AutoML tools and analyzing datasets, this study investigates how Automated Machine Learning (AutoML) will allow for better and more accurate ASD diagnosis. This study primarily focuses on the effectiveness of AutoML in diagnosing autism spectrum disorder (ASD) and analyzing the key features of ASD that contribute to early detection. By achieving these goals, this study will demonstrate how AutoML can enhance diagnosis in clinical settings.
The main contributions of this study are as follows:
- This study conducted a comprehensive data collection effort by gathering ASD data from multiple rehabilitation centers across Pakistan, employing the Autism Spectrum Quotient in Toddlers-10 (Q-CHAT-10) questionnaire. This approach ensured the inclusion of a diverse population and captured critical features essential for early and accurate ASD detection.
- Leveraging cutting-edge AutoML tools, specifically TPOT and KNIME, the entire model selection and hyperparameter tuning process for ASD detection was automated. This automation not only streamlined the workflow but also facilitated the identification of the most significant ASD features, leading to the development of robust ASD feature signatures.
- This work conducted a thorough comparative analysis of the performance and feature signatures generated by TPOT and KNIME, providing valuable insights into the strengths and limitations of each AutoML tool in the context of ASD detection. This comparison underscores the potential of AutoML tools to enhance predictive accuracy and feature interpretability in clinical diagnostics.
2. Literature Review
AutoML methods have gained importance because they aim to automate processes in ML pipelines such as feature selection, feature engineering, and hyperparameter optimization. AutoML systems improve ML workflows by automating processes such as data preprocessing, model selection, and hyperparameter tuning. Feature extraction is a crucial part of AutoML, which identifies and extracts relevant features. Feature selection is an important phase in the ML process because it allows for the discovery of the most relevant features that contribute to a model’s prediction performance. AutoML tools have become increasingly popular in recent years, providing a mechanism to automate the feature selection process and other aspects of model building [1,2].
The high-dimensional analysis of data is a significant challenge in ML, and feature selection provides an effective approach for overcoming this problem [3]. One of the main principles behind feature selection is the idea that “a good feature subset is one that contains features that are highly correlated with the class but uncorrelated with each other” [4]. The study in [5] shows how JADBIO, an AutoML tool, uses the algorithm and hyperparameter space (AHPS) technique to extract features, customizing its methodology based on the dataset’s dimensions and size. Even with a small number of records, this method ensures accurate and efficient predictive and diagnostic model generation by identifying the most significant features from high-dimensional data. Another research [6] investigated the compatibility of five commonly used feature selection approaches in data mining research for sentiment analysis using an online movie review dataset. The study in [7] used a comparative analysis of supervised learning techniques and the Fisher score feature selection algorithm to detect intrusions, introducing insights into the role of feature selection in improving the performance of supervised learning techniques for intrusion detection.
To automate the diagnosis of Polycystic Ovary Syndrome (PCOS), Kuzhippallil et al. [8] adopted various classification algorithms and a hybrid feature selection strategy to minimize the number of features. Additionally, Khagi et al. [9] explored different feature selection methods and classification models for liver disease prediction. Their research revealed additional insight into how feature selection techniques affect disorder classification models. Further research [10] demonstrated the potential of feature selection strategies in improving the accuracy of classification frameworks by integrating AutoML technology to estimate the yield and biomass based on three crop categories using hyperspectral data.
An overview of the application of deep learning networks to stock price prediction was provided by Li et al. [11], who emphasized the significance of feature selection and hyperparameter optimization for prediction quality. They proposed a reliable and interpretable methodology to automatically evaluate credit fraud detection, including feature selection and compelling ML techniques, emphasizing the significance of feature selection techniques in developing effective fraud detection systems [12]. ASD is a neurological disorder that affects social interaction, communication, and behavior. Early detection and diagnosis of ASD are critical for prompt intervention and better outcomes. In recent years, AutoML approaches have gained popularity as an effective approach for detecting ASD. Raj et al. [13] investigated the analysis and detection of ASD using ML techniques. Their results showed a high accuracy rate of 70.22% in ASD detection, confirming the usefulness of AutoML in this regard.
Thabtah et al. [15] discussed the issues of ASD screening, emphasizing the need for increased diagnostic accuracy and speed. They introduced a new ML technology, Rules Machine Learning, which not only detects autism symptoms but also generates interpretable rule sets for doctors and carers. Baron et al. [17] emphasize the importance of affordable, brief screening tools for DD and ASD in children in LMICs, where resources are limited. They suggested 10 promising techniques but noted the challenges due to resource constraints and cultural differences, emphasizing the need for ongoing research and collaboration. Islam et al. [21] employed an Italian clinical sample to validate the psychometric features in the Q-CHAT questionnaire, discussing statistics for the three study groups. Q-CHAT scores were higher in the group of autistic people compared to DD and TD groups. In this study [22], the results showed that boys were more likely than girls to have ASD, while age has no effect on Q-CHAT scores.
Farooqi et al. [23] noted the issues encountered during the data gathering process in countries such as Pakistan, where there is no tracking or reporting of ASD cases. Cerrada et al. [24] noted that the systems eventually arrived at different decision tree techniques; H2O favored ensembles of XGBoost models, whereas TPOT produced various kinds of stacked models. According to the convergence of both AutoML systems, pipelines focusing on very similar subsets of features across all problems can achieve up to 90% accuracy using a relatively small collection of 10 common features.
3. Proposed System Architecture
The proposed approach utilized in this study creates and assesses AutoML models for diagnosing ASD and conducts feature ranking, as shown in Figure 1. The proposed framework begins with the collection of data, gathering crucial information about ASD symptoms and related traits. These data are then partitioned to form training and testing datasets, ensuring that the models can be properly trained and validated. Two AutoML tools, TPOT and KNIME, are used to automatically construct and optimize ML pipelines. These systems simplify the model development process by automating feature selection, model selection, and hyperparameter tuning. The AutoML tools, TPOT and KNIME, select the best model for ASD detection. After finding the best model, the performance metrics—accuracy, precision, and recall—are evaluated. Finally, the AutoML tools ranked features of ASD according to their significance, and feature signatures were discovered.
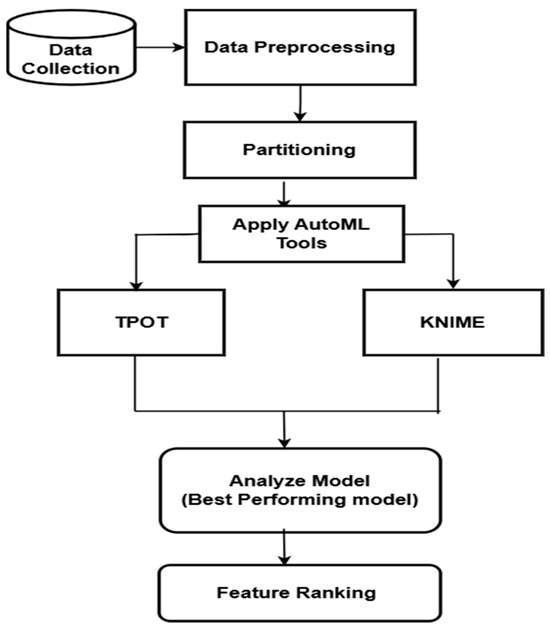
Figure 1.
Workflow of the proposed system using AutoML tools.
3.1. Data Collection Method
For this study, information was collected from several Pakistani rehabilitation centers. Many samples were gathered directly from the parents of autistic children. After that, the information was put into a spreadsheet and stored in a text file format. The lack of efficient reporting and tracking of autism cases across the nation made this task challenging. Since data for this study needed to be gathered from scratch in both hard and soft formats, a questionnaire based on the Quantitative Checklist for Autism in Toddlers (Q-CHAT) screening technique was used, which was developed by Baron-Cohen et al. [25]. Q-CHAT minimized the time required to fill out the form, allowing a large population to do so. Initially, it comprised 25 questions. They later proposed Q-CHAT-10 [16], a questionnaire with only ten questions. It provides a variety of response categories. It is quick to complete because a higher score indicates autistic features.
3.2. Data Preprocessing
Data preprocessing is the essential process of transforming raw or noisy data to prepare it for analysis and model training. This phase involves several essential tasks, the first of which is the identification and removal of missing data. For consistency and clarity, values of 0 and 1 are used to encode categorical features into a binary format for this study. For example, the attribute “Gender” was encoded with two classes: male and female. The value “Jaundice” was represented as 1 for yes and 0 for no. In the same way, the ASD Class/Traits were encoded to distinguish between those who are (1) autistic and those who are (0) non-autistic. To concentrate on the most essential data for analysis, from the dataset, unnecessary features like “Case_No” and “Who completed the test” were removed. The details of the dataset’s variables are shown in Table 1.

Table 1.
Description of the dataset’s variables.
After data preprocessing, which involved removing null and missing values, the final dataset consisted of 742 instances, which were used for the experiments. This dataset was collected from various rehabilitation centers across Pakistan and included data from children aged 1 to 4 years, covering both male and female participants. Specifically, the dataset comprised 434 male children and 308 female children. However, it is important to note that the dataset was imbalanced, with 528 instances labeled as ‘Yes’ (indicating autism traits) and 214 as ‘No’ (indicating no autism traits), as shown in Figure 2. To handle this imbalance, we applied appropriate evaluation metrics such as precision, recall, F1-scoring, and ROC-AUC scoring, which are more suitable than simple accuracy for imbalanced datasets. These metrics allowed us to properly assess the classification performance, particularly in identifying children with autism traits, which is crucial for the early detection of and intervention in autism spectrum disorder (ASD).
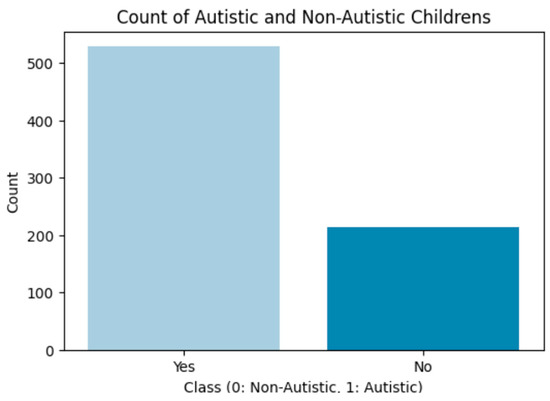
Figure 2.
Distribution of autistic vs. non-autistic children in the dataset.
3.3. Data Partitioning
Data partitioning is an important phase in the ML pipeline, and for this study, we used an 80/20 train/test split on the dataset. This strategy allowed us to use 80% (594) of the data to train the model and 20% (148) to test its performance on previously unseen data, which is critical for determining its generalization capabilities. By maintaining a separate test set, the effect of overfitting can be avoided, and we can ensure that the model’s performance measures accurately represent its ability to predict outcomes on new, real-world data. This segmentation not only improves the reliability of the results, but it also makes it easier to identify potential model biases, resulting in increased robustness and prediction accuracy.
3.4. Applying AutoML Tools
3.4.1. TPOT: Tree-Based Pipeline Optimization Tool
TPOT is a library for automating the procedure for selecting the best ML model and hyperparameters, saving time and improving the results. Instead of manually testing alternative models and configurations for data, TPOT uses genetic programming to explore a variety of ML pipelines and select the one that is most suited to an individual dataset [26,27]. TPOT represents a pipeline model using a binary decision tree structure. This covers data preparation, algorithm modeling, hyperparameter tuning, model selection, and feature selection, as shown in Figure 3.
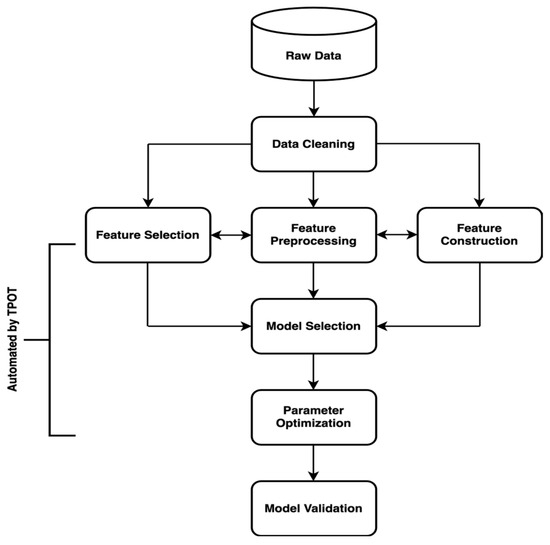
Figure 3.
Machine learning pipeline automated by TPOT.
3.4.2. KNIME: Konstanz Information Miner
KNIME is an open-source platform for data analysis, reporting, and automation that makes ML workflow creation and implementation easier. KNIME’s straightforward, user-friendly interface enables users to visually build data workflows as shown in Figure 4, making it suitable for both beginners and specialists in data science.
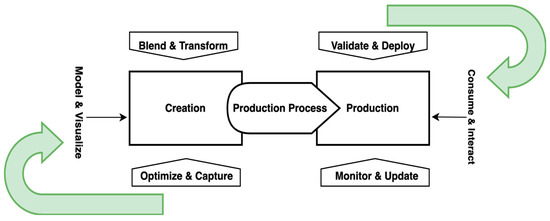
Figure 4.
KNIME’s workflow and functionality.
KNIME begins by importing data via nodes like the CSV Reader. Preprocessing steps such as cleaning, normalization, and transformation are then applied. Afterward, the data are split into training and testing sets using the partitioning node, usually with an 80-20 ratio for robust evaluation. AutoML capabilities in KNIME are handled by nodes that automate model selection and hyperparameter tuning, evaluating different models to find the best one. The Scorer node assesses model performance using metrics like accuracy, precision, recall, and F1-score. Analysis for feature signatures identifies the important features contributing to model accuracy. KNIME supports iterative optimization, allowing users to refine workflows by modifying pipelines and parameters.
3.5. Model Selection
Model selection is a challenging task, requiring extensive experimentation and skill to choose the best technique for a given dataset. AutoML technologies offer significant advantages by automating the process of testing several ML models. In this work, AutoML is used to systematically evaluate a wide range of algorithms without requiring manual intervention. This not only saves time, but also reduces the chances of individual bias in model selection. Using AutoML’s capabilities, the best-performing model suited to the dataset is quickly discovered, ensuring that the proposed approach is both efficient and reliable, as compared to traditional methods that require time-consuming, individual comparisons of different models.
3.6. Feature Signature Discovery
Finding and understanding the most relevant features in a dataset that improve model performance is known as “feature signature discovery”. The qualities and significance of such attributes are captured in a feature signature, which also sheds light on how these attributes relate to the target variable. The most important phase in the feature signature discovery process is feature ranking, in which features are ranked and assessed according to how well they predict, and how well the model will perform. A range of methodologies, including statistical tests, tree-based methods, and wrapper techniques can be used to evaluate the significance of a characteristic.
The benefits of feature ranking are as follows:
- Prioritizing high-ranking characteristics to increase accuracy and decrease overfitting.
- Knowing which features matter most allows for targeted data collection efforts and optimized use of computational resources in training the model.
- Streamlining preprocessing and modeling processes by selecting relevant features.
4. Results and Experimentation
In this section, the best-performing models for the dataset using two AutoML tools, KNIME and TPOT, are evaluated. To examine the results of the models generated by these tools, a variety of performance evaluation metrics, such as accuracy, which measures the model’s overall correctness, precision, which measures the number of true-positive predictions among all positive predictions, recall, which evaluates the number of true-positive predictions among all actual positives, and the F1-score, which balances precision and recall, are used. In addition, the ROC-AUC statistic, to assess the model’s ability to differentiate between positive and negative classifications, is also used. Using these criteria, this work ensured a thorough evaluation of the models’ efficacy, robustness, and reliability, giving us a clear picture of their performance on the dataset.
4.1. Results and Evaluations
In this section, the findings of the proposed AutoML-based model for ASD detection and feature selection are presented. This work conducted two experiments, using TPOT and KNIME on the dataset. Each experiment was designed to evaluate the performance and accuracy of the models generated by these AutoML tools.
4.1.1. Experiment 1 (Applying TPOT)
In the first experiment, the TPOT framework was applied to the dataset to automate the ML pipeline design. TPOT utilizes evolutionary algorithms to optimize hyperparameters and select the best model. The best pipeline generated by TPOT is evaluated using the aforementioned evaluation metrics. The experiment began by splitting the dataset into training and testing sets, ensuring an 80-20 split ratio for effective model evaluation. TPOT was then configured with specific parameters, including a set number of generations and population size, to thoroughly explore the solution space. TPOT classifier is defined and configured with the following specific parameters:
- Generations: 10;
- Population size: 200;
- Scoring metric: accuracy;
- Verbosity: 2 (to provide detailed logs);
- Random state: 42 (for reproducibility).
Throughout the optimization process, TPOT generated and evaluated multiple pipelines over several generations. After completing 10 generations, TPOT identified the best pipeline, which included a Random Forest classifier as the optimal model. As this study discussed different metrics, these metrics were used to evaluate the model’s performance in detecting ASD. This model achieved an impressive accuracy of 85.23%, a precision of 85.7% and a recall of 95.3% for the dataset, demonstrating its robustness and effectiveness. The classification report of the optimal model is shown in Figure 5.

Figure 5.
Classification report of the model generated by TPOT.
The confusion matrix of the best model generated by TPOT, which is the Random Forest classifier, is shown in Figure 6. It demonstrates that of the 30 actual “No” instances, 25 were accurately predicted as “No” (true negatives), while 5 were incorrectly predicted as “Yes” (false positives). Of the 119 actual “Yes” instances, 102 were true positives (TPs), whereas 17 were false negatives (FNs). Overall, the confusion matrix illustrates that the classifier performs well in identifying the positive class.
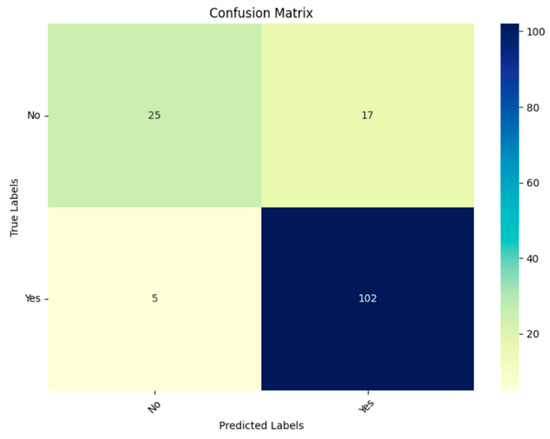
Figure 6.
Confusion matrix of the model generated by TPOT.
The Receiver Operating Characteristic (ROC) curve of the model, which compares the True Positive Rate (TPR) to the False Positive Rate (FPR), is shown in Figure 7. It was used to assess the Random Forest classifier’s performance. With an Area Under the Curve (AUC) of 0.86 on the generated ROC curve, the model is very capable of differentiating between the positive and negative classes.
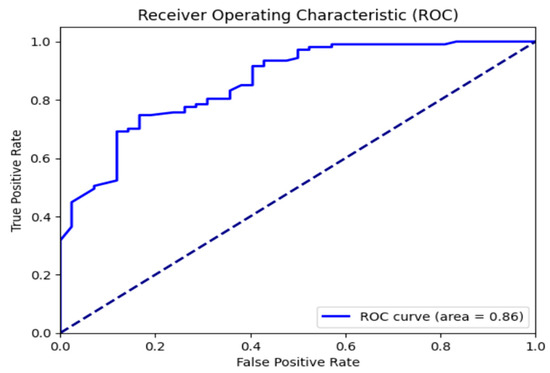
Figure 7.
ROC curve for the model performance optimized using TPOT.
Feature Ranking
Following the identification of the best model, feature extraction was performed to determine the most significant and contributing features to the model’s accuracy. TPOT is used to select features during the AutoML process. TPOT uses genetic programming to optimize ML pipelines, which include feature selection algorithms. Specifically, TPOT uses Recursive Feature Elimination (RFE) to select the most relevant attributes. RFE works by fitting a model recursively and eliminating the weakest features based on their usefulness in predicting the target variable, until the optimal number of features is found. TPOT uses cross-validation throughout the optimization process to estimate the performance of each pipeline configuration. The pipelines with the highest accuracy are chosen, and their configurations are further optimized via crossover and mutation processes, resulting in new generations of pipelines with varied feature subsets. The analysis revealed that the “Q-CHAT 10 score” was the most important feature. The importance of various features is depicted in Figure 8, illustrating their relative contributions to the model’s predictiveness.
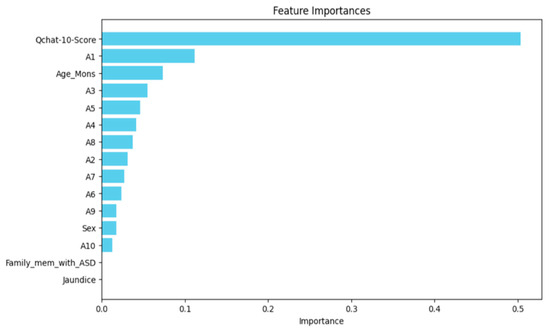
Figure 8.
Important features identified by the TPOT model.
4.1.2. Experiment 2 (Applying KNIME)
In the second experiment, KNIME, a versatile and user-friendly AutoML tool, was utilized to replicate the process conducted in Experiment 1 and validate the findings. KNIME’s comprehensive features and intuitive interface facilitated a streamlined and efficient workflow for the ASD detection task, which is shown in Figure 9.

Figure 9.
KNIME’s AutoML workflow for model optimization.
This study initiated the process by loading the dataset through the CSV Reader node, which allowed us to efficiently handle and preprocess the data. Next, this work used the partitioning node to split the dataset into training and testing sets in an 80-20 ratio, ensuring a robust evaluation framework. The core of the KNIME experiment was the AutoML node, which encompasses a variety of ML models and automates the selection and hyperparameter tuning process. This node systematically evaluated multiple models and configurations to identify the best-performing model for the dataset. After extensive analysis, the AutoML node selected the Random Forest classifier as the optimal model, which is mentioned in Figure 10.
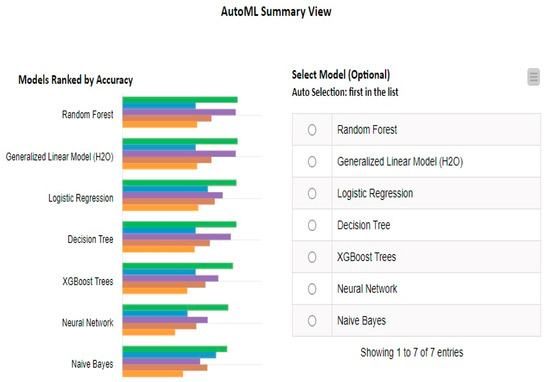
Figure 10.
AutoML’s summary view in KNIME, showing the best model.
It achieved an impressive accuracy of 83.89% on the test set. Finally, the Scorer node was employed to assess the accuracy of the model, providing a detailed performance evaluation and confirming the reliability of the results. The confusion matrix can be seen in Figure 11.

Figure 11.
Confusion matrix of the model generated by KNIME.
The model’s efficiency was evaluated by its ability to identify ASD using several metrics that were discussed in subsequent sections. Besides accuracy, the precision and recall score were also computed for assessing the performance of the model generated by KNIME. These metrics give a thorough picture of the classifier’s performance. With a precision of 83%, the model demonstrated a percentage of accurately detected positive cases out of all positive cases. With an 96% recall score, it appears that the model identified most true-positive cases.
In Figure 12, the ROC curve created by KNIME provides a visual picture of the model’s ability to distinguish between autistic and non-autistic classes. The ROC curve in Figure 4, Figure 5, Figure 6, Figure 7 and Figure 8 shows the classification model’s performance by displaying the True-Positive Rate (sensitivity) vs the False-Positive Rate (1-specificity) at various threshold values. The value 0.8 shown in the figure represents a specific threshold used to identify expected probabilities as positive or negative at that point on the curve. It is vital to understand that 0.8 is a classification threshold, and is also the Area Under the ROC Curve (AUC).
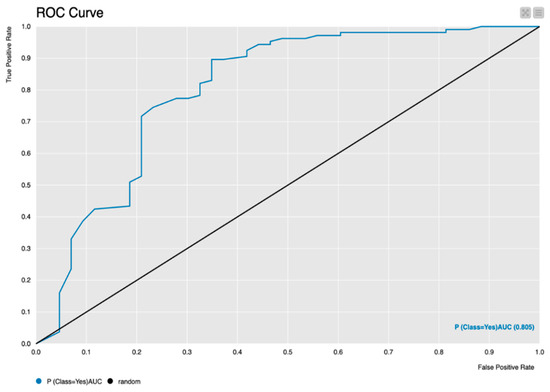
Figure 12.
ROC curve for model performance in KNIME.
The AUC is a single scalar value between 0 and 1 that summarizes the model’s overall performance, with values closer to 1 indicating stronger discriminatory ability. This graphical depiction improves the understanding of the model’s predictive capabilities and adds vital insights to the findings.
Feature Ranking Using KNIME
The KNIME Analytics Platform was used to implement the feature selection procedure, as shown in Figure 13. The workflow is designed to identify the most relevant features using the forward feature selection technique in KNIME. The workflow involves the following steps:
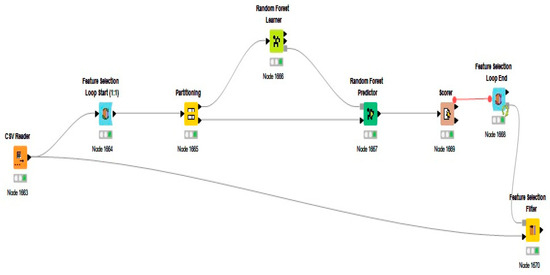
Figure 13.
Random Forest workflow in KNIME for identifying important features.
- CSV Reader: The dataset is initially loaded into the workflow using the CSV Reader node. This node reads the data from a CSV file, making it available for subsequent processing and analysis.
- Feature selection loop start (1:1): A feature selection loop is initiated with the given feature selection method. This node systematically iterates over different subsets of features, allowing the model to be trained and evaluated with varying feature combinations.
- Partitioning: Within each iteration of the feature selection loop, the dataset is partitioned into training and test sets using the partitioning node. This ensures that the model is trained on one subset of data and tested on another, facilitating an unbiased evaluation of its performance.
- Random Forest Learner: A Random Forest model is trained on the training set for each subset of features using the Random Forest Learner node. This node constructs the model based on the selected features, learning patterns, and relationships within the training data.
- Random Forest Predictor: The trained Random Forest model is then applied to the test set using the Random Forest Predictor node. This node generates predictions for the test instances based on the model built in the previous step.
- Scorer: The performance of the Random Forest model is evaluated using the Scorer node. This node compares the predicted labels with the actual labels in the test set, calculating various performance metrics to assess the model’s effectiveness for each subset of features.
- Feature Selection Loop End: The loop is concluded with the Feature Selection Loop End node. This node aggregates the scores from each iteration, providing a comprehensive evaluation of different feature subsets’ performance.
- Feature Selection Filter: Finally, the Feature Selection Filter node selects the best subset of features based on the aggregated performance scores. This node identifies the feature combination that yields the highest model performance, optimizing the feature set for the Random Forest classifier.
This KNIME workflow effectively discovers the most relevant features, improving the model’s predictive accuracy and stability.
The analysis revealed that the “Q-CHAT 10 score” was the most influential feature, consistent with the findings from the TPOT, which also identifies this attribute as an important key feature. Figure 14 illustrates the workflow and highlight the importance of various features.
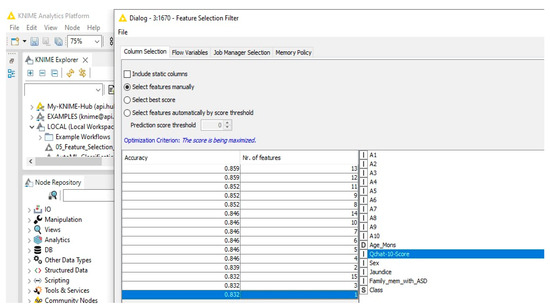
Figure 14.
Important features identified by KNIME model.
Using KNIME’s features, this work confirmed the efficacy of using AutoML tools to construct high-accuracy models, ensuring consistent and predictable performance for ASD detection. These findings add to the expanding body of evidence supporting the use of automated ML approaches in clinical settings, thereby improving early detection and intervention for ASD.
5. Discussion
In comparing Experiment 1 and Experiment 2, which utilized TPOT and KNIME, respectively, to automate the ML pipeline for ASD detection, several notable distinctions and similarities emerged. Both experiments aimed to optimize model performance and extract the best features set through the use of AutoML tools. Experiment 1, employing TPOT, showcased its evolutionary algorithm-based approach to automatically design and optimize ML pipelines and identify the best key features. By iteratively exploring the solution, TPOT identified a Random Forest classifier that achieved an 85.23% accuracy rate on the test set. Experiment 2, on the other hand, utilized KNIME, renowned for its versatility and user-friendliness. KNIME’s intuitive interface facilitated a seamless workflow, from data preprocessing to model selection and feature extraction. Similarly, Experiment 2 also identified a Random Forest classifier as the optimal model, attaining an accuracy rate of 83.89% using KNIME. Both experiments employed a dataset split of 80-20 for training and testing to ensure robust evaluation frameworks, but TPOT achieves better results compared to KNIME. The detailed results of the comparison of TPOT and KNIME is shown in Table 2.

Table 2.
Comparison of TPOT and KNIME for model optimization and feature analysis.
The feature signatures produced by TPOT and KNIME differ primarily due to their distinct approaches to feature selection and model optimization. TPOT employs genetic programming, an evolutionary method that iteratively refines machine learning pipelines by selecting, modifying, and recombining features based on performance. This enables TPOT to explore a broader range of feature interactions and model configurations, often resulting in better accuracy, as shown by its 85.23% performance in this experiment. KNIME, on the other hand, utilizes a rule-based, workflow-driven approach that systematically guides the entire model-building and feature selection process. KNIME’s structured workflows make it highly accessible and user-friendly, but this approach may constrain the breadth of feature exploration compared to TPOT’s more adaptive method. While KNIME is effective in identifying key features, its method tends to rely on predefined rules and stepwise optimization, which might not capture complex feature relationships as effectively as TPOT’s evolutionary search. These methodological differences in feature selection, model optimization, and cross-validation contribute to TPOT’s marginally higher accuracy. TPOT’s evolutionary approach allows it to discover novel feature interactions and optimal hyperparameter configurations, whereas KNIME provides a more structured, efficient workflow, but with less exploratory power.
6. Conclusions
Finally, this work highlights the use of AutoML in the field of ASD identification. In this study, TPOT demonstrated superior performance, achieving 85.23% accuracy for the Random Forest classifier model in ASD diagnosis as compared to 83.89% accuracy with KNIME. A crucial part of this research was a comparative analysis of feature selection methods, which revealed the critical importance of the “Q-CHAT 10 score” across both the TPOT and KNIME workflows. This demonstrates the importance of automated feature selection in improving the accuracy of ASD diagnostic models. By rigorously evaluating feature relevance, this study identified the main factors required for ASD diagnosis, allowing for a better understanding of the disorder’s diagnostic indicators. The findings emphasize the importance of using AutoML methods for the feature selection process and of accelerating the model-building process. Through this focus on feature selection, this research contributes to the progress of ASD diagnosis and underscores the transformative potential of AutoML in clinical practice.
Author Contributions
Conceptualization, K.S.; Methodology, R.T.A.; Software, R.T.A.; Validation, T.C.C.; Formal analysis, M.S.; Investigation, M.S. and T.C.C.; Data curation, M.S.; Writing—original draft, R.T.A. and K.S.; Writing—review & editing, K.S. and T.C.C.; Supervision, K.S. All authors have read and agreed to the published version of the manuscript.
Funding
This work was supported by Multimedia University Research Fellow under Grant MMUI/240021.
Institutional Review Board Statement
The study was conducted in accordance with the Declaration of Helsinki, and approved by the Ethical Review Committee of Bahria University.
Informed Consent Statement
Informed consent was obtained from all subjects involved in the study.
Data Availability Statement
The data presented in this study are available on request from the corresponding author.
Conflicts of Interest
The authors declare no conflict of interest.
References
- Jomthanachai, S.; Wong, W.P.; Khaw, K.W. An application of machine learning regression to feature selection: A study of logistics performance and economic attribute. Neural Comput. Appl. 2022, 34, 15781–15805. [Google Scholar] [CrossRef]
- Abdallah, T.A.; de La Iglesia, B. Survey on Feature Selection. arXiv 2015, arXiv:1510.02892. [Google Scholar]
- Cai, J.; Luo, J.; Wang, S.; Yang, S. Feature selection in machine learning: A new perspective. Neurocomputing 2018, 300, 70–79. [Google Scholar] [CrossRef]
- Roffo, G. Feature selection library (MATLAB toolbox). arXiv 2016, arXiv:1607.01327. [Google Scholar]
- Jacob, S.G.; Sulaiman, M.M.B.A.; Bennet, B. Feature signature discovery for autism detection: An automated machine learning based feature ranking framework. Comput. Intell. Neurosci. 2023, 2023, 6330002. [Google Scholar] [CrossRef] [PubMed]
- Sharma, A.A.; Dey, S. A comparative study of feature selection and machine learning techniques for sentiment analysis. In Proceedings of the 2012 ACM Research in Applied Computation Symposium, San Antonio, TX, USA, 23–26 October 2012; pp. 1–7. [Google Scholar]
- Aksu, D.D.; Üstebay, S.; Aydin, M.A.; Atmaca, T. Intrusion detection with comparative analysis of supervised learning techniques and fisher score feature selection algorithm. In Computer and Information Sciences, Proceedings of the 32nd International Symposium, ISCIS 2018, the 24th IFIP World Computer Congress, WCC 2018, Poznan, Poland, 20–21 September 2018; Proceedings 32; Springer International Publishing: Berlin/Heidelberg, Germany, 2018; pp. 141–149. [Google Scholar]
- Kuzhippallil, M.A.; Joseph, C.; Kannan, A. Comparative analysis of machine learning techniques for indian liver disease patients. In Proceedings of the 2020 6th International Conference on Advanced Computing and Communication Systems (ICACCS), Coimbatore, India, 6–7 March 2020; IEEE: Piscataway, NJ, USA, 2020; pp. 778–782. [Google Scholar]
- Khagi, B.; Kwon, G.R.; Lama, R. Comparative analysis of Alzheimer’s disease classification by CDR level using CNN, feature selection, and machine-learning techniques. Int. J. Imaging Syst. Technol. 2019, 29, 297–310. [Google Scholar] [CrossRef]
- Mafarja, M.; Thaher, T.; Al-Betar, M.A.; Too, J.; Awadallah, M.A.; Abu Doush, I.; Turabieh, H. Classification framework for faulty-software using enhanced exploratory whale optimizer-based feature selection scheme and random forest ensemble learning. Appl. Intell. 2023, 53, 18715–18757. [Google Scholar] [CrossRef] [PubMed]
- Li, K.Y.; Sampaio de Lima, R.; Burnside, N.G.; Vahtmäe, E.; Kutser, T.; Sepp, K.; Sepp, K. Toward automated machine learning-based hyperspectral image analysis in crop yield and biomass estimation. Remote Sens. 2022, 14, 1114. [Google Scholar] [CrossRef]
- Adla, Y.A.A.; Raydan, D.G.; Charaf, M.Z.J.; Saad, R.A.; Nasreddine, J.; Diab, M.O. Automated detection of polycystic ovary syndrome using machine learning techniques. In Proceedings of the 2021 Sixth International Conference on Advances in Biomedical Engineering (ICABME), Werdanyeh, Lebanon, 7–9 October 2021; IEEE: Piscataway, NJ, USA, 2021; pp. 208–212. [Google Scholar]
- Raj, S.; Masood, S. Analysis and detection of autism spectrum disorder using machine learning techniques. Procedia Comput. Sci. 2020, 167, 994–1004. [Google Scholar] [CrossRef]
- Romero-García, R.; Martínez-Tomás, R.; Pozo, P.; de la Paz, F.; Sarriá, E. Q-CHAT-NAO: A robotic approach to autism screening in toddlers. J. Biomed. Inform. 2021, 118, 103797. [Google Scholar] [CrossRef]
- Thabtah, F. An accessible and efficient autism screening method for behavioural data and predictive analyses. Health Inform. J. 2019, 25, 1739–1755. [Google Scholar] [CrossRef]
- Allison, C.; Auyeung, B.; Baron-Cohen, S. Toward brief “red flags” for autism screening: The short autism spectrum quotient and the short quantitative checklist in 1,000 cases and 3,000 controls. J. Am. Acad. Child Adolesc. Psychiatry 2012, 51, 202–212. [Google Scholar] [CrossRef] [PubMed]
- Allison, C.; Baron-Cohen, S.; Wheelwright, S.; Charman, T.; Richler, J.; Pasco, G.; Brayne, C. The Q-CHAT (Quantitative CHecklist for Autism in Toddlers): A normally distributed quantitative measure of autistic traits at 18–24 months of age: Preliminary report. J. Autism Dev. Disord. 2008, 38, 1414–1425. [Google Scholar] [CrossRef]
- Ruta, L.; Chiarotti, F.; Arduino, G.M.; Apicella, F.; Leonardi, E.; Maggio, R.; Carrozza, C.; Chericoni, N.; Costanzo, V.; Turco, N.; et al. Validation of the quantitative checklist for autism in toddlers in an Italian clinical sample of young children with autism and other developmental disorders. Front. Psychiatry 2019, 10, 488. [Google Scholar] [CrossRef] [PubMed]
- Eldridge, J.; Lane, A.E.; Belkin, M.; Dennis, S. Robust features for the automatic identification of autism spectrum disorder in children. J. Neurodev. Disord. 2014, 6, 12. [Google Scholar] [CrossRef] [PubMed]
- Stevanović, D. Quantitative Checklist for Autism in Toddlers (Q-CHAT): A psychometric study with Serbian Toddlers. Res. Autism Spectr. Disord. 2021, 83, 101760. [Google Scholar] [CrossRef]
- Islam, S.; Akter, T.; Zakir, S.; Sabreen, S.; Hossain, M.I. Autism spectrum disorder detection in toddlers for early diagnosis using machine learning. In Proceedings of the 2020 IEEE Asia-Pacific Conference on Computer Science and Data Engineering (CSDE), Gold Coast, Australia, 16–18 December 2020; IEEE: Piscataway, NJ, USA, 2020; pp. 1–6. [Google Scholar]
- Marlow, M.; Servili, C.; Tomlinson, M. A review of screening tools for the identification of autism spectrum disorders and developmental delay in infants and young children: Recommendations for use in low-and middle-income countries. Autism Res. 2019, 12, 176–199. [Google Scholar] [CrossRef]
- Farooqi, N.; Bukhari, F.; Iqbal, W. Predictive analysis of autism spectrum disorder (ASD) using machine learning. In Proceedings of the 2021 International Conference on Frontiers of Information Technology (FIT), Islamabad, Pakistan, 13–14 December 2021; IEEE: Piscataway, NJ, USA, 2021; pp. 305–310. [Google Scholar]
- Cerrada, M.; Trujillo, L.; Hernández, D.E.; Correa Zevallos, H.A.; Macancela, J.C.; Cabrera, D.; Vinicio Sánchez, R. AutoML for feature selection and model tuning applied to fault severity diagnosis in spur gearboxes. Math. Comput. Appl. 2022, 27, 6. [Google Scholar] [CrossRef]
- Baron-Cohen, S.; Allen, J.; Gillberg, C. Can autism be detected at 18 months?: The needle, the haystack, and the CHAT. Br. J. Psychiatry 1992, 161, 839–843. [Google Scholar] [CrossRef]
- Available online: https://epistasislab.github.io/tpot/ (accessed on 1 January 2020).
- Olson, R.S.; Moore, J.H. TPOT: A tree-based pipeline optimization tool for automating machine learning. In Proceedings of the Workshop on Automatic Machine Learning, New York, NY, USA, 24 June 2016; pp. 66–74. [Google Scholar]
Disclaimer/Publisher’s Note: The statements, opinions and data contained in all publications are solely those of the individual author(s) and contributor(s) and not of MDPI and/or the editor(s). MDPI and/or the editor(s) disclaim responsibility for any injury to people or property resulting from any ideas, methods, instructions or products referred to in the content. |
© 2024 by the authors. Licensee MDPI, Basel, Switzerland. This article is an open access article distributed under the terms and conditions of the Creative Commons Attribution (CC BY) license (https://creativecommons.org/licenses/by/4.0/).