Article

Graph Neural Networks: A Bibliometric Mapping of the Research Landscape and Applications

by
Annielle Mendes Brito da Silva
1,2,†,
Natiele Carla da Silva Ferreira
1,
Luiza Amara Maciel Braga
1,†,
Fabio Batista Mota
1,
Victor Maricato
3 and
Luiz Anastacio Alves
1,*
1
Laboratory of Cellular Communication, Oswaldo Cruz Institute, Oswaldo Cruz Foundation, Rio de Janeiro 21040-360, Brazil
2
Laboratory of Adsorbents for Chemical Analysis, Environmental Protection, and Biomedicine, Department of Chemistry, Pontifical Catholic University of Rio de Janeiro, Rio de Janeiro 22451-900, Brazil
3
Department of Learning, Informatics, Management and Ethics, Karolinska Institutet, 17177 Stockholm, Sweden
*
Author to whom correspondence should be addressed.
These authors contributed equally to this work.
Information 2024, 15(10), 626; https://doi.org/10.3390/info15100626
Submission received: 2 August 2024 / Revised: 26 September 2024 / Accepted: 27 September 2024 / Published: 11 October 2024
(This article belongs to the Special Issue Applications of Machine Learning and Convolutional Neural Networks)

Abstract

:
Graph neural networks (GNNs) are deep learning algorithms that process graph-structured data and are suitable for applications such as social networks, physical models, financial markets, and molecular predictions. Bibliometrics, a tool for tracking research evolution, identifying milestones, and assessing current research, can help identify emerging trends. This study aims to map GNN applications, research directions, and key contributors. An analysis of 40,741 GNN-related publications from the Web Science Core Collection reveals a rising trend in GNN publications, especially since 2018. Computer Science, Engineering, and Telecommunications play significant roles in GNN research, with a focus on deep learning, graph convolutional networks, neural networks, convolutional neural networks, and machine learning. China and the USA combined account for 76.4% of the publications. Chinese universities concentrate on graph convolutional networks, deep learning, feature extraction, and task analysis, whereas American universities focus on machine learning and deep learning. The study also highlights the importance of Chemistry, Physics, Mathematics, Imaging Science & Photographic Technology, and Computer Science in their respective knowledge communities. In conclusion, the bibliometric analysis provides an overview of GNN research, showing growing interest and applications across various disciplines, and highlighting the potential of GNNs in solving complex problems and the need for continued research and collaboration.

1. Introduction

A neuron is a biological cell responsible for signal processing in the nervous system. Upon receiving this information, it is activated and transmits the signal to other neurons through synapses until the physiological effect is complete [1]. Artificial neural networks (ANNs) are inspired by biological neural networks and consist of computational techniques that use mathematical modeling to acquire knowledge through experience [2]. While mammalian biological neural networks have billions of neurons, ANNs can have hundreds or thousands of processing units [3]. Similar to the biological networks, the most important property of ANNs is the ability to learn and improve their performance through an iterative process of adjustments applied to the tasks performed. Learning occurs when a threshold is met, allowing for a generalized solution to a category of problems [4].
ANNs are highly versatile and can be applied across various fields, including Engineering, Medicine, Science, and Economics [5]. Some typical applications of ANNs include computer vision tasks such as object detection and image editing, face alignment or recognition, various detection tasks such as medical diagnosis, financial irregularity, security, pattern recognition, learning models, and data generation, among others [6,7].
GNN is a deep learning algorithm that operates on data represented as graphs. It can be used in various systems and interactions of any entity that can naturally have a graphic representation, such as social networks, physical models, financial markets, and molecular predictions [8]. Notably, by using graphical resources, GNNs can make more informative and reliable predictions as they leverage the node itself and the nearby nodes and how they relate to the target [4]. Owing to its flexibility, the GNN has become the most widely applied way to model data structured in graphs, replacing the already available tools such as graph kernels and random-walk methods [4].
Despite having greater applicability in exact sciences, such as Computer Sciences and Engineering, the GNN has been applied to perform management, modeling, and analysis in several activities and research fields [9]. The literature highlights the applicability of the GNN in various fields, including Economics and Social Sciences, where it has been used for financial market analysis and forecasting [10] and consumer product preferences [11]. In the Biological Sciences, GNN has been applied in drug discovery through virtual screening [12] and the identification of proteins that can act as new therapeutic targets [13,14,15]. The GNN also plays a significant role in Medicine, improving the diagnosis and genetic tracking of specific diseases [16,17], and is used for managing products crucial to public health and the environment [18].
Scientific knowledge has developed gradually. Understanding the growth of a particular field over time can highlight emerging areas, which may become potential research opportunities in the future [19]. Bibliometrics and network analysis are complementary techniques that are often used together to generate a more comprehensive landscape of the research topic. As a quantitative approach, it employs statistical and mathematical methods to analyze patterns, trends, and relationships within various scientific publications. By examining metadata such as titles, abstracts, keywords, authors, research institutions, and citations, bibliometrics help to uncover valuable insights into the growth, impact, and dynamics of a specific field of knowledge [20,21,22,23].
One of the primary aspects of bibliometrics is its ability to track the evolution of a research field. This allows researchers to follow the development of a field over time, identify its key milestones, and assess the current state of the research. Understanding the historical context and trajectory of a discipline can inform future research directions and facilitate the identification of emerging trends [24]. Furthermore, bibliometrics can identify influential publications and authors by analyzing citation patterns. This analysis provides insights into the most significant contributions to a field, highlighting the foundational works and the researchers driving the discipline forward. Identifying these influential works and individuals can help researchers position their work within the literature and build upon established knowledge [25].
Bibliometrics can also assess the impact of research. By evaluating citation counts, researchers can gauge the influence of specific publications on the broader scientific community [26]. This information can help researchers, institutions, and funding agencies make informed decisions about allocating resources and prioritizing research topics, especially those that have received less attention or have the potential for significant growth.
In this context, the aim of the present study was to carry out bibliometric and network analyses to identify emerging trends, key milestones, and the growth of GNN applications in various research fields, mapping the most influential publications and authors. This study is important for following the historical development of these technologies and for forecasting potential future advancements and applications. Notably, this study is the only one that follows the historical evolution of the GNN, encompassing data from almost 80 years of research (1945–2024).

2. Materials and Methods

Bibliometrics and Network Analysis

We assessed the metadata of GNN-related scientific literature indexed in Web of Science (WoS) via bibliometrics and network analysis techniques. Although other databases, such as Scopus and PubMed are also valuable for bibliometric and network analysis, we selected WoS for this study because it offers extensive coverage of publications relevant to our research areas, includes journals with impact factors, provides high-quality metadata, and supports a wide range of analytical fields [27,28,29]. The records analyzed were identified by applying the following search strategy to the WoS advanced search mode:
TS = (“graph neural network*” OR “graph convolutional network*” OR “graph autoencoder*” OR “geometric deep learning” OR (“graph representation learning” AND (deep OR neural OR convolution))) AND FPY = (1945–2024) AND (Article OR Proceeding Paper OR Review Article (Document Types)).
We used the tag Topic (TS) to search the titles, abstracts, authors’ keywords, and keywords plus (keywords assigned by WoS from cited references) of scientific publications indexed in WoS. The search strategy used the keywords “graph neural network”, “graph convolutional network”, “graph autoencoder”, and “geometric deep learning” combined with the Boolean operator OR. Additionally, we searched for records where “graph representation learning” appeared alongside the words “deep”, “neural”, or “convolution”, following the search query of a previous study [30]. The search period was defined in the FPY field, which retrieves documents by their actual year of publication, excluding “early access” documents. We included all documents published from the start of the WoS database (1945) to the date of the search (19 August 2024). This first search returned 40,934 records. We filtered the data to include only three types of documents: proceedings papers (literature published on seminars, conferences, etc.), original research, and review articles, returning 40,762 records. These types of documents were selected because of the completeness of their metadata. For simplicity, from now on, they will be referred only to as articles.
The search was performed on 19 August 2024. All 40,762 identified records were exported from WoS in plain text format and then imported into the data/text mining software VantagePoint 11.0, where we performed data treatment, bibliometric analysis, and created co-occurrence matrices for network analysis. Initially, duplicate records were identified and removed via the unique article identifier field, resulting in the removal of 21 duplicates. The final dataset consisted of 40,741 unique records (Figure 1). Among the 40,741 records, 64.76% were original research articles, 33.76% were proceeding papers, and 1.48% were review articles. We analyzed data on publication years, keywords (authors), author affiliations (organization only), countries, research areas (a WoS subject classification that covers five broad categories: Arts & Humanities; Life Sciences & Biomedicine; Physical Sciences; Social Sciences, and Technology), and the top 10 most cited articles. Since keywords and author affiliation (organization only) data are assigned to articles by the authors, they are not standardized and therefore require treatment (cleaning and standardization). Both data were cleaned and standardized using the fuzzy matching algorithms ‘General.fuz’ and ‘Organization Names.fuz’, respectively, combined with manual cleaning.
The co-occurrence matrices were subsequently exported from VantagePoint in Excel and imported into the network analysis software Gephi 0.9.2 to create and analyze the networks via network metrics. The networks’ layout and spatialization were given by the OpenOrd algorithm, which was developed for undirected clustered networks [31,32,33]. The algorithm uses the weights and patterns of nodes’ connections to spatially approximate nodes to reflect the existence of communities within the network [32,33]. We used the default parameters for all networks (edge cut = 0.8; 7 threads; 750 iterations).
To highlight the complementary and collaborative relationships represented in the networks, we chose to analyze the networks while assuming the existence of communities. The network nodes were grouped and colored based on the communities defined by the modularity of the networks. Modularity is a measure of structure used to identify network communities [34]. Gephi uses the Louvain algorithm for community modularization [35]. This algorithm defines groups on the basis of common features. These features can be the density and similarity of their connections, or their lack thereof [35,36]. Nodes that share many connections are expected to be in the same community. However, a community can group dispersed nodes in the network, where the common feature is that they do not have the same number and variety of connections as nodes in other communities. We used the default resolution (1.0) with randomization and edge weights to detect the communities.
The nodes’ size was set by their weighted degree. The nodes’ weighted degree is the sum of the nodes’ connections, weighted by the sum of the co-occurrences between the nodes. The weighted degree considers the number of connections and the intensity of their occurrence [37]. The edge size is defined by the number of co-occurrences between the nodes, whereas their color is a mixture of the two nodes’ colors.
We also used degree and eigenvector centrality metrics to identify the most important nodes. The node’s degree is its number of connections (edges) [38]. For example, a node with a degree of five is connected to five other nodes. A higher degree means the node is interconnected and spreads information unmediated to more nodes [37]. Eigenvector centrality quantifies the relevance of a node based on the number of its connections to other central nodes [38,39,40]. In summary, weighted degree was used to measure the strength of a node’s connections, reflecting the intensity of collaborations, while eigenvector centrality identified influential nodes connected to other well-connected nodes, highlighting key institutions or countries in GNN research.
All network metrics are in the Supplemental Material (Supplementary Tables S1–S4). Frequency graphs were generated with the R package ‘ggplot2’ version 3.5.1 and the GraphPad Prism version 8.0.0 software (Figure 1).

3. Results

3.1. Annual Research Production

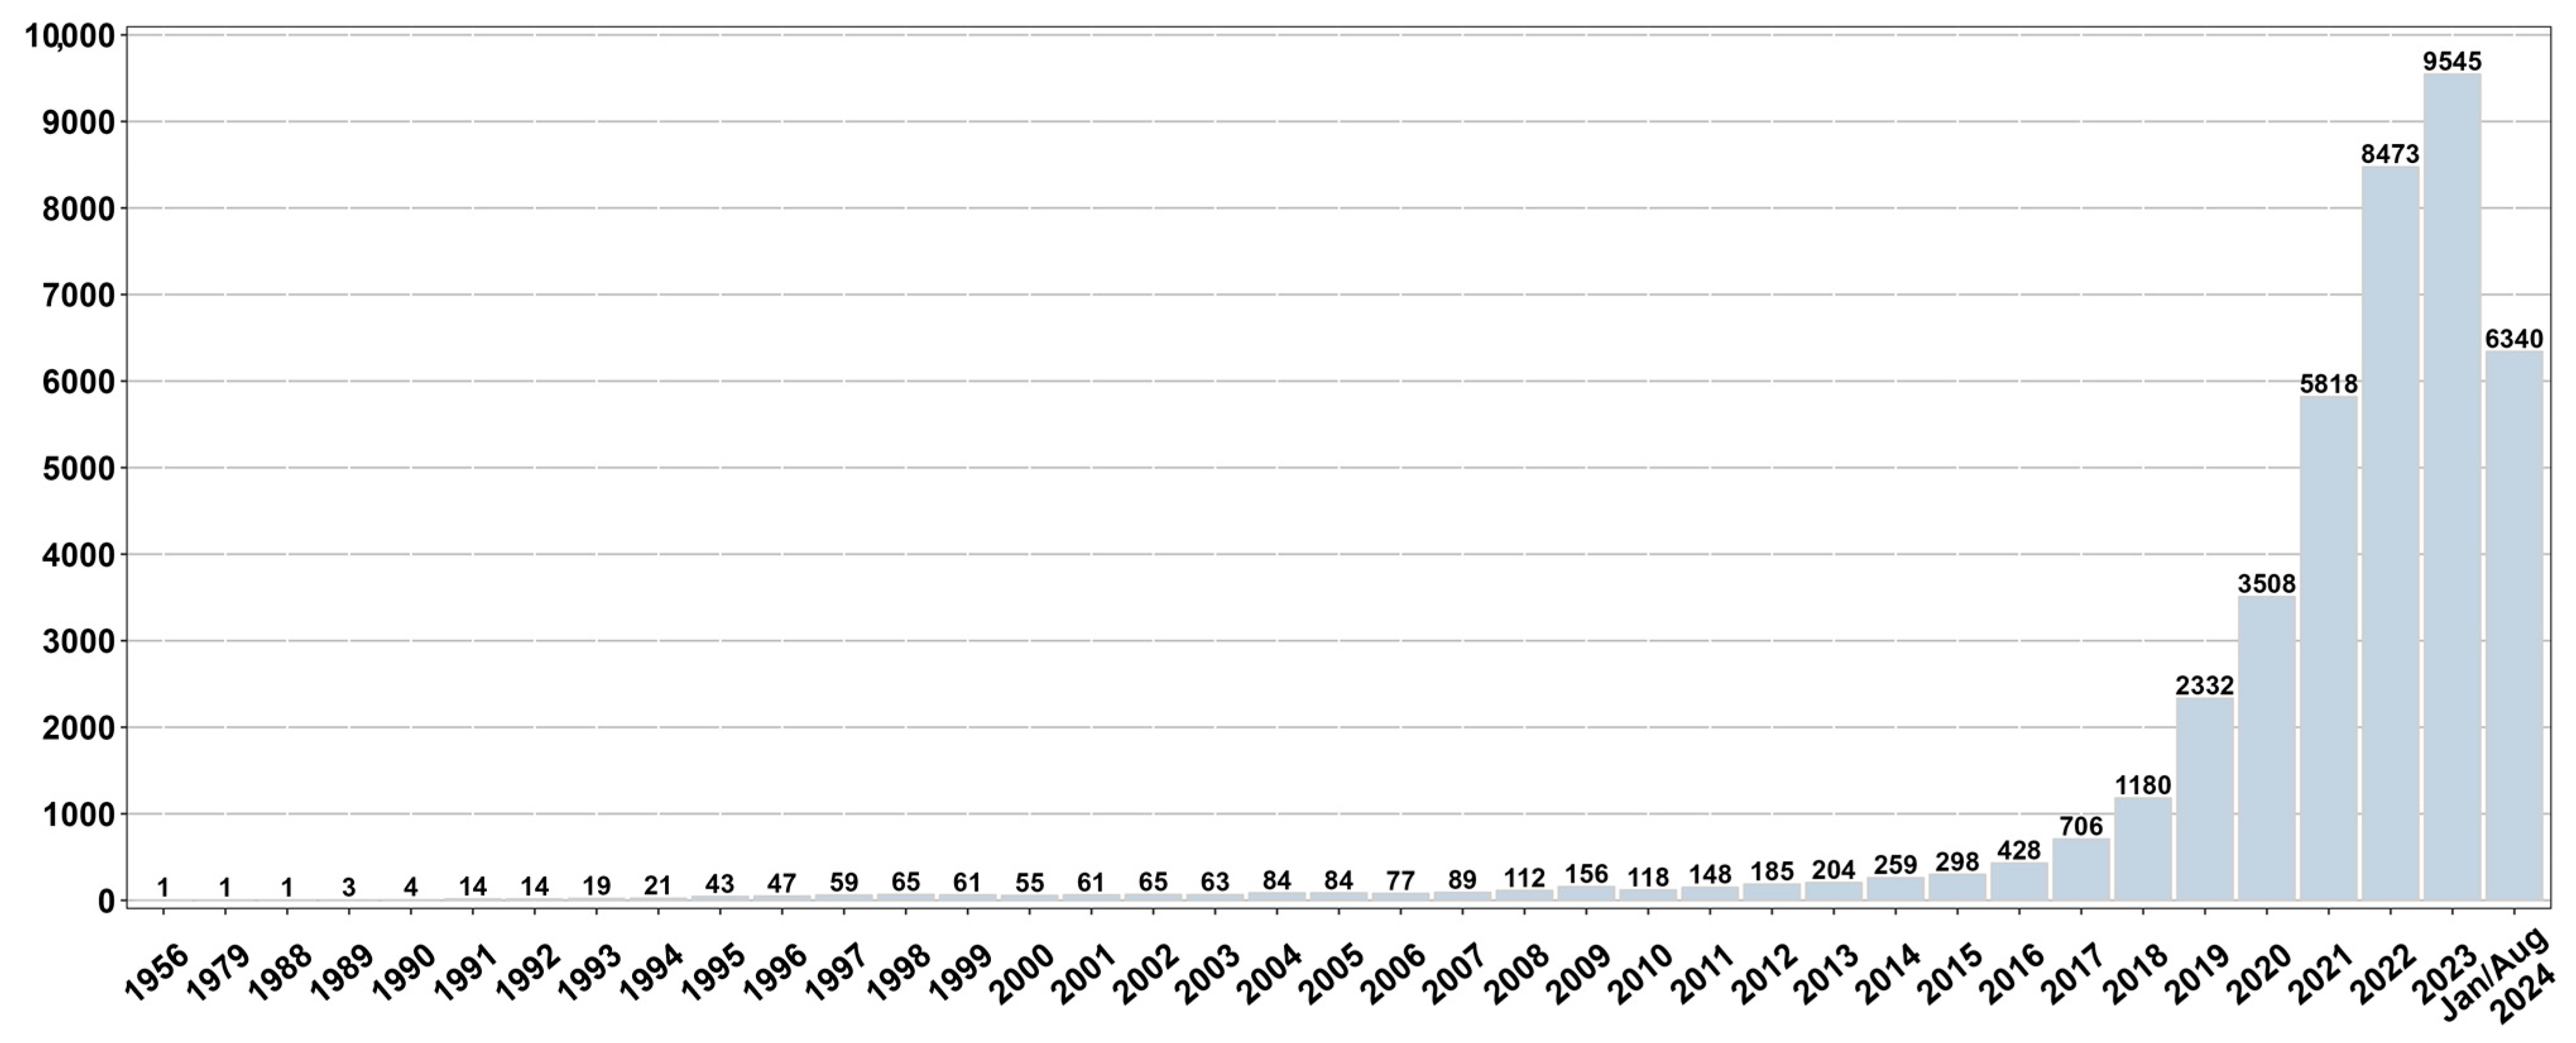
First, we analyzed the distribution of publications in the literature on GNNs over the years. As shown in Figure 2, the number of publications increased over time, with a significant rise starting in 2018 and nearly doubling each year. The Compound Annual Growth Rate (CAGR) for the entire period from 1956–2024 was 13.74%. When considering only the period from 2018–2024, the CAGR increased to 32.34%. Since the data for the year were collected in August 2024, the number of publications for that year only considers the data between January and August 19th. Excluding 2024, the CAGR for the full period (1956–2023) was 14.66%. From 2018 onward, the CAGR was 51.91% (2018–2023). A temporal analysis of keywords, research areas, and countries linked to GNN-related publications is available in the Supplementary Materials (Figures S1–S3).

3.2. Research Areas

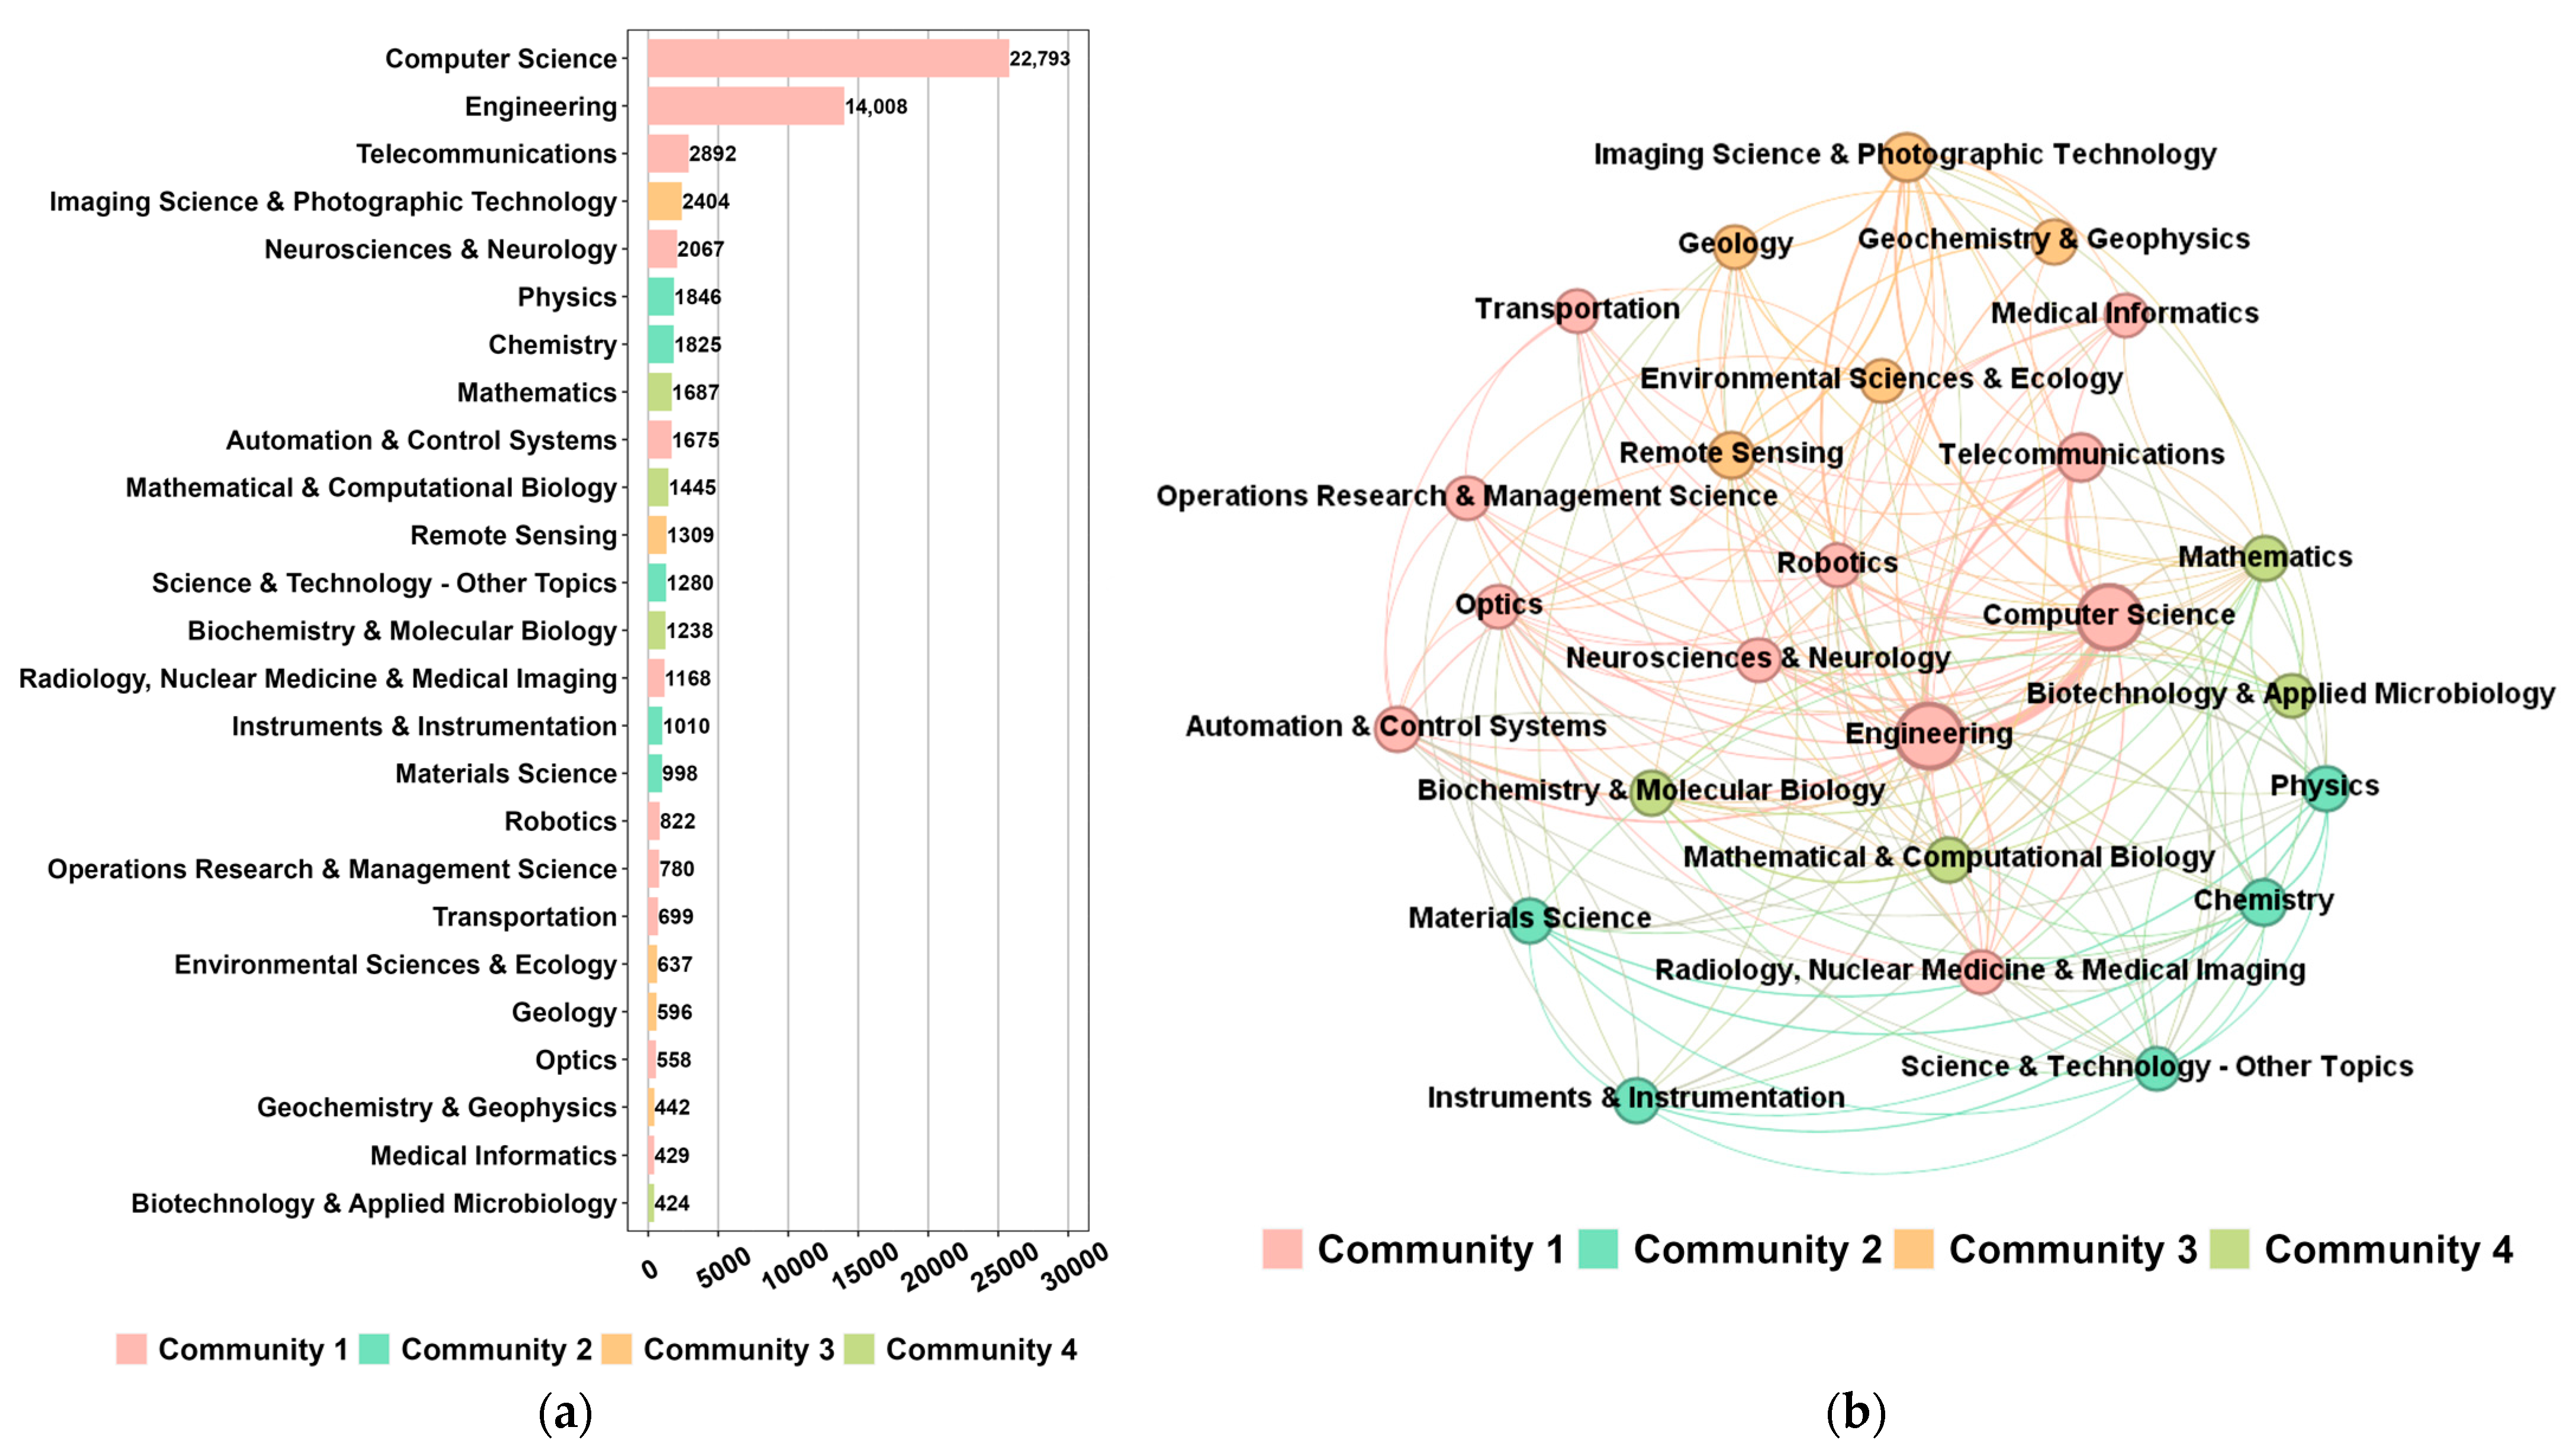
We evaluated the research areas and identified the top 25 with the highest number of publications. As demonstrated in Figure 3a, Computer Science appeared in the first position of the ranking, being responsible for approximately 63.31% of the total publications, followed by Engineering (34.38%), Telecommunications (7.10%), and Imaging Science & Photographic Technology (5.90%). Papers related to applying GNN in Neurosciences & Neurology represent 5.07% of the total publications. In contrast, in Chemistry, Physics, Mathematics, and Biochemistry, it varies between 4.53% and 3.04%.
The network analysis of research areas is shown in Figure 3b. Nodes represent the research areas, and the edges indicate their co-occurrence among publications, highlighting the presence of four communities. These were identified through the modularity property of the network. Community 1 grouped the eleven research areas with the highest frequencies and the highest co-occurrences in the network. Although Computer Science is the research area with the highest frequency, it is only the second most central node in the network. Engineering is the most central node. It has the highest eigenvector centrality (1.0), degree (24), and weighted degree (38,510), establishing strong connections with the areas of Computer Science (8002 shared records), Telecommunications (2030 shared records), and Imaging Science & Photography technology (1220 shared records). Community 2 combines two research areas with high co-occurrence, Chemistry, and Physics. They share 604 records while sharing up to 327 with Computer Science. Community 3 includes five research areas, of which Imaging Science & Photographic Technology and Remote Sensing are the most central nodes, according to the degree (17; 15), weighted degree (9694; 5818), and eigenvector centrality (0.770; 0.690). Community 4 includes the remaining four research areas, with Mathematics being the most central in terms of degree (22) and eigenvector centrality (0.949). However, when the weighted degree is considered, Mathematical & Computational Biology emerges as the most central approach (4864).

3.3. Countries and Institutions

We identified the key institutions driving knowledge production on GNNs based on author affiliations. Although the pioneers of GNN are American universities [41], we can observe that China is the predominant country in total publications (55.15%), followed by the USA (21.26%). The United Kingdom (UK), Australia, Germany, and Canada have total publications of 17.18%, as demonstrated in Figure 4a. Figure 4b shows the collaborations between the countries with the highest number of GNN publications. Community 1 includes the countries with the most publications: China and the USA. They are also the most central nodes in the network and within Community 1. The two countries have the highest weighted degree (13,598; 9990), but they share the same degree (24) and eigenvector centrality (1.0) with the other fourteen countries in the network, including Australia, Canada, and Japan. Community 1 also includes other Asian countries, in addition to Canada and Australia. Community 2 includes mainly European countries along with Iran, Brazil, and Russia. In Community 2, there are eight countries with a degree of 24 and an eigenvector centrality of 1.0, including the UK, Germany, and Italy. The UK has the highest weighted degree (4350). The largest number of collaborations in the network are from Community 1, first between China and the USA (2380 shared records), second, between China and Australia (1008 shared records), and third, between China and Canada (467 shared records). In Community 2, the collaborations between the UK and Germany (147 shared records) stand out. The most important collaboration between the two communities is between China and the UK (739 shared records).
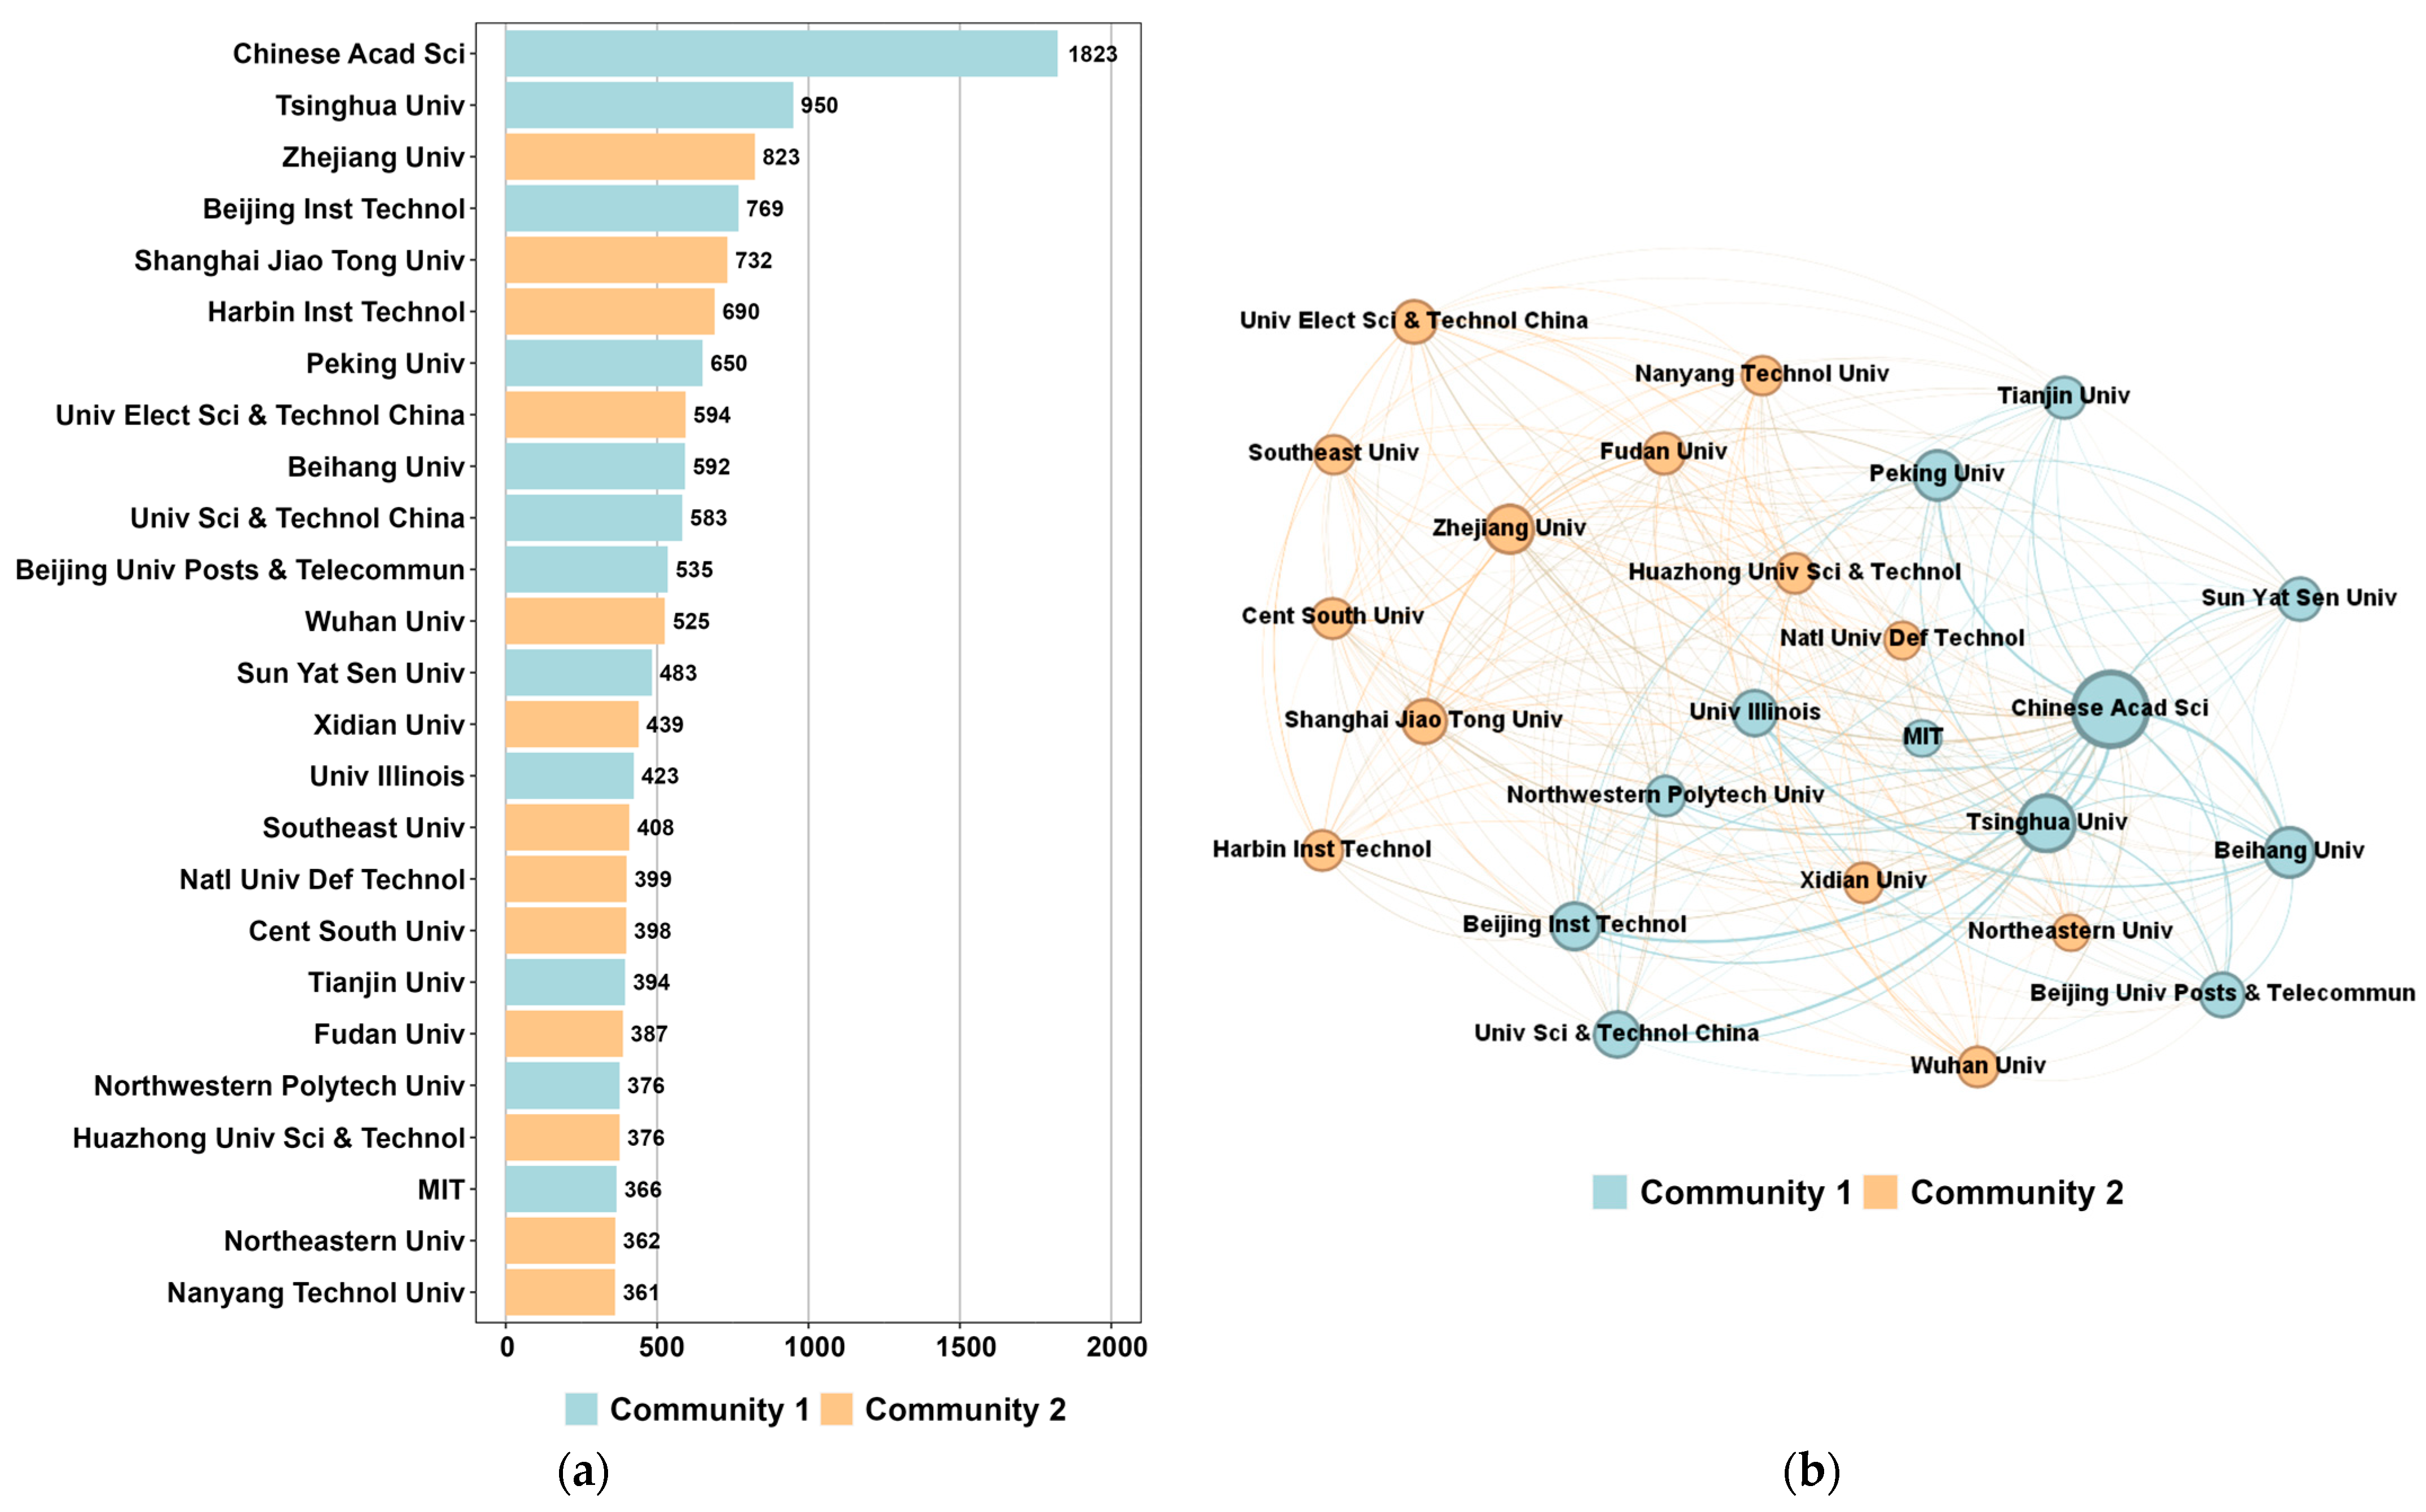
We also identified the main research centers responsible for publications on GNNs. Figure 5a shows the 25 main organizations publishing research related to the GNN. The most productive Chinese institutions are the Chinese Academy of Sciences (4.47% of total publications), Tsinghua University (2.33%), and Zhejiang University (2.02%). Two American research centers also appear in this ranking: the University of Illinois (15th position), and the Massachusetts Institute of Technology (MIT, 23rd position), accounting for 1.04% and 0.90% of the GNN publications in the literature, respectively.
The Chinese Academy of Sciences has the highest weighted degree in the network (1426). Considering the degree and eigenvector centrality, network centrality is divided between the Chinese Academy of Sciences and eight other organizations, three from Community 1 (Tsinghua University, Peking University, and University of Illinois) and five from Community 2 (Zhejiang University, Shanghai Jiao Tong University, University of Electronic Science and Technology of China, Wuhan University, and Xidian University). The largest collaborations in Community 1 occur between the Chinese Academy of Sciences and Tsinghua University, sharing 72 publications. For Community 2, Zhejiang University and Central South University are the ones who collaborated the most, with 24 publications (Figure 5b).

3.4. Keywords

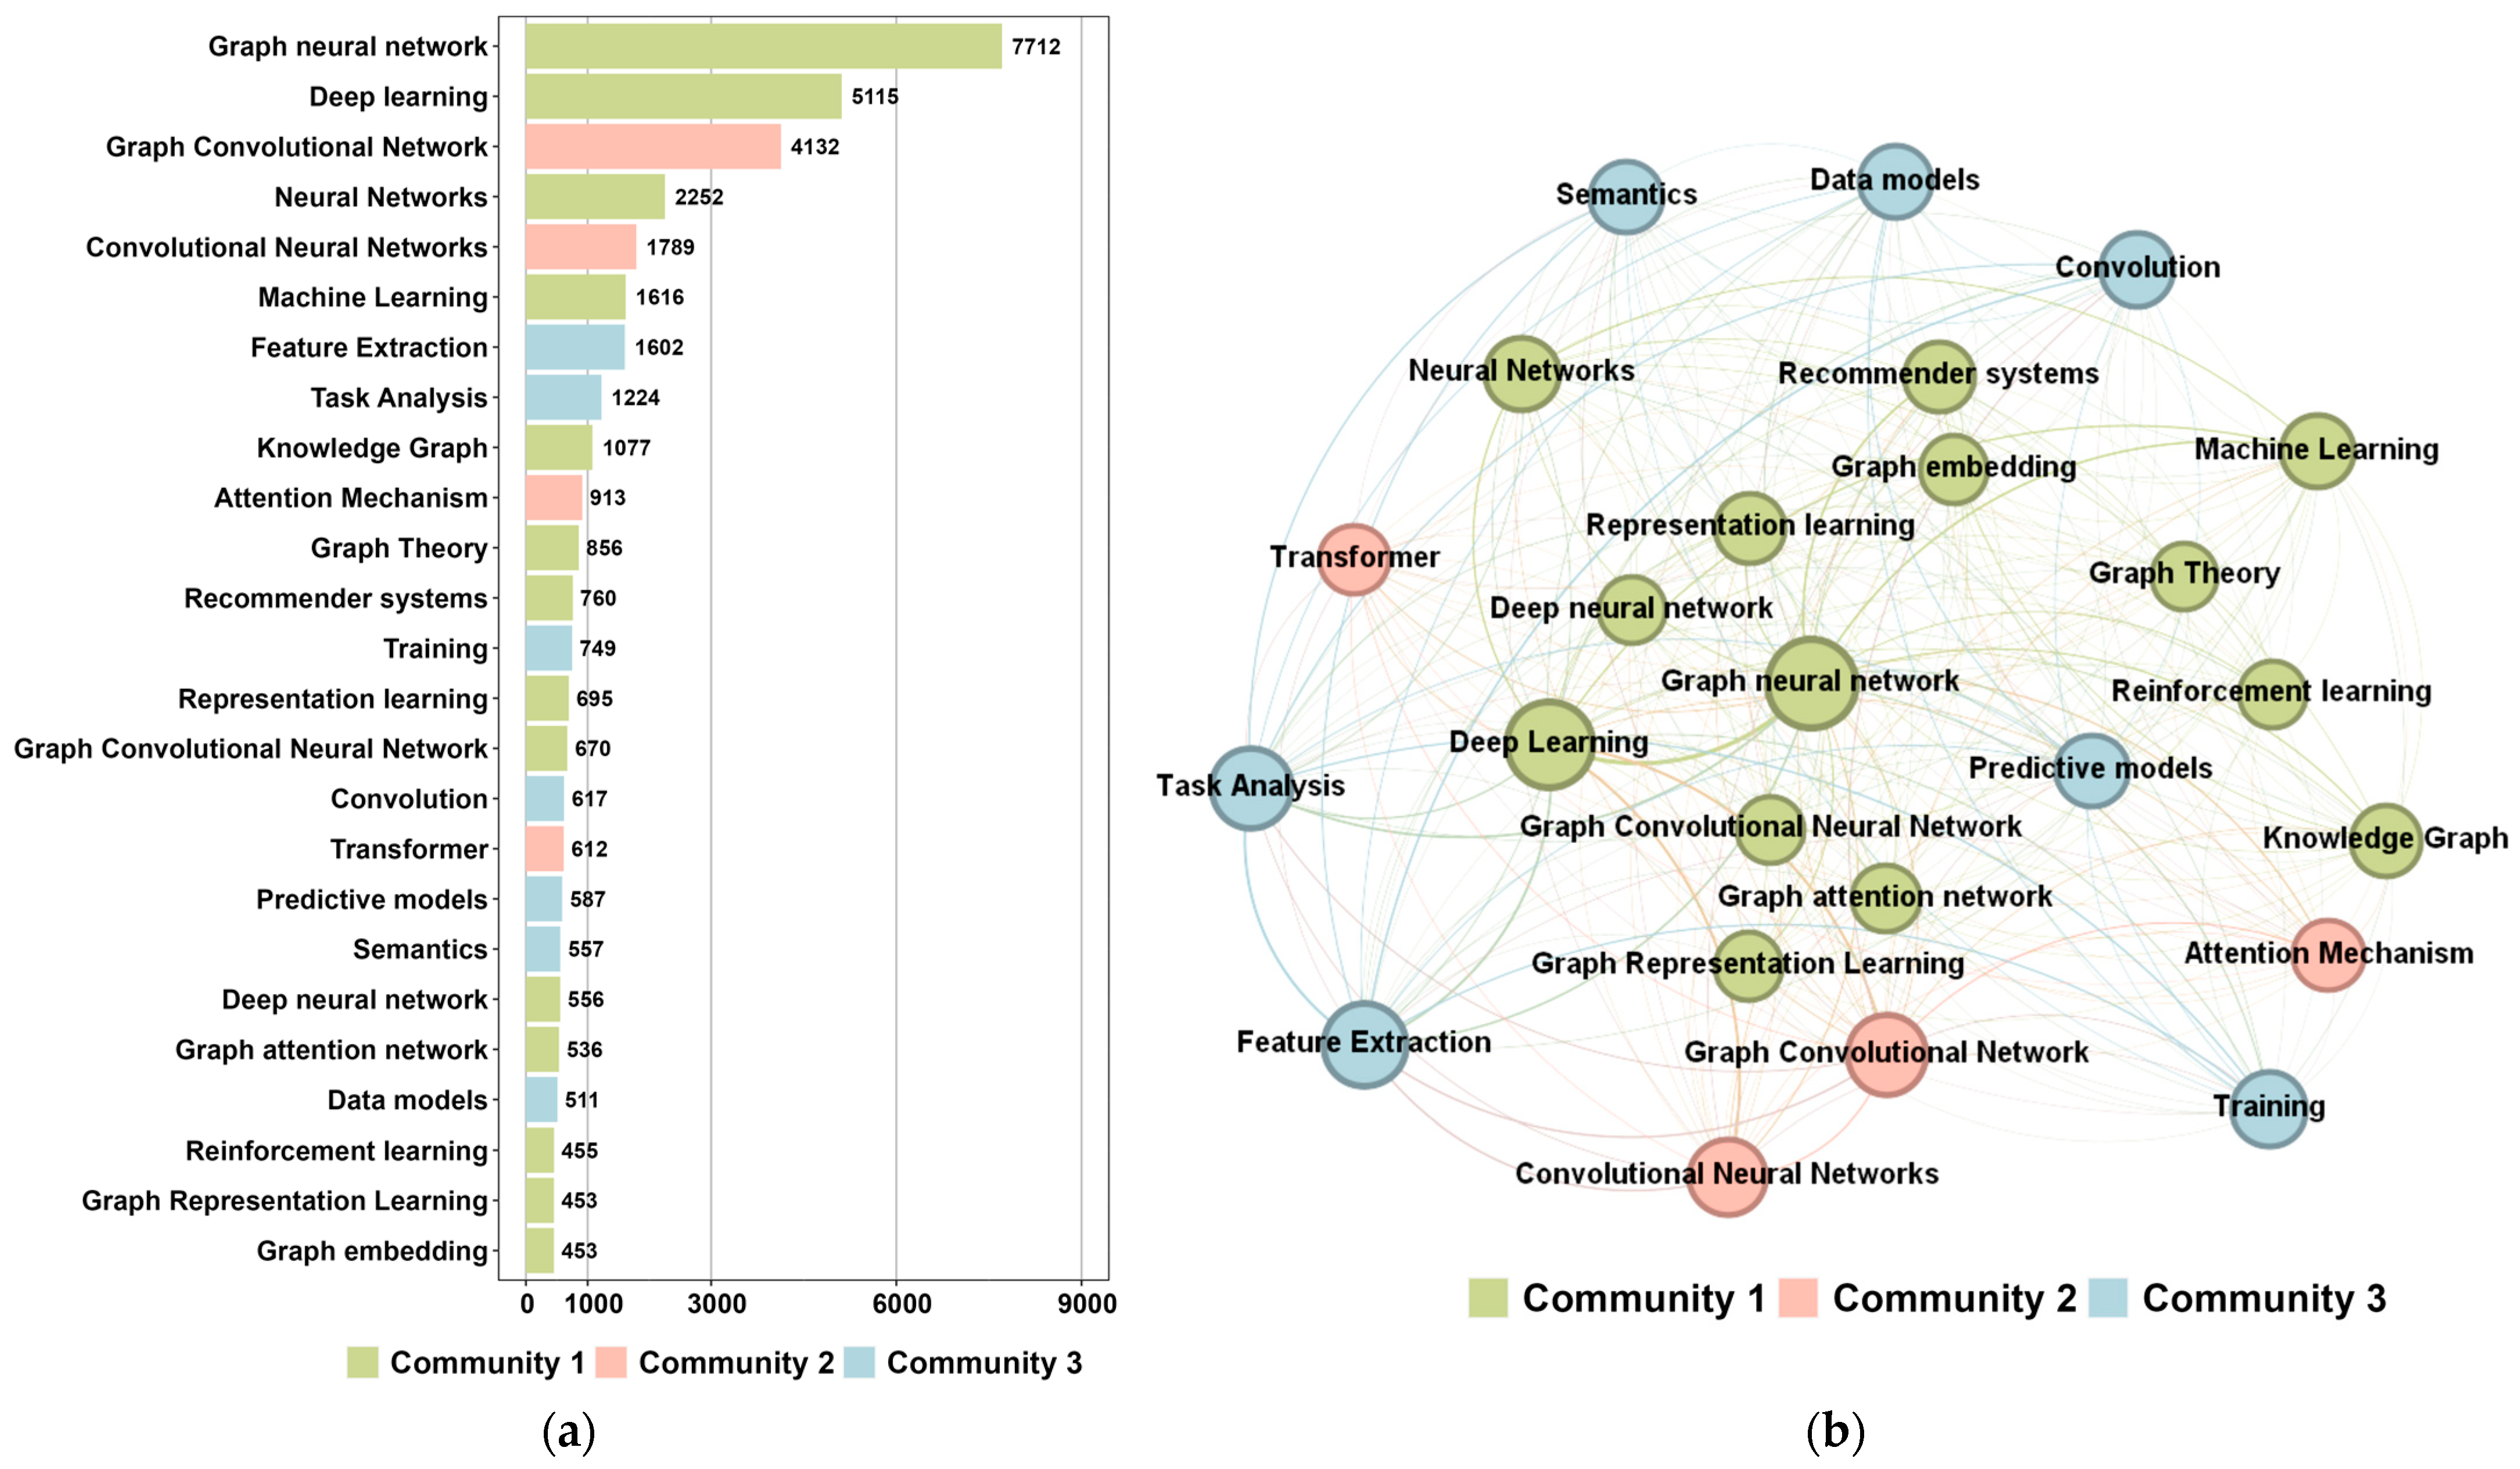
Finally, we analyzed the keywords of the GNN publications to understand the works’ content. According to the results presented in Figure 6a, the main publishing contents are GNN (18.93%), deep learning (12.55%), graph convolutional networks (10.14%), and neural networks (5.53%). The co-occurrences between the authors’ keywords are depicted in Figure 6b. Although the GNN is the keyword with the highest frequency and weighted degree in the network (10,096), its node has the same degree (24 connections) and eigenvector centrality (1.0) as the other nineteen keywords in the network, such as deep learning, machine learning, feature extraction, and semantics.
The keywords GNN, deep learning, neural networks, and machine learning are in Community 1, where 56% of all the nodes were grouped. Community 1 has a thicker edge between the GNN and deep learning (789 shared records) and between the GNN and recommender systems (382 shared records). In Community 2, the four clustered keywords have a lower degree of co-occurrence with other keywords than the other communities do. The keyword graph convolutional network has the highest weighted degree (24) in Community 2. In Community 3, feature extraction has the highest weighted degree (7552), while sharing degree (24) and eigenvector centrality (1.0) with the other Community 3 nodes. Within Community 3, the highest co-occurrences are between task analysis and feature extraction (493 shared records) and between task analysis and convolution (338 shared records).
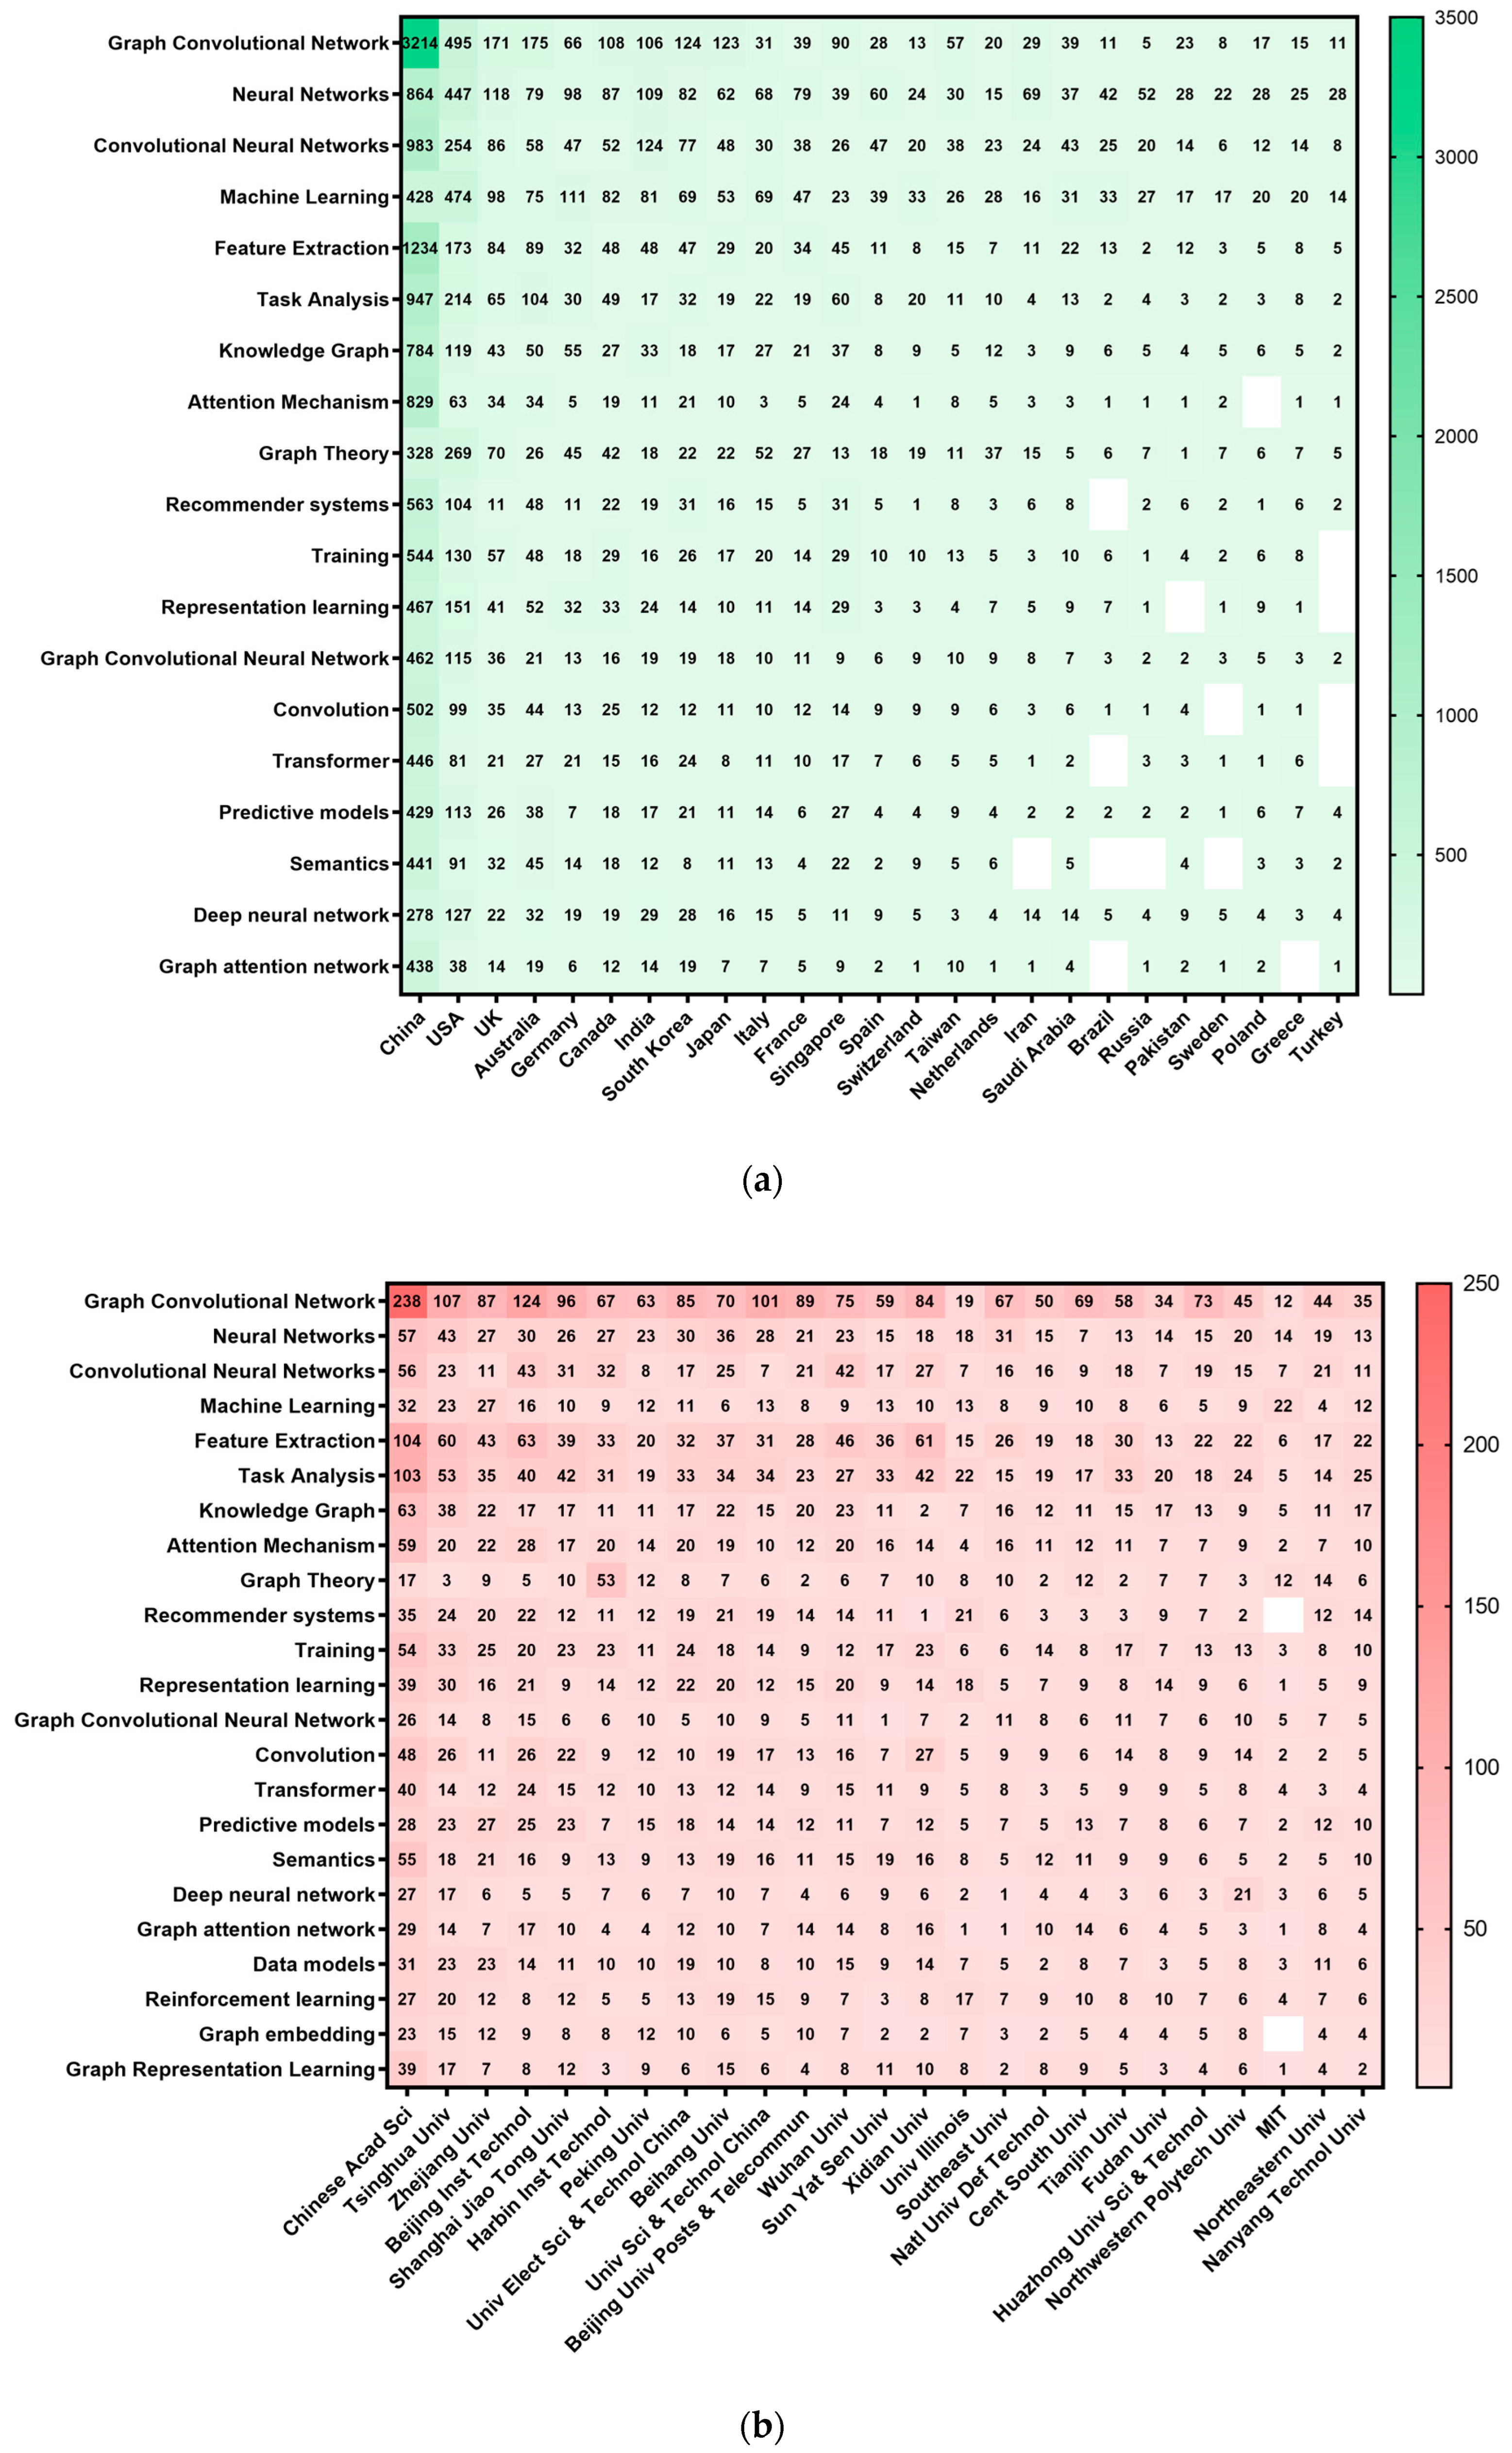
We also created matrices to analyze the co-occurrence between the main keywords, countries (Figure 7a), and organizations (Figure 7b) to identify the main focus of study per country and organization. Figure 7a shows that deep learning, graph convolutional networks, and neural networks are the most frequent keywords in countries such as China, the USA, the UK, and Australia. China leads significantly in terms of graph convolutional networks (3214), deep learning (2709), and task analysis (1234). The USA leads in machine learning (474). Figure 7b shows that the Chinese Academy of Sciences contributes to deep learning (253), graph convolutional networks (238), task analysis (103), and feature extraction (104). Tsinghua University has a significant focus on deep learning (108) and graph convolutional networks (107) but has lower frequencies of other topics.

3.5. Top 10 Publications

The citation count is an indicator of the influence and impact of research articles in a scientific field and is recognized as an important metric in research policy and academia [42]. Table 1 lists the top 10 publications related to the GNN research field with the highest number of citations according to WoS. LeCun et al. (1998) reviewed gradient-based learning, published in Proceedings of the IEEE, which has the highest citation count (30,678) [43]. Watts and Strogatz’s article (1998) on small-world networks, published in Nature, is the second most cited (28,498) [44]. The third most cited work (14,454), on TensorFlow: A system for large-scale machine learning, was published eighteen years later at the Symposium on Operating Systems Design and Implementation [45]. Collectively, these articles have surpassed the 100,000 citation mark, showcasing their impact across multiple research areas beyond just GNN.

4. Discussion

This study aimed to conduct a bibliometric analysis of GNNs to understand their evolution over the years. The main applications in fields of science and technology were analyzed, mapping the most influential research groups and works, with the aim of prospecting for future scenarios.
First, we analyzed 40,741 publications utilizing GNNs that were published from 1945 to August 2024. Cartwright and Harary published the oldest article counted in this study, in 1956, entitled “Structural balance—A generalization of Heider theory”. Although there was no description of GNNs at the time, they make very interesting use of graphs to model Heider’s theory, which attempts to understand the dynamics of tensions generated in social interactions, from friendship to hostility [41]. Models such as signed directed graph neural networks (SDGNNs) use Heider theory to learn representations of nodes in signed and directed networks, helping to predict the direction and sign of connections between nodes [51]. Other interesting articles from a historical point of view (before the creation of the GNN) include the papers by Mahdavi et al. (2001), which described the GNN as an advantageous way of developing algorithms to solve problems related to cellular manufacturing, with the aim of reducing waste [52]; and Scarselli et al. (2004), who proposed the use of graphs in pattern recognition [53]. Years later, Scarselli and collaborators proposed the GNN model in “The Graph Neural Network Model” in 2009 [8]. In the years following this work, a significant increase in the publication of articles studying GNN was observed; however, the increase had an exponential profile from 2018 onward, with an annual growth rate above 50%. The data indicate a continuous growth in publications, even in 2024, which was partially analyzed, suggesting an expansion of this field of knowledge.
In the bibliometric analysis conducted by Keramatfar et al. (2022), a consistent growth pattern was observed up to the last year evaluated (2020) [30]. They identified 1280 publications, which represents 3.14% of the total publications analyzed in the current study. This substantial increase highlights the rapid growth of the field over the past four years. This increase is also evident in previous bibliometric analyses of convolutional neural networks [54], deep learning [55], and artificial intelligence [56]. The significant increase in the number of publications on GNNs and AI between 2019 and 2021 can be attributed primarily to the demands caused by the COVID-19 pandemic. The search for predictions regarding the pandemic’s trajectory and the uncertainties it introduced spans various fields of knowledge, particularly in health [57,58,59,60]. Additionally, there is a notable presence of articles focused on health-related solutions within the computational sciences, indicating substantial interdisciplinary interaction in the application of GNNs. With respect to research areas, the analyses highlight the publication domains and reveal the interactions between different fields of knowledge. These analyses suggest that the field of Computer Science is generating solutions and applications in a community, especially in three fields of knowledge—Engineering, Telecommunications, and Imaging Science & Photography—but also for other fields, such as Education & Educational Research, Acoustics, Radiology, Nuclear Medicine & Medical Imaging, and Automation & Control Systems. It is possible to see the central position of Chemistry, Physics, Mathematics, and Computer Science in their communities. The network reveals that there is still a greater connection between the GNN and the areas focused on the Exact Sciences [61].
As previously mentioned, publications related to GNNs in Computer Science focus on enhancing GNN models [62,63,64] and their applications in the Internet of Things (IoT) [65], which in turn generate solutions and applications across various fields. In Engineering, GNN applications span Biomedical Engineering (e.g., monitoring patients’ vital signs) [66], Industrial Engineering (e.g., product assembly) [67], and Geological Engineering (e.g., geolocation and stratigraphy) [68,69]. In Telecommunications, GNN research is linked to fraud prevention [70,71], mobile network optimization [72], traffic management [73], and autonomous vehicles [74]. In the Health sciences, significant advancements with GNNs pertain to drug discovery [75,76] and disease diagnosis [77,78].
Analyses of the authors’ affiliation indicated that China and the USA are leaders in the network, due to their diverse and numerous collaborations. This same trend was identified in the work of Keramatfar et al. (2022) [30]. When we analyzed by continent, 71.6% of the publications on GNNs originated from Asian universities and research centers, 24.8% from North America, and 21.21% from Europe. This highlights that many innovations in GNN applications are emerging from Asian countries. A notable example is a Chinese article published in 2021, which explores the application of the GNN for fraud detection—a highly relevant topic, particularly in the financial market [79]. Not by coincidence, the organizations with the highest number of publications are all located in China since the country leads the ranking of publications in the field of GNN. The Chinese Academy of Sciences and Zhejiang University have the higher numbers of publications and collaborations.
When we evaluate the keywords of publications, we first notice a strong relationship between those addressing the GNN, deep learning, and machine learning. Most publications focus on the application of the GNN in deep learning. All analyzed keywords were related to machine learning, suggesting that the primary use of the GNN is still to train machines or systems to perform tasks. Cross-referencing keyword information with authors’ affiliation revealed that Chinese universities are particularly focused on deep learning, graph convolutional networks, and feature extraction. In contrast, American universities seem dedicated to studying the same first models, in addition to machine learning. The analysis by country indicates that these areas are still growing, with increasing in attention mechanisms.
The analysis of the top 10 cited articles revealed that they primarily focused on methodology, detailing models or new GNN modules. These articles include definitions of the developed neural network architectures and the theoretical concepts underpinning their creation. Quantitative data were used to obtain and compare metrics such as accuracy, performance, and error rates between the developed method and similar ones. The articles also discuss future applications and perspectives regarding its use. Specifically, the articles in the 1st and 6th positions review learning methods for writing and social representations, whereas the article in the 5th position describes a method for processing datasets for use in deep neural networks.
Future publications on GNNs are expected to address the current limitations of these models. This will be crucial for enhancing their performance, making them more accurate and robust by considering factors such as the appropriate number of layers, and the heterogeneity and dynamicity of graphs. Publications focusing on improving datasets, the explainability of GNN models, and attention mechanisms will help to better understand their modus operandi and suggest potential improvements [4,30,61,80]. An example in this context is the connection between the GNN and explainable AI (XAI), which refers to methods and techniques that make the results of AI models more understandable to humans, providing clear and transparent explanations about how and why a model of AI reached a certain decision [81]. The relationship between XAI and the GNN is important because GNNs, owing to their complexity, can be difficult to interpret. Applying XIA techniques to GNNs helps to understand how these networks make decisions based on the relationships and structures of the graphs, which is essential for validating the models, ensuring that they are working correctly, and identifying possible problems, and being able to recycle the entire GNN after certain changes are made by the user [82].
This study has limitations. One possible concern is the exclusive reliance on WoS as the data source. However, it is important to note that WoS is a well-established database widely used in bibliometrics and network analysis. Owing to its broad coverage and inclusion of high-quality journals in various disciplines, WoS is the source of the impact factor, a globally recognized indicator of the quality of scientific publications [27]. Additionally, the use of a single database is a common approach in bibliometric and network analysis research due to challenges such as the complexity of merging metadata from different sources, inconsistencies in data standardization across fields, and the potential reduction in data coverage when some databases lack relevant information [83].
In this context, bibliometric studies serve as crucial tools for researchers, institutions, and funding agencies to understand the current state of a research field, identify influential works and researchers, assess the impact of research, and uncover emerging trends and research gaps. By offering a comprehensive and systematic overview of a field’s landscape, bibliometrics can inform and guide future research development, ultimately advancing the progress of scientific knowledge.

5. Conclusions

Through bibliometric analysis, we identified an exponential increase in publications on GNNs since 2018. Research centers in China and the USA are at the forefront in publications in deep learning and GNN, which may reflect advances, mostly in the fields of Computer Science and Engineering. Collectively, these data forecast the future of significant technological advancements driven by the use of GNNs. The prospects are that the accuracy and robustness of the GNN will be improved, reflecting on the quality of predictions.

Supplementary Materials

The following supporting information can be downloaded at: https://www.mdpi.com/article/10.3390/info15100626/s1, Table S1: Network metrics of research areas; Table S2: Network metrics of countries; Table S3: Network metrics of organizations; Table S4: Network metrics of keywords. Figure S1: Trends in keywords of GNN-related articles over time; Figure S2: Trends in research areas identified in GNN-related articles over time; Figure S3: Trends in GNN-related publications by country over time.

Author Contributions

Conceptualization, F.B.M. and L.A.A.; Methodology, L.A.M.B. and F.B.M.; Software, L.A.M.B. and F.B.M.; Formal Analysis, A.M.B.d.S., N.C.d.S.F., L.A.M.B., F.B.M. and V.M.; Investigation, A.M.B.d.S., N.C.d.S.F. and L.A.M.B.; Resources, F.B.M. and L.A.A.; Data Curation, A.M.B.d.S., L.A.M.B. and F.B.M.; Writing—Original Draft Preparation, A.M.B.d.S., N.C.d.S.F., L.A.M.B. and F.B.M.; Writing—Review & Editing, V.M. and L.A.A.; Visualization, L.A.M.B. and F.B.M.; Supervision, F.B.M. and L.A.A.; Project Administration, F.B.M. and L.A.A.; Funding Acquisition, F.B.M. and L.A.A. All authors have read and agreed to the published version of the manuscript.

Funding

This research received no external funding.

Institutional Review Board Statement

Not applicable.

Informed Consent Statement

Not applicable.

Data Availability Statement

Any data and materials used in the study are available on reasonable request to the corresponding author.

Acknowledgments

We thank Fundação Oswaldo Cruz (Fiocruz), Conselho Nacional de Desenvolvimento Científico e Tecnológico (CNPq), and Fundação Carlos Chagas Filho de Amparo à Pesquisa do Estado do Rio de Janeiro (Faperj) for their financial support.

Conflicts of Interest

The authors declare no conflicts of interest.

References

  1. Jain, A.K.; Mao, J.; Mohiuddin, K.M. Artificial neural networks: A tutorial. Computer 1996, 29, 31–44. [Google Scholar] [CrossRef]
  2. Dobrev, D. A definition of artificial intelligence. arXiv 2012, arXiv:1210.1568. [Google Scholar]
  3. Hasson, U.; Nastase, S.A.; Goldstein, A. Direct fit to nature: An evolutionary perspective on biological and artificial neural networks. Neuron 2020, 105, 416–434. [Google Scholar] [CrossRef] [PubMed]
  4. Wu, Z.; Pan, S.; Chen, F.; Long, G.; Zhang, C.; Yu, P.S. A comprehensive survey on graph neural networks. IEEE Trans. Neural Netw. Learn. Syst. 2019, 32, 4–24. [Google Scholar] [CrossRef] [PubMed]
  5. Krogh, A. What are artificial neural networks? Nat. Biotechnol. 2008, 26, 195–197. [Google Scholar] [CrossRef]
  6. Abiodun, O.I.; Jantan, A.; Omolara, A.E.; Dada, K.V.; Mohamed, N.A.; Arshad, H. State-of-the-art in artificial neural network applications: A survey. Heliyon 2018, 4, e00938. [Google Scholar] [CrossRef]
  7. Smith, R.G.; Eckroth, J. Building AI applications: Yesterday, today, and tomorrow. AI Mag. 2017, 38, 6–22. [Google Scholar] [CrossRef]
  8. Scarselli, F.; Gori, M.; Tsoi, A.C.; Hagenbuchner, M. The graph neural network model. IEEE Trans. Neural Netw. 2009, 20, 61–80. [Google Scholar] [CrossRef]
  9. Waikhom, L.; Patgiri, R. Graph neural networks: Methods, applications, and opportunities. arXiv 2021. [Google Scholar] [CrossRef]
  10. Wang, J.; Zhang, S.; Xiao, Y.; Song, R. A review on graph neural network methods in financial applications. J. Data Sci. 2022, 20, 111–134. [Google Scholar] [CrossRef]
  11. Zheng, Q.; Ding, Q. Exploration of consumer preference based on deep learning neural network model in the immersive marketing environment. PLoS ONE 2022, 17, e0268007. [Google Scholar] [CrossRef] [PubMed]
  12. Alves, L.A.; Ferreira, N.C.d.S.; Maricato, V.; Alberto, A.V.P.; Dias, E.A.; Jose Aguiar Coelho, N. Graph neural networks as a potential tool in improving virtual screening programs. Front. Chem. 2022, 9, 787194. [Google Scholar] [CrossRef] [PubMed]
  13. Atz, K.; Grisoni, F.; Schneider, G. Geometric deep learning on molecular representations. Nat. Mach. Intell. 2021, 3, 1023–1032. [Google Scholar] [CrossRef]
  14. You, R.; Yao, S.; Mamitsuka, H.; Zhu, S. DeepGraphGO: Graph neural network for large-scale, multispecies protein function prediction. Bioinformatics 2021, 37, i262–i271. [Google Scholar] [CrossRef] [PubMed]
  15. Zhang, Z.; Chen, L.; Zhong, F.; Wang, D.; Jiang, J.; Zhang, S.; Jiang, H.; Zheng, M.; Li, X. Graph neural network approaches for drug-target interactions. Curr. Opin. Struct. Biol. 2022, 73, 102327. [Google Scholar] [CrossRef]
  16. Li, Y.; Qian, B.; Zhang, X.; Liu, H. Graph neural network-based diagnosis prediction. Big Data 2020, 8, 379–390. [Google Scholar] [CrossRef]
  17. Choi, K.S.; Kim, S.; Kim, B.-H.; Jeon, H.J.; Kim, J.-H.; Jang, J.H.; Jeong, B. Deep graph neural network-based prediction of acute suicidal ideation in young adults. Sci. Rep. 2021, 11, 15828. [Google Scholar] [CrossRef]
  18. Yan, W.; Zhang, Z.; Zhang, Q.; Zhang, G.; Hua, Q.; Li, Q. Deep data analysis-based agricultural products management for smart public healthcare. Front. Public Health 2022, 10, 847252. [Google Scholar] [CrossRef]
  19. Donthu, N.; Kumar, S.; Mukherjee, D.; Pandey, N.; Lim, W.M. How to conduct a bibliometric analysis: An overview and guidelines. J. Bus. Res. 2021, 133, 285–296. [Google Scholar] [CrossRef]
  20. Cascajares, M.; Alcayde, A.; Salmerón-Manzano, E.; Manzano-Agugliaro, F. The bibliometric literature on Scopus and WoS: The Medicine and Environmental Sciences categories as case of study. Int. J. Environ. Res. Public Health 2021, 18, 5851. [Google Scholar] [CrossRef]
  21. Gaviria-Marin, M.; Merigó, J.M.; Baier-Fuentes, H. Knowledge management: A global examination based on bibliometric analysis. Technol. Forecast. Soc. Chang. 2019, 140, 194–220. [Google Scholar] [CrossRef]
  22. Munnolli, S.S.; Pujar, S.M. Scientometric study of Indian cancer research based on Scopus database. COLLNET J. Scientometr. Inf. Manag. 2017, 11, 201–214. [Google Scholar] [CrossRef]
  23. Thompson, D.F.; Walker, C.K. A descriptive and historical review of bibliometrics with applications to Medical Sciences. Pharmacother. J. Hum. Pharmacol. Drug Ther. 2015, 35, 551–559. [Google Scholar] [CrossRef] [PubMed]
  24. Ninkov, A.; Frank, J.R.; Maggio, L.A. Bibliometrics: Methods for studying academic publishing. Perspect. Med. Educ. 2021, 11, 173–176. [Google Scholar] [CrossRef] [PubMed]
  25. Dong, J.; Dong, S.; Buckingham, L. How does a research topic evolve into a research field?—A bibliometric analysis of metadiscourse research. Ibérica 2023, 45, 163–189. [Google Scholar] [CrossRef]
  26. Wider, W.; Mutang, J.A.; Chua, B.S.; Pang, N.T.P.; Jiang, L.; Fauzi, M.A.; Udang, L.N. Mapping the evolution of neurofeedback research: A bibliometric analysis of trends and future directions. Front. Hum. Neurosci. 2024, 18, 1339444. [Google Scholar] [CrossRef]
  27. Birkle, C.; Pendlebury, D.A.; Schnell, J.; Adams, J. Web of Science as a data source for research on scientific and scholarly activity. Quant. Sci. Stud. 2020, 1, 363–376. [Google Scholar] [CrossRef]
  28. Maciel Braga, L.A.; Mota, F.B. Early cancer diagnosis using lab-on-a-chip devices: A bibliometric and network analysis. COLLNET J. Scientometr. Inf. Manag. 2021, 15, 163–196. [Google Scholar] [CrossRef]
  29. Lopes, R.M.; Braga, L.A.M.; Serrão, A.S.R.; Teixeira, L.D.A.; Comarú, M.W.; de Souza, R.A.; de Souza, C.A.M.; Mota, F.B. Virtual reality to teach students in laboratories: A bibliometric and network analysis. J. Chem. Educ. 2024, 101, 501–513. [Google Scholar] [CrossRef]
  30. Keramatfar, A.; Rafiee, M.; Amirkhani, H. Graph neural networks: A bibliometrics overview. Mach. Learn. Appl. 2022, 10, 100401. [Google Scholar] [CrossRef]
  31. Eschmann, R.; Groshek, J.; Li, S.; Toraif, N.; Thompson, J.G. Bigger than sports: Identity politics, Colin Kaepernick, and concession making in #BoycottNike. Comput. Human. Behav. 2021, 114, 106583. [Google Scholar] [CrossRef]
  32. Martin, S.; Brown, W.M.; Klavans, R.; Boyack, K.W. OpenOrd: An open-source toolbox for large graph layout. In Visualization and Data Analysis 2011; International Society for Optical Engineering (SPIE): Bellingham, WA, USA, 2011; p. 786806. [Google Scholar] [CrossRef]
  33. Schneider, L.; Guo, Y.; Birch, D.; Sarkies, P. Network-based visualisation reveals new insights into transposable element diversity. Mol. Syst. Biol. 2021, 17, e9600. [Google Scholar] [CrossRef] [PubMed]
  34. Blondel, V.D.; Guillaume, J.-L.; Lambiotte, R.; Lefebvre, E. Fast unfolding of communities in large networks. J. Stat. Mech. Theory Exp. 2008, 2008, P10008. [Google Scholar] [CrossRef]
  35. Carron-Arthur, B.; Reynolds, J.; Bennett, K.; Bennett, A.; Cunningham, J.A.; Griffiths, K.M. Community structure of a mental health internet support group: Modularity in user thread participation. JMIR Ment. Health 2016, 3, e20. [Google Scholar] [CrossRef]
  36. Xia, L.; Chen, B.; Hunt, K.; Zhuang, J.; Song, C. Food safety awareness and opinions in China: A social network analysis approach. Foods 2022, 11, 2909. [Google Scholar] [CrossRef]
  37. Wasserman, S.; Faust, K. Social Network Analysis: Methods and Applications; Cambridge University Press: Cambridge, UK, 1994. [Google Scholar] [CrossRef]
  38. Borgatti, S.P.; Everett, M.G.; Johnson, J.C. Analyzing Social Networks, 2nd ed.; SAGE Publications Ltd.: Thousand Oaks, CA, USA, 2018. [Google Scholar]
  39. Freeman, L.C. Centrality in social networks conceptual clarification. Soc. Netw. 1978, 1, 215–239. [Google Scholar] [CrossRef]
  40. Gilsing, V.; Nooteboom, B.; Vanhaverbeke, W.; Duysters, G.; van den Oord, A. Network embeddedness and the exploration of novel technologies: Technological distance, betweenness centrality and density. Res. Policy 2008, 37, 1717–1731. [Google Scholar] [CrossRef]
  41. Cartwright, D.; Harary, F. Structural balance: A generalization of Heider’s theory. Psychol. Rev. 1956, 63, 277–293. [Google Scholar] [CrossRef]
  42. Aksnes, D.W.; Langfeldt, L.; Wouters, P. Citations, citation indicators, and research quality: An overview of basic concepts and theories. Sage Open 2019, 9, 1–17. [Google Scholar] [CrossRef]
  43. Lecun, Y.; Bottou, L.; Bengio, Y.; Haffner, P. Gradient-based learning applied to document recognition. Proc. IEEE 1998, 86, 2278–2324. [Google Scholar] [CrossRef]
  44. Watts, D.J.; Strogatz, S.H. Collective dynamics of ‘small-world’ networks. Nature 1998, 393, 440–442. [Google Scholar] [CrossRef] [PubMed]
  45. Abadi, M.; Barham, P.; Chen, J.; Chen, Z.; Davis, A.; Dean, J.; Devin, M.; Ghemawat, S.; Irving, G.; Isard, M.; et al. TensorFlow: A system for large-scale machine learning. In Proceedings of the 12th USENIX Symposium on Operating Systems Design and Implementation (OSDI ’16), Savannah, GA, USA, 2–4 November 2016. [Google Scholar]
  46. Boccaletti, S.; Latora, V.; Moreno, Y.; Chavez, M.; Hwang, D.U. Complex networks: Structure and dynamics. Phys. Rep. 2006, 424, 175–308. [Google Scholar] [CrossRef]
  47. Shorten, C.; Khoshgoftaar, T.M. A survey on image data augmentation for deep learning. J. Big Data 2019, 6, 1–48. [Google Scholar] [CrossRef]
  48. Perozzi, B.; Al-Rfou, R.; Skiena, S. Deepwalk: Online learning of social representations. In Proceedings of the 20th ACM SIGKDD International Conference on Knowledge Discovery and Data MINING, New York, NY, USA, 24–27 August 2014; pp. 701–710. [Google Scholar] [CrossRef]
  49. Defferrard, M.; Bresson, X.; Vandergheynst, P. Convolutional Neural Networks on Graphs with Fast Localized Spectral Filtering. In Proceedings of the Advances in Neural Information Processing Systems 29: Annual Conference on Neural Information Processing Systems 2016, Barcelona, Spain, 5–10 December 2016; Available online: https://proceedings.neurips.cc/paper_files/paper/2016/file/04df4d434d481c5bb723be1b6df1ee65-Paper.pdf (accessed on 26 September 2024).
  50. Dai, J.; Qi, H.; Xiong, Y.; Li, Y.; Zhang, G.; Hu, H.; Wei, Y. Deformable convolutional networks. In Proceedings of the IEEE International Conference on Computer Vision, Venice, Italy, 27–29 October 2017; pp. 764–773. Available online: https://openaccess.thecvf.com/content_ICCV_2017/papers/Dai_Deformable_Convolutional_Networks_ICCV_2017_paper.pdf (accessed on 26 September 2024).
  51. Huang, J.; Shen, H.; Hou, L.; Cheng, X. SDGNN: Learning node representation for signed directed networks. In Proceedings of the Thirty-Fifth AAAI Conference on Artificial Intelligence, Virtual, 2–9 February 2021; pp. 196–203. [Google Scholar] [CrossRef]
  52. Mahdavi, I.; Kaushal, O.P.; Chandra, M. Graph-neural network approach in cellular manufacturing on the basis of a binary system. Int. J. Prod. Res. 2001, 39, 2913–2922. [Google Scholar] [CrossRef]
  53. Scarselli, F.; Tsoi, A.C.; Gori, M.; Hagenbuchner, M. Graphical-based learning environments for pattern recognition. In Structural, Syntactic, and Statistical Pattern Recognition. SSPR/SPR 2004. Lecture Notes in Computer Science; Fred, A., Caelli, T.M., Duin, R.P.W., Campilho, A.C., de Ridder, D., Eds.; Springer: Berlin/Heidelberg, Germany, 2004; Volume 3138, pp. 42–56. [Google Scholar] [CrossRef]
  54. Chen, H.; Deng, Z. Bibliometric analysis of the application of convolutional neural network in computer vision. IEEE Access 2020, 8, 155417–155428. [Google Scholar] [CrossRef]
  55. Ali, L.; Alnajjar, F.; Khan, W.; Serhani, M.A.; Al Jassmi, H. Bibliometric analysis and review of deep learning-based crack detection literature published between 2010 and 2022. Buildings 2022, 12, 432. [Google Scholar] [CrossRef]
  56. Xu, D.; Liu, B.; Wang, J.; Zhang, Z. Bibliometric analysis of artificial intelligence for biotechnology and applied microbiology: Exploring research hotspots and frontiers. Front. Bioeng. Biotechnol. 2022, 10, 998298. [Google Scholar] [CrossRef]
  57. Panagopoulos, G.; Nikolentzos, G.; Vazirgiannis, M. Transfer Graph neural networks for pandemic forecasting. In Proceedings of the 35th AAAI Conference on Artificial Intelligence, Virtual , 2–9 February; 2021; pp. 4838–4845. [Google Scholar] [CrossRef]
  58. Vaishya, R.; Javaid, M.; Khan, I.H.; Haleem, A. Artificial Intelligence (AI) applications for COVID-19 pandemic. Diabetes Metab. Syndr. Clin. Res. Rev. 2020, 14, 337–339. [Google Scholar] [CrossRef]
  59. Swayamsiddha, S.; Prashant, K.; Shaw, D.; Mohanty, C. The prospective of artificial intelligence in COVID-19 pandemic. Health Technol. 2021, 11, 1311–1320. [Google Scholar] [CrossRef]
  60. Syrowatka, A.; Kuznetsova, M.; Alsubai, A.; Beckman, A.L.; Bain, P.A.; Craig, K.J.T.; Hu, J.; Jackson, G.P.; Rhee, K.; Bates, D.W. Leveraging artificial intelligence for pandemic preparedness and response: A scoping review to identify key use cases. NPJ Digit. Med. 2021, 4, 96. [Google Scholar] [CrossRef]
  61. Zhou, J.; Cui, G.; Hu, S.; Zhang, Z.; Yang, C.; Liu, Z.; Wang, L.; Li, C.; Sun, M. Graph neural networks: A review of methods and applications. AI Open 2020, 1, 57–81. [Google Scholar] [CrossRef]
  62. Nerurkar, P.A.; Chandane, M.; Bhirud, S. Exploring convolutional auto-encoders for representation learning on networks. Comput. Sci. 2019, 20, 273–288. [Google Scholar] [CrossRef]
  63. Giraldo, J.H.; Skianis, K.; Bouwmans, T.; Malliaros, F.D. On the trade-off between over-smoothing and over-squashing in deep graph neural networks. In CIKM’23: Proceedings of the 32nd ACM International Conference on Information and Knowledge Management, Birmingham, UK, 21–25 October 2023; ACM: New York, NY, USA,; pp. 566–576. [CrossRef]
  64. Wu, X.-G.; Wu, H.-J.; Zhou, X.; Zhao, X.; Lu, K. Towards defense against adversarial attacks on graph neural networks via calibrated co-training. J. Comput. Sci. Technol. 2022, 37, 1161–1175. [Google Scholar] [CrossRef]
  65. Liu, Y.; Wu, H.; Rezaee, K.; Khosravi, M.R.; Khala, O.I.; Khan, A.A.; Ramesh, D.; Qi, L. Interaction-enhanced and time-aware graph convolutional network for successive point-of-interest recommendation in travelling enterprises. IEEE Trans. Ind. Inform. 2023, 19, 635–643. [Google Scholar] [CrossRef]
  66. Ma, P.; Gao, Q. EEG signal and feature interaction modeling-based eye behavior prediction research. Comput. Math. Methods Med. 2020, 2020, 2801015. [Google Scholar] [CrossRef] [PubMed]
  67. Zhang, J.; Wang, P.; Zuo, M.; Li, Y.; Xu, Z. Automatic assembly simulation of product in virtual environment based on interaction feature pair. J. Intell. Manuf. 2018, 29, 1235–1256. [Google Scholar] [CrossRef]
  68. Zhang, M.; Luo, X.; Huang, N. Integrating neighborhood geographic distribution and social structure influence for social media user geolocation. CMES-Comput. Model. Eng. Sci. 2024, 140, 2513–2532. [Google Scholar] [CrossRef]
  69. Hu, Y.; Wang, Z.Z.; Guo, X.; Kek, H.Y.; Ku, T.; Goh, S.H.; Leung, C.F.; Tan, E.; Zhang, Y. Three-dimensional reconstruction of subsurface stratigraphy using machine learning with neighborhood aggregation. Eng. Geol. 2024, 337, 107588. [Google Scholar] [CrossRef]
  70. Ji, S.; Li, J.; Yuan, Q.; Lu, J. Multi-range gated graph neural network for telecommunication fraud detection. In Proceedings of the 2020 International Joint Conference on Neural Networks (IJCNN), Glasgow, UK, 19–24 July 2020; pp. 1–6. [Google Scholar] [CrossRef]
  71. Hu, X.; Chen, H.; Liu, S.; Jiang, H.; Chu, G.; Li, R. BTG: A bridge to graph machine learning in telecommunications fraud detection. Future Gener. Comput. Syst. 2022, 137, 274–287. [Google Scholar] [CrossRef]
  72. Huang, Z.; Du, Y.; Yang, S.; Xiao, H.; Wang, D.; Sun, T. Joint optimization of task scheduling and computing resource allocation for VR video services in 5G-advanced networks. Trans. Emerg. Telecommun. Technol. 2024, 35, e4909. [Google Scholar] [CrossRef]
  73. Bouchemoukha, H.; Zennir, M.N.; Alioua, A. A spatial-temporal graph gated transformer for traffic forecasting. Trans. Emerg. Telecommun. Technol. 2024, 35, e5021. [Google Scholar] [CrossRef]
  74. Yu, H.; Liu, S.; Ren, Y.; Zhao, Y.; Jiang, H.; Liu, R. Reducing hysteresis and over-smoothing in traffic estimation: A multistream spatial-temporal graph convolutional network. Trans. Emerg. Telecommun. Technol. 2023, 34, e4789. [Google Scholar] [CrossRef]
  75. Taub, R.; Wasserman, T.; Savir, Y. Symbiotic message passing model for transfer learning between anti-fungal and anti-bacterial domains. In Proceedings of the 2023 IEEE Conference on Computational Intelligence in Bioinformatics and Computational Biology (CIBCB), Eindhoven, The Netherlands, 29–31 August 2023; pp. 1–7. [Google Scholar] [CrossRef]
  76. Westarb, G.; Stefenon, S.F.; Hoppe, A.F.; Sartori, A.; Klaar, A.C.R.; Leithardt, V.R.Q. Complex graph neural networks for medication interaction verification. J. Intell. Fuzzy Syst. 2023, 44, 10383–10395. [Google Scholar] [CrossRef]
  77. Langenecker, S.A.; Westlund Schreiner, M.; Thomas, L.R.; Bessette, K.L.; DelDonno, S.R.; Jenkins, L.M.; Easter, R.E.; Stange, J.P.; Pocius, S.L.; Dillahunt, A.; et al. Using network parcels and resting-state networks to estimate correlates of mood disorder and related research domain criteria constructs of reward responsiveness and inhibitory control. Biol. Psychiatry Cogn. Neurosci. Neuroimaging 2022, 7, 76–84. [Google Scholar] [CrossRef] [PubMed]
  78. Bamorovat, M.; Sharifi, I.; Rashedi, E.; Shafiian, A.; Sharifi, F.; Khosravi, A.; Tahmouresi, A. A novel diagnostic and prognostic approach for unresponsive patients with anthroponotic cutaneous leishmaniasis using artificial neural networks. PLoS ONE 2021, 16, e0250904. [Google Scholar] [CrossRef] [PubMed]
  79. Liu, Y.; Ao, X.; Qin, Z.; Chi, J.; Feng, J.; Yang, H.; He, Q. Pick and choose: A GNN-based imbalanced learning approach for fraud detection. In Proceedings of the World Wide Web Conference, WWW 2021, Ljubljana, Slovenia, 19–23 April 2021; Association for Computing Machinery, Inc.: New York, NY, USA, 2021; pp. 3168–3177. [Google Scholar] [CrossRef]
  80. Khemani, B.; Patil, S.; Kotecha, K.; Tanwar, S. A review of graph neural networks: Concepts, architectures, techniques, challenges, datasets, applications, and future directions. J. Big Data 2024, 11, 18. [Google Scholar] [CrossRef]
  81. Ali, S.; Abuhmed, T.; El-Sappagh, S.; Muhammad, K.; Alonso-Moral, J.M.; Confalonieri, R.; Guidotti, R.; Del Ser, J.; Díaz-Rodríguez, N.; Herrera, F. Explainable Artificial Intelligence (XAI): What we know and what is left to attain Trustworthy Artificial Intelligence. Inf. Fusion 2023, 99, 101850. [Google Scholar] [CrossRef]
  82. Metsch, J.M.; Saranti, A.; Angerschmid, A.; Pfeifer, B.; Klemt, V.; Holzinger, A.; Hauschild, A.-C. CLARUS: An interactive explainable AI platform for manual counterfactuals in graph neural networks. J. Biomed. Inform. 2024, 150, 104600. [Google Scholar] [CrossRef]
  83. Moral-Muñoz, J.A.; Herrera-Viedma, E.; Santisteban-Espejo, A.; Cobo, M.J. Software tools for conducting bibliometric analysis in science: An up-to-date review. Prof. De La Inf. 2020, 29, e290103. [Google Scholar] [CrossRef]
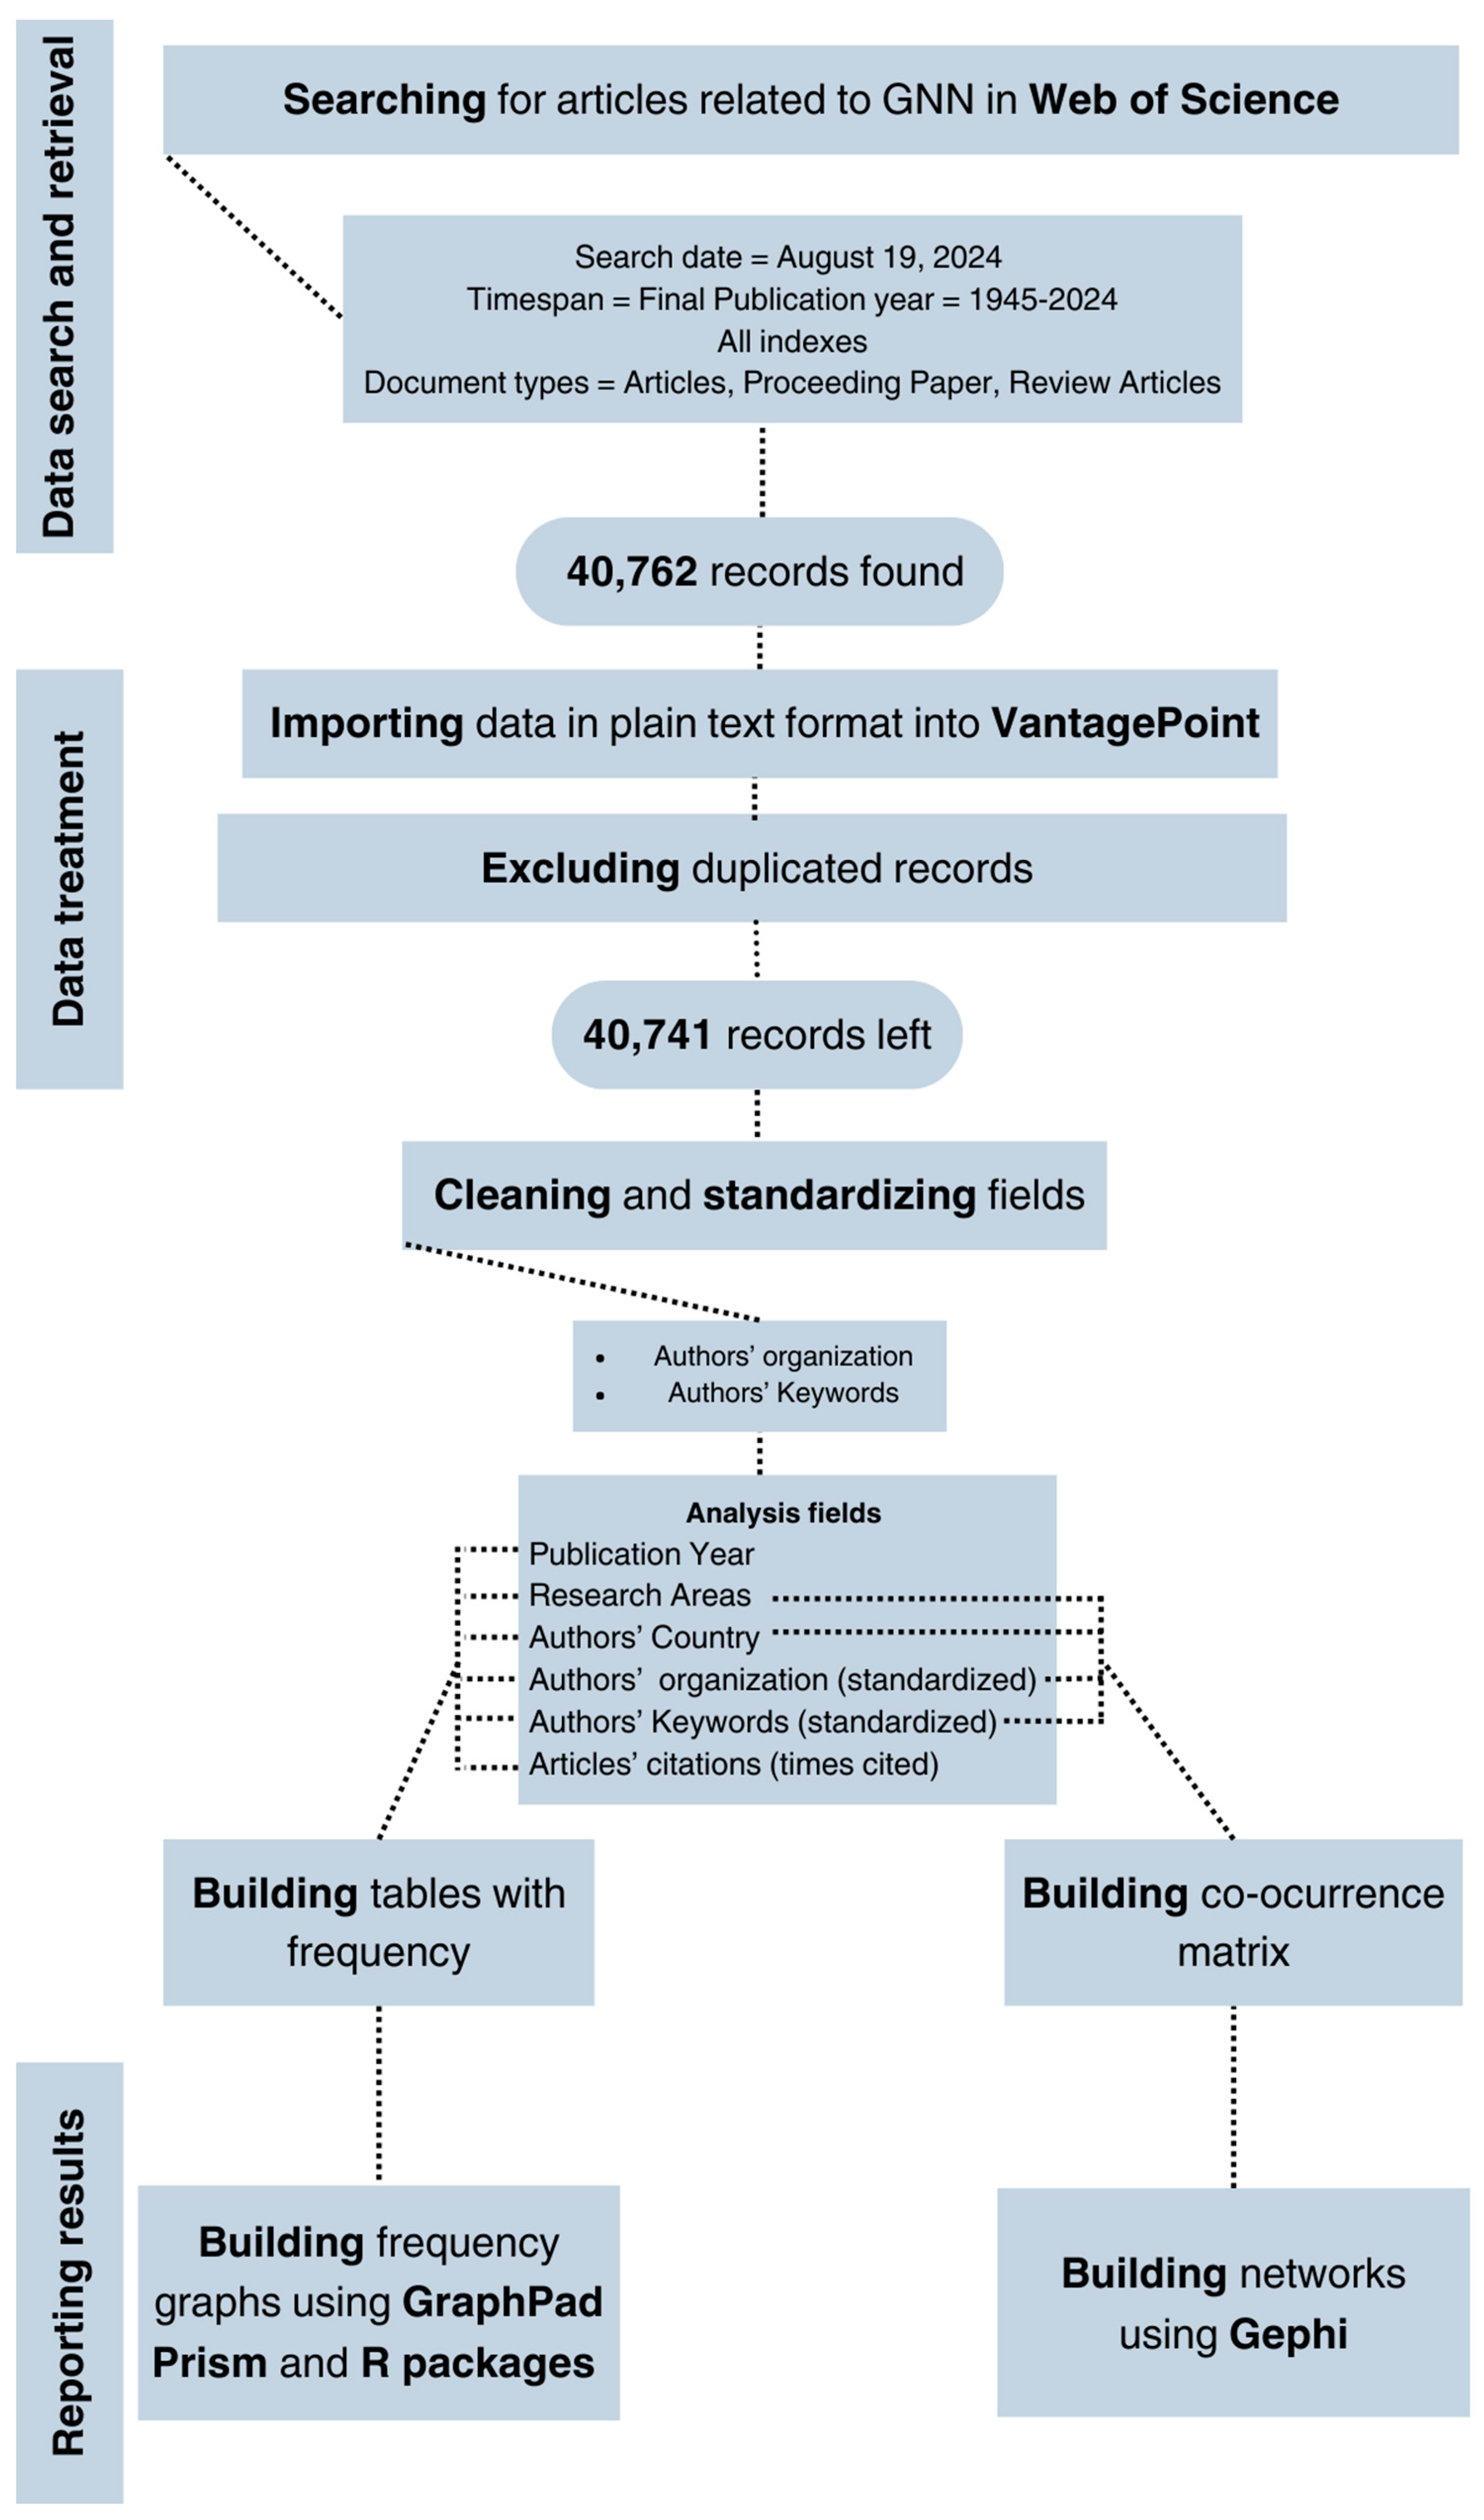
Figure 1. Diagram of the method steps.
Information 15 00626 g001
Figure 2. Evolution of GNN-related articles over time (n = 40,741).
Information 15 00626 g002
Figure 3. Main research areas and their network (n = 40,741). (a) Top 25 ranking of research areas of GNN productions, and (b) their association with knowledge sharing. Nodes represent the research areas, edges represent the shared knowledge, and thicker edges represent more intense connections between two fields.
Information 15 00626 g003
Figure 4. Most publishing countries and their network (n = 40,741). (a) Top 25 ranking of organizations. (b) GNN collaborative countries network. The nodes represent the countries, and the edges represent the collaborations between the authors of those countries. Nodes connected with thicker edges represent more intensely collaborating countries.
Information 15 00626 g004
Figure 5. Most publishing organizations and their network (n = 40,741). (a) Top 25 ranking of organizations. (b) GNN collaborative research organization network. The nodes represent the institutions, and the edges represent the collaborations between them. Nodes connected with thicker edges represent institutions that collaborate more intensely.
Information 15 00626 g005
Figure 6. Main GNN-related keywords and their network (n = 40,741). (a) Top 25 ranking of GNN publications’ keywords. (b) GNN collaborative research according to authors’ keywords. Nodes represent keywords, and edges represent connections between different keywords. Nodes connected with thicker edges represent the intensity of connections.
Information 15 00626 g006
Figure 7. Key GNN topics in publications by country and organization. (a) Co-occurrence matrix of the top 25 countries versus the top 20 keywords (without GNN). (b) Co-occurrence matrix of the top 25 institutions versus the top 20 keywords (without the GNN). Low and high counts are represented by lighter and darker colors, respectively.
Information 15 00626 g007
Table 1. Top 10 most cited GNN-related articles.
Times Cited (WoS)Pub. YearAuthorsTitleType of DocumentSource
30,6781998LeCun, Y et al. [43]Gradient-based learning applied to document recognitionReviewProceedings of the IEEE
28,4981998Watts, DJ and Strogatz, SH [44]Collective dynamics of ‘small-world’ networksArticleNature
14,4542016Abadi, M et al. [45]TensorFlow: A system for large-scale machine learningProceedings PaperProceedings of OSDI’16: 12th USENIX Symposium on Operating Systems Design and Implementation
78352006Boccaletti, S et al. [46]Complex networks: Structure and dynamicsReviewPhysics Reports-review Section of Physics Letters
50562019Shorten, C and Khoshgoftaar, TM [47]A survey on Image Data Augmentation for Deep LearningArticleJournal of Big Data
47472014Perozzi, B et al. [48]DeepWalk: Online Learning of Social RepresentationsProceedings PaperProceedings of the 20th ACM SIGKDD International Conference on Knowledge Discovery and Data Mining
46132021Wu, Z et al. [4]A Comprehensive Survey on Graph Neural NetworksArticleIEEE Transactions on Neural Networks and Learning Systems
40432009Scarselli, F et al. [8]The Graph Neural Network ModelArticleIEEE Transactions on Neural Networks
37812016Defferrard, M et al. [49]Convolutional Neural Networks on Graphs with Fast Localized Spectral FilteringProceedings Paper30th Conference on Neural Information Processing Systems
35682017Dai, J et al. [50]Deformable Convolutional NetworksProceedings Paper2017 IEEE International Conference on Computer Vision (ICCV)
Disclaimer/Publisher’s Note: The statements, opinions and data contained in all publications are solely those of the individual author(s) and contributor(s) and not of MDPI and/or the editor(s). MDPI and/or the editor(s) disclaim responsibility for any injury to people or property resulting from any ideas, methods, instructions or products referred to in the content.