
Dementia Detection from Speech: What If Language Models Are Not the Answer?


Abstract
:1. Introduction
2. Related Work and Motivations
2.1. Related Work
2.2. Motivations
3. Proposed Approach
3.1. Problem Statement
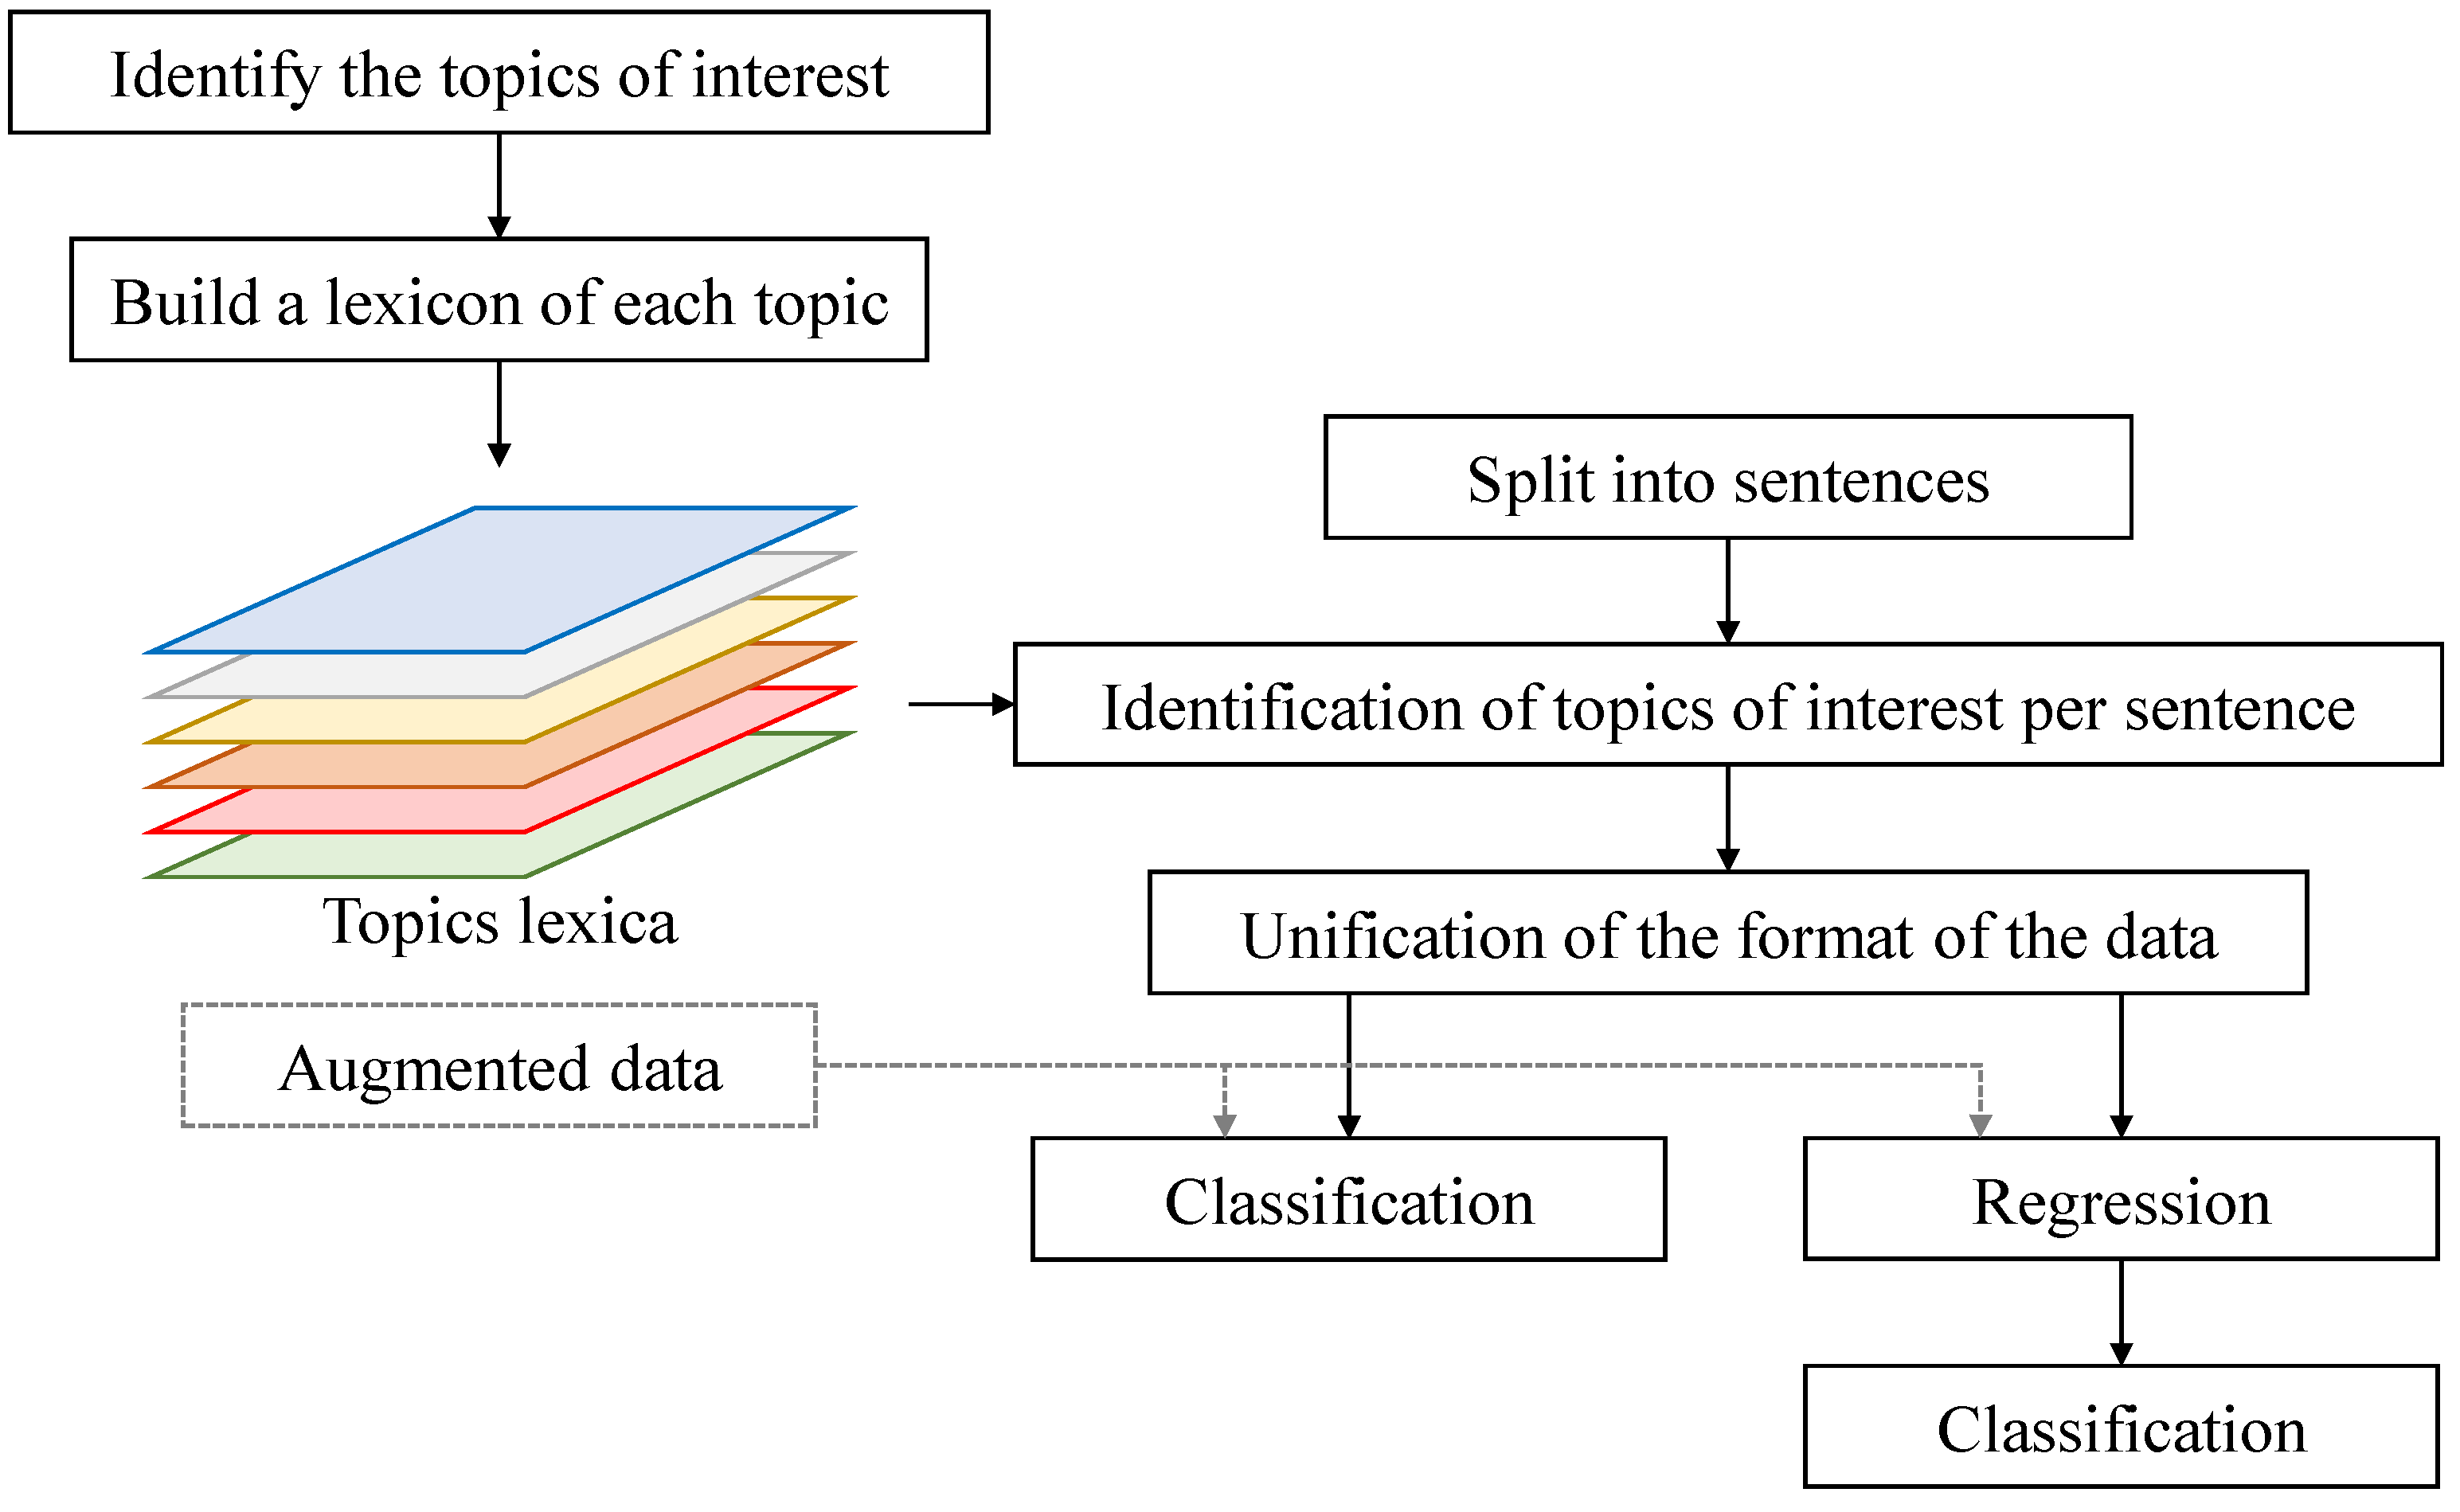
3.2. Proposed Approach
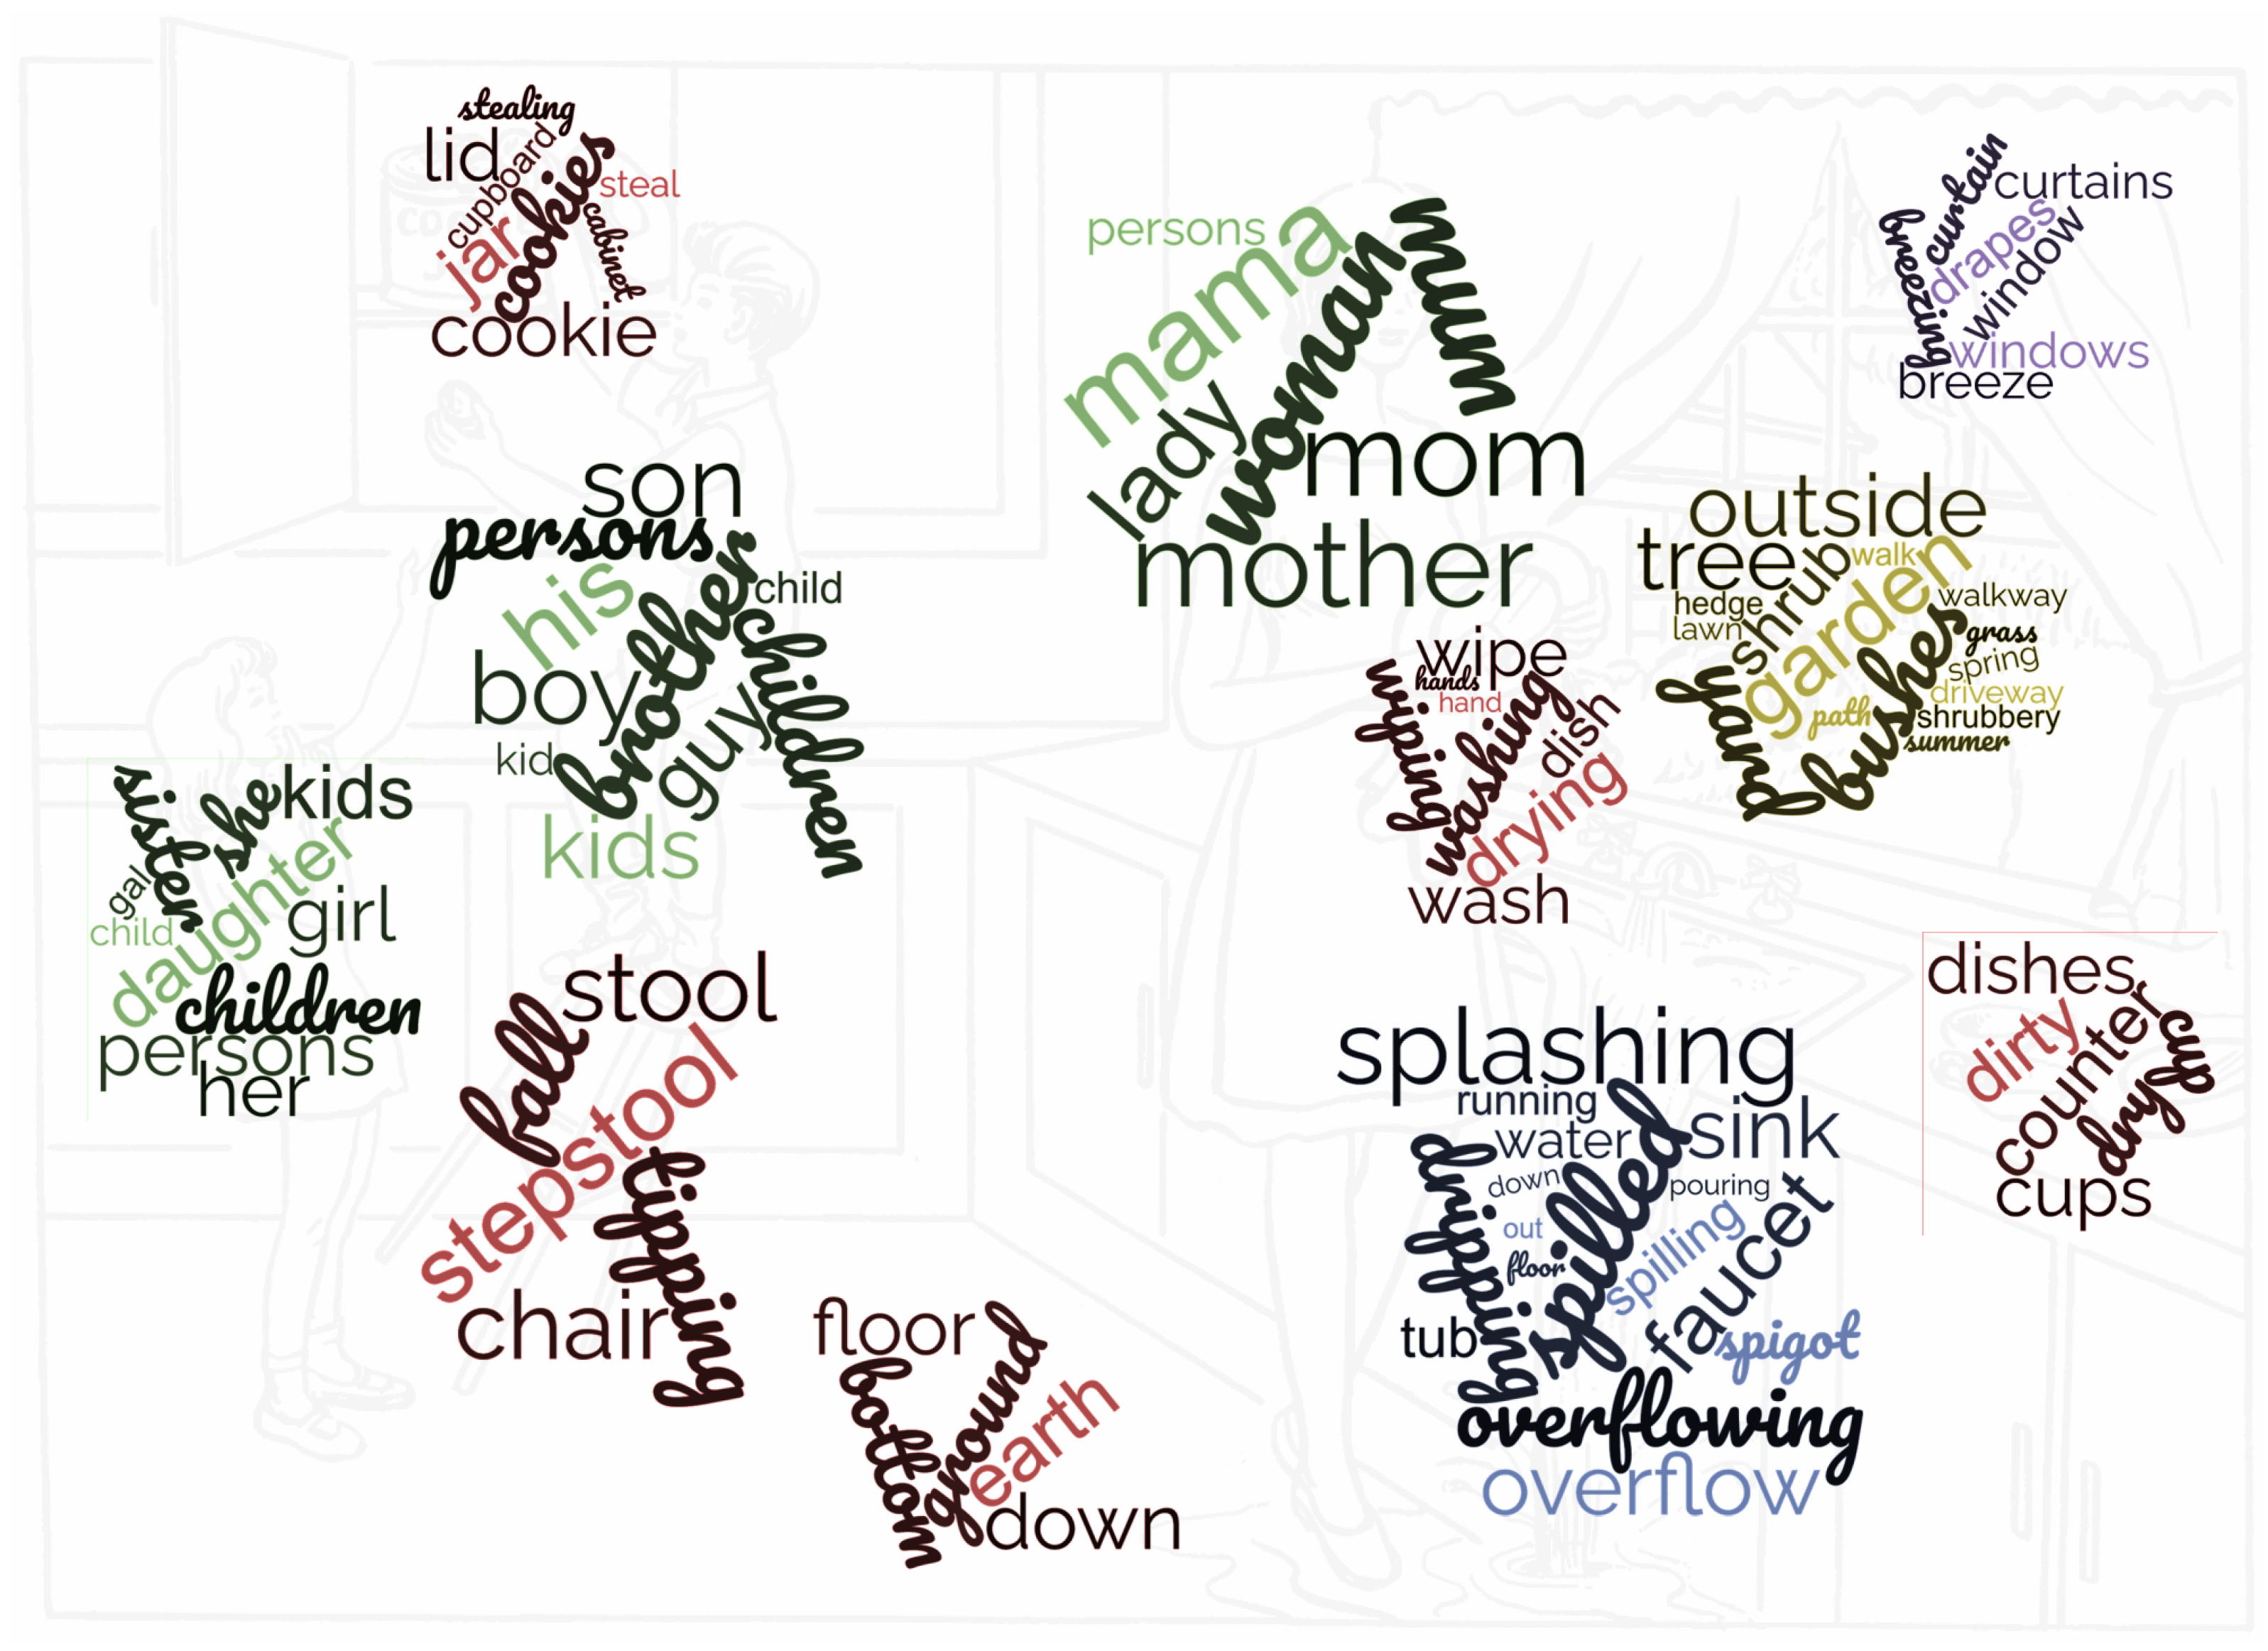
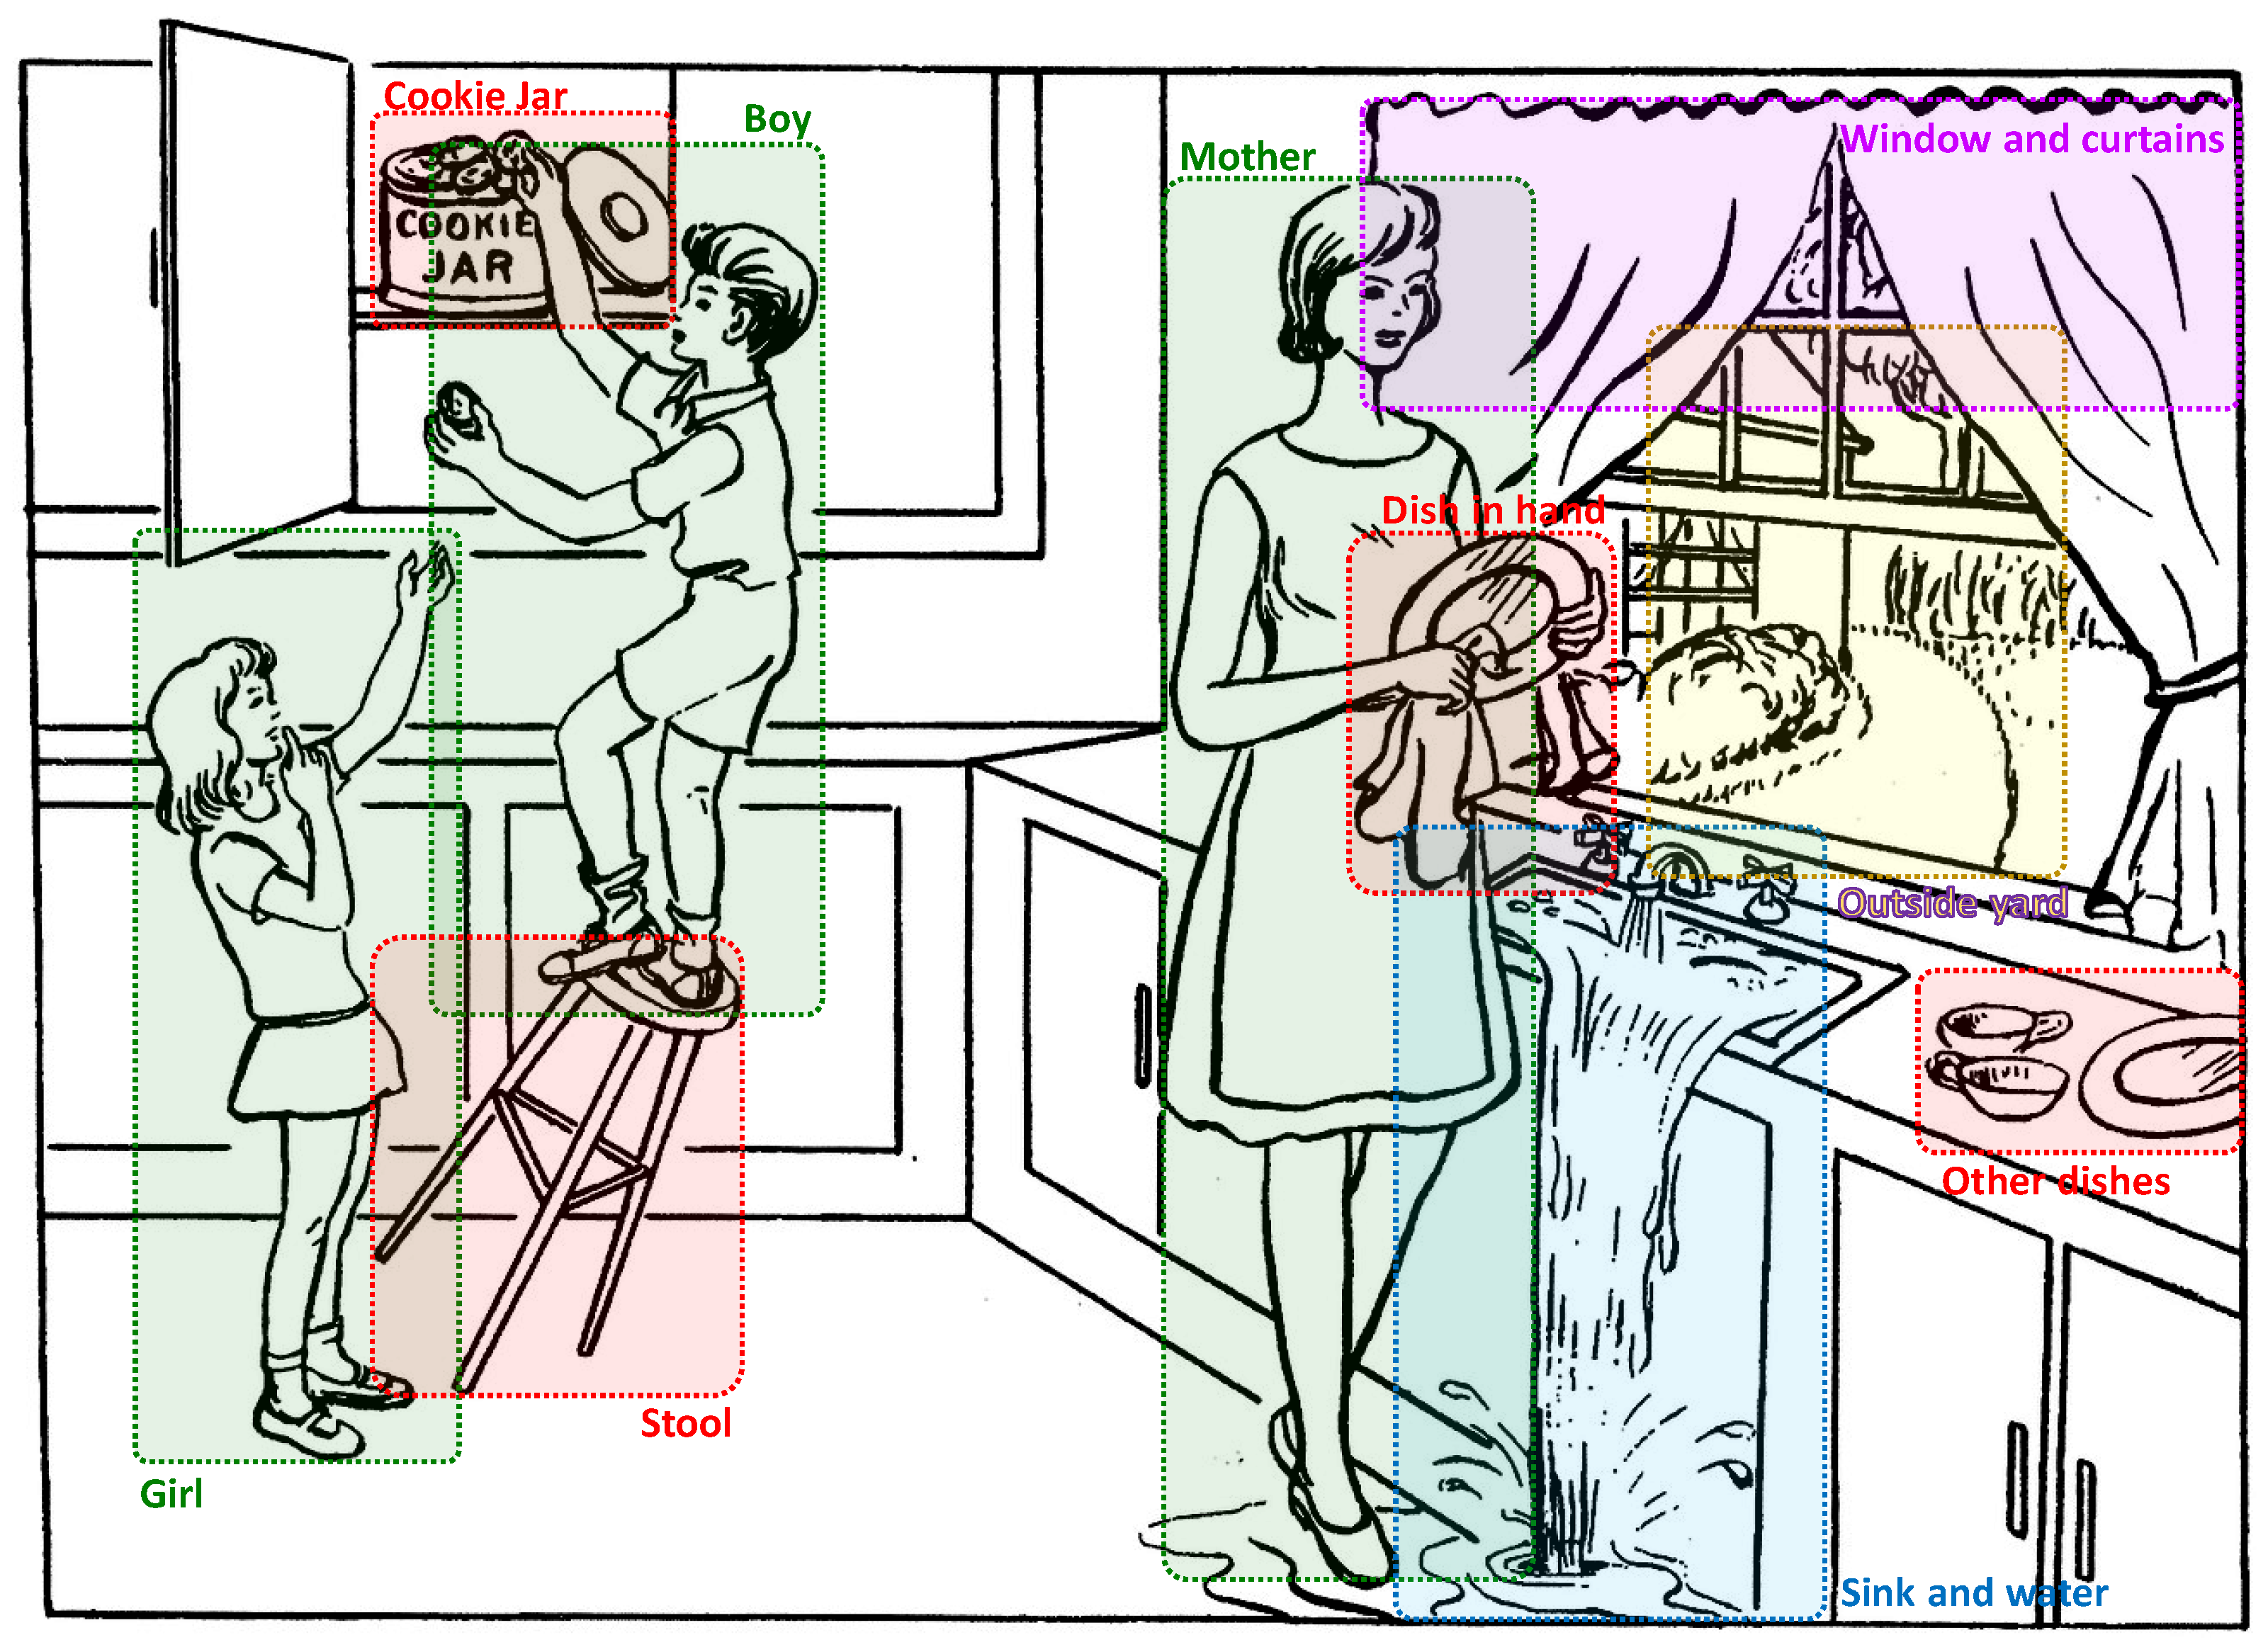
3.2.1. Dividing the Image into Regions
- Set 1: This is the set of words used by the subjects when addressing to themselves using expressions such as “I think”, “I might”, “my opinion”, etc.
- Set 2: This is the set of animate human objects that are referred to by the subject but are not present in the image, such as “father”, “husband”, etc.
- Set 3: This is the set of animate non-human objects that are referred to by the subject but are not present in the image, such as “pet”, etc.
- Set 4: This is the set of inanimate objects that are referred to by the subject but are not present in the image, such as “sun”, “sky”, etc.
- Set 5: This is the set of interjections showing hesitation or thinking, such as “umm”, “oh”, etc.
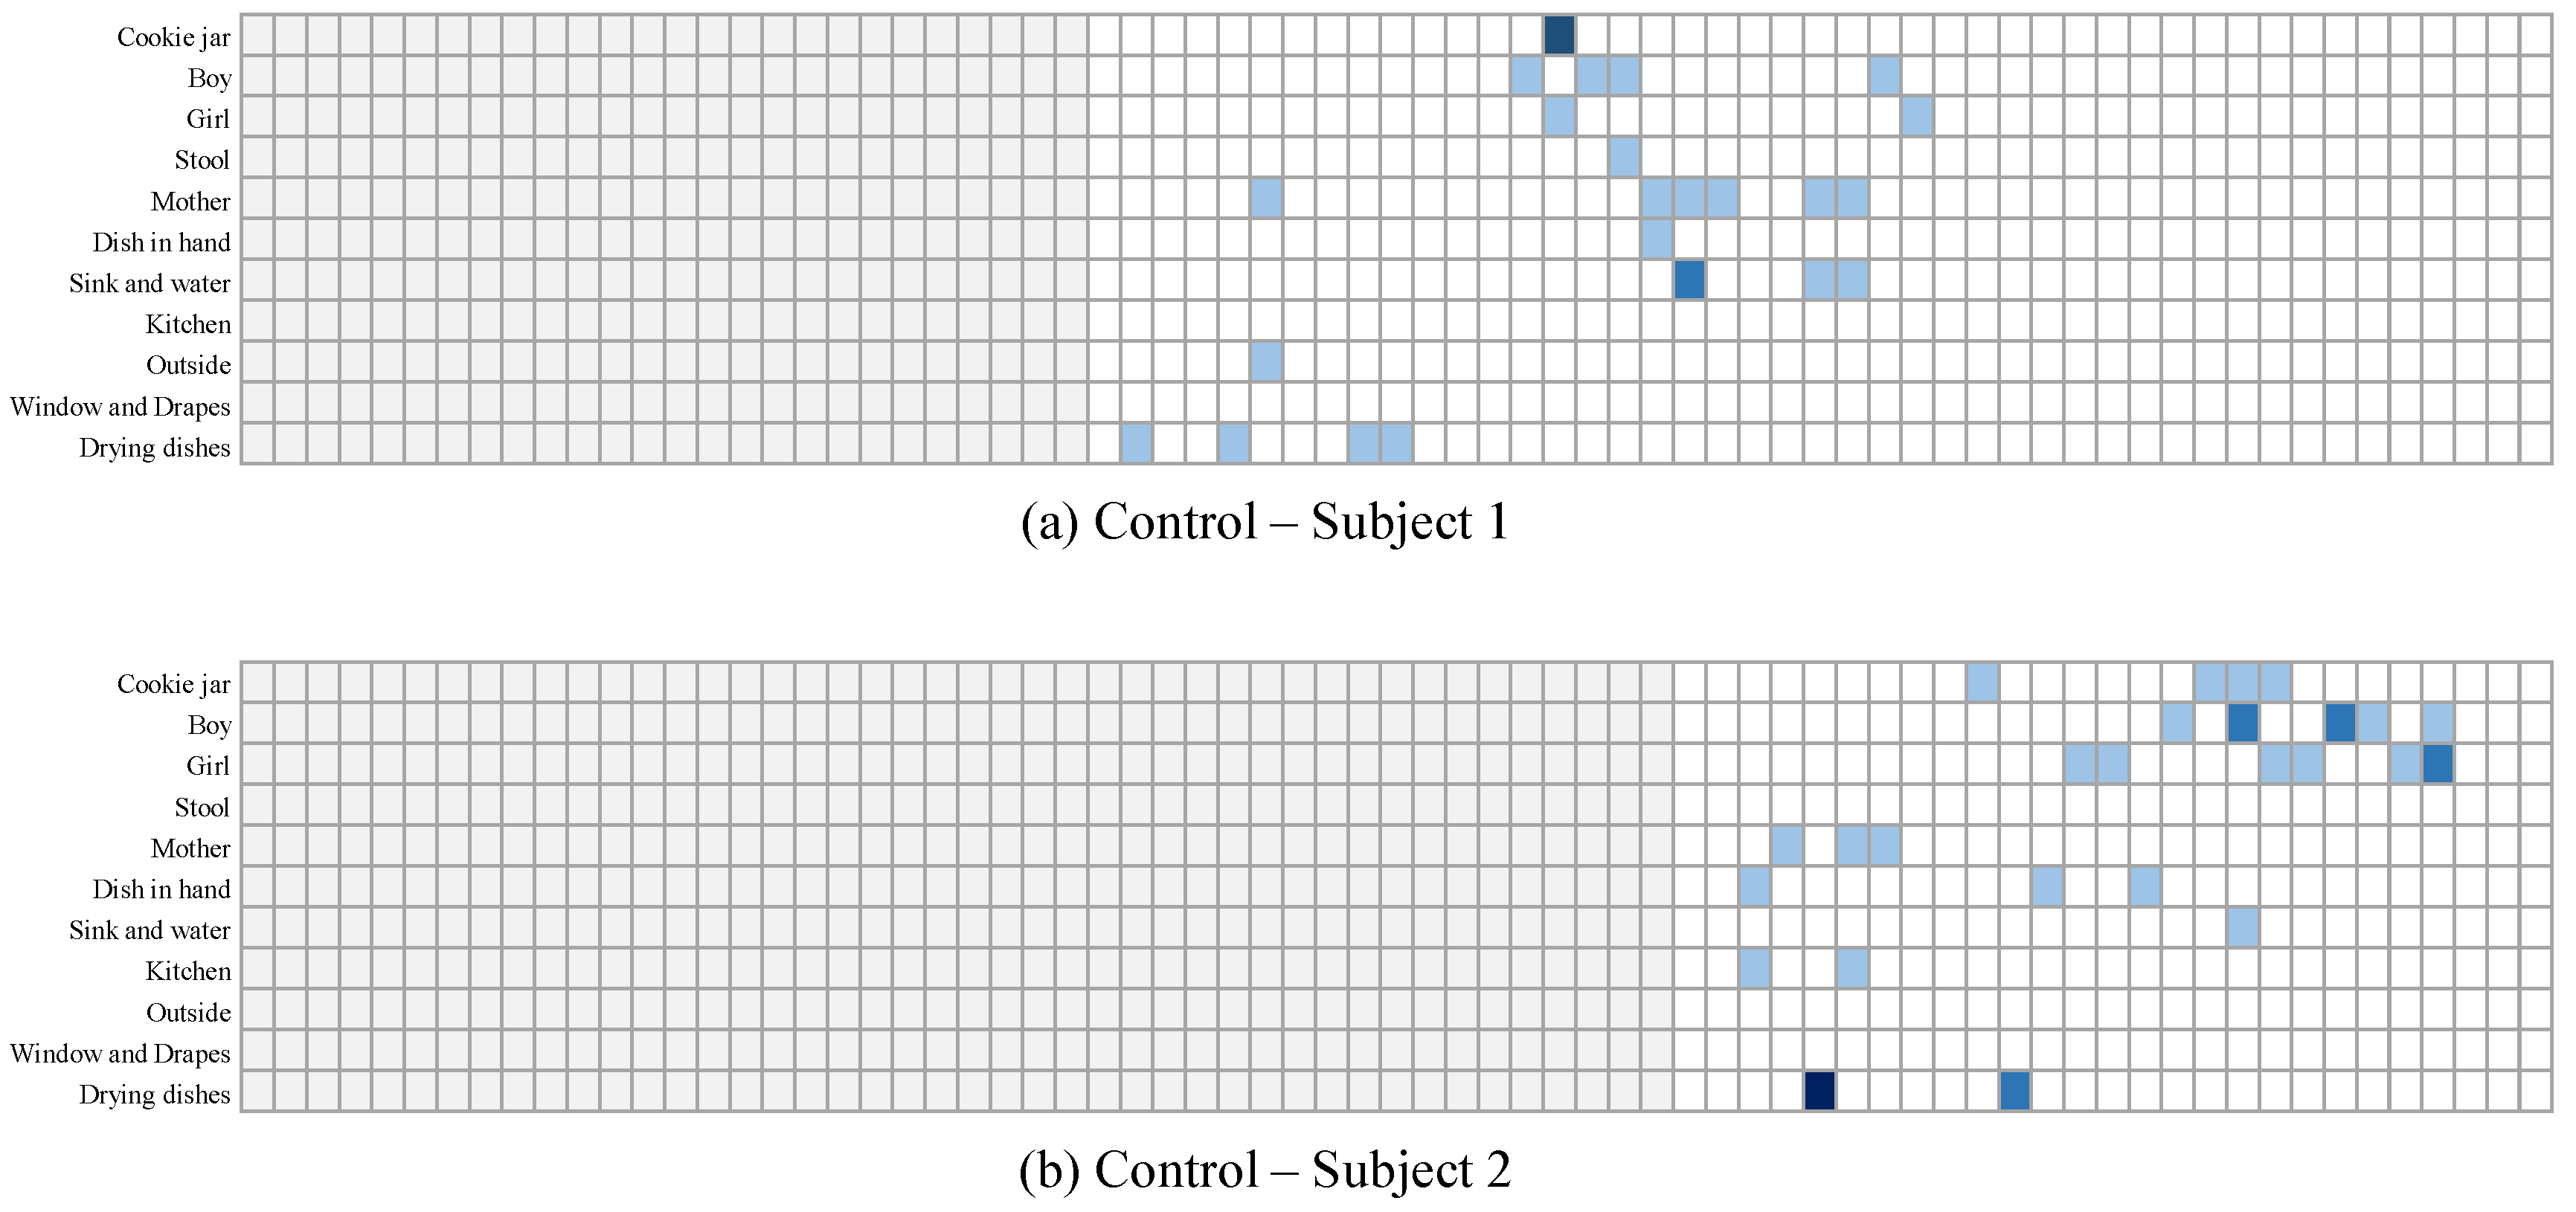
3.2.2. Tracking the Subject’s Focus over Time
3.2.3. Direct Classification of the Subjects
3.2.4. Regression-Based Classification
3.2.5. Data Augmentation
- Example 1: “In this … picture, there’s a … um … room, I believe. It’s disorganized, with water … spilling from the sink. And there are … um … children, yes, children present. They seem to be … doing something near the counter. Sorry, it’s a bit fuzzy.”
- Example 2: “I can see … a room, maybe a kitchen. There is this one … um … the boy … and water. Two children … yes, children there. They’re … um … A woman here.”
4. Data Collection and Evaluation Methods
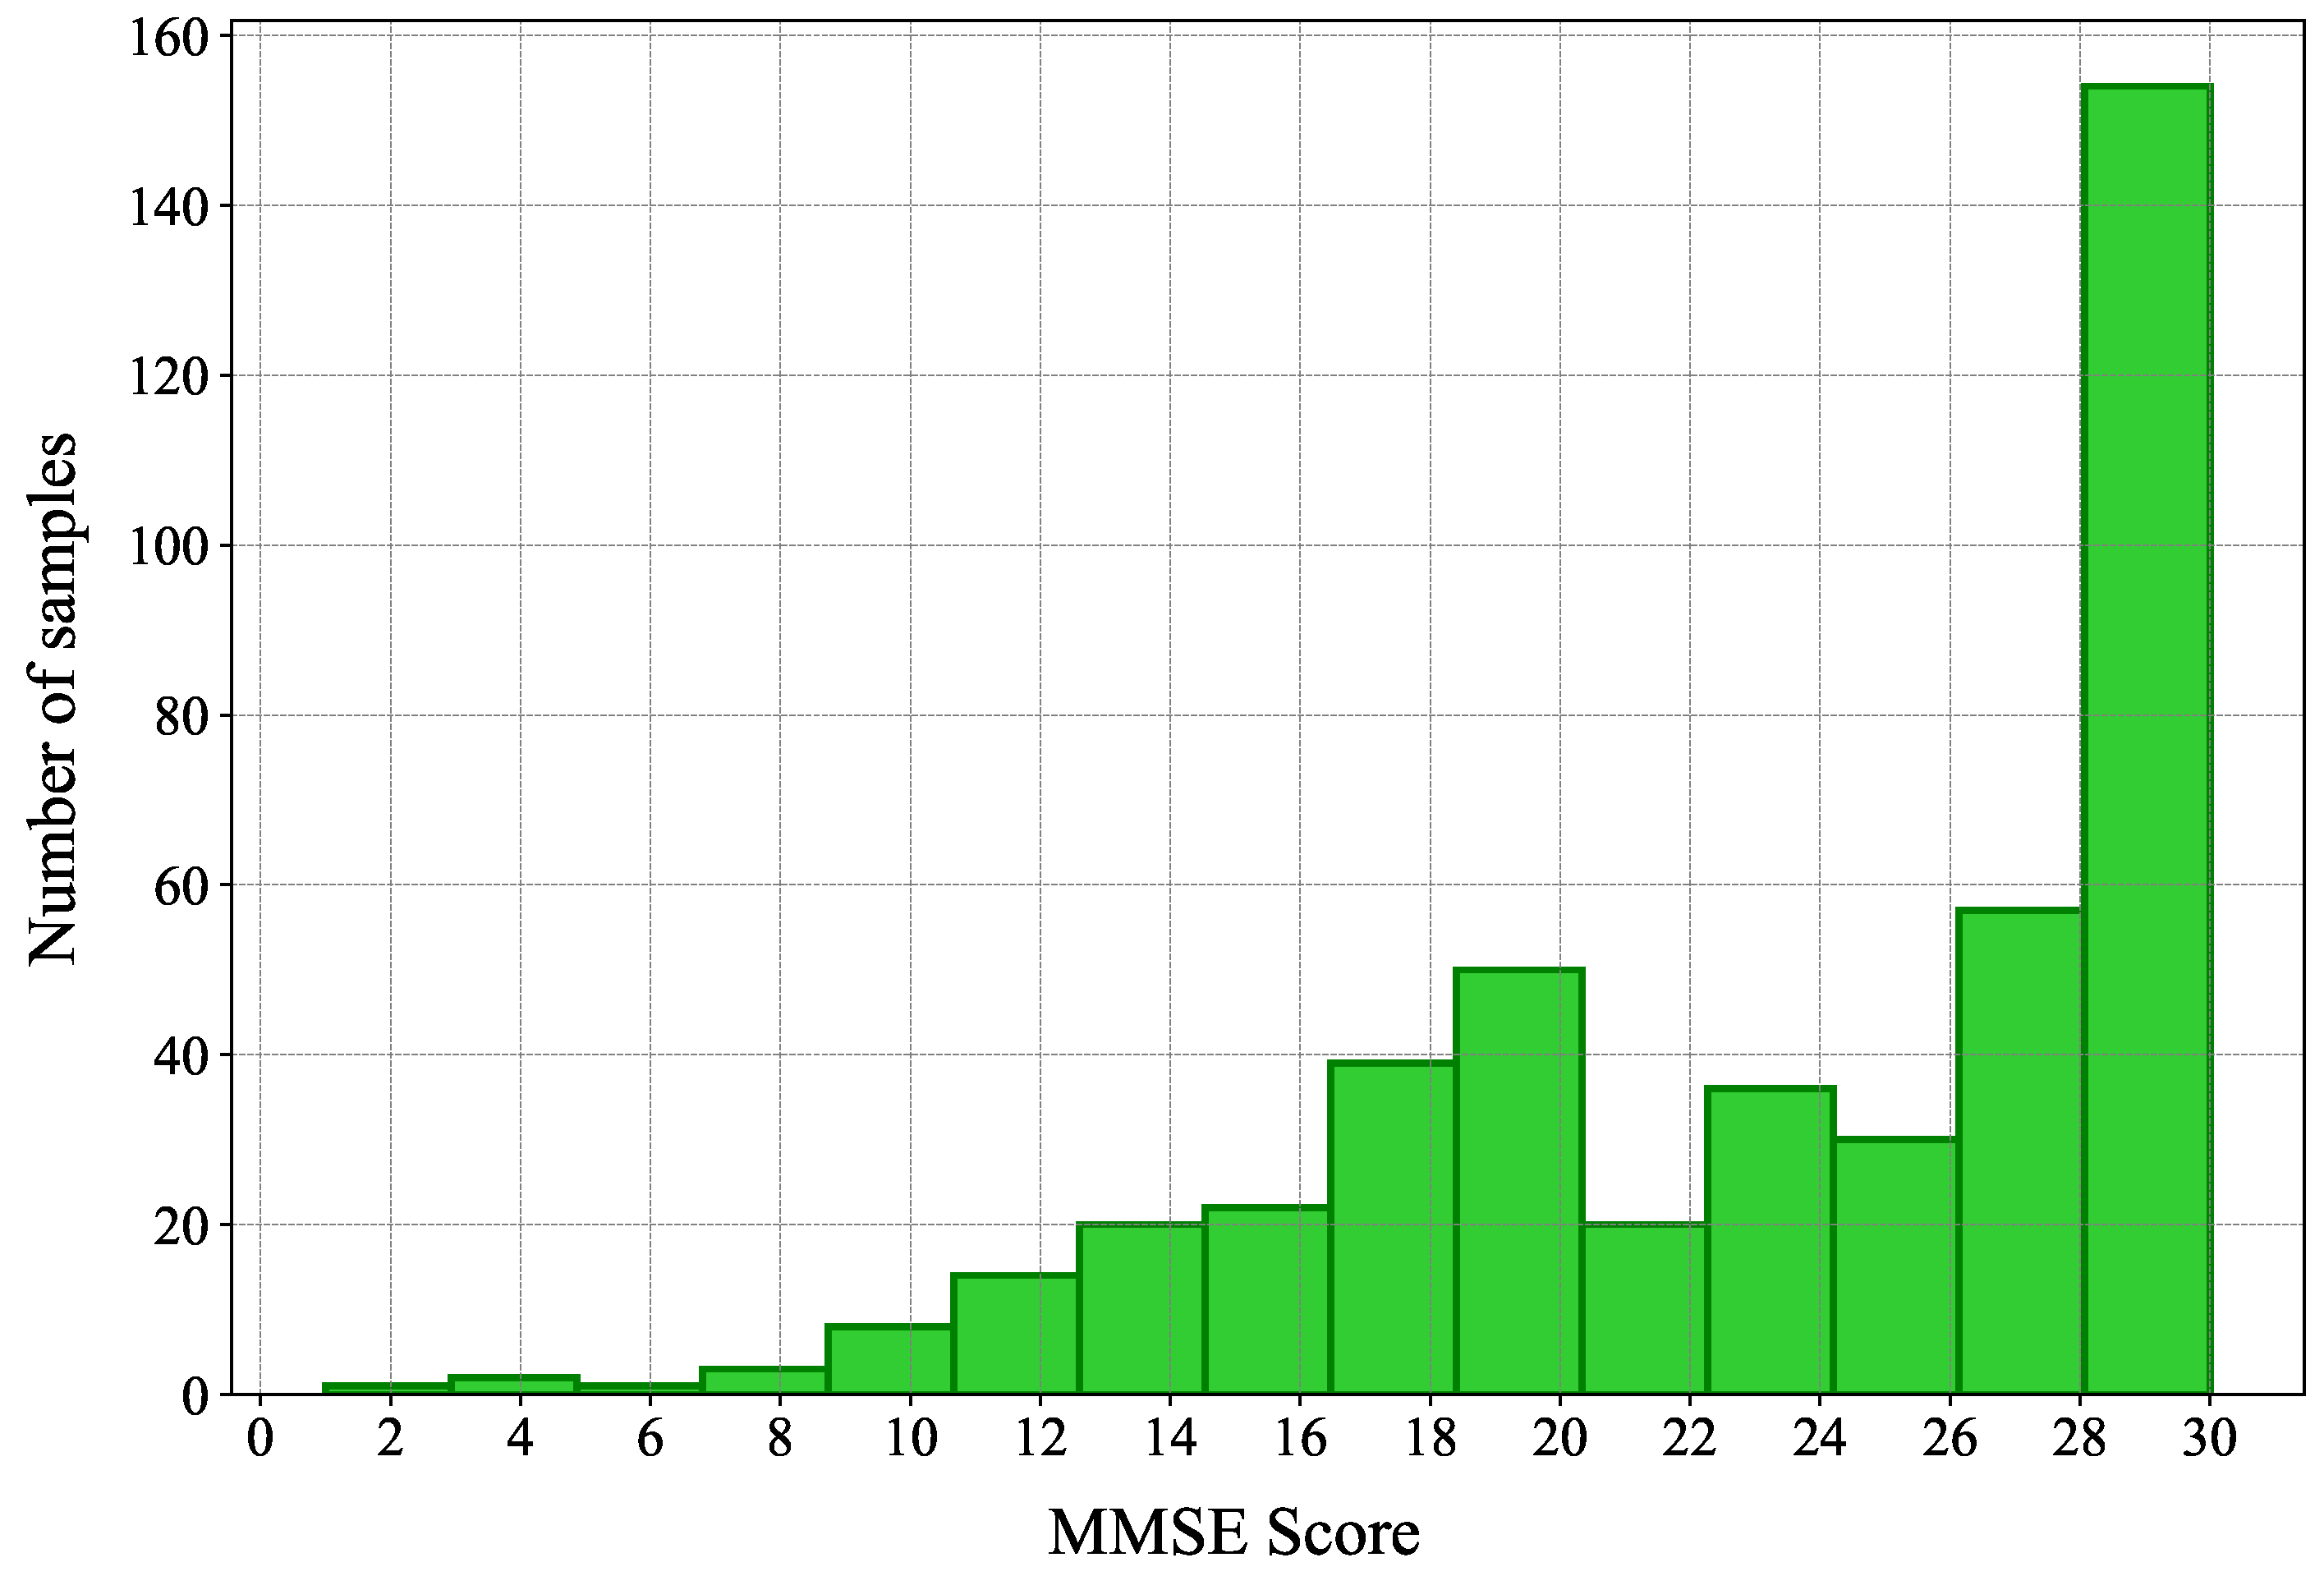
4.1. Data Set
4.2. Conventional Methods
- Wankerl et al. [8] proposed a simple approach that relies on n-grams to detect AD from spoken language.
- Zheng et al. [12] introduced the concept of simplified language models, which they developed with reference to part-of-speech tags to train the two-perplexity method [10]. They used such simplified language models to overcome the issue of the limitation of training data in the corpus used (i.e., the Pitt corpus of the DementiaBank [14]).
- GPT-4 was also queried with the text samples for all subjects with the purpose of identifying whether the sample is generated by a subject with dementia or a healthy one.
4.3. Evaluation Metrics
- Accuracy: this metric measures the ratio of the total number of instances (subjects or samples) correctly classified to the total number of samples.
- Precision: this metric is calculated for each class. It measures the ratio of instances correctly classified for that class to the instances classified as part of that class.
- Recall: this metric is also calculated for each class. It measures the ratio of instances correctly classified for that class to the total instances of that class.
- F1-Score: this metric combines the precision and the recall and is usually used when the data set is unbalanced, or to compare approaches to one another.
5. Experimental Results
5.1. Performance of the Proposed Method
5.1.1. Direct Classification-Based Dementia Detection
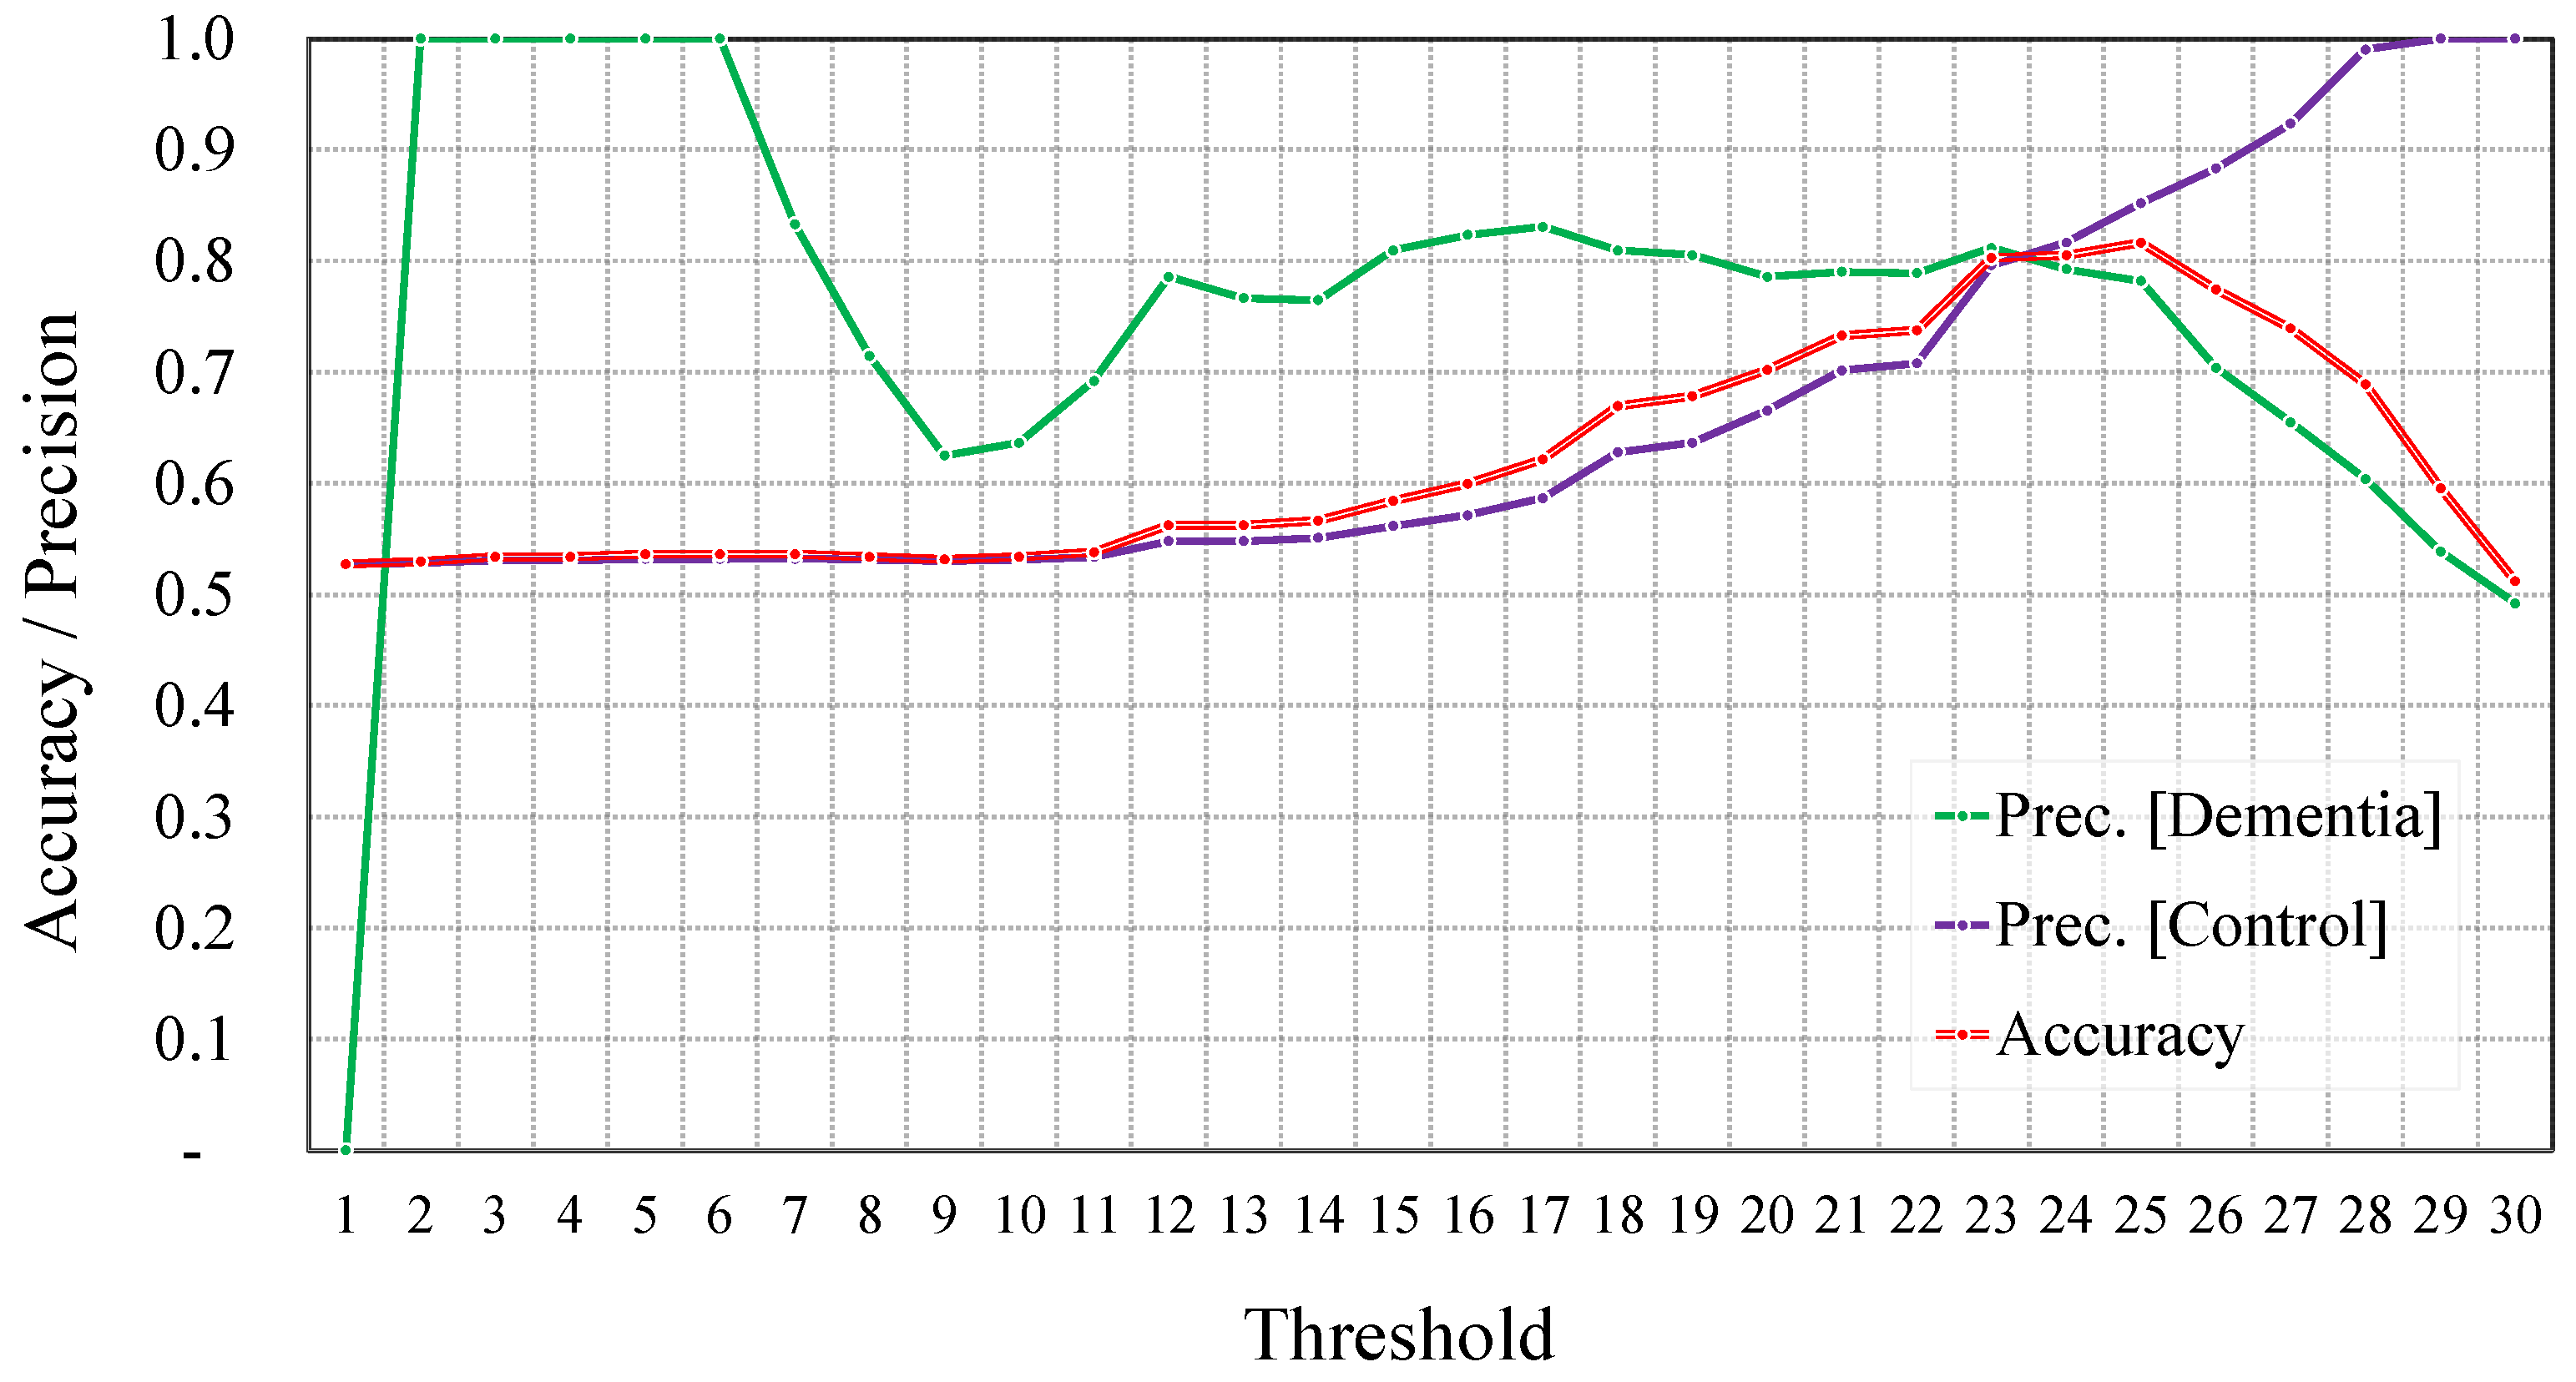
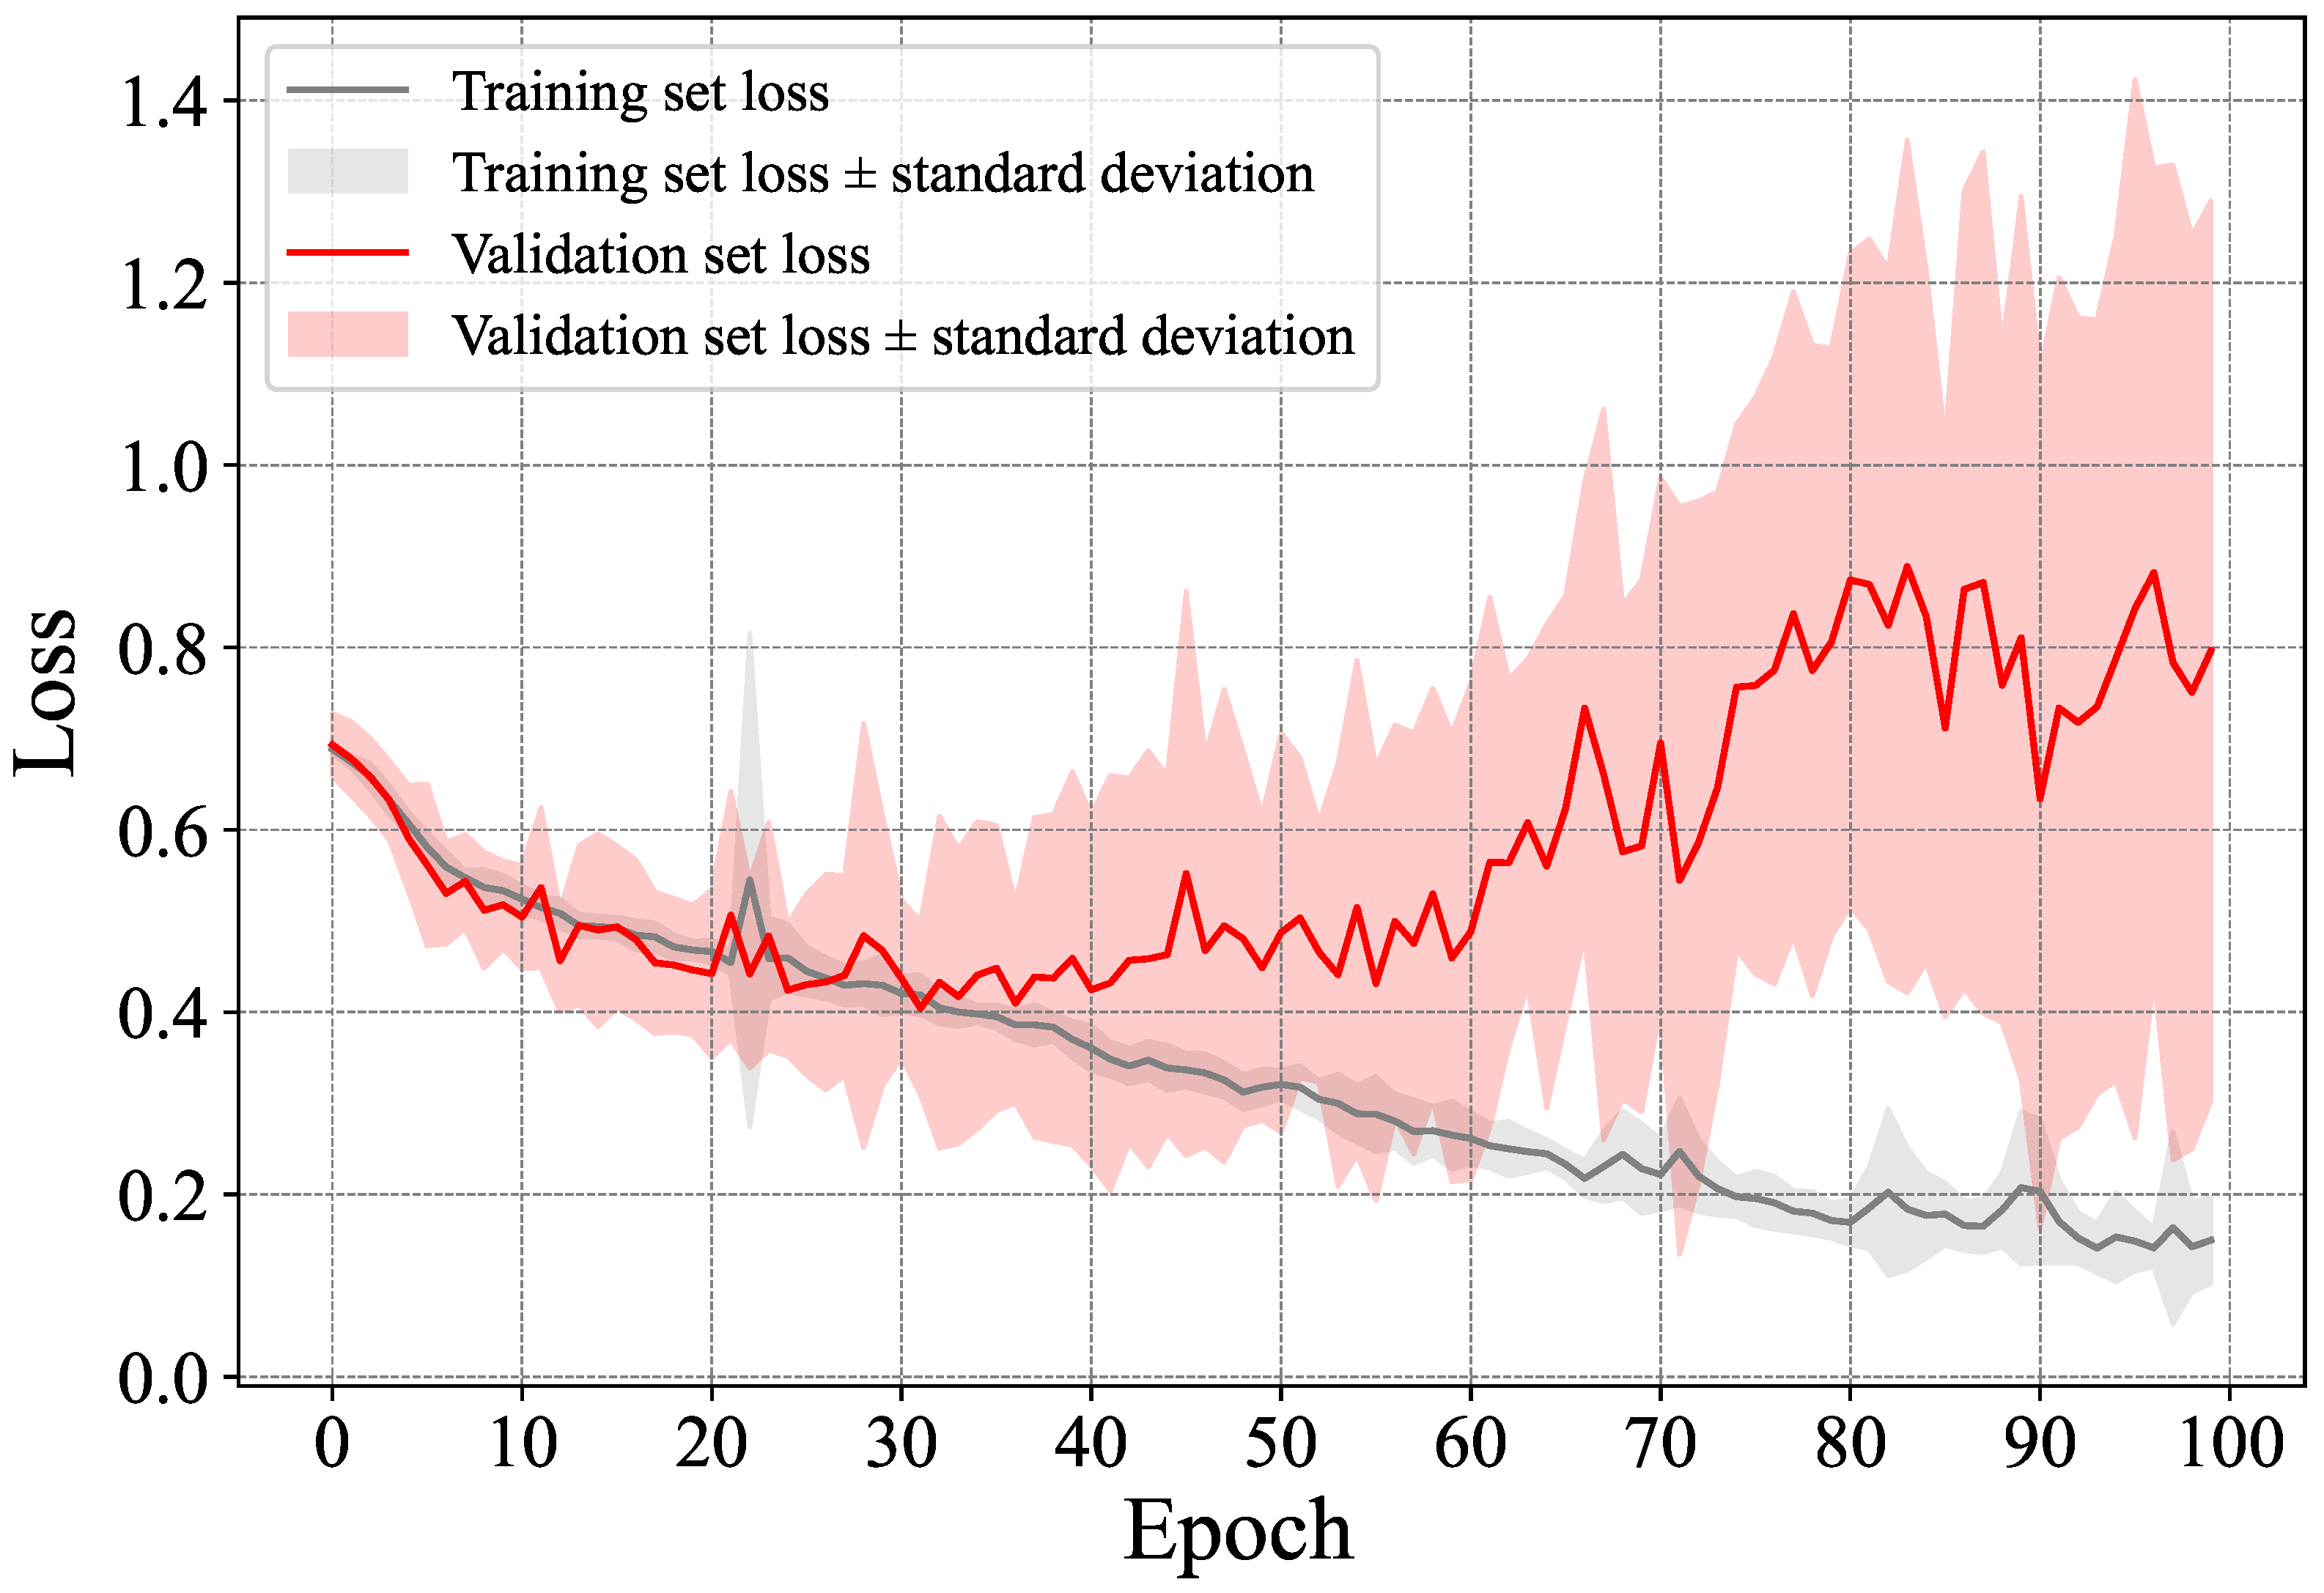
5.1.2. Regression-Based Dementia Detection
Before Data Augmentation
After Data Augmentation
Summary of Regression-Based Classification
5.2. Proposed Approach against Conventional Ones
5.3. Discussion
6. Conclusions
Author Contributions
Funding
Data Availability Statement
Conflicts of Interest
Abbreviations
| AD | Alzheimer’s Disease |
| ASR | Automatic Speech Recognition |
| AUC | Area Under the Curve |
| DL | Deep Learning |
| FN | False Negative |
| FP | False Positive |
| LSTM | Long Short-Term Memory |
| MAE | Mean Absolute Error |
| MCI | Mild Cognitive Impairment |
| MMSE | Mini-Mental State Examination |
| NLP | Natural Language Processing |
| NLTK | Natural Language Toolkit |
| NNLM | Neural Network Language Model |
| TP | True Positive |
| TN | True Negative |
References
- Bourgeois, J.A.; Seaman, J.; Servis, M.E. Delirium dementia and amnestic and other cognitive disorders. In The American Psychiatric Publishing Textbook of Psychiatry; American Psychiatric: Washington, DC, USA, 2008; p. 303. [Google Scholar]
- Saxena, S.; Funk, M.; Chisholm, D. World health assembly adopts comprehensive mental health action plan 2013–2020. Lancet 2013, 381, 1970–1971. [Google Scholar] [CrossRef] [PubMed]
- World Health Organization. Dementia—Key Facts. Available online: https://www.who.int/news-room/fact-sheets/detail/dementia (accessed on 1 November 2023).
- Valcour, V.G.; Masaki, K.H.; Curb, J.D.; Blanchette, P.L. The detection of dementia in the primary care setting. Arch. Intern. Med. 2000, 160, 2964–2968. [Google Scholar] [CrossRef] [PubMed]
- Ólafsdóttir, M.; Skoog, I.; Marcusson, J. Detection of dementia in primary care: The Linköping study. Dement. Geriatr. Cogn. Disord. 2000, 11, 223–229. [Google Scholar] [CrossRef] [PubMed]
- Grande, G.; Vetrano, D.L.; Mazzoleni, F.; Lovato, V.; Pata, M.; Cricelli, C.; Lapi, F. Detection and prediction of incident Alzheimer dementia over a 10-year or longer medical history: A population-based study in primary care. Dement. Geriatr. Cogn. Disord. 2021, 49, 384–389. [Google Scholar] [CrossRef] [PubMed]
- Murugan, S.; Venkatesan, C.; Sumithra, M.; Gao, X.Z.; Elakkiya, B.; Akila, M.; Manoharan, S. DEMNET: A deep learning model for early diagnosis of Alzheimer diseases and dementia from MR images. IEEE Access 2021, 9, 90319–90329. [Google Scholar] [CrossRef]
- Wankerl, S.; Nöth, E.; Evert, S. An N-Gram Based Approach to the Automatic Diagnosis of Alzheimer’s Disease from Spoken Language. In Proceedings of the Interspeech, Stockholm, Sweden, 20–24 August 2017; pp. 3162–3166. [Google Scholar]
- Fritsch, J.; Wankerl, S.; Nöth, E. Automatic diagnosis of Alzheimer’s disease using neural network language models. In Proceedings of the ICASSP 2019—2019 IEEE International Conference on Acoustics, Speech and Signal Processing (ICASSP), Brighton, UK, 12–17 May 2019; pp. 5841–5845. [Google Scholar]
- Cohen, T.; Pakhomov, S. A tale of two perplexities: Sensitivity of neural language models to lexical retrieval deficits in dementia of the Alzheimer’s type. arXiv 2020, arXiv:2005.03593. [Google Scholar]
- Bouazizi, M.; Zheng, C.; Ohtsuki, T. Dementia Detection Using Language Models and Transfer Learning. In Proceedings of the 2022 5th International Conference on Software Engineering and Information Management (ICSIM), ICSIM 2022, New York, NY, USA, 21–23 January 2022; pp. 152–157. [Google Scholar] [CrossRef]
- Zheng, C.; Bouazizi, M.; Ohtsuki, T. An Evaluation on Information Composition in Dementia Detection Based on Speech. IEEE Access 2022, 10, 92294–92306. [Google Scholar] [CrossRef]
- Jang, H.; Soroski, T.; Rizzo, M.; Barral, O.; Harisinghani, A.; Newton-Mason, S.; Granby, S.; Stutz da Cunha Vasco, T.M.; Lewis, C.; Tutt, P.; et al. Classification of Alzheimer’s disease leveraging multi-task machine learning analysis of speech and eye-movement data. Front. Hum. Neurosci. 2021, 15, 716670. [Google Scholar] [CrossRef] [PubMed]
- MacWhinney, B. TalkBank. 1999. Available online: http://talkbank.org (accessed on 1 December 2023).
- Brown, T.; Mann, B.; Ryder, N.; Subbiah, M.; Kaplan, J.D.; Dhariwal, P.; Neelakantan, A.; Shyam, P.; Sastry, G.; Askell, A.; et al. Language Models are Few-Shot Learners. In Proceedings of the Advances in Neural Information Processing Systems, Virtual, 6–12 December 2020; Larochelle, H., Ranzato, M., Hadsell, R., Balcan, M., Lin, H., Eds.; Curran Associates, Inc.: Red Hook, NY, USA, 2020; Volume 33, pp. 1877–1901. [Google Scholar]
- Roark, B.; Mitchell, M.; Hosom, J.P.; Hollingshead, K.; Kaye, J. Spoken language derived measures for detecting mild cognitive impairment. IEEE Trans. Audio Speech Lang. Process. 2011, 19, 2081–2090. [Google Scholar] [CrossRef] [PubMed]
- Zhu, Y.; Liang, X.; Batsis, J.A.; Roth, R.M. Exploring deep transfer learning techniques for Alzheimer’s dementia detection. Front. Comput. Sci. 2021, 3, 624683. [Google Scholar] [CrossRef] [PubMed]
- Jarrold, W.; Peintner, B.; Wilkins, D.; Vergryi, D.; Richey, C.; Gorno-Tempini, M.L.; Ogar, J. Aided diagnosis of dementia type through computer-based analysis of spontaneous speech. In Proceedings of the Workshop on Computational Linguistics and Clinical Psychology: From Linguistic Signal to Clinical Reality, Baltimore, MD, USA, 22–27 June 2014; pp. 27–37. [Google Scholar]
- Luz, S.; de la Fuente, S.; Albert, P. A method for analysis of patient speech in dialogue for dementia detection. arXiv 2018, arXiv:1811.09919. [Google Scholar]
- Tóth, L.; Hoffmann, I.; Gosztolya, G.; Vincze, V.; Szatlóczki, G.; Bánréti, Z.; Pákáski, M.; Kálmán, J. A speech recognition-based solution for the automatic detection of mild cognitive impairment from spontaneous speech. Curr. Alzheimer Res. 2018, 15, 130–138. [Google Scholar] [CrossRef] [PubMed]
- König, A.; Satt, A.; Sorin, A.; Hoory, R.; Toledo-Ronen, O.; Derreumaux, A.; Manera, V.; Verhey, F.; Aalten, P.; Robert, P.H.; et al. Automatic speech analysis for the assessment of patients with predementia and Alzheimer’s disease. Alzheimer’s Dement. Diagn. Assess. Dis. Monit. 2015, 1, 112–124. [Google Scholar] [CrossRef] [PubMed]
- Sundermeyer, M.; Schlüter, R.; Ney, H. rwthlm—The RWTH Aachen University neural network language modeling toolkit. In Proceedings of the Fifteenth Annual Conference of the International Speech Communication Association, Singapore, 14–18 September 2014. [Google Scholar]
- Merity, S.; Keskar, N.S.; Socher, R. Regularizing and optimizing LSTM language models. arXiv 2017, arXiv:1708.02182. [Google Scholar]
- Rodrigues Makiuchi, M.; Warnita, T.; Uto, K.; Shinoda, K. Multimodal fusion of bert-cnn and gated cnn representations for depression detection. In Proceedings of the 9th International on Audio/Visual Emotion Challenge and Workshop, Nice, France, 21 October 2019; pp. 55–63. [Google Scholar]
- Rutowski, T.; Shriberg, E.; Harati, A.; Lu, Y.; Chlebek, P.; Oliveira, R. Depression and anxiety prediction using deep language models and transfer learning. In Proceedings of the 2020 7th International Conference on Behavioural and Social Computing (BESC), Bournemouth, UK, 5–7 November 2020; pp. 1–6. [Google Scholar]
- Orabi, A.H.; Buddhitha, P.; Orabi, M.H.; Inkpen, D. Deep learning for depression detection of twitter users. In Proceedings of the Fifth Workshop on Computational Linguistics and Clinical Psychology: From Keyboard to Clinic, New Orleans, LA, USA, 5 June 2018; pp. 88–97. [Google Scholar]
- Hayati, M.F.M.; Ali, M.A.M.; Rosli, A.N.M. Depression Detection on Malay Dialects Using GPT-3. In Proceedings of the 2022 IEEE-EMBS Conference on Biomedical Engineering and Sciences (IECBES), Kuala Lumpur, Malaysia, 7–9 December 2022; pp. 360–364. [Google Scholar]
- Attas, D.; Power, N.; Smithies, J.; Bee, C.; Aadahl, V.; Kellett, S.; Blackmore, C.; Christensen, H. Automated Detection of the Competency of Delivering Guided Self-Help for Anxiety via Speech and Language Processing. Appl. Sci. 2022, 12, 8608. [Google Scholar] [CrossRef]
- Jan, Z.; Ai-Ansari, N.; Mousa, O.; Abd-Alrazaq, A.; Ahmed, A.; Alam, T.; Househ, M. The role of machine learning in diagnosing bipolar disorder: Scoping review. J. Med. Internet Res. 2021, 23, e29749. [Google Scholar] [CrossRef] [PubMed]
- Zhang, T.; Schoene, A.M.; Ji, S.; Ananiadou, S. Natural language processing applied to mental illness detection: A narrative review. NPJ Digit. Med. 2022, 5, 46. [Google Scholar] [CrossRef] [PubMed]
- Devlin, J.; Chang, M.W.; Lee, K.; Toutanova, K. Bert: Pre-training of deep bidirectional transformers for language understanding. arXiv 2018, arXiv:1810.04805. [Google Scholar]
- Howard, J.; Ruder, S. Universal language model fine-tuning for text classification. arXiv 2018, arXiv:1801.06146. [Google Scholar]
- Pradier, C.; Sakarovitch, C.; Le Duff, F.; Layese, R.; Metelkina, A.; Anthony, S.; Tifratene, K.; Robert, P. The Mini Mental State Examination at the Time of Alzheimer’s Disease and Related Disorders Diagnosis, According to Age, Education, Gender and Place of Residence: A Cross-Sectional Study among the French National Alzheimer Database. PLoS ONE 2014, 9, e103630. [Google Scholar] [CrossRef] [PubMed]


| Parameter | Significance | Value |
|---|---|---|
| Input shape | ||
| Hidden units in the LSTM | 60 | |
| Number of neurons in the first dense layer | 20 |
| Counts | Dementia | Control |
|---|---|---|
| Before augmentation | ||
| Total number of subjects | 194 | 98 |
| Total number of samples | 309 | 243 |
| Average samples per subject | 1.59 | 2.48 |
| After augmentation | ||
| Total number of subjects | 204 | 98 |
| Total number of samples | 359 | 243 |
| Average samples per subject | 1.76 | 2.48 |
| Counts | 0–9 | 10–18 | 19–24 | 25–30 |
|---|---|---|---|---|
| Before augmentation | ||||
| Total number of subjects | 7 | 90 | 85 | 138 |
| Total number of samples | 7 | 103 | 106 | 241 |
| Average samples per subject | 1 | 1.14 | 1.25 | 1.75 |
| After augmentation | ||||
| Total number of subjects | 17 | 96 | 91 | 138 |
| Total number of samples | 57 | 133 | 136 | 241 |
| Average samples per subject | 3.35 | 1.40 | 1.49 | 1.75 |
| Model/Metric | Accuracy | Precision | Recall | F1-Score |
|---|---|---|---|---|
| Before augmentation | ||||
| Dementia (subjects) | 84.02% | 89.56% | 84.02% | 86.70% |
| Control (subjects) | 80.61% | 71.82% | 80.61% | 75.96% |
| Overall (subjects) | 82.88% | 83.61% | 82.88% | 83.24% |
| Dementia (samples) | 81.23% | 84.23% | 81.23% | 82.70% |
| Control (samples) | 80.66% | 77.17% | 80.66% | 78.87% |
| Overall (samples) | 80.98% | 81.12% | 80.98% | 81.05% |
| After augmentation | ||||
| Dementia (subjects) | 85.57% | 89.25% | 85.57% | 87.37% |
| Control (subjects) | 79.59% | 73.58% | 79.59% | 76.47% |
| Overall (subjects) | 83.56% | 83.99% | 83.56% | 83.78% |
| Dementia (samples) | 84.14% | 83.87% | 84.14% | 84.01% |
| Control (samples) | 79.42% | 79.75% | 79.42% | 79.59% |
| Overall (samples) | 82.07% | 82.06% | 82.07% | 82.06% |
| Model/Metric | Accuracy | Precision | Recall | F1-Score |
|---|---|---|---|---|
| Before augmentation | ||||
| Count (subjects) | 82.88% | 83.61% | 82.88% | 83.24% |
| Presence (subjects) | 75.34% | 76.79% | 75.34% | 76.06% |
| Count (samples) | 80.98% | 81.12% | 80.89% | 81.05% |
| Presence (samples) | 72.10% | 72.29% | 72.10% | 72.20% |
| After augmentation | ||||
| Count (subjects) | 83.56% | 83.99% | 83.56% | 83.78% |
| Presence (subjects) | 76.37% | 77.16% | 76.37% | 76.76% |
| Count (samples) | 82.07% | 82.06% | 82.07% | 82.06% |
| Presence (samples) | 73.91% | 74.13% | 73.91% | 74.02% |
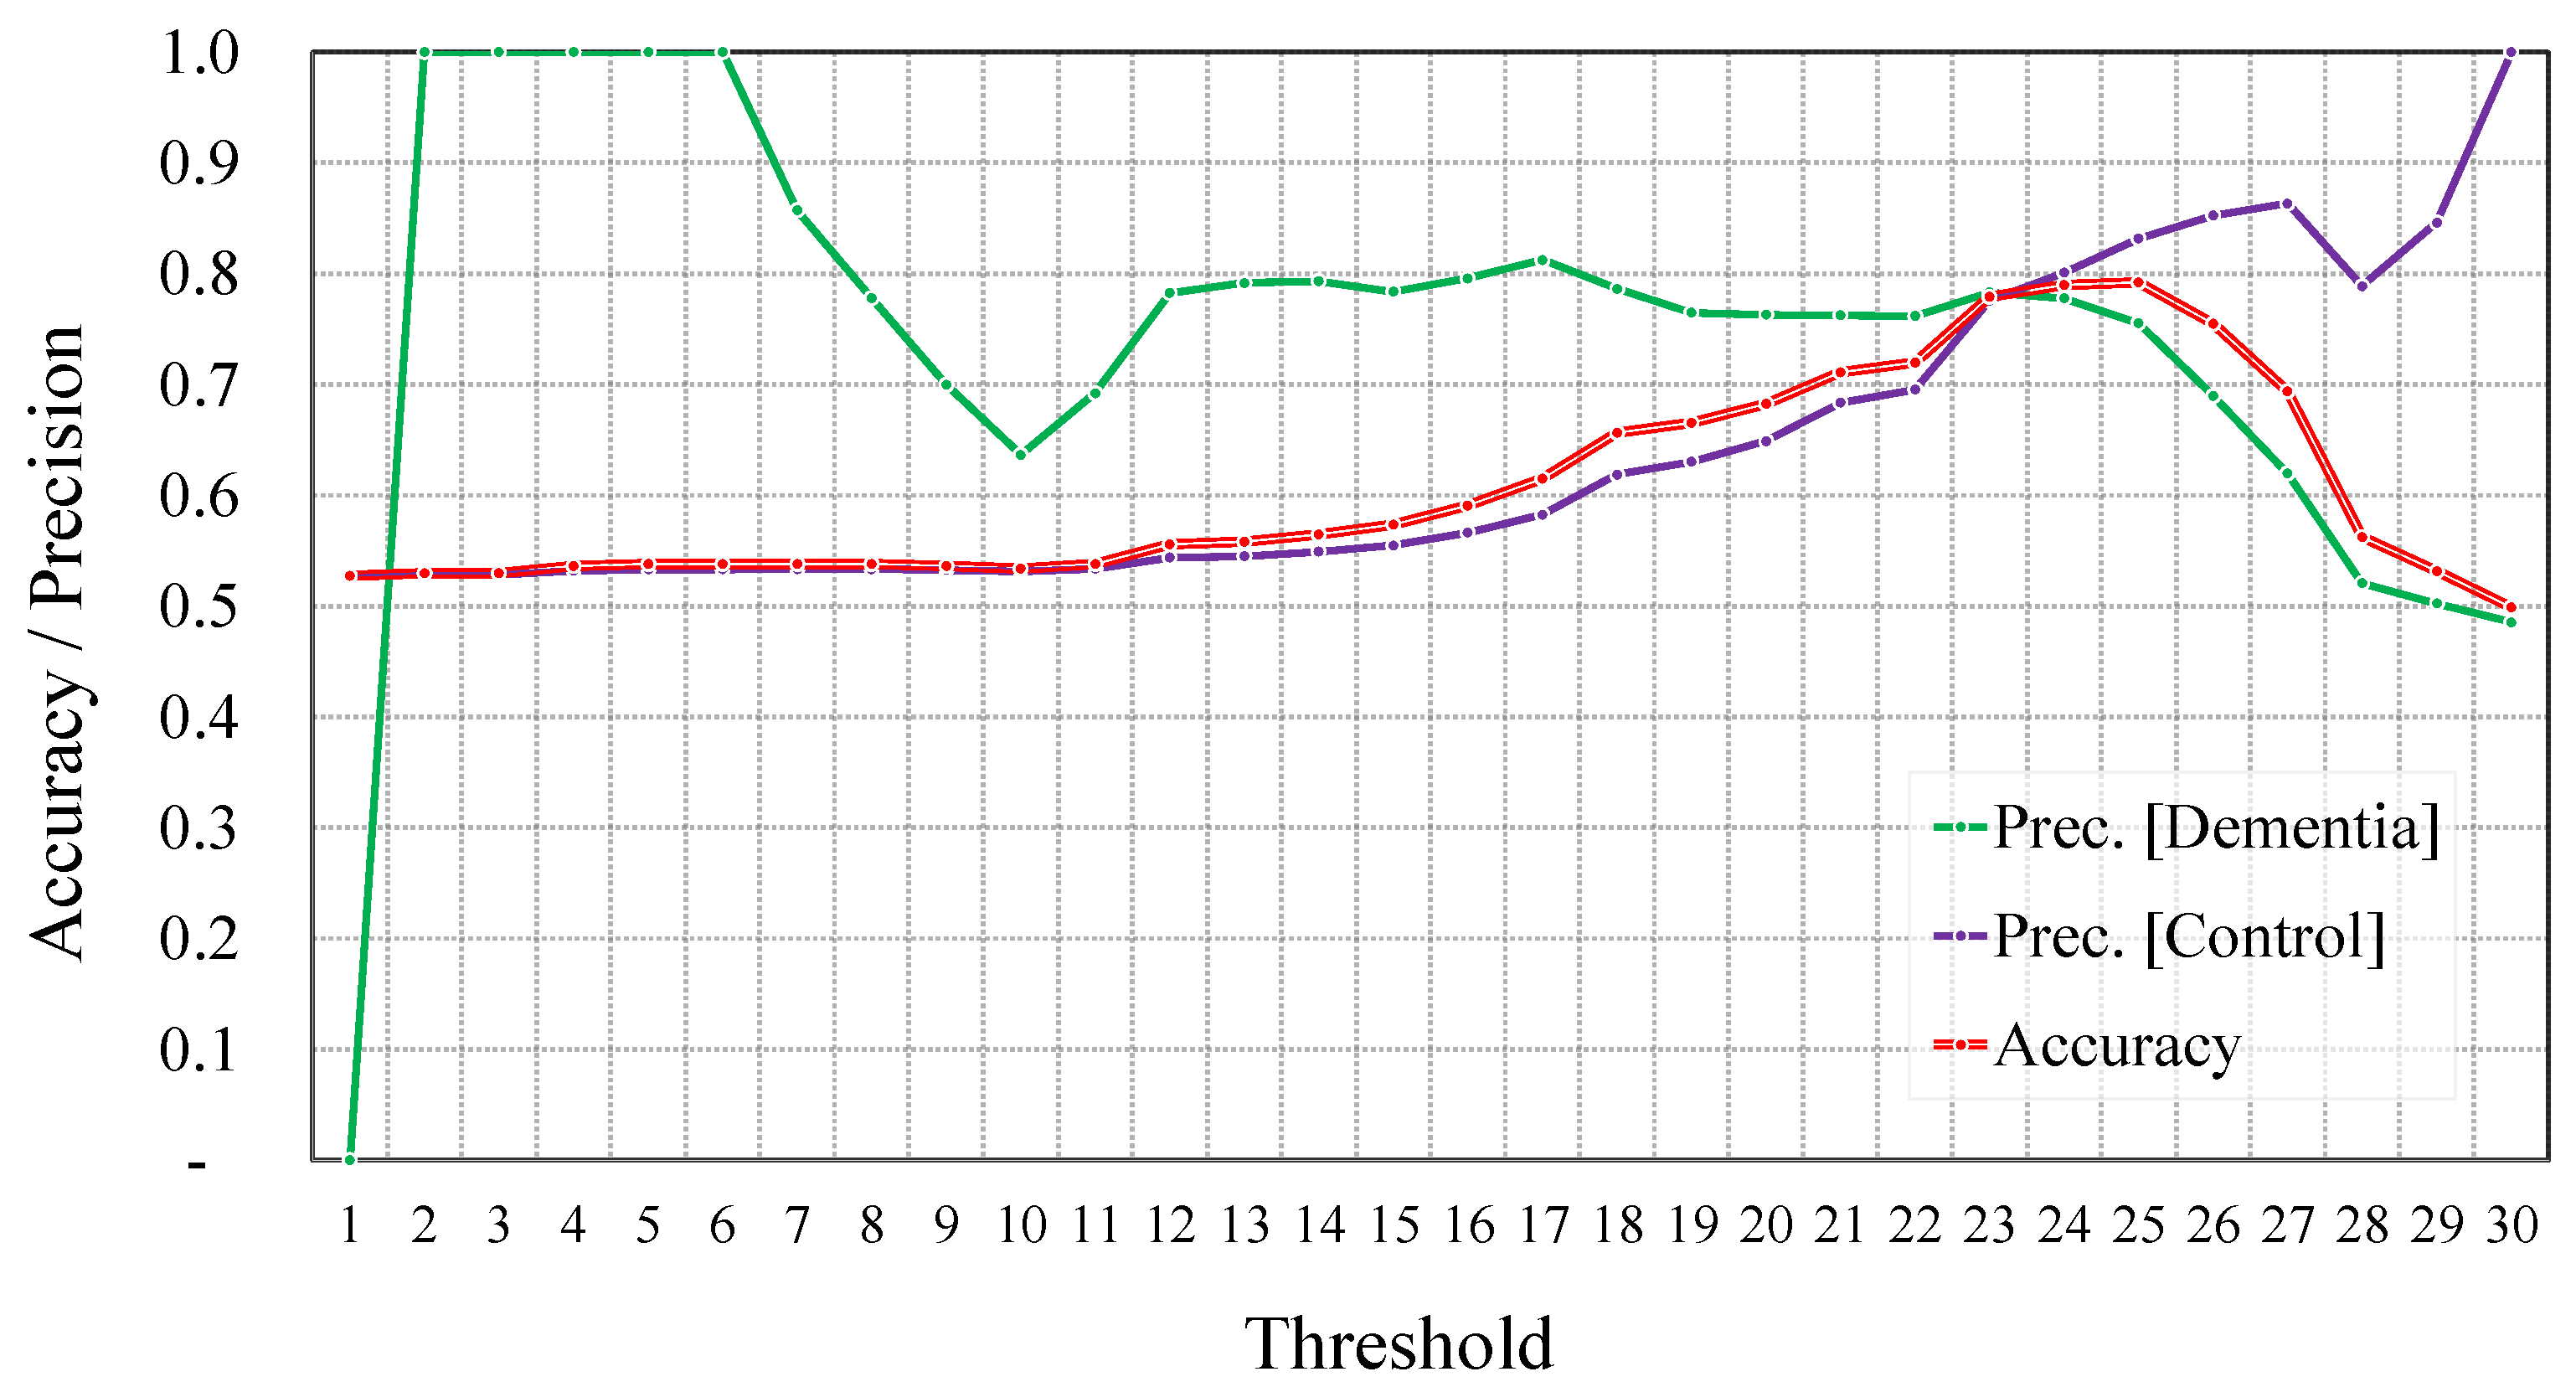
| Model/Metric | Accuracy | Precision | Recall | F1-Score |
|---|---|---|---|---|
| Threshold = 23 | ||||
| Before augmentation | 77.90% | 77.92% | 77.90% | 77.91% |
| After augmentation | 80.31% | 80.35% | 80.31% | 80.33% |
| Threshold = 25 | ||||
| Before augmentation | 79.21% | 79.56% | 79.21% | 79.39% |
| After augmentation | 81.62% | 81.89% | 81.62% | 81.76% |
| Approach | Experimental Settings | Accuracy |
|---|---|---|
| Wankerl et al. [8] | LOSO (subject level) | 77.1% |
| Fritsch et al. [9] | LOSO (subject level) | 85.6% |
| Bouazizi et al. [11] | 10-fold CV (subject level) | 81.5% |
| Zheng et al. [12] | LOSO (subject level) | 75.3% |
| GPT-4 | All subjects | 86.2% |
| Proposed method | 10-fold CV (subject level) | 83.6% |
| Proposed method | 10-fold CV (sample level) | 82.1% |
Disclaimer/Publisher’s Note: The statements, opinions and data contained in all publications are solely those of the individual author(s) and contributor(s) and not of MDPI and/or the editor(s). MDPI and/or the editor(s) disclaim responsibility for any injury to people or property resulting from any ideas, methods, instructions or products referred to in the content. |
© 2023 by the authors. Licensee MDPI, Basel, Switzerland. This article is an open access article distributed under the terms and conditions of the Creative Commons Attribution (CC BY) license (https://creativecommons.org/licenses/by/4.0/).
Share and Cite
Bouazizi, M.; Zheng, C.; Yang, S.; Ohtsuki, T. Dementia Detection from Speech: What If Language Models Are Not the Answer? Information 2024, 15, 2. https://doi.org/10.3390/info15010002
Bouazizi M, Zheng C, Yang S, Ohtsuki T. Dementia Detection from Speech: What If Language Models Are Not the Answer? Information. 2024; 15(1):2. https://doi.org/10.3390/info15010002
Chicago/Turabian StyleBouazizi, Mondher, Chuheng Zheng, Siyuan Yang, and Tomoaki Ohtsuki. 2024. "Dementia Detection from Speech: What If Language Models Are Not the Answer?" Information 15, no. 1: 2. https://doi.org/10.3390/info15010002
APA StyleBouazizi, M., Zheng, C., Yang, S., & Ohtsuki, T. (2024). Dementia Detection from Speech: What If Language Models Are Not the Answer? Information, 15(1), 2. https://doi.org/10.3390/info15010002