Article

A Deep Learning Approach for Predictive Healthcare Process Monitoring

by
Ulises Manuel Ramirez-Alcocer
1,†,
Edgar Tello-Leal
2,*,†,
Gerardo Romero
1 and
Bárbara A. Macías-Hernández
2
1
Multidisciplinary Academic Unit Reynosa-Rodhe, Autonomous University of Tamaulipas, Reynosa 88779, Mexico
2
Faculty of Engineering and Science, Autonomous University of Tamaulipas, Victoria 87000, Mexico
*
Author to whom correspondence should be addressed.
These authors contributed equally to this work.
Information 2023, 14(9), 508; https://doi.org/10.3390/info14090508
Submission received: 14 August 2023 / Revised: 10 September 2023 / Accepted: 13 September 2023 / Published: 16 September 2023
(This article belongs to the Special Issue Information Systems in Healthcare)

Abstract

:
In this paper, we propose a deep learning-based approach to predict the next event in hospital organizational process models following the guidance of predictive process mining. This method provides value for the planning and allocating of resources since each trace linked to a case shows the consecutive execution of events in a healthcare process. The predictive model is based on a long short-term memory (LSTM) neural network that achieves high accuracy in the training and testing stages. In addition, a framework to implement the LSTM neural network is proposed, comprising stages from the preprocessing of the raw data to selecting the best LSTM model. The effectiveness of the prediction method is evaluated through four real-life event logs that contain historical information on the execution of the processes of patient transfer orders between hospitals, sepsis care cases, billing of medical services, and patient care management. In the test stage, the LSTM model reached values of 0.98, 0.91, 0.85, and 0.81 in the accuracy metric, and in the evaluation of the prediction of the next event using the 10-fold cross-validation technique, values of 0.94, 0.88, 0.84, and 0.81 were obtained for the four previously mentioned event logs. In addition, the performance of the LSTM prediction model was evaluated with the precision, recall, F1-score, and area under the receiver operating characteristic (ROC) curve (AUC) metrics, obtaining high scores very close to 1. The experimental results suggest that the proposed method achieves acceptable measures in predicting the next event regardless of whether an input event or a set of input events is used.

1. Introduction

Healthcare services continuously adopt technological advancements to overcome growing challenges regarding quality of care, cost reduction, efficiency, sustainability, and transforming data into knowledge. In the medical field, significant attention has been devoted to the methods and effectiveness of e-healthcare to improve the quality of care and service recipients’ well-being (particularly patients) [1]. The technological field tends to generate solutions for e-healthcare and its impacts on the medical and healthcare system [2]. Therefore, the main goal set forth by both governments and organizations is to increase the effectiveness, accuracy, and service quality of healthcare for citizens (users) [3] through the development, management, and monitoring of schemes based on information technologies (IT).
In this context, patient information exchange between healthcare service providers is essential in hospital information systems (HIS). Healthcare information exchange (HIE)-based approaches allow the sharing of patient’s medical information electronically, improving the speed, quality, safety, and cost of patient care [4,5]. These approaches can be incorporated into electronic health record (EHR) systems; it is recommended to use standards for data management, such as Health Level Seven (HL7) [6], Clinical Document Architecture (CDA) [7], and Fast Healthcare Interoperability Resources (FHIR) [8] in these systems, both in clinical document design and in the exchange of clinical data between healthcare service providers. The direct exchange of information (documents), laboratory orders and results, patient referrals, or discharge summaries can be discussed.
The enhancement of business processes is a growing concern and a challenge to advancing efficiency and service quality in health institutions worldwide [9]. In this way, business process management (BPM) approaches have been applied in different areas of healthcare institutions to reduce patient waiting times, reduce service costs, maximize patient care, balance resource utilization, improve the quality of service, and minimize risk (i.e., reduce patient morbidity and mortality) [10,11]. A business process in the healthcare domain (healthcare process) is understood as the means institutions use to deliver a service to their users (patients) [12], which is defined by a set of elements, such as the sequence of activities and events, decision points, interactions between participants (people, organizations, software systems, equipment), and where the execution of the business process leads to one or several outcomes (business goals) [12], to deliver healthcare to patients.
Healthcare processes can be classified into clinical and organizational processes [10,13]. The clinical processes are related to the patients and implemented through a previously defined diagnostic-therapeutic cycle [13]. Organizational processes are administrative processes that can follow behaviors that support medical treatment processes to coordinate medical treatment between users, providers, and organizational units [14]. Patient transfer orders between hospitals, medical patient management, and exam requests are examples of organizational processes. Healthcare processes are usually considered patient-centered, complex, constantly developing and updating, adaptable, and multidisciplinary [15,16]. Consequently, extracting knowledge and acquiring insight into the dynamics of these processes can be expensive and complex tasks. The management of healthcare processes is very complex due to their variability, dynamism, fast-changing ad hoc nature, and increasingly multidisciplinary scope [17].
Healthcare process execution through HIS process-oriented registers a large number of events. From these events, knowledge can be extracted to verify and validate the flow performed in the execution of the healthcare process [11,14]. An event log contains a history of the actions and activities that occurred during the execution of a business process. This log can be analyzed using an approach based on process mining techniques [18]. Then, process mining can discover, verify, and improve business processes by analyzing the event logs generated by process-oriented information systems [19]. Therefore, institutions can discover what behaviors are followed in the execution of a process, verify that business rules are applied, and identify possible bottlenecks in the business process flow [20]. Likewise, they can determine the distribution of resources, consumption of time to execute an activity, and aspects related to the exchange of business documents.
Process mining through predictive methods exploits events contained in the traces to predict events of the present and future, allowing us to obtain a global and comprehensive point of view of the behavior of a process [21,22]. Predictive monitoring approaches incorporated into business process management systems can generate intelligent systems capable of predicting the behavior of processes in operation [23]. In the health domain, the prediction is probably more important than the explanation due to the high cost that a delay in diagnosis and treatment can cause [24]. The capability to predict the healthcare process’s future behavior is a significant challenge in process management and process mining. Namely, monitoring healthcare process instances and predicting their behavior can enable medical supervisors or hospital administrators to act proactively in anticipation of an event [25].
The predictive analysis applied to health data is emerging as a tool to collaborate in more proactive and preventive treatment options [24] and improve healthcare processes. In this way, compared to other machine learning methods, deep learning techniques have shown their ability to improve the discriminative function of the selected inference model. Well-known approaches based on deep learning architectures have been proposed to address complex problems, for example, remote sensing segmentation of dense buildings after an earthquake in urban areas using an improved Swin transformer [26] or a model to evaluate the structural health of long-span bridges, establishing a relationship between the vertical deflection of the beam and the cable tension, in cable-stayed bridges [27]. Recurrent neural networks (RNNs) are a deep learning technique considered the most efficient time series prediction method. An RNN allows the use of a sequence of input data with cyclic connections between blocks, where neurons are interconnected in the same hidden layer. Then, a training function is repeatedly applied to the hidden states [28]. Long short-term memory (LSTM) is based on an RNN with the capability to solve memory and forgetting problems by adding multi-threshold gates. This neural network has been successfully applied to many sequence and time series prediction problems. Hence, a model based on LSTM to predict the next event from a set of cases or traces can be considered an essential strategy in the supervised process mining environment.
Motivated by these requirements, we propose a deep learning-based approach to predict the next event in a healthcare process. The predictive model is based on the LSTM neural network cell structure. A framework is proposed to manage the preprocessing and categorization of the neural network input data and the design, training, and selection of the LSTM network model. The LSTM model can predict the next event from an input event or a set of input events. The validation performed on the LSTM model shows that it can predict the next event of a new process model instance, with the highest precision metric of 0.98, confirming the feasibility and usefulness of this approach. Our experiment addresses the challenges of data analytics in healthcare and public health. The performance of the LSTM predictive model was evaluated using four data sets (event logs) from different business processes running within the daily operations of a hospital. The model reaches values of 0.95, 0.90, 0.85, and 0.82 in the F1-score metric for the event logs of the patient transfer between hospitals, sepsis care cases, billing of medical services, and health care management of patients, respectively. In evaluating the prediction model’s performance through the area under the receiver operating characteristic (ROC) curve (AUC), average values between 0.953 and 1.00 for micro-average ROC-AUC and between 0.899 and 0.958 for macro-average ROC-AUC are obtained. The experimental results based on key metrics suggest that the proposed method achieves the highest measures on a healthcare dataset and can be applied when models have high complexity in their behavior and extension.

2. Materials and Methods

The framework for predicting the next event in a healthcare process model comprises data pre-processing, binarization, and model training phases, as shown in Figure 1. Most state-of-the-art investigations of prediction problems using neural networks do not describe an implementation method and usually perform a manual implementation. For this reason, a framework is required to support the development of a technological solution based on an LSTM neural network with the ability to predict future events.

2.1. Data Pre-Processing

The pre-processing of an event log consists of analyzing the raw data to identify its attributes, extracting the traces with its events, and applying separation criteria to the selected data. This phase is composed of the following stages:

2.1.1. Data Extraction

The data extraction stage consists of diverse tasks that are executed sequentially. First, the attributes contained in an event log are identified. The eXtensible Event Stream (XES) standard has emerged as the principal storage format for event logs [29]. This standard defines a structure to manage and manipulate logs containing traces and events and their attributes. The XES standard format is based on the XML language, formed by a hierarchical structure. The root node corresponds to the event log, and each child (intermediate node) corresponds to the traces contained in an event log. Each intermediate node can have several children representing each event within a trace. Each event node has several children, representing the attributes belonging to the events, and each attribute has a name and a value.
The first task’s output allows the selection of the required attributes to predict the next event in a healthcare process model. In the Results section experiments, the selected attribute in each event contained in the event log (XES file) was w o r k f l o w m o d e l e l e m e n t :   n a m e . This attribute stores as a value the name of the activity executed in the healthcare process and recorded in the event log. Next, a normalization task is applied to the data contained in the dataset’s attribute. Afterward, the corrupt or inaccurate instances are detected and removed from the event log.
Then, a trace identification task is applied: searching, recognizing, selecting, and recovering the traces with their events and attributes. This task is performed by sweeping the event log’s hierarchical structure content. The attribute value of each of the events contained in a trace is collected when the condition a t t r i b u t e _ e v e n t = b is fulfilled, where b corresponds to the attribute selected in the previous task (in this case, it is the w o r k f l o w m o d e l e l e m e n t : n a m e attribute), as shown in line 4 of the Algorithm 1. Each recovered trace is stored in a text file (see lines 11–12 of the Algorithm 1), respecting the order in which the trace is extracted.
Algorithm 1 Get_traces.
Input: 
a = log (file.xes), b = selected attribute
Output: 
file = file.txt with all traces and events
1:
get_traces(a,b):
2:
create file.txt
3:
for  t r a c e l o g   do
4:
    for  e v e n t t r a c e  do
5:
        if  a t t r i b u t e _ e v e n t = b  then
6:
               e r e m o v e _ p u n c t u a t i o n ( a t t r i b u t e _ e v e n t )
7:
              add e to  e v e n t _ l i s t
8:
        end if
9:
    end for
10:
  add  e v e n t _ l i s t  to  t r a c e _ l i s t
11:
end for
12:
write  t r a c e _ l i s t   to  f i l e
13:
return  t e x t f i l e

2.1.2. Segmentation

The segmentation stage provides a basic structure to the traces that can later be used by downstream phases, enabling the prediction of the next event. This stage consists of dividing traces into segments, each segment being topically coherent, and cutoff points indicate a change in an event. A cutoff point separates each event included in a trace. Then, a vocabulary with unique acronyms is created from the dataset generated in the previous stage, transforming these selected acronyms into single integers. Subsequently, the events are transformed into single integers using the previously created vocabulary as a reference. Each event in the trace is transformed into a single integer, constructing the trace as a sequence of integers.
Next, a list of valid n-tuples is constructed for each sequence of integers. For which, the following should be considered, given an ordered n-tuple of integers (events) of a trace, the number of permutations is the number of possible ordered n-tuples, applying the next rules: (1) the ordering of the events cannot change, (2) the position of an event cannot be modified, (3) the first event and the last event of a trace cannot be grouped. For example, given the trace t 1 = { 1 , 3 , 5 , 9 , 2 } , the possible tuples to be calculated { 1 , 3 } , { 3 , 5 } , { 5 , 9 } , { 9 , 2 } , { 1 3 , 5 } , { 3 5 , 9 } , { 5 9 , 2 } , { 1 3 5 , 9 } , { 3 5 9 , 2 } , { 1 3 5 9 , 2 } . Then, the tuple list generated must be divided into two sub-datasets, which will be used in the neural network training and testing phases. This task requires defining the percentage of the tuple list allocated for the training sub-dataset, and the remaining records will automatically be allocated to the test sub-dataset. The instances of the training sub-dataset are automatically selected by a random method.
The next actions are performed in parallel for the two sub-datasets. (1) The input (X) and output (y) activity lists are created for each sub-dataset. (2) The last integer is extracted from each tuple, allowing the output activity list to populate (y). (3) An antecedent event or a set of antecedent events to the last event for each tuple is extracted and added to the input activities list (X). Continuing with the previous example, of the elements of the tuple { 1 , 3 } , the first element { 1 } would be stored in the input activity list (X). The second element { 3 } would be recorded in the output activity list (y), and so on for all tuples collected from each event log trace. Figure 2 graphically shows an example of the segmentation task implemented in the framework. (4) The list of input activities (X) is converted into a two-dimensional matrix constructed with the total sequence of integers and the maximum length of the sequences; that is, the matrix of input activities (X) will have a dimension of mxn, where m = total tuples, and n = maximum length of the sequence. In the case of a t u p l e < 3 , a padding method is applied to insert zero values before the integer in the sequence so that the length of the tuple is equal to 3. (5) Finally, the list of output activities (y) becomes a matrix of dimension mx 1, where m = total number of tuples and n = 1 because it only has a single output activity (class) per tuple.

2.2. Binarization

The binarization phase assigns a binary value to each integer in the output activities (y) vector. This phase is performed for the two output activity lists (y) generated previously, corresponding to the training and test sub-datasets. The binarization reduces the complexity of the task, which is also advisable for detecting connected components, i.e., event sequences or next-event prediction. This task is performed by applying a one-hot encoding scheme, which specifies that the quantity of classes equals the dictionary size. The one-hot encoding technique helps convert categorical features into binary format, that is, categorical integer features to a binary variable (a binary variable is added for each unique integer).
Figure 3 extends the example of Figure 2 to explain the binarization phase. Figure 3 shows that a binary representation is created from the unique integers. A vector of the presence/absence of integers illustrates this representation. The number of columns will equal the number of classes in the event log, and the number of rows will equal the number of instances used in the training stage. Hence, a binary representation consists of a sequence of 0/1 vectors, possibly long. The presence of an integer is marked with a value of 1 in the class column corresponding to the value of the integer. All the other columns of the vector will be marked with a value of 0. The above procedure is performed for each instance in the output vector.

2.3. Model Training

The model training phase obtains a trained model based on an LSTM network that can predict the next event of a healthcare process model. Network design, network training, model selection, and model inference stages form this phase.

2.3.1. Network Design

The input layer is created using the word embedding technique in the neural network design. Also, the hidden layer containing the LSTM units is generated and interconnected through the input, output, and forget gates. Finally, only one neuron is available as a unique output value corresponding to the prediction in the output layer. Figure 4 shows the design of the neural network, where x t is the input vector and h t is the output result to the memory cell at time t. Moreover, h t is the value of the memory cell. At the time t, i t are the values of the input gate, f t are the values of the forget gate, and o t are the values of the output gate. Finally, C ˜ t are values of the candidate state of the memory cell at time t.

2.3.2. Network Training

The LSTM uses hyperbolic tangent ( t a n h ) and s i g m o i d activation functions in different flows for the input and output gates; logistic s i g m o i d activation function for the forget gate, as shown in Figure 4. The two-dimensional matrix of the input activities (X) and the vector of the output activities (y), represented by a one-hot encoder and generated in the framework’s previous stages, are used. We performed hyper-parameter optimization using a grid search algorithm to determine the optimal parameters for the LSTM networks. This algorithm is based on an exhaustive search that looks through each hyper-parameter combination using permutation and combination. The hyper-parameters introduced to the search algorithm were the following: “batches = [32, 64]”, “dropout_rate = [0.0, 0.1, 0.2, 0.3, 0.4, 0.5]”, “epochs = [50, 100]”, “units = [10, 50, 100]”, “optimizers = [‘SGD’, ‘RMSprop’, ‘Adagrad’, ‘Adadelta’, ‘Adam’, ‘Adamax’, ‘Nadam’]”, “activation = [‘softmax’, ‘softplus’, ‘softsign’, ‘relu’, ‘tanh’, ‘sigmoid’]”. The performance of the grid search algorithm is measured using 3-fold cross-validation on the evaluation set. The setting that achieved the highest accuracy in the validation process after performing all possible combinations of hyper-parameters is the next: epochs = 100, optimizer = Adam, batch size = 32, LSTM units = 50, and activation = softmax. The cross-entropy loss was predefined in the neural network parameters due to the data types used in the input vectors.

2.3.3. Model Selection

The LSTM network model is selected based on the accuracy measure and the loss function achieved in the training stage. The model that achieves the highest accuracy measurement and a minor loss function in the training phase will be used as the LSTM network model to predict the next event. Otherwise, we must return to the previous stage and adjust the training parameters if an acceptable metric is not obtained during network training.

2.3.4. Inference Model

The LSTM inference or predictive model is the model that has acquired knowledge or learned adequately in the last phase of the framework. With a model implemented from an input event or a sequence of input events, the LSTM inference model allows the prediction of the next event for a new instance of a healthcare process, explained in the following section.

3. Results

The business processes that derived the event logs were generated in different hospitals or, in the case of the healthcare collaboration process, simulated the relationship established in the clinic for the care of a sick patient. The four healthcare processes used in our approach coexist in the operation of a hospital, starting with patient care through the healthcare collaboration process, from which the sepsis process or the patient transfer process to a second or third-level hospital can be derived. In other cases, the patient transfer process can occur after sepsis. For its part, the hospital billing process can be performed after each previous process. An event log typically contains attributes related to the identifier and name of the executed process, the name of the activities executed, resources responsible for the execution of the activity (human, system, or equipment), date and time of the execution of the activity, and the events that triggered the activity. A case contains a sequence of traces representing the behavior identified in an instance of a process.
In implementing the neural network model, a training sub-dataset with 80% of the original dataset (event log) observations was used to train our model (in each of the experiments described below). These instances were selected automatically on a random basis. The remaining 20% of the original dataset instances were used to validate the effectiveness of the inference model. Furthermore, the experimentation was implemented on the Jupyter Notebook tool, using the Python Keras Neural Network library with the TensorFlow backend [30].

3.1. Experiment 1

The event log contains historical information (from 2012 to 2018) about patient transfer orders and medical referral management processes. The event log basis is a project for collaborating healthcare services between a primary care provider (PCP) and a specialist care provider (SCP) located in northern Mexico, presented in [31]. The procedure of a patient referral assumes negotiating a patient transfer order and managing the medical referral. The social work department of each hospital operates the patient transfer order process. A social worker executes a patient transfer upon request from a specialist doctor. The social work department coordinates all activities related to patient transfer, including equipment, care facilities, personnel, and transportation. The patients are referred from a PCP to an SCP when requiring medical care for cancer, heart, vascular, and neurological diseases. Both hospitals have defined a set of inter-organizational business processes at design time executed by the HIS of each hospital in a coordinated way while respecting the institutions’ autonomy involved in the collaboration.
The dataset was extracted from the test environment of the PCP information system by information technology personnel authorized by the hospital. This environment contains the real behavior of the healthcare processes executed between hospitals with n instances of all possible behaviors defined in each healthcare process. The data was extracted automatically, assigning a Case-ID for each instance of the logged process, generating an XML file with the required structure in the XES schema. It is essential to mention that this data set does not include sensitive data about the patient’s identity, disease, or diagnosis, the doctors’ or specialists’ identification, or the hospital’s administrative staff.
In this experimentation, the event log exclusively contains instances generated by the patient transfer order process’s execution through the HIS of the PCP (see Table 1), composed of 2500 traces, 25 unique activities, and 76,948 events. The event log contains traces from a patient transfer order process (including medical referral management), with attributes of Case-ID, activity name, resource, and timestamp.
Table 2 shows an excerpt of the results obtained. The “input activity” column represents the activity or set of activities introduced at the input gate of the LSTM network. The “target event” column contains the events that can be predicted according to the behavior pattern identified in the event log traces. A target event value is an event with the highest prediction probability, estimated according to the weight of the event tag value. The prediction of the event generated by the LSTM method is presented in the “output event” column. In instances 1 and 4, the LSTM model has correctly predicted the next event according to the expected event in the process model, e.g., when the new input activity is START. The output event is GPTO (see Table 2). In instances 2 and 3, it can be seen that the neural network has not correctly predicted the next event in the process model. In instance 3, the target event has two prediction possibilities (APPR∣ PPR), but the model did not predict the next event correctly. In the “Target Event” column of Table 2, we present instances (3 and 5) with two expected events (APPR∣RPPR, CPR∣IRLC) because the activities are potentially found in the output paths at a decision point or path division gateway of the process flow. Also, in instances 5–7 (see Table 2), a sequence of two input activities is shown in the “Input Activity” column; i.e., the LSTM network receives a sequence of input activities to predict the next event. Additionally, in instances 8–10, three input activities are entered into the LSTM model, which correctly predicts the next event in all cases.
Table 3 shows the accuracy and precision metrics achieved by the LSTM neural network model in the validation stage. The precision measure allows us to know the number of correct positive predictions. This way, the LSTM model can predict the next event with 0.98 precision. This model achieves the highest precision confirming the ability to predict the next event in the patient referral healthcare process. Similarly, the accuracy measure achieved by the LSTM model is highly acceptable (0.94), supporting the precision measure obtained. The value obtained by the inference model for the recall metric was 0.94 (see Table 3). The recall metric indicates how much the model captures the behavior present in the event log. The recall is close to the precision value, which is desirable when training a model. This means the LSTM model detects the most positive examples, providing higher reliability. Similarly, high reliability is observed when calculating the F1-score, with a value of 0.95 (see Table 3). Furthermore, our experiment was evaluated using 10-fold cross-validation, achieving an accuracy of 94.62% (±0.09%), which demonstrates that the model can predict the next event correctly, regardless of the partitioning of the dataset used for training and validation (see Table 3). The aforementioned confirms that the selected LSTM model parameters do not operate only on a particular dataset partition; on the contrary, they function correctly for data not seen within a dataset partition.
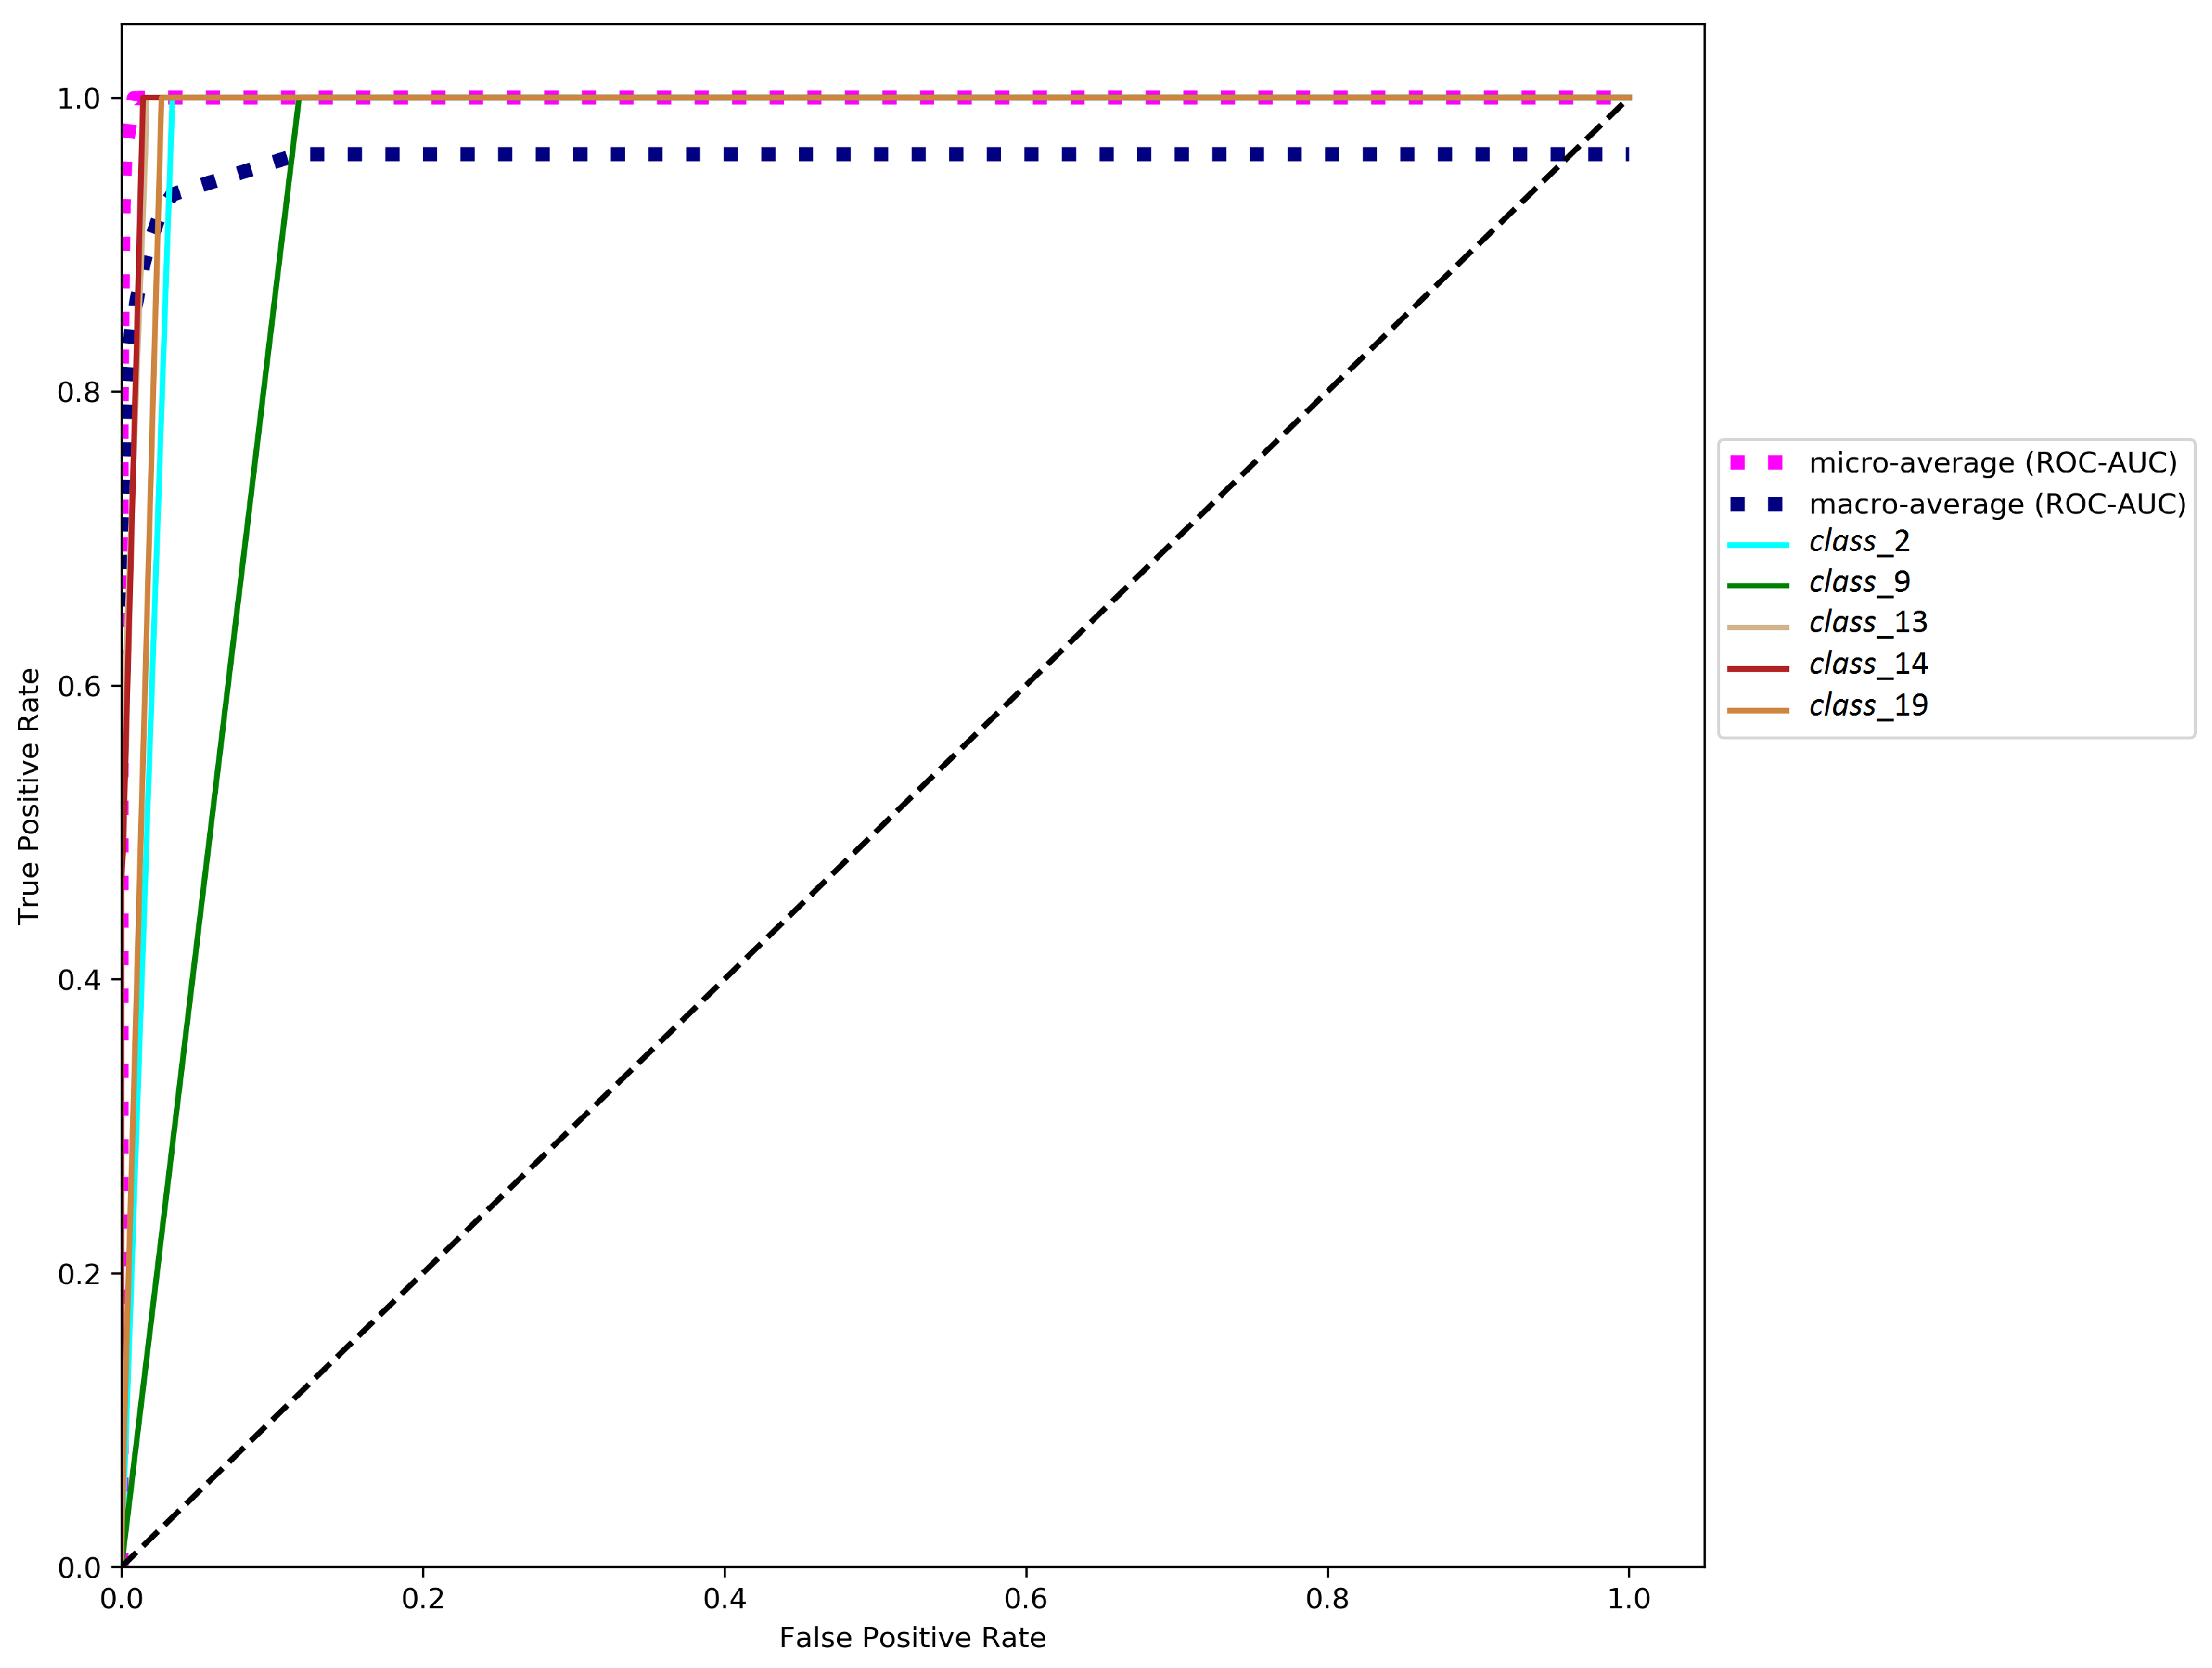
Moreover, we report the receiver operating characteristic (ROC) curves computed from the output probabilities provided by the LSTM inference model. The area under the ROC curve (AUC) represents the degree of class separability that the model achieves. This measure quantifies the ability of a model to distinguish between classes. The higher the AUC value is, the greater the model’s ability to distinguish one class from another. This metric is generally used with binary classifiers; to be used with multi-class classifiers, it is necessary to binarize the output. This condition is satisfied by using one-hot encoding. A ROC curve can be plotted for each class, taking a one-vs-all approach for each class. The scenario used in our experimentation consists of 25 classes.
ROC-AUC quantifies the continuous relation between true and false positives, given the ROC curve plots the true positive rate (TPR) against the false positive rate (FPR), as defined in Equations (1) and (2). TPR is also termed sensitivity or recall. It is important to mention that a good classification model should have an AUC value close to 1.
T P R = T P T P + F N
F P R = F P F P + T N = 1 S p e c i f i c i t y
where T P represents the number of identified positive instances in the positive set, T N means the number of classification negative instances in the negative set, F P refers to the number of identified positive instances in the negative set, and F N represents the number of identified negative instances in the positive set.
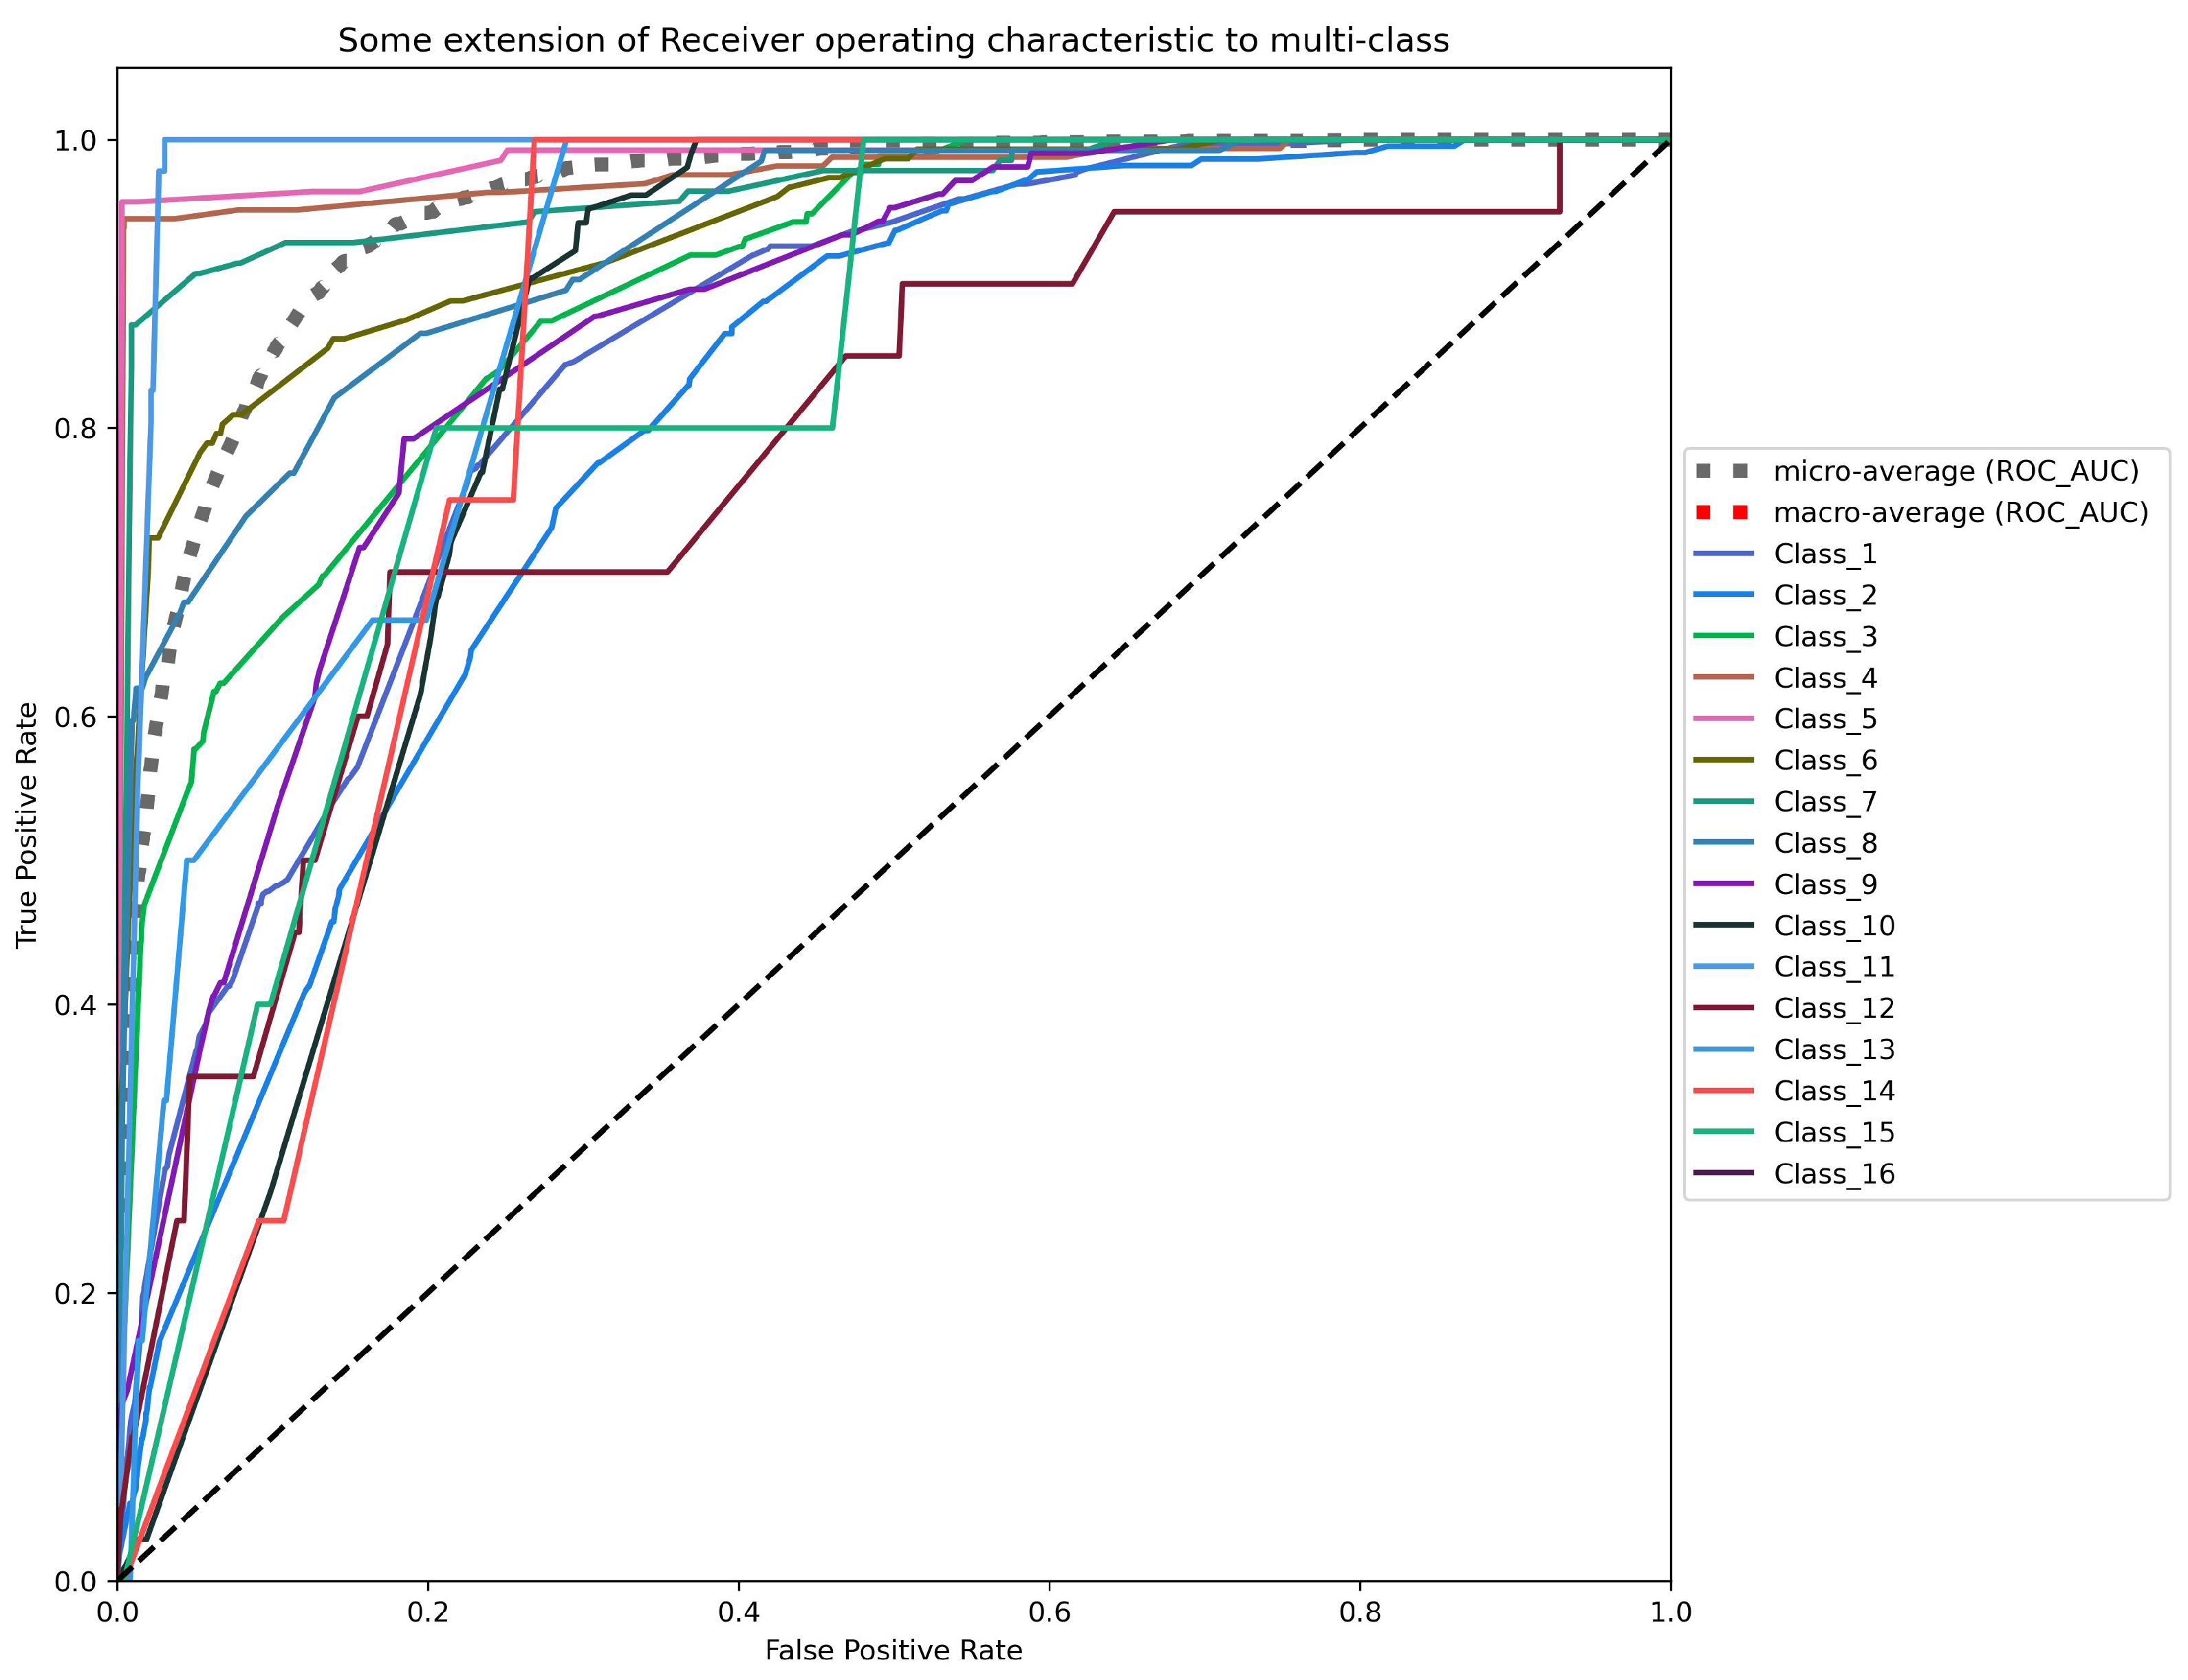
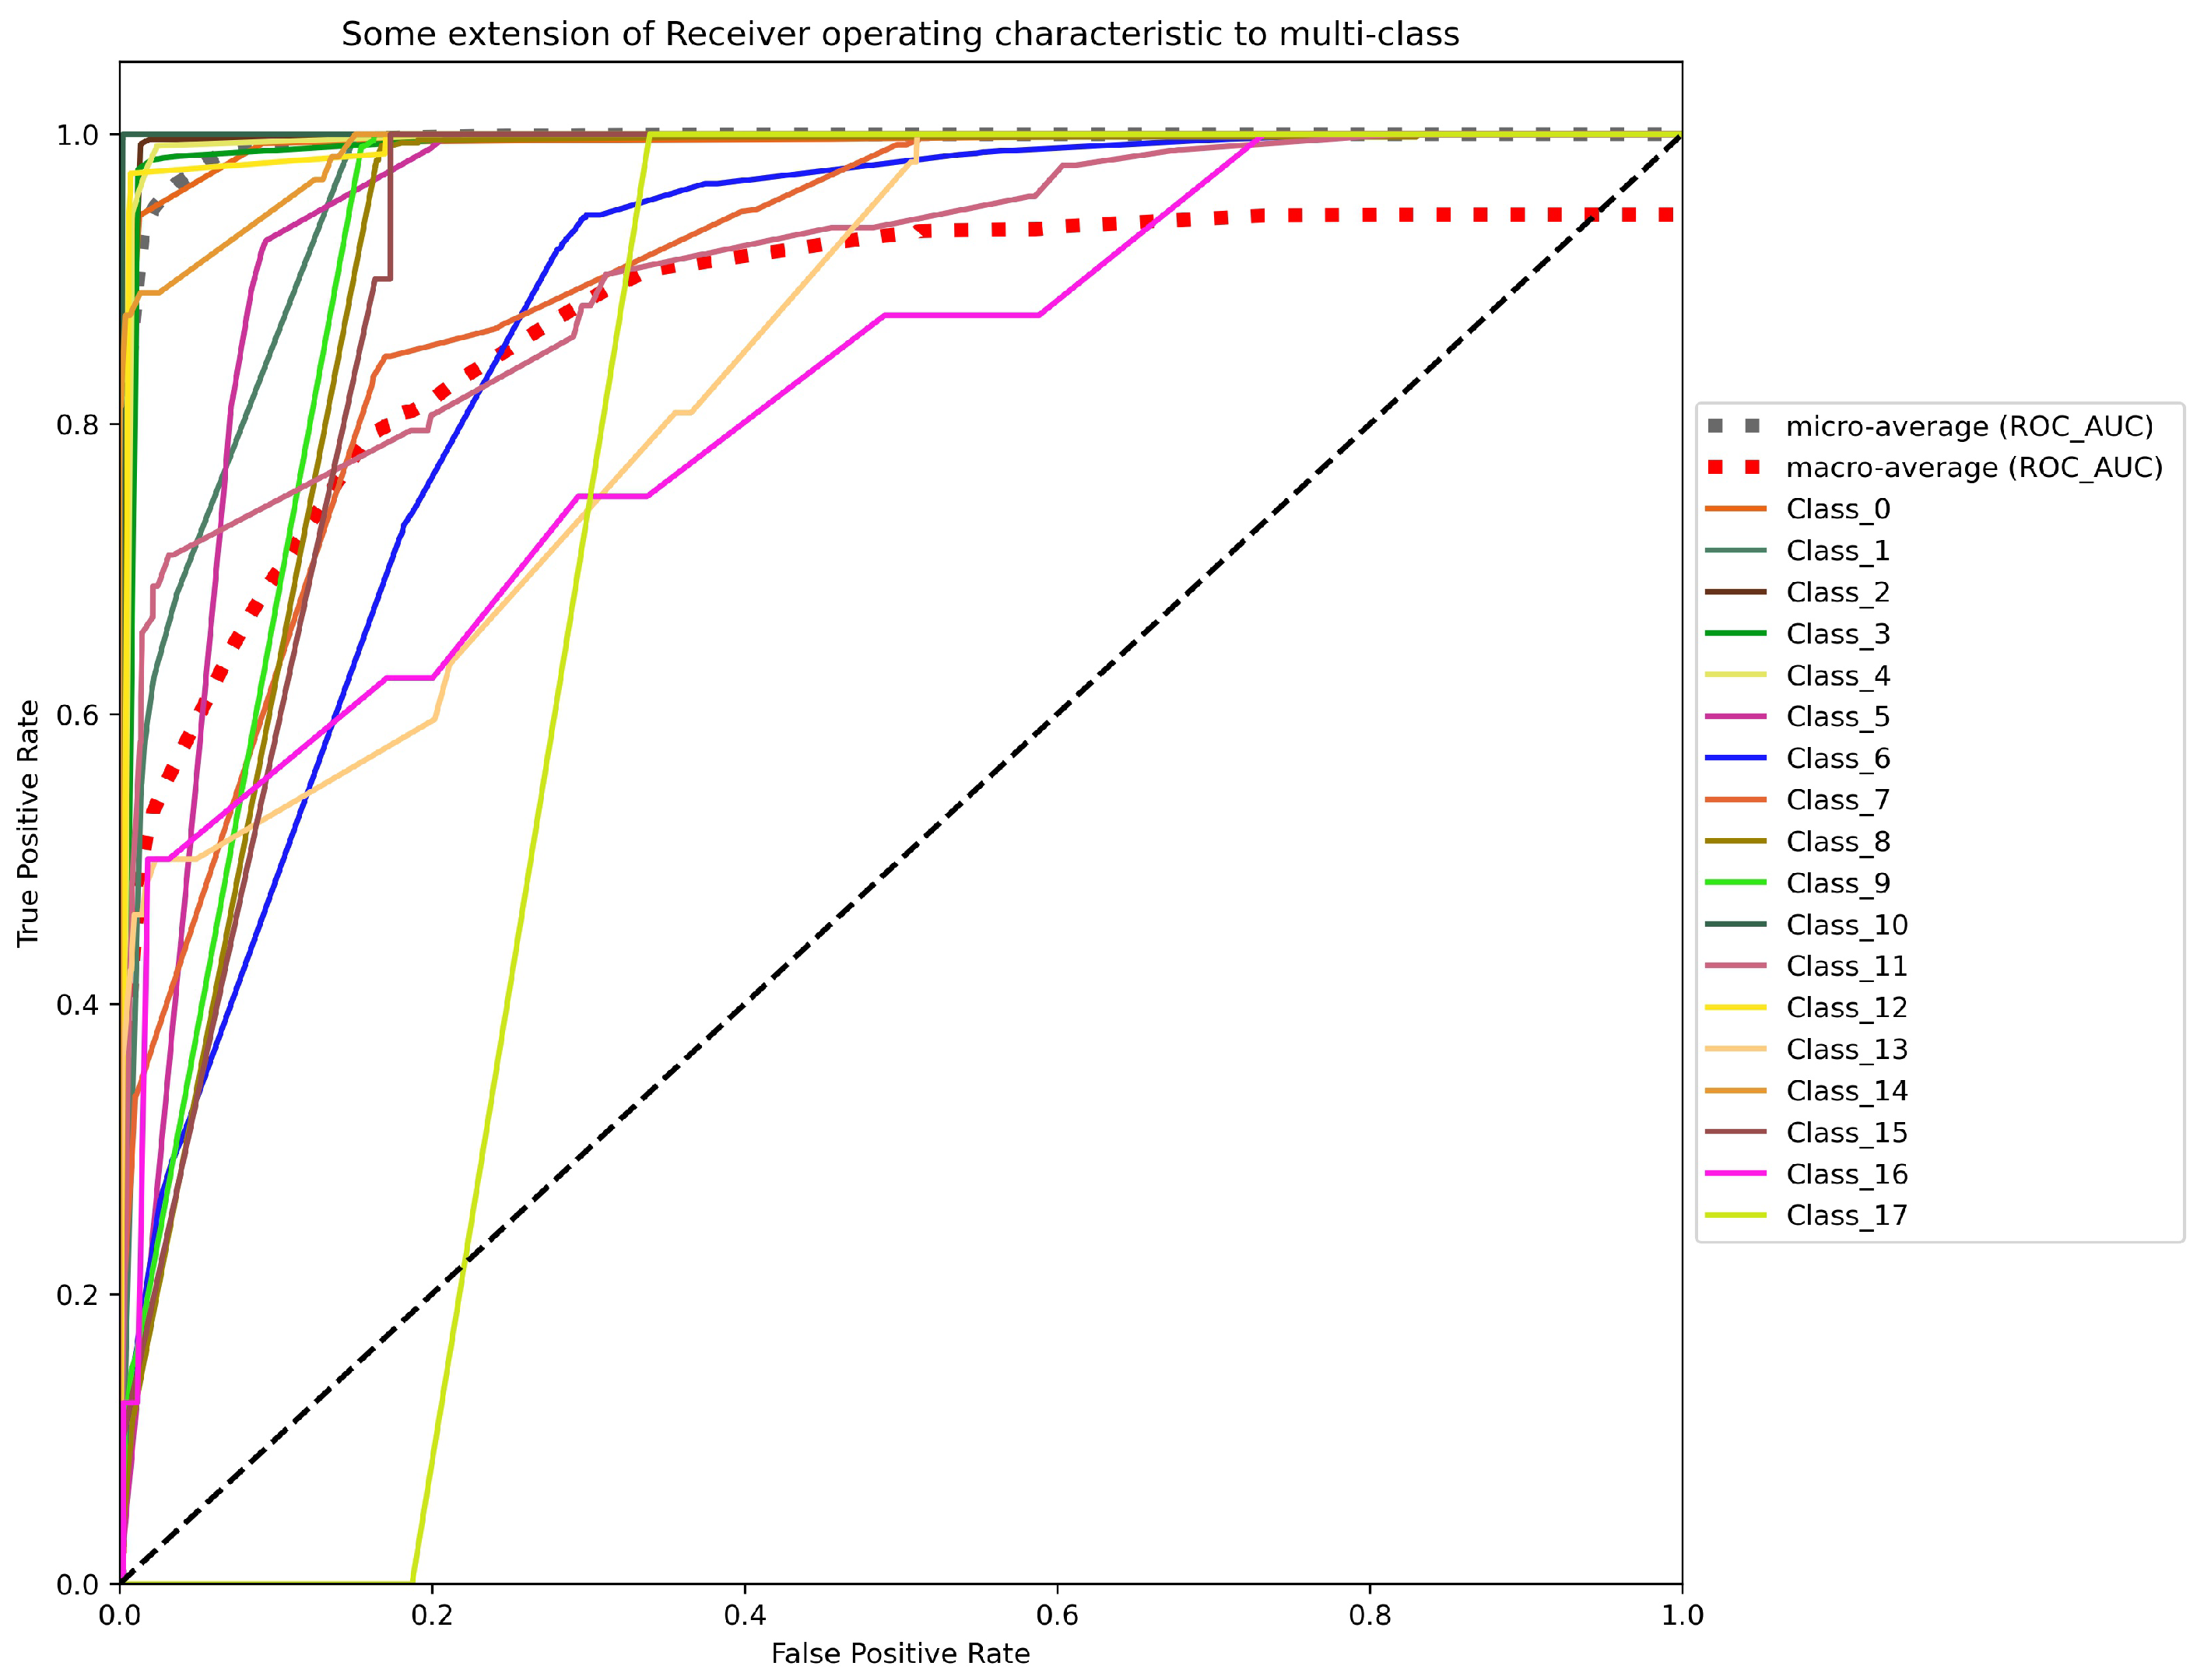
Figure 5 shows an analysis of the area under ROC curves using the TPR on the Y-axis (Equation (1)) and the FPR on the X-axis (Equation (2)). Also, Figure 5 presents the micro-average and the macro-average ROC-AUC values. The former consists of adding each class’s contribution to calculate its average. The latter is calculated independently for each class to calculate all the classes’ averages (managing each class equally). Figure 5 displays the five worst ROC curves according to the AUC values obtained with the one-vs-all approach (illustrated by continuous lines). The ROC-AUC values for these five classes are c l a s s _ 2 = 0.9831 , c l a s s _ 9 = 0.9411 , c l a s s _ 13 = 0.9960 , c l a s s _ 14 = 0.9960 , and c l a s s _ 19 = 0.9870 . Most of the remaining classes of the experiment obtained a ROC-AUC value between 0.9998 and 1.000 . On the other hand, a magenta dotted line represents the micro-average ROC-AUC, and a blue dotted line represents the macro-average ROC-AUC, calculated for all the classes (Figure 5). The micro-average and macro-average ROC-AUC of the LSTM method are 1.000 and 0.958, respectively.
In addition, an equal error rate (EER) was checked for all of the given classes to evaluate the results. EER is defined as the error rate at a point on the ROC curve where FPR (Equation (2)) is equal to FNR (Equation (3)). EER gives a good overview of a classifier’s strength in deep learning approaches as it provides a comparable and reproducible compromise between acceptance and rejection rates. Then, EER can serve as a quantitative measure of the classifier quality assessment. An EER equal to 0.00% corresponds to the inference model’s error-free work, meaning the correct classification at the point on the ROC curve. EER is the value of the FPR (Equation (2)) and the false negative rate (FNR) for a given matching process when the FPR = FNR. The FNR measure is defined by Equation (3).
F N R = F N F N + T P = 1 T P R
In this case, the value furthest from 0 within the experiment is an EER of 11.78% achieved in c l a s s _ 9 , corresponding to the value obtained by the same class in the ROC-AUC metric. The other four worst EER values reached are 3.38%, 1.65%, 1.43%, and 2.65% for the classes c l a s s _ 2 , c l a s s _ 13 , c l a s s _ 14 , and c l a s s _ 19 , respectively. The EER value for the remaining 20 classes is between 0.66 % and 0.00 % . The results listed show that the LSTM method attains a significantly low EER in most classes.
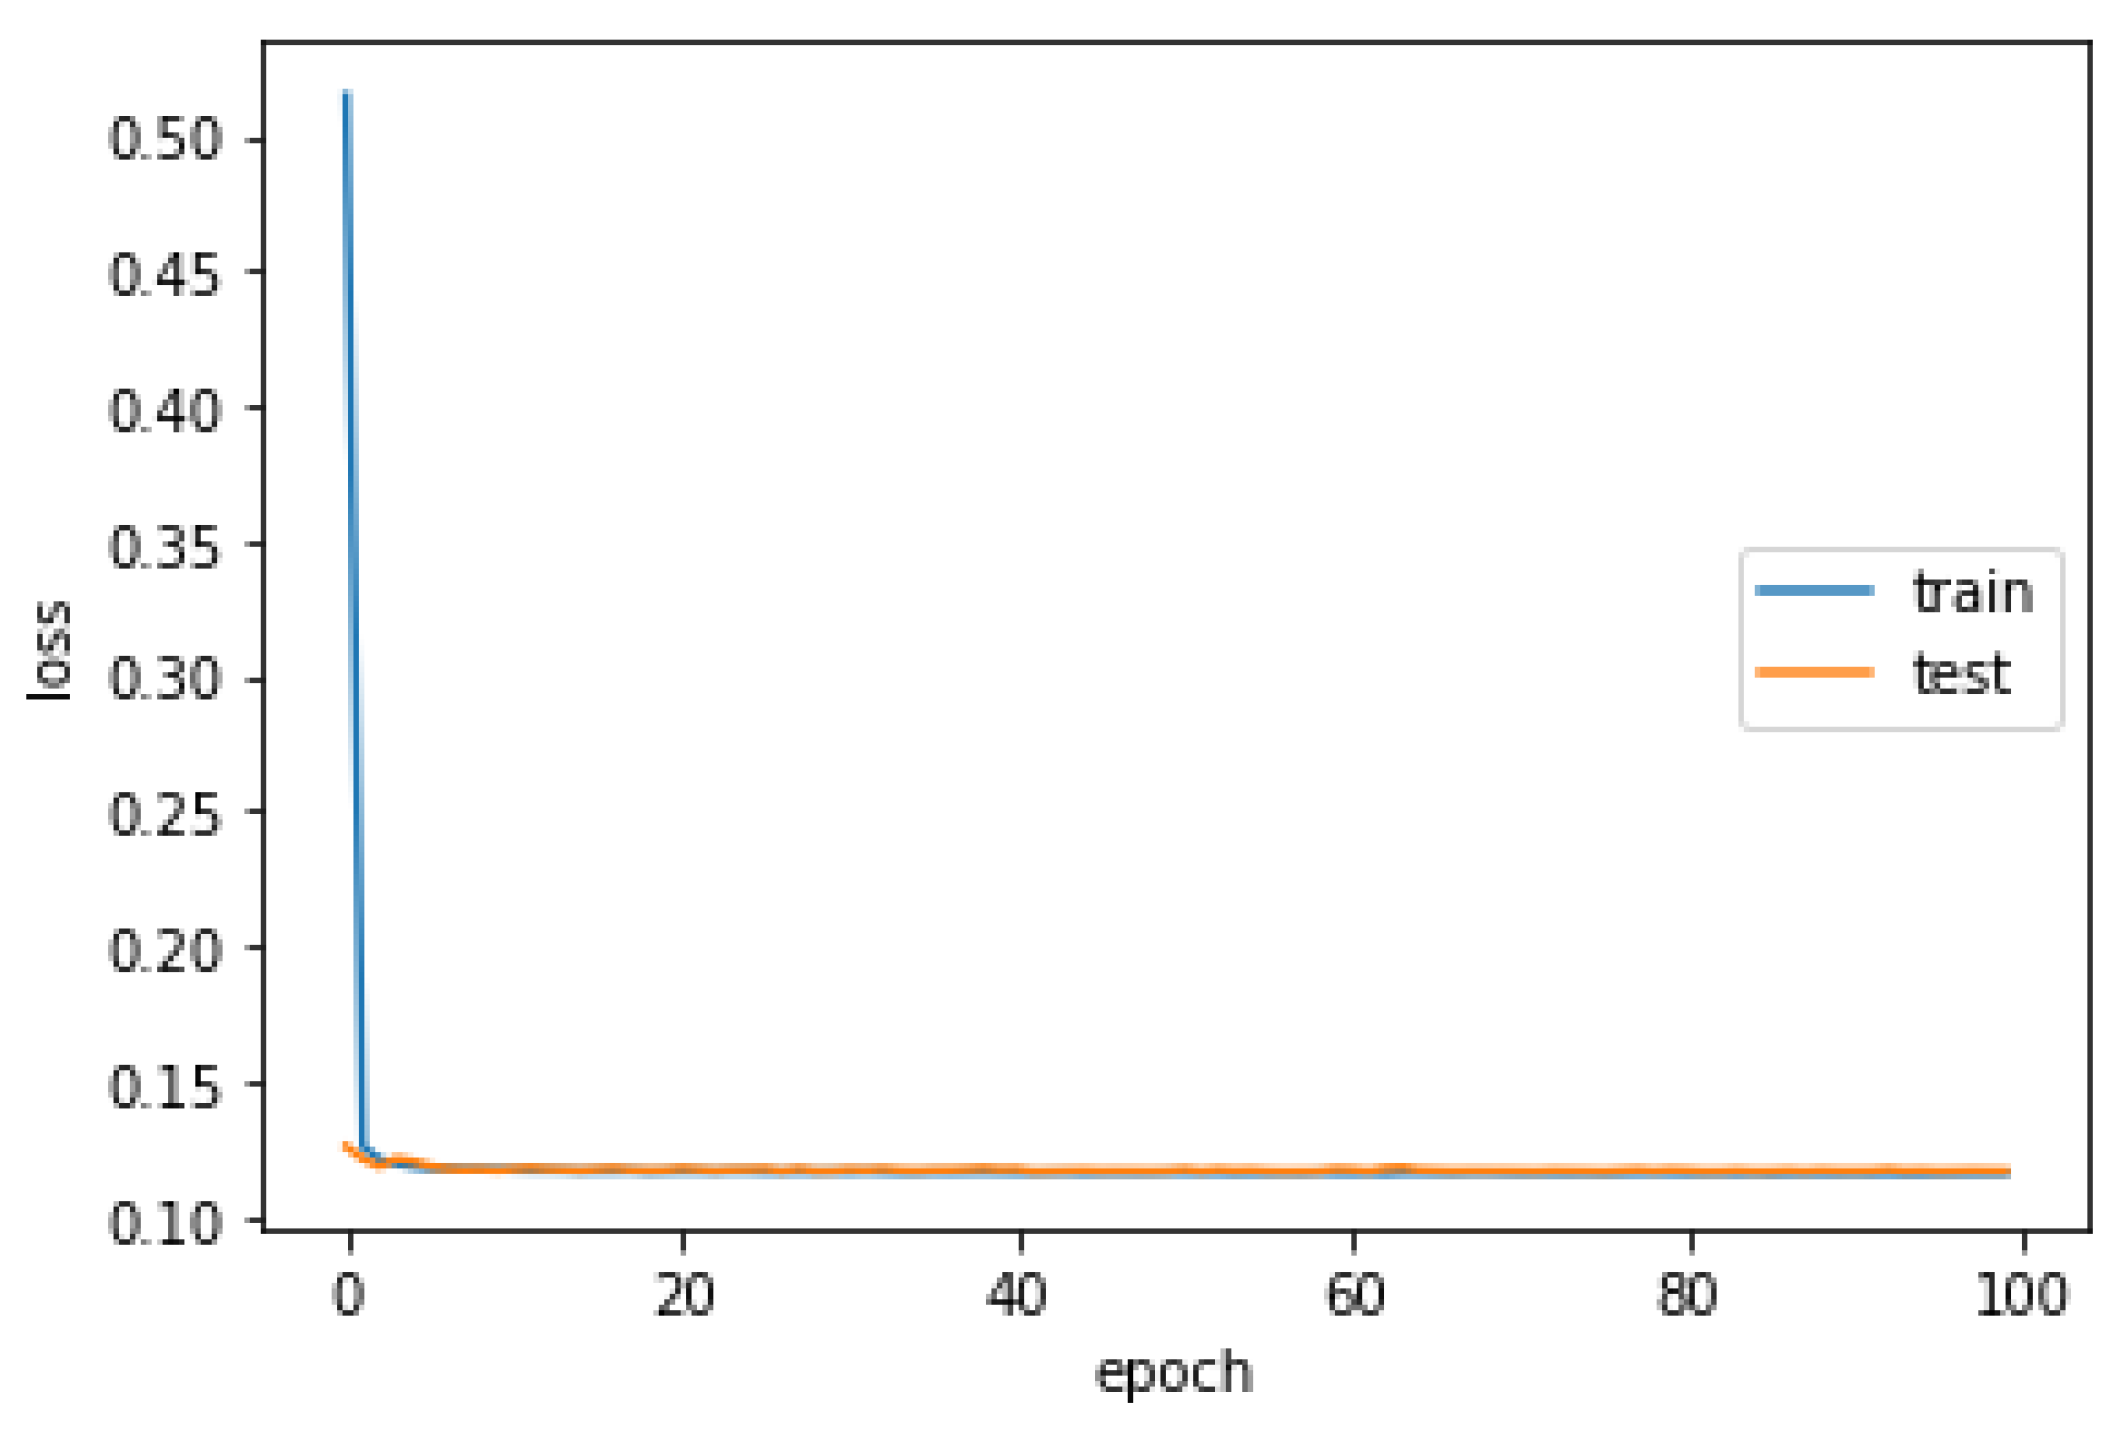
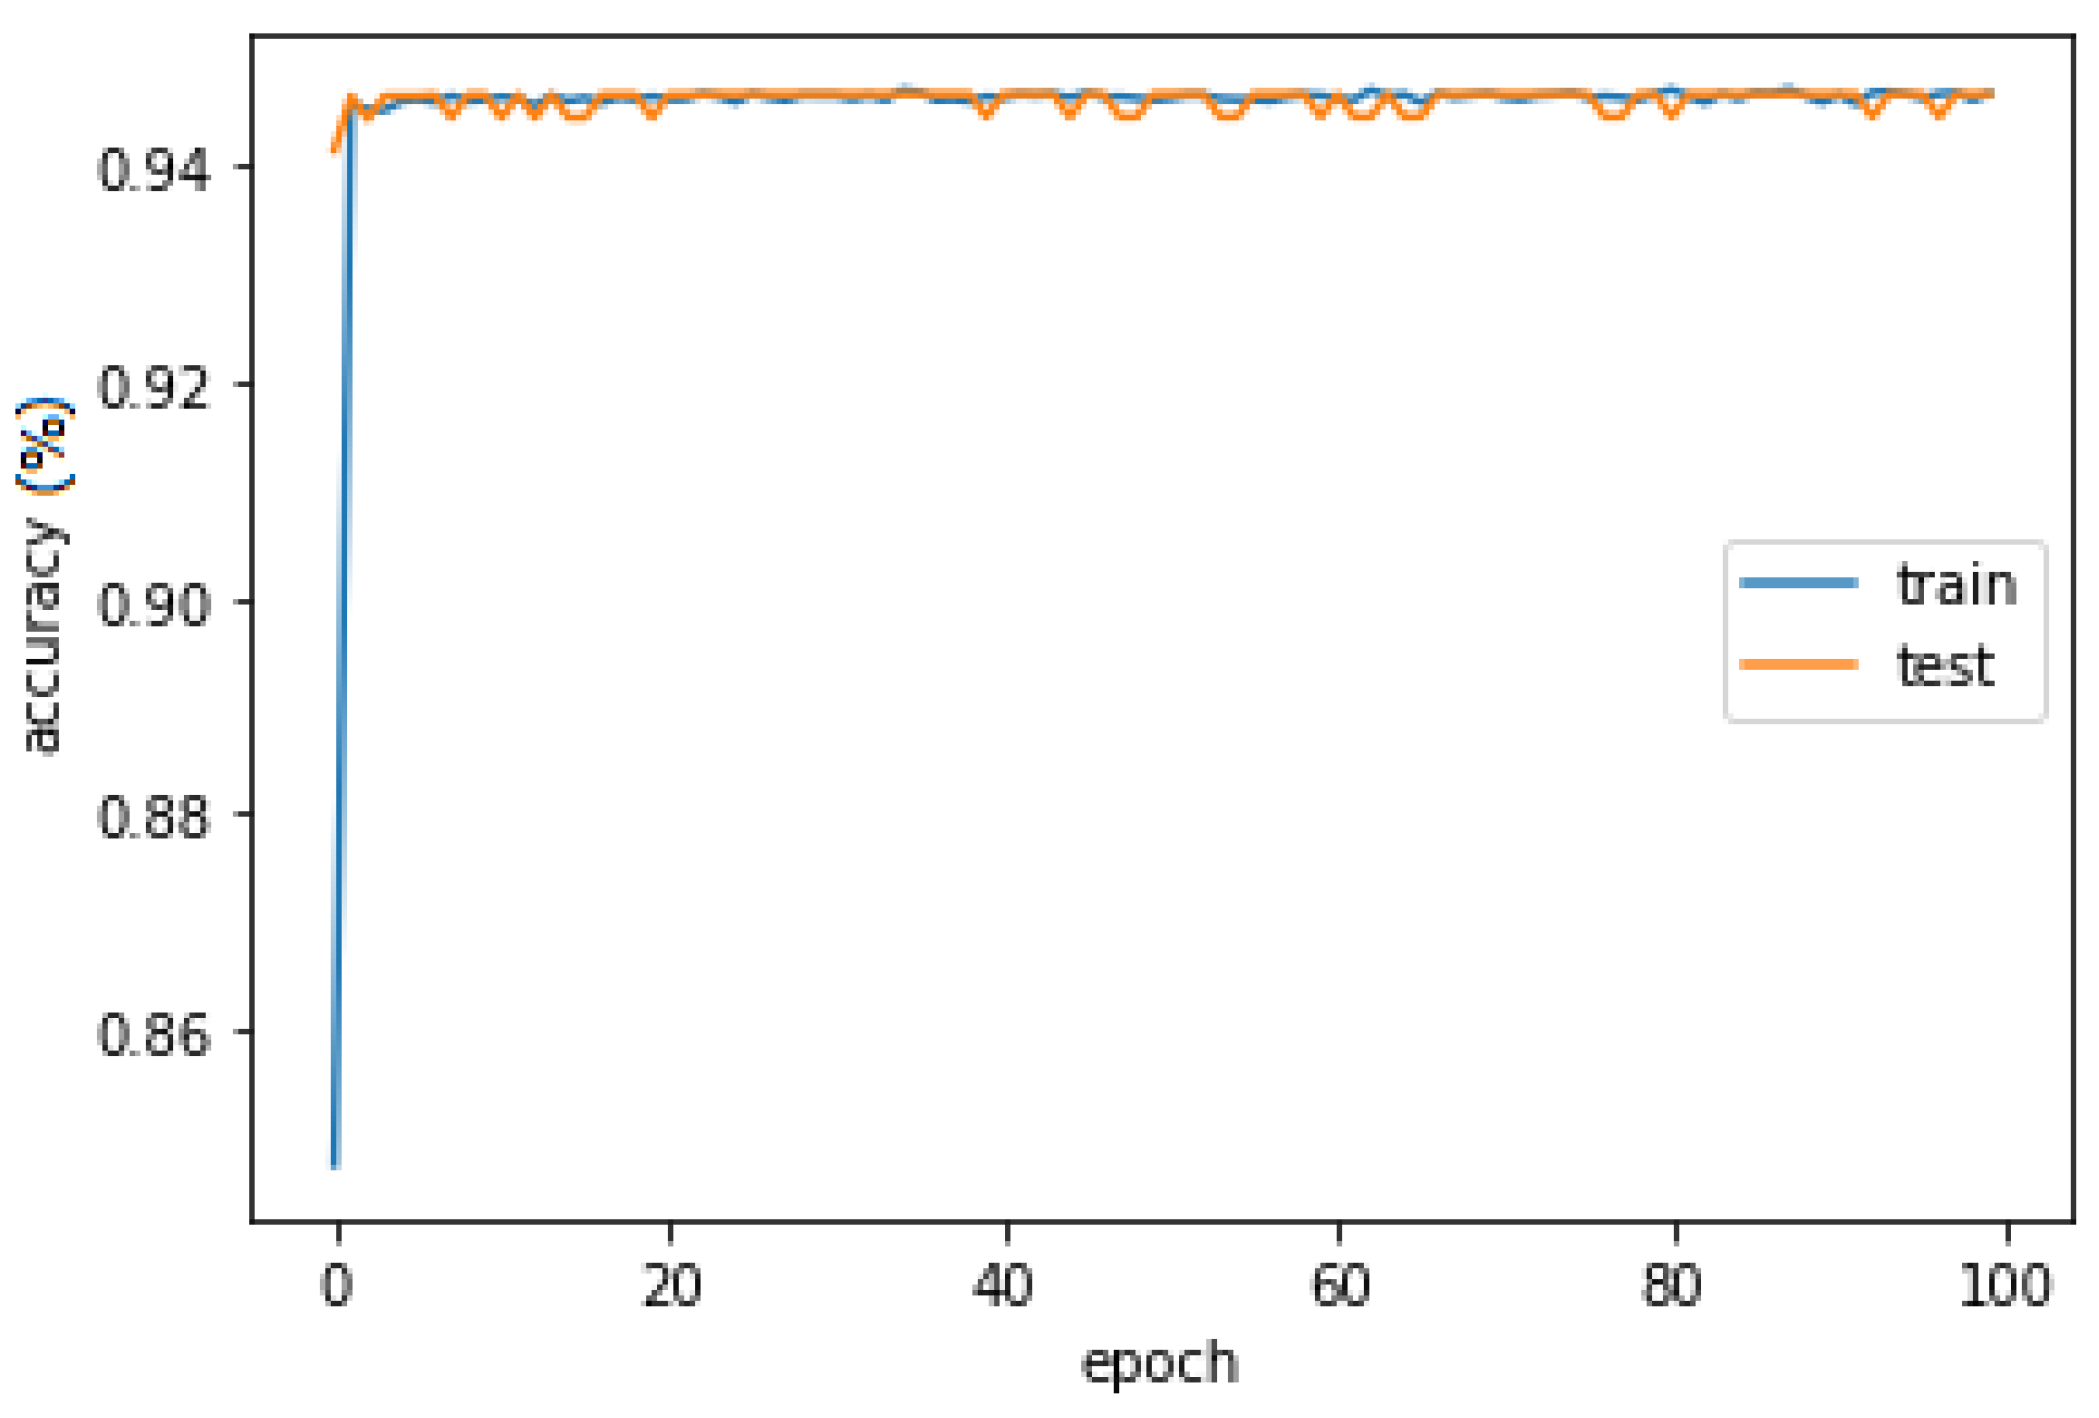
Finally, the LSTM was trained with an optimization procedure that requires a loss function to calculate the model error, allowing a precise summary to be generated through an indicator considering all the assessable aspects of the model. On the one hand, the LSTM model obtains 0.1160 and 0.9465 of the average loss function and accuracy in the training stage, respectively (Figure 6). On the other hand, the inference LSTM model reaches 0.1172 and 0.9466 of the average loss function and prediction accuracy in the validation stage, respectively (Figure 7).

3.2. Experiment 2

A real-life event log containing sepsis case events from a hospital is used in this experiment. Sepsis is a life-threatening condition typically caused by a bacterial infection primarily affecting the stomach, lungs, kidneys, or bladder. The events were recorded by an enterprise resource planning (ERP) system of a hospital in the Netherlands and provided by the Eindhoven University of Technology [32]. The event log contains 1050 cases with a total of 15,214 events that were logged for 16 unique activities. The data was captured from 7 November 2013 to 5 June 2015. A case in the event log represents the patient’s trajectory in their medical care, recording each activity related to their care during their hospital stay.
The LSTM model predicts the next event within the identified behavior in the sepsis care business process with a precision of 0.92 and an accuracy of 0.91 (see Table 4). Furthermore, the model captures the behavior contained in the event log with a recall metric of 0.90. This event log has a highly complex behavior, which has been used in many experiments applying different data mining and machine learning algorithms. Our inference model correctly identifies the behavior with an F1-score metric of 0.90, the harmonic mean of the precision and recall, confirming its ability to predict the next event accurately, very close to the maximum range of 1 on this metric. In the evaluation with the 10-fold cross-validation technique, a very slight decrease in the accuracy metric is observed. However, the inference model maintains high performance, confirming that the change of instances in the folds does not drastically affect its prediction, allowing reliance on the stability of the model’s performance.
Figure 8 shows the ROC curve’s graphical plot calculation, where class 12 obtains the worst ROC-AUC value of 0.779. The rest of the classes received better values in the measurement of the area; for example, in classes 2, 10, 14, 15, and 16, AUC values between 0.802 and 0.842 were reached; classes 3, 9, and 13 obtained values of 0.895, 0.863, and 0.889. On the other hand, classes 6 and 8 reached AUC values of 0.937 and 0.928; and the classes with AUC values closest to 1 in the experiment are 4, 5, 7, and 11 with 0.978, 0.987, 0.965, and 0.987, respectively. In addition, the dotted lines represent the micro-average and the macro-average ROC-AUC, with values of 0.953 and 0.899, respectively.

3.3. Experiment 3

The Hospital Billing event log is derived from the financial modules of an ERP system of a Dutch regional hospital [33]. It contains events related to billing for the medical services provided by the hospital from 2012 to 2016. The activities carried out to bill the medical service are recorded in each trace. All traces are anonymous and do not contain identification or user values for privacy reasons. The event log comprises 100,000 traces, 451,359 events, and 18 unique activities. The event log comprises the concept:name, lifecycle:transition, and time:timestamp attributes.
The inference model obtains acceptable values in all metrics using the hospital billing event log to predict the next event to be executed in the business process. In the precision and accuracy metrics, a value of 0.85 is obtained. In the validation using the 10-fold cross-validation technique, a value of 0.84 is reached (see Table 5), which confirms the stability of the model with any data set, whether to train or test the inference model.
Very high scores are obtained in evaluating the performance of the inference model through the ROC curve. In the micro-average ROC curve, 0.994 is obtained. This curve adds the participation of all classes to calculate the average metric, which is representative of multiclass ROC curve analysis. Figure 9 clearly shows class 17 with the lowest AUC score (0.737), represented by the yellow line. At the other extreme are classes 0, 2, 3, 4, 10, and 12, with the highest AUC values of 0.990, 0.996, 0.991, 0.994, 0.999, and 0.993, respectively. Classes 6, 7, 13, and 16 obtain AUC values of 0.872, 0.899, 0.844, and 0.816. The remaining classes earn AUC scores between 0.906 and 0.984. We conclude that in the inference model with the hospital billing event log, in 13 classes, there is more than 90% probability that the model can distinguish between the positive and negative classes, and in 4 classes, with more than 81% probability to distinguish between classes.

3.4. Experiment 4

The healthcare collaboration event log is artificial, derived from a scenario of collaborative business processes presented in [34]. The business process involves the public (messaging) and private activities of the patient, gynecologist, laboratory, and hospital participants. The business process begins when the patient requests medical attention from the gynecologist, reporting the disease. The gynecologist examines the patient and may determine that a blood test, a prescription, or an order for hospitalization is required, as well as the additional activities needed in the gynecologist’s decision, for the patient to recover her health. The event log contains message interactions between the gynecologist and the patient, the gynecologist with the laboratory and the hospital, and the hospital with the patient. The event log includes 199 traces and 21 activities.
The inference model learns adequately from 159 instances used in the training stage, obtaining good results in predicting the next event, considering that it is an event log with few traces. A value of 0.81 is received in the accuracy metric, in precision and recall of 0.83 and 0.82, respectively, with which an average of 0.82 is obtained in the F1-score measure (see Table 6). In evaluating the prediction using 10-fold cross-validation, a value of 0.81 is reached; observing a low variance is very important with a limited amount of data in the event log. The preceding demonstrates that estimating the model’s performance is less sensitive to data partitioning, which is appropriate.
In Figure 10, all ROC curves incline towards the upper left space of the graph, indicating perfect classification, representing that the TPR is very close to 100% and the FPR is close to 0%. The AUC score in classes 0, 6, 7, 8, and 10 obtain the maximum value, the ideal point in the graph with an FPR = 0 and a TPR = 1, confirming an excellent performance of the inference model in these classes (see Figure 10). Similarly, classes 1, 3, 4, 5, 12, 13, 14, 17, 18, and 19 reached scores above 0.990. Furthermore, classes 9, 11, 16, and 20 obtained AUC values very close to 1, with scores greater than 0.980. In this evaluation of the model’s performance, only classes 2 and 15 obtain low values of 0.952 and 0.902, respectively.

4. Discussion

We introduced the application of deep learning-based event prediction in healthcare processes. Our approach is not based on process models with an explicit or simple flow of activities. It can be applied when the models have high complexity in their behavior and extension. Our results show no available comparison to the state-of-the-art methods in the healthcare domain (experiment 1). Approaches to predicting patient transfer management events (experiment 1) are not found in the literature or reports from extensive recent research. The values obtained in the metrics are encouraging for practical implementations, demonstrating the feasibility and usefulness of this method. The use of LSTM neural networks has been employed in diverse fields of healthcare, e.g., predicting healthcare trajectories from medical records [35], analyzing longitudinal patient records [36], predicting patient spending on medications [37], and predicting an initial diagnosis of heart failure [38]. Regarding experiment 2, in [39], they proposed a method based on LSTM using the event log sepsis to predict the next activity, obtaining a value of 0.60 in the F1-score metric. In [40], it compares the convolutional neural network (CNN) and an LSTM for predicting the next event, reaching a score of 0.57 in the ROC-AUC and 0.84 in the accuracy metrics. Similarly, in [41], they evaluated models based on LSTM and a deep neural network (DNN), reaching 0.66 and 0.57 in the same event log. Our model exceeds the values mentioned in the sepsis event log (experiment 2), reaching 0.91, 0.90, 0.953, and 0.899 in accuracy, F1-score, micro-average ROC-AUC, and macro-average ROC-AUC, respectively.
Concerning experiment 3, in [42], reported a value of 0.78 in the accuracy metric for predicting the next activity in a business process obtained through an LSTM model using the hospital billing event log. Similarly, the authors of [43] present an approach based on a self-attention mechanism called process transformer to predict the next activity, which obtains 85.83 and 0.82 for the accuracy and F1-score metrics. Our LSTM model achieves equal or higher values in the accuracy and F1-score metrics than the proposals mentioned above. Furthermore, the AUC score achieved in each class demonstrates the stability of the prediction model’s performance. Moreover, the average of 0.89 obtained in the 10-fold cross-validation technique indicates that the model distinguishes most cases correctly, that is, the next activity within the business process, regardless of the partition of the tested data set.
The results achieved by the LSTM network model support the hypothesis of implementing deep learning approaches to predict future events within healthcare processes. According to Evermann et al. [21], three factors can (positively or negatively) affect prediction performance. First, parameters initialized randomly in the training phase can lead to different values. Second, traces contained in an event log are in an arbitrary order. Third, the training data selection may influence the prediction, so the results obtained by a testing dataset may not be generalized to others. Nevertheless, our experiment is unaffected by the above factors; we verify each experiment by 10-fold cross-validation, achieving an accuracy of 94%, 88%, 84%, and 81%. The possibility of generalizing to similar datasets is evaluated by comparing the prediction performance from an independent validation sample with the training sample’s prediction performance. Given the complexity that characterizes the clinical and organizational processes in the healthcare domain, it is essential to consider the implementation of process mining approaches when performing data analysis that supports decision-making within a hospital. Furthermore, predicting future events that may occur within the execution of a healthcare process has significant advantages, such as reducing patient care costs, patient waiting time for transfer between hospitals, queue time in patient care, and the time to order a blood test or to hospitalize a patient.
Exploiting event logs to predict the next event is essential for planning activities and resource assignments, such as preparing a machine (computed tomography or magnetic resonance imaging scan) or a resource ready for timely patient care. Therefore, deep learning for predicting events in healthcare processes through process mining approaches is feasible.
In summary, the following advantages and limitations can be described. The framework can be replicated in any organization that uses event logs in XES format and even in data sets that contain a trace/events format. With a trained LSTM model, the processing time required to predict the next event is minimal. The inference model has the ability to predict one or more future events correctly. The LSTM model can remember dependencies when using long data streams. On the other hand, the required processing time will depend on the number of events distributed in the traces contained in an event log. The LSTM network training must be rerun when new instances are added to the dataset. The inference model only operates through the attribute selected in the data extraction stage.

5. Conclusions

We presented a deep learning-based LSTM neural network approach for predicting future events or activities in healthcare processes. Before implementing the LSTM model selected, we pre-processed and binarized the events. Subsequently, we designed a neural network model and trained the network to choose the inference model that achieves the highest performance.
The inference model achieves high performance on accuracy measures, with values of 0.98, 0.91, 0.85, and 0.81 for patient transfer orders, sepsis, hospital billing, and healthcare collaboration event logs, respectively, based on the validation dataset. The accuracy metric is widely used to measure the performance of inference models that predict the next activity in a business process. However, in data sets that present imbalances in their classes, it is recommended to use the F1-score metric, in which values of 0.95, 0.90, 0.85, and 0.82 were reached for the same previously mentioned event logs. Therefore, the predictive method achieves the highest values in the evaluation metrics, which confirms the capability to predict the next event in the healthcare process.
In future work, we aim to extend the input vectors of the LSTM model with additional attributes (resources or participants) of the event log to predict other event types. To meet some of the challenges identified within the healthcare processes, such as estimating the time of occurrence of the next event or predicting the time required to complete a case.

Author Contributions

Conceptualization, U.M.R.-A. and E.T.-L.; methodology, U.M.R.-A. and E.T.-L.; software, U.M.R.-A.; validation, U.M.R.-A., E.T.-L., G.R. and B.A.M.-H.; formal analysis, U.M.R.-A. and E.T.-L.; investigation, U.M.R.-A., E.T.-L., G.R. and B.A.M.-H.; resources, U.M.R.-A. and E.T.-L.; data curation, U.M.R.-A. and E.T.-L.; writing—original draft preparation, U.M.R.-A., E.T.-L., G.R. and B.A.M.-H.; writing—review and editing, U.M.R.-A., E.T.-L., G.R. and B.A.M.-H.; visualization, U.M.R.-A.; supervision, E.T.-L.; project administration, E.T.-L.; funding acquisition, E.T.-L. All authors have read and agreed to the published version of the manuscript.

Funding

This research was partially funded by Universidad Autónoma de Tamaulipas (México) under grant number PEI2018-UAT-2022 and UAT/SIP/INV/2023/043. Also, this work was supported by the Consejo Nacional de Ciencia y Tecnología (CONACYT) of México under grant number 748457.

Institutional Review Board Statement

Not applicable.

Informed Consent Statement

Not applicable.

Data Availability Statement

The data presented in this study are openly available in 4TU.ResearchData (Eindhoven University of Technology) at [32,33].

Acknowledgments

The authors are grateful to the Autonomous University of Tamaulipas, Mexico, for supporting this work.

Conflicts of Interest

The authors declare no conflict of interest.

Abbreviations

The following abbreviations are used in this manuscript:
LSTMLong short-term memory
HISHospital information systems
HIEHealthcare information exchange
EHRElectronic health record
HL7Health level seven
CDAClinical document architecture
FHIRFast healthcare interoperability resources
BPMBusiness process management
RNNRecurrent neural network
ROCReceiver operating characteristics curve
AUCArea under the curve
XESeXtensible event stream
PCPPrimary care provider
SCPSpecialist care provider
TPRTrue positive rate
FPRFalse positive rate
TPTrue positive
TNTrue negative
FPFalse positive
FNFalse negative
EERequal error rate
FNRFalse negative rate
ERPEnterprise resource planning
CNNConvolutional neural network
DNNDeep neural network

References

  1. Hompes, B.; Dixit, P.; Buijs, J. Using Process Analytics to Improve Healthcare Processes. In Data Science for Healthcare: Methodologies and Applications; Consoli, S., Reforgiato Recupero, D., Petković, M., Eds.; Springer International Publishing: Cham, Switzerland, 2019; pp. 305–325. [Google Scholar] [CrossRef]
  2. Sworna, N.S.; Islam, A.M.; Shatabda, S.; Islam, S. Towards development of IoT-ML driven healthcare systems: A survey. J. Netw. Comput. Appl. 2021, 196, 103244. [Google Scholar] [CrossRef]
  3. Soleimani-Roozbahani, F.; Rajabzadeh Ghatari, A.; Radfar, R. Knowledge discovery from a more than a decade studies on healthcare Big Data systems: A scientometrics study. J. Big Data 2019, 6, 8. [Google Scholar] [CrossRef]
  4. Esmaeilzadeh, P.; Sambasivan, M. Health Information Exchange (HIE): A literature review, assimilation pattern and a proposed classification for a new policy approach. J. Biomed. Inform. 2016, 64, 74–86. [Google Scholar] [CrossRef]
  5. Menachemi, N.; Rahurkar, S.; Harle, C.A.; Vest, J.R. The benefits of health information exchange: An updated systematic review. J. Am. Med. Inform. Assoc. 2018, 25, 1259–1265. [Google Scholar] [CrossRef] [PubMed]
  6. Health Level Seven International. HL7 version 2.x (V2) Messaging Standard. 2018. Available online: https://www.hl7.org/implement/standards/product_brief.cfm?product_id=185 (accessed on 1 August 2023).
  7. Health Level Seven International CDA. Clinical Document Architecture (CDA) Standard. 2018. Available online: https://www.hl7.org/implement/standards/product_brief.cfm?product_id=7 (accessed on 1 August 2023).
  8. Health Level Seven International FHIR. Introducing HL7 Fast Healthcare Interoperability Resources (FHIR) Specification 4.00. 2018. Available online: http://www.hl7.org/implement/standards/fhir/summary.html (accessed on 1 August 2023).
  9. Vathy-Fogarassy, A.; Vassányi, I.; Kósa, I. Multi-level process mining methodology for exploring disease-specific care processes. J. Biomed. Inform. 2022, 125, 103979. [Google Scholar] [CrossRef] [PubMed]
  10. Rojas, E.; Munoz-Gama, J.; Sepúlveda, M.; Capurro, D. Process mining in healthcare: A literature review. J. Biomed. Inform. 2016, 61, 224–236. [Google Scholar] [CrossRef]
  11. dos Santos Garcia, C.; Meincheim, A.; Junior, E.R.F.; Dallagassa, M.R.; Sato, D.M.V.; Carvalho, D.R.; Santos, E.A.P.; Scalabrin, E.E. Process mining techniques and applications—A systematic mapping study. Expert Syst. Appl. 2019, 133, 260–295. [Google Scholar] [CrossRef]
  12. Dumas, M.; Rosa, M.L.; Mendling, J.; Reijers, H.A. Introduction to Business Process Management. In Fundamentals of Business Process Management; Springer: Berlin/Heidelberg, Germany; New York, NY, USA, 2018; pp. 1–34. [Google Scholar] [CrossRef]
  13. Rebuge, A.; Ferreira, D.R. Business process analysis in healthcare environments: A methodology based on process mining. Inf. Syst. 2012, 37, 99–116. [Google Scholar] [CrossRef]
  14. Martin, N.; De Weerdt, J.; Fernández-Llatas, C.; Gal, A.; Gatta, R.; Ibáñez, G.; Johnson, O.; Mannhardt, F.; Marco-Ruiz, L.; Mertens, S.; et al. Recommendations for enhancing the usability and understandability of process mining in healthcare. Artif. Intell. Med. 2020, 109, 101962. [Google Scholar] [CrossRef]
  15. Agostinelli, S.; Covino, F.; D’Agnese, G.; De Crea, C.; Leotta, F.; Marrella, A. Supporting Governance in Healthcare Through Process Mining: A Case Study. IEEE Access 2020, 8, 186012–186025. [Google Scholar] [CrossRef]
  16. Erdogan, T.G.; Tarhan, A. Systematic Mapping of Process Mining Studies in Healthcare. IEEE Access 2018, 6, 24543–24567. [Google Scholar] [CrossRef]
  17. Remy, S.; Pufahl, L.; Sachs, J.P.; Böttinger, E.; Weske, M. Event Log Generation in a Health System: A Case Study. In Business Process Management: 18th International Conference (BPM 2020), Seville, Spain, 13–18 September 2020; Fahland, D., Ghidini, C., Becker, J., Dumas, M., Eds.; Springer International Publishing: Cham, Switzerland, 2020; pp. 505–522. [Google Scholar] [CrossRef]
  18. van Andel, V.; Beerepoot, I.; Lu, X.; van de Weerd, I.; Reijers, H.A. DEUCE: A Methodology for Detecting Unauthorized Access of Electronic Health Records Using Process Mining. In Proceedings of the 29th European Conference on Information Systems (ECIS 2021), Marrakech, Morocco, 14–16 June 2021; pp. 1–14. [Google Scholar]
  19. Van der Aalst, W. Process Mining: Data Science in Action, 2nd ed.; Springer: New York, NY, USA, 2016; p. 467. [Google Scholar] [CrossRef]
  20. Rovani, M.; Maggi, F.M.; de Leoni, M.; van der Aalst, W.M. Declarative process mining in healthcare. Expert Syst. Appl. 2015, 42, 9236–9251. [Google Scholar] [CrossRef]
  21. Evermann, J.; Rehse, J.R.; Fettke, P. Predicting process behaviour using deep learning. Decis. Support Syst. 2017, 100, 129–140. [Google Scholar] [CrossRef]
  22. Breuker, D.; Matzner, M.; Delfmann, P.; Becker, J. Comprehensible Predictive Models for Business Processes. MIS Q. Support Syst. 2016, 40, 1009–1034. [Google Scholar] [CrossRef]
  23. De Koninck, P.; vanden Broucke, S.; De Weerdt, J. act2vec, trace2vec, log2vec, and model2vec: Representation Learning for Business Processes. In Business Process Management: 16th International Conference (BPM 2018), Sydney, NSW, Australia, 9–14 September 2018; Weske, M., Montali, M., Weber, I., vom Brocke, J., Eds.; Springer International Publishing: Cham, Switzerland, 2018; pp. 305–321. [Google Scholar] [CrossRef]
  24. Muniasamy, A.; Tabassam, S.; Hussain, M.A.; Sultana, H.; Muniasamy, V.; Bhatnagar, R. Deep Learning for Predictive Analytics in Healthcare. In Proceedings of the International Conference on Advanced Machine Learning Technologies and Applications (AMLTA2019), Cairo, Egypt, 28–30 March 2019; Hassanien, A.E., Azar, A.T., Gaber, T., Bhatnagar, R., Tolba, F.M., Eds.; Springer International Publishing: Cham, Switzerland, 2020; pp. 32–42. [Google Scholar] [CrossRef]
  25. Maggi, F.M.; Di Francescomarino, C.; Dumas, M.; Ghidini, C. Predictive Monitoring of Business Processes. In Proceedings of the Advanced Information Systems Engineering Conference, Thessaloniki, Greece, 16–20 June 2014; Jarke, M., Mylopoulos, J., Quix, C., Rolland, C., Manolopoulos, Y., Mouratidis, H., Horkoff, J., Eds.; Springer International Publishing: Cham, Switzerland, 2014; pp. 457–472. [Google Scholar] [CrossRef]
  26. Cui, L.; Jing, X.; Wang, Y.; Huan, Y.; Xu, Y.; Zhang, Q. Improved Swin Transformer-Based Semantic Segmentation of Postearthquake Dense Buildings in Urban Areas Using Remote Sensing Images. IEEE J. Sel. Top. Appl. Earth Obs. Remote Sens. 2023, 16, 369–385. [Google Scholar] [CrossRef]
  27. Tian, Y.; Xu, Y.; Zhang, D.; Li, H. Relationship modeling between vehicle-induced girder vertical deflection and cable tension by BiLSTM using field monitoring data of a cable-stayed bridge. Struct. Control Health Monit. 2021, 28, e2667. [Google Scholar] [CrossRef]
  28. Xia, W.; Zhu, W.; Liao, B.; Chen, M.; Cai, L.; Huang, L. Novel architecture for long short-term memory used in question classification. Neurocomputing 2018, 299, 20–31. [Google Scholar] [CrossRef]
  29. eXtensible Event Stream (XES). 1849–2016—IEEE Standard for eXtensible Event Stream (XES) for Achieving Interoperability in Event Logs and Event Streams. 2016. Available online: http://www.xes-standard.org/ (accessed on 1 August 2023).
  30. Keras. Keras: The Python Deep Learning API. 2020. Available online: https://keras.io/ (accessed on 1 August 2023).
  31. Tello-Leal, E.; Villarreal, P.D.; Chiotti, O.; Rios-Alvarado, A.B.; Lopez-Arevalo, I. A Technological Solution to Provide Integrated and Process-Oriented Care Services in Healthcare Organizations. IEEE Trans. Ind. Inform. 2016, 12, 1508–1518. [Google Scholar] [CrossRef]
  32. Mannhardt, F. Sepsis Cases—Event Log. Res. Data 2016. [Google Scholar] [CrossRef]
  33. Mannhardt, F. Hospital Billing—Event Log. Res. Data 2017. [Google Scholar] [CrossRef]
  34. Corradini, F.; Re, B.; Rossi, L.; Tiezzi, F. A Technique for Collaboration Discovery. In Proceedings of the 23rd International Conference (BPMDS 2022) and 27th International Conference (EMMSAD 2022), Leuven, Belgium, 6–7 June 2022; Augusto, A., Gill, A., Bork, D., Nurcan, S., Reinhartz-Berger, I., Schmidt, R., Eds.; Springer International Publishing: Cham, Switzerland, 2022; pp. 63–78. [Google Scholar] [CrossRef]
  35. Pham, T.; Tran, T.; Phung, D.; Venkatesh, S. Predicting healthcare trajectories from medical records: A deep learning approach. J. Biomed. Inform. 2017, 69, 218–229. [Google Scholar] [CrossRef]
  36. Baytas, I.M.; Xiao, C.; Zhang, X.; Wang, F.; Jain, A.K.; Zhou, J. Patient Subtyping via Time-Aware LSTM Networks. In Proceedings of the 23rd ACM SIGKDD International Conference on Knowledge Discovery and Data Mining (KDD ’17), Halifax, NS, Canada, 13–17 August 2017; ACM: New York, NY, USA, 2017; pp. 65–74. [Google Scholar] [CrossRef]
  37. Kaushik, S.; Choudhury, A.; Dasgupta, N.; Natarajan, S.; Pickett, L.A.; Dutt, V. Using LSTMs for Predicting Patient’s Expenditure on Medications. In Proceedings of the 2017 International Conference on Machine Learning and Data Science (MLDS), Noida, India, 14–15 December 2017; pp. 120–127. [Google Scholar] [CrossRef]
  38. Maragatham, G.; Devi, S. LSTM Model for Prediction of Heart Failure in Big Data. J. Med. Syst. 2019, 43, 111. [Google Scholar] [CrossRef] [PubMed]
  39. Fani Sani, M.; Vazifehdoostirani, M.; Park, G.; Pegoraro, M.; van Zelst, S.J.; van der Aalst, W.M. Performance-preserving event log sampling for predictive monitoring. J. Intell. Inf. Syst. 2023, 61, 53–82. [Google Scholar] [CrossRef]
  40. Weytjens, H.; De Weerdt, J. Process Outcome Prediction: CNN vs. LSTM (with Attention). In Proceedings of the Business Process Management (BPM 2020) International Workshops, Seville, Spain, 13–18 September 2020; Del Río Ortega, A., Leopold, H., Santoro, F.M., Eds.; Springer International Publishing: Cham, Switzerland, 2020; pp. 321–333. [Google Scholar] [CrossRef]
  41. Tama, B.A.; Comuzzi, M. An empirical comparison of classification techniques for next event prediction using business process event logs. Expert Syst. Appl. 2019, 129, 233–245. [Google Scholar] [CrossRef]
  42. Ni, W.; Zhao, G.; Liu, T.; Zeng, Q.; Xu, X. Predictive Business Process Monitoring Approach Based on Hierarchical Transformer. Electronics 2023, 12, 1273. [Google Scholar] [CrossRef]
  43. Bukhsh, Z.A.; Saeed, A.; Dijkman, R.M. ProcessTransformer: Predictive Business Process Monitoring with Transformer Network. arXiv 2021, arXiv:2104.00721. [Google Scholar] [CrossRef]
Figure 1. Next event prediction framework overview.
Information 14 00508 g001
Figure 2. Operation schema of the segmentation task.
Information 14 00508 g002
Figure 3. One-hot vector representation of the output activities.
Information 14 00508 g003
Figure 4. Architecture of a single LSTM cell.
Information 14 00508 g004
Figure 5. Receiver operating characteristic (ROC) curves and their area under the curves (AUC) of worst classes existing in the validation stage of our experiment.
Information 14 00508 g005
Figure 6. Loss function in the training and validation phases by epoch.
Information 14 00508 g006
Figure 7. Accuracy in the training and validation phases by epoch.
Information 14 00508 g007
Figure 8. ROC curves using all classes of the sepsis event log.
Information 14 00508 g008
Figure 9. ROC curves using all classes of the hospital billing event log.
Information 14 00508 g009
Figure 10. ROC curves using all classes of the healthcare collaboration event log.
Information 14 00508 g010
Table 1. Example of the patient transfer order event log.
Case-IDActivityResourceTimestampAcronym
1707Generate Patient Transfer OrderHospital Social Worker2017-06-06 12:46:40GPTO
1707Propose Patient Transfer OrderHospital Social Worker2017-06-06 13:08:20PPTO
1707Accept-proposal PTO ResponseSystem Message2017-06-06 13:10:00APPR
1707Inform Referral NumberSystem Message2017-06-06 13:11:40IRN
1707Store Referral NumberAutomated Service2017-06-06 13:13:20SRN
1707Generate Patient Referral LetterMedical Office Administrator2017-06-07 08:16:40GPRL
1707Inform Patient Referral LetterMedical Office Administrator2017-06-08 05:06:40IPRL
1707Inform Referral Letter ChangeSystem Message2017-06-08 05:08:20IRLC
1707Analyze Requested ChangeMedical Office Administrator2017-06-09 05:23:20ARC
1707Generate Patient Referral LetterMedical Office Administrator2017-06-10 05:38:20GPRL
1707Inform Patient Referral LetterMedical Office Administrator2017-06-11 05:53:20IPRL
1707Confirm Patient ReceptionSystem Message2017-06-11 05:55:00CPR
1707Store Patient ReceptionAutomated Service2017-06-11 05:56:40SPR
1707Confirm Patient Referral ReceiptSystem Message2017-06-11 05:58:20CPRR
1707Store Patient Referral ReceiptAutomated Service2017-06-11 06:00:00SPRR
1707Inform Discharge NoteSystem Message2017-06-11 06:01:40IDN
1707Inform Medical SummarySystem Message2017-06-11 06:01:41IMS
1707Store Discharge NoteAutomated Service2017-06-11 06:03:20SDN
1707Store Medical SummaryAutomated Service2017-06-11 06:03:21SMS
Table 2. Extraction of the LSTM prediction results.
InstanceInputTargetOutput
NumberActivityEventEvent
1STARTGPTOGPTO
2GPTOPPTORPPR
3PPTOAPPR∣RPPRIMS
4APPRIRNIRN
5GPRL IPRLCPR∣IRLCIRLC
6IPRL IRLCARCARC
7IRLC ARCGPRLGPRL
8APPR IRN SRNGPRLGPRL
9IRN SRN GPRLIPRLIPRL
10SRN GPRL IPRLIRLCIRLC
Table 3. Key performance measures achieved by the inference method at the validation stage using the patient transfer event log.
10-Fold
Event LogPrecisionAccuracyRecallF1-ScoreCross-Validation
Patient transfer order0.980.940.940.950.94
Table 4. Key performance measures achieved by the inference method at the validation stage using the sepsis event log.
10-Fold
Event LogPrecisionAccuracyRecallF1-ScoreCross-Validation
Sepsis0.920.910.900.900.88
Table 5. Key performance measures achieved by the inference method at the validation stage using the hospital billing event log.
10-Fold
Event LogPrecisionAccuracyRecallF1-ScoreCross-Validation
Hospital billing0.850.850.860.850.84
Table 6. Key performance measures achieved by the inference method at the validation stage using the healthcare collaboration event log.
10-Fold
Event LogPrecisionAccuracyRecallF1-ScoreCross-Validation
Healthcare collaboration0.830.810.820.820.81
Disclaimer/Publisher’s Note: The statements, opinions and data contained in all publications are solely those of the individual author(s) and contributor(s) and not of MDPI and/or the editor(s). MDPI and/or the editor(s) disclaim responsibility for any injury to people or property resulting from any ideas, methods, instructions or products referred to in the content.

