Article

FinChain-BERT: A High-Accuracy Automatic Fraud Detection Model Based on NLP Methods for Financial Scenarios

1
China Agricultural University, Beijing 100083, China
2
School of Business and Managemen, Jilin University, Jilin 130015, China
3
School of Software and Microelectronics, Peking University, Beijing 100083, China
4
Applied Computational Science and Engineering, Imperial College London, South Kensington Campus, London SW7 2AZ, UK
*
Author to whom correspondence should be addressed.
Information 2023, 14(9), 499; https://doi.org/10.3390/info14090499
Submission received: 30 July 2023 / Revised: 4 September 2023 / Accepted: 8 September 2023 / Published: 12 September 2023
(This article belongs to the Special Issue Information Extraction and Language Discourse Processing)

Abstract

:
This research primarily explores the application of Natural Language Processing (NLP) technology in precision financial fraud detection, with a particular focus on the implementation and optimization of the FinChain-BERT model. Firstly, the FinChain-BERT model has been successfully employed for financial fraud detection tasks, improving the capability of handling complex financial text information through deep learning techniques. Secondly, novel attempts have been made in the selection of loss functions, with a comparison conducted between negative log-likelihood function and Keywords Loss Function. The results indicated that the Keywords Loss Function outperforms the negative log-likelihood function when applied to the FinChain-BERT model. Experimental results validated the efficacy of the FinChain-BERT model and its optimization measures. Whether in the selection of loss functions or the application of lightweight technology, the FinChain-BERT model demonstrated superior performance. The utilization of Keywords Loss Function resulted in a model achieving 0.97 in terms of accuracy, recall, and precision. Simultaneously, the model size was successfully reduced to 43 MB through the application of integer distillation technology, which holds significant importance for environments with limited computational resources. In conclusion, this research makes a crucial contribution to the application of NLP in financial fraud detection and provides a useful reference for future studies.

1. Introduction

Financial fraud, broadly defined as the intentional act of deceiving people or entities for monetary gain, is a grave issue that poses threats to individuals, corporations, and the global economic system [1]. Such deceitful actions often leverage intricate financial terminology and language to hide fraudulent activities. These terms, although crafted for specificity and legal clarity in financial domains, can be twisted to generate ambiguity, complicating fraud detection processes. Given the variety of financial instruments and the multifaceted nature of economic activities, fraud can manifest in numerous ways. This variability demands a flexible and encompassing approach to detection. Specifically, the challenge lies in designing mathematical models that can accurately parse, classify, and interpret the nuances of financial language [2,3,4]. However, current models, as indicated by [5], exhibit shortcomings in accurately classifying these terms, leading to potential blind spots in fraud detection efforts. It is essential to understand that financial fraud detection is primarily a data-driven exercise. Efficient detection relies on mathematical models that can sift through vast amounts of data, recognize patterns, and flag potential anomalies indicative of fraud. The integrity of financial markets hinges on the capacity to improve these models [6], ensuring the safety of investments [7,8]. As such, the central aim of this paper is to propose a more refined model for the precise classification of financial terms, leading to enhanced fraud detection capabilities.
Natural language processing (NLP) models, such as those noted in [9,10,11,12], have demonstrated significant utility in various domains. For instance, models employed for sentiment analysis [13,14,15,16] have achieved breakthroughs in deriving insights from subjective information in text, while those used for text summarization [17] have demonstrated capabilities to distill complex narratives into concise summaries. However, when these powerful models are applied to the domain of finance, their performance tends to be less impressive due to the specialized and complex nature of financial language. One key issue lies in their inconsistent ability to correctly interpret and classify financial terminologies, which often possess unique connotations that differ from their ordinary language counterparts. Additionally, these models often face challenges in dealing with the subtlety of deceptive wording in financial fraud, largely due to the sophisticated tactics used to disguise fraudulent intent.
Delving into specifics, key challenges with current NLP models significantly hinder their effectiveness in financial term classification and fraud detection. First, existing loss function optimization strategies often result in a slow convergence rate during model training, extending the model training duration and reducing the process’s overall efficiency. Secondly, the extraction precision of key financial terms is a fundamental issue. Current NLP models frequently struggle with correctly identifying and emphasizing these critical terms due to their intricate and domain-specific meanings, leading to potential inaccuracies in detecting fraudulent information. Lastly, the considerable size and complexity of these models pose a significant constraint on their deployability and efficiency in resource-limited environments. These challenges underscore the need for an improved model optimized for financial term classification with enhanced loss function convergence, more accurate extraction of key financial terms, and reduced model complexity for efficient deployment. This research is aimed at addressing these pressing needs in the field of NLP applied to finance. In this work, we present a cutting-edge NLP model tailored for the intricate nuances of the financial domain, aiming to identify and discern potential fraudulent activities embedded within financial texts. At the core of our contributions is the FinChain-BERT, a model crafted explicitly for pinpointing deceptive financial terminologies. Here are the distinguishing features and contributions of this research:
1.
FinChain-BERT: An avant-garde model uniquely positioned to recognize financial fraud terms, underscoring our commitment to advancing the precision in the realm of fraud detection.
2.
Advanced Optimization: By integrating the Stable-Momentum Adam Optimizer, we have significantly accelerated the convergence of the loss function, enhancing the model’s learning efficiency.
3.
Fraud Focus Filter: This specially curated filter zeroes in on vital financial terms, ensuring that the model’s attention is consistently directed towards potentially deceptive indicators.
4.
Keywords Loss Function: A novel loss calculation approach that attributes heightened significance to essential financial terms, ensuring the model is finely attuned to subtleties that might otherwise be overlooked.
5.
Efficient Model Lightening with Int-Distillation: Through meticulous integer computation and strategic pruning of network layers, we have streamlined the model, bolstering its adaptability and scalability without compromising on performance.
6.
Custom-Built Dataset Contribution: Drawing from our meticulous data collection methodology, we have supplemented our research with a high-quality, self-curated dataset, reinforcing the model’s understanding of real-world financial intricacies and scenarios.
Together, these innovations position FinChain-BERT as a formidable asset in the ongoing battle against financial fraud. By elevating the precision of fraud detection, we hope to substantially mitigate the inherent risks tied to financial malpractices, fostering a safer and more transparent financial landscape. The rest of this paper is organized as follows: Section 2 provides a review of the existing literature on NLP techniques for financial data comprehension. Section 3 demonstrates the materials used in this paper and the processes employed. Section 4 details the design of our improved NLP model. Section 5 presents a comprehensive evaluation of the model’s performance and discusses the experimental results. Finally, Section 6 concludes the paper and suggests directions for future research.

2. Related Work

Financial fraud detection is an ever-evolving challenge, intricately woven with the increasing complexity of financial systems and the expanding magnitude of data these systems produce. This ever-expanding realm of financial data, ranging from transactional data to textual information such as financial reports, necessitates sophisticated tools for analysis and comprehension.
Natural language processing has risen as a beacon in this storm of data, offering the promise of extracting meaningful insights from raw, unstructured text. In the early days of NLP, the predominant methodologies were rooted in statistical learning and rule-based systems. These approaches were grounded in manually crafted rules or simple statistical measures that would identify patterns in data. While these methods provided foundational insights, their static nature often fell short in detecting sophisticated financial fraud tactics that evolved over time. The limitations of these traditional approaches paved the way for more dynamic and adaptive models based on deep learning and neural networks. These models brought the advantage of learning representations directly from data, negating the need for manual feature engineering. Among the forefront of these models are the Recurrent Neural Networks (RNN) [18], Long Short-Term Memory (LSTM) networks [19], and more recently, the Transformer models, which have garnered significant attention for their effectiveness in various NLP tasks.
1.
RNNs offered the first glimpse into processing sequences in data, an essential feature for understanding time-bound financial transactions. By retaining memory from previous inputs, RNNs provided a way to establish continuity in data, a crucial aspect for tracking fraudulent activities over a period.
2.
LSTMs, an evolution over RNNs, tackled some of the RNN’s inherent limitations, specifically their struggle with long-term dependencies. In the vast temporal landscapes of financial transactions, the ability to remember events from the distant past (such as a suspicious transaction from months ago) can be critical in spotting fraudulent activities.
3.
Transformer models, on the other hand, introduced a paradigm shift by eliminating the sequential nature of processing data. Their emphasis on attention mechanisms enabled them to capture relationships in data irrespective of the distance between elements, offering a robust model for detecting intricate fraud patterns spread across vast datasets.
In this section, we will delve deeper into the mathematical intricacies of these models, exploring their working principles. More importantly, we will contextualize their applications in the realm of financial fraud detection, highlighting both their successes and the challenges that persist.

2.1. Recurrent Neural Network and Its Relevance in Financial Fraud Detection

RNNs, with their unique capability to handle sequential data, found rapid adoption in various financial tasks. Their innate ability to memorize past data sequences made them particularly relevant for tasks such as predicting stock prices, analyzing market trends, and crucially, fraud detection. Financial transactions, by their very nature, follow a sequence. A suspicious transaction often is not an isolated event; it is typically a culmination of a series of prior transactions. RNNs, with their memory function, can trace back these transactions, allowing analysts to identify patterns that might allude to fraudulent activities. For instance, a sudden surge in transaction volume, when observed in the context of past activities, can be a flag indicating potential fraud.
The capability of computing sequential data of RNN is accomplished through the following recursive formulas:
h t = σ ( W h h h t 1 + W x h x t + b h )
y t = W h y h t + b y
The h t represents the hidden state at time step t, x t is the input at time step t, y t is the output, W and b are model parameters, and σ is an activation function such as sigmoid or tanh.
In the realm of fraud detection, RNNs have been successfully deployed in monitoring banking transactions in real-time. They have shown a marked improvement in detection accuracy over traditional rule-based systems, especially when dealing with sophisticated fraud tactics that slowly siphon money over an extended period. The model’s capability to remember past sequences, and consequently, recognize anomalous behavior patterns, has been instrumental in these successes. However, the same memory function of RNNs, while being a strength, is also a source of its primary challenge. As the sequences grow longer, RNNs suffer from vanishing and exploding gradient problems. In financial contexts, where data sequences span months or even years, this becomes a tangible concern. This means that in scenarios where recognizing a long-term pattern is critical to detect fraud, RNNs might fall short. Furthermore, their sequential nature means that processing vast datasets can be time consuming, which is less than ideal in real-time fraud detection scenarios where timely intervention is paramount.
In conclusion, while RNNs have significantly advanced the capabilities of fraud detection systems, their inherent limitations necessitate further improvements or hybrid models that combine the strengths of various neural network architectures to better cater to the dynamic landscape of financial fraud.

2.2. Relevance of Long Short-Term Memory in Financial Fraud Detection

While RNNs presented promising strides in handling sequential data, they were inherently limited in processing long-term dependencies. This limitation was significantly addressed when Hochreiter and Schmidhuber introduced the LSTM network in 1997 [19]. By ingeniously incorporating gate mechanisms and cell states, LSTMs empowered the network to judiciously decide on retaining or discarding prior information, a feature especially pertinent for lengthy financial sequences. The associated mathematical formula is as follows:
f t = σ ( W f [ h t 1 , x t ] + b f )
i t = σ ( W i [ h t 1 , x t ] + b i )
C ˜ t = t a n h ( W C [ h t 1 , x t ] + b C )
C t = f t C t 1 + i t C ˜ t
o t = σ ( W o [ h t 1 , x t ] + b o )
h t = o t t a n h ( C t )
The key components are the forget gate ( f t ), input gate ( i t ), and output gate ( o t ), which work in tandem to regulate the flow of information in the network. The introduction of LSTMs marked a significant leap in fraud detection capabilities. Their superior handling of long-term dependencies meant that LSTMs could better recognize extended patterns of fraudulent activities, especially ones spread across vast timeframes, outshining their RNN counterparts.
However, their brilliance does come with shortcomings. The very intricacy that makes LSTMs potent also adds to their computational demands. Their elaborate structure can be a bottleneck when processing vast swaths of financial data, potentially leading to delays in real-time fraud detection. Moreover, while they masterfully handle long-term dependencies, their efficacy diminishes when it comes to discerning long-distance relationships within data. This can be problematic when trying to correlate distant financial events to predict or detect anomalous behaviors. The inherent complexity of LSTMs, combined with vast data, can also lead them down the path of overfitting, where they become excessively tuned to training data, reducing their generalization capabilities on new, unseen data.
In essence, LSTMs brought forth advancements in the neural network’s capacity to handle sequential financial data, but their own intricacies and the inherent challenges of financial data mean there is room for further refinement or the exploration of complementary models.

2.3. Relevance of Transformer in Financial Fraud Detection

In the quest for more efficient models to process financial sequences, a groundbreaking approach emerged with the Transformer model, as introduced in [20]. Diverging from the recurrent architectures of RNNs and LSTMs, Transformers capitalize on self-attention mechanisms, a method that brings both strengths and weaknesses to the forefront in the domain of financial fraud detection. The Transformer’s essence is encapsulated in its self-attention formula:
A t t e n t i o n ( Q , K , V ) = s o f t m a x ( Q K T d k ) V
The roles of queries (Q), keys (K), and values (V) are pivotal. The aspect of parallel input processing, combined with its proficiency in identifying long-distance dependencies in data, empowers the Transformer model to effectively dissect vast financial datasets. This parallel processing capability accelerates the speed at which financial sequences are analyzed, which is invaluable for real-time fraud detection systems. Furthermore, its adeptness at recognizing long-range correlations within data can unravel intricate fraud schemes that might span across multiple transactions and periods.
Yet, with its strengths come tangible challenges. Transformers, for all their parallel processing prowess, lean heavily on positional encoding to understand the order of sequences. This becomes a point of vulnerability when sequences hold intricate temporal patterns, a common scenario in financial datasets. Additionally, the expansive parameter size, a direct offshoot of its complex self-attention mechanisms, escalates both computational demands and storage requirements. These constraints can pose significant hurdles when deploying these models in environments where real-time processing and resource efficiency are paramount.
In summary, while the Transformer model offers a promising avenue in the vast landscape of financial fraud detection, it does so with a balance of notable advantages and constraints, underscoring the perpetual need for model optimization in this ever-evolving domain.

2.4. Evaluative Summary of Neural Models in Financial Fraud Detection

In light of the exploration into the applications of RNNs, LSTMs, and Transformer models in financial fraud detection, it is clear that while these models have brought significant advancements, each comes with its own set of challenges. RNNs, with their inherent design to capture sequences, grapple with the issues of vanishing and exploding gradients. This impedes their efficiency when it comes to the intricate and long sequences often encountered in financial data. On the other hand, LSTMs, which were introduced as a remedy to RNN’s long-term dependency challenges, introduce their own trade-offs. Their gate mechanisms, although adept at managing long-term dependencies, come at the price of increased computational load, making them prone to overfitting, especially when dissecting voluminous financial datasets.
Transformers, the newer entrants in this domain, have showcased their prowess in handling large datasets and recognizing long-range dependencies, attributes that are undeniably beneficial for unveiling complex fraud schemes. Yet, they are not without their limitations. Their dependency on positional encoding can sometimes obscure vital sequence patterns in financial data, and their expansive parameter set demands substantial computational and storage resources, which might be restrictive in real-time processing scenarios.
In synthesizing this literature review, it becomes evident that the journey to perfecting financial fraud detection is far from over. The highlighted challenges underscore the imperative for continued research and innovation. The quest is not just for more robust models but also for more efficient and precise techniques that can seamlessly navigate the multifaceted realm of financial fraud detection.

3. Materials

3.1. Data Collection

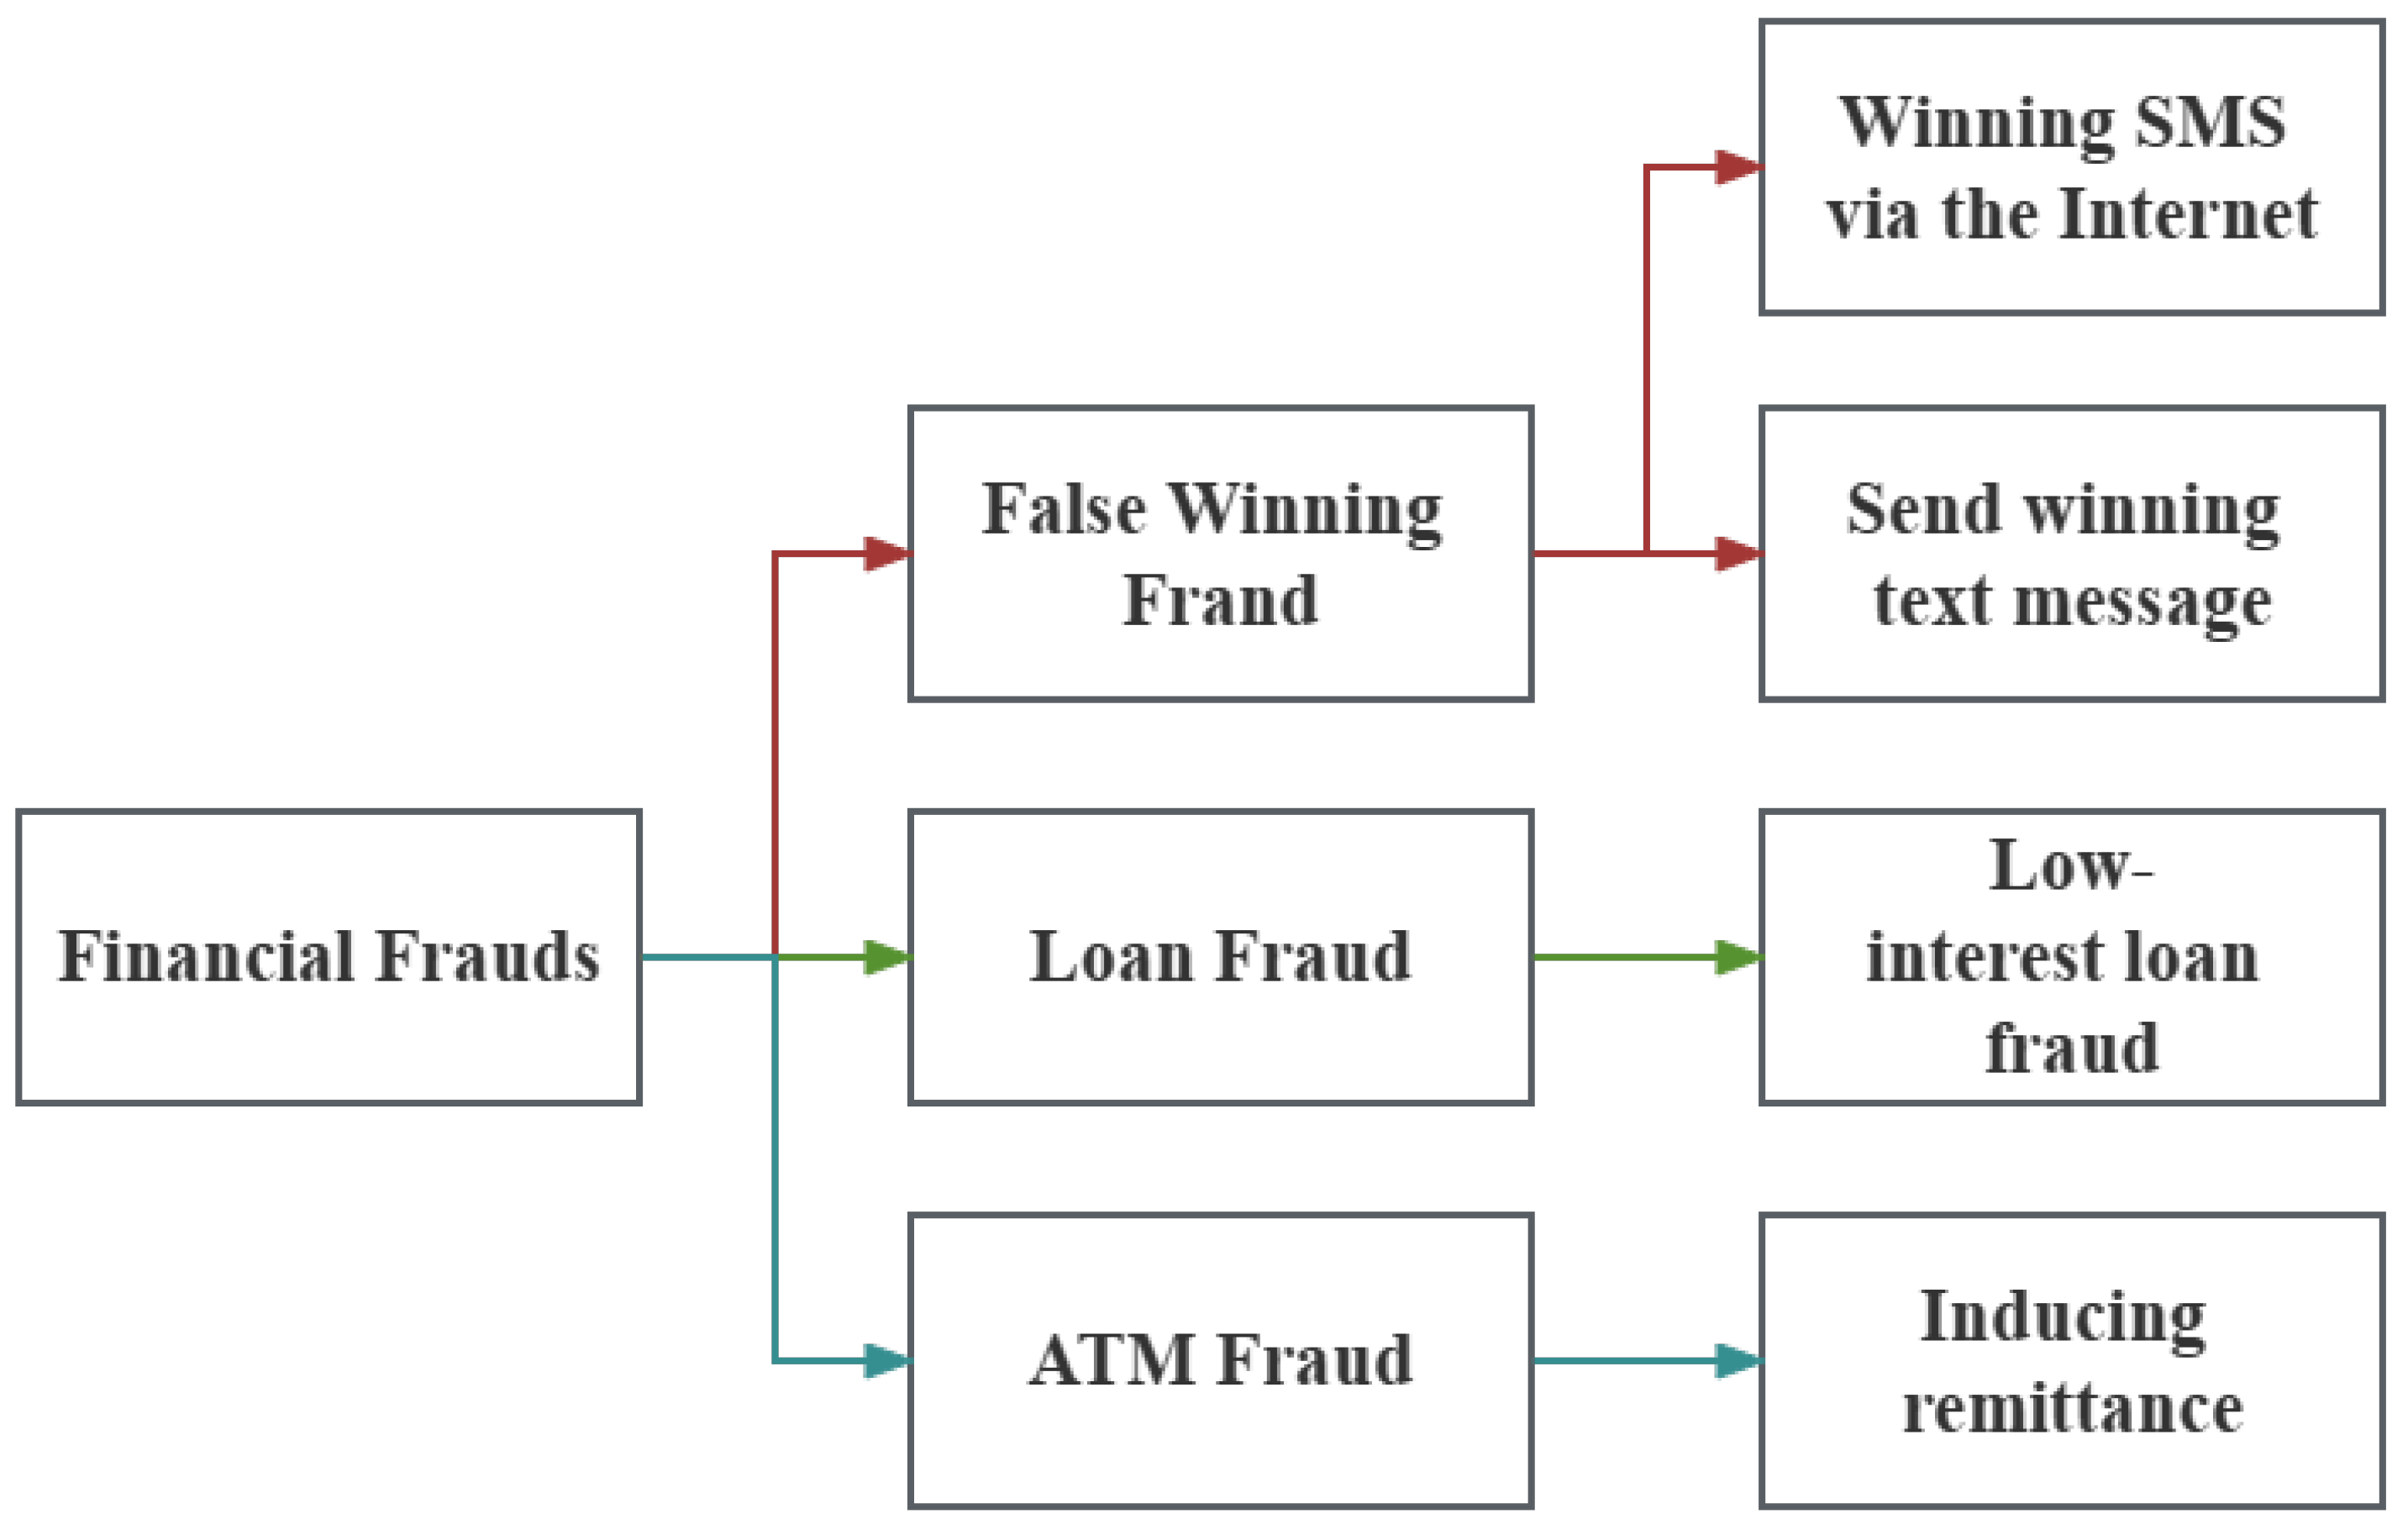
Data for this research were primarily derived from two sources. The first component of the dataset utilized in this research originates from a competition on the determination of negative financial information and its corresponding entities, co-hosted by the China Computer Federation (CCF) and the National Internet Emergency Center [21], as shown in Figure 1. The competition primarily consists of two subtasks:
1.
Negative Information Determination: Given a piece of financial text and a list of financial entities appearing in the text, the first task is to ascertain whether the text contains negative information regarding the financial entities. If the text does not encapsulate any negative details, or although containing negativity it does not pertain to any financial entities, the outcome is determined as 0.
2.
Entity Determination: Upon the detection of negative financial information concerning an entity in the first subtask, this task further discerns which entities from the list are the subjects of the negative information.
To ensure the reliability and precision of the data, the organizers of the competition invited professionals for standardized data annotation. This annotation process rigorously followed high-quality standards, aligning with principles of data ethics to guarantee annotation consistency, accuracy, and reliability. Additionally, this dataset has been reviewed and meets ethical requirements, encompassing participant privacy protection, and ensuring data transparency and fairness. The data, sourced for this research, are openly accessible and have been used in strict adherence to copyright norms. We have made certain that all procedures of data procurement and processing are within ethical permissions and respect the rights of the original data providers.
In Figure 1, we present examples of the complaint texts that serve as the input data, X i , for training our model. Each complaint text is paired with an output label, Y i , indicating the category of the complaint such as “fabrication”, “remittance”, or “realization”. The specific mapping rule of the given example in Figure 1 is shown in Table 1.
Our model can be described by the function Y = f ( X ) + e , where f ( X ) is the machine learning algorithm trained to map complaint texts (X) to their respective categories (Y), and e is the error term capturing any deviations from this mapping.
The dataset provided is split into a training set and a test set, with each set containing 10,000 instances, making a total of 20,000 data points. Each data instance in this Chinese natural language text dataset represents financial network text, comprising a title and content. Associated with each text are the entities that appear within it. All training data are given in CSV format. Each data includes ID, title, text, entity, negative, and key entity. Different fields are separated by English commas, and entities in the same field are separated by English semicolons. Either title or text fields must be filled. Some of the Weibo-sourced data have the same “title” and “text”. The value of “negative” is 0 or 1. 1 stands for negative, and 0 for non-negative. Leveraging the public competition dataset targeting event subject extraction in the financial sector carries significant advantages for this research. Initially, this dataset is specifically extracted for the financial sector, thus being highly relevant to the subject and content of the research. This dataset encompasses numerous significant events in the financial sector, containing many practical cases, aiding the comprehension and mastery of event features and laws in the financial sector. Furthermore, professional personnel have curated and annotated this dataset, ensuring its high quality and consistency, which is vital for model training and verification.
Apart from the open dataset, a large volume of text data was collected from the internet, primarily consisting of news reports, blog articles, social media posts, etc., encompassing numerous themes and directions in the financial sector. The content, source, and annotation standards and methods of this self-built data were aligned with the aforementioned competition’s open dataset to ensure consistency and high quality across all data points. Data were obtained from various news websites, financial information sites, and social media platforms using web scraping techniques. Subsequent to the collection, the data underwent a thorough cleaning and pre-processing phase, which entailed the removal of irrelevant content, duplicate data, and the normalization of text. This ensured the cleanliness and quality of the data were maintained. Necessary data annotation was conducted in line with the standards set by the open dataset, facilitating seamless model training and testing. It is crucial to note that throughout the data collection from the internet, strict adherence was maintained to data and privacy protection laws and regulations. Respecting each data source website’s user agreements was paramount, ensuring that all data collection practices were legal and compliant.
In conclusion, by integrating the public competition dataset and internet-collected data, a comprehensive dataset was constructed with both professional, standard data, and real-time, multi-perspective data, significantly propelling this research. During the model’s training and testing process, the effectiveness and quality of this dataset have been fully validated.

3.2. Data Annotation

Data annotation is a critical step in machine learning tasks, directly affecting the learning effects and ultimate performance of the model. In this study, the purpose of data annotation is to provide accurate labels for each data sample so that the model can learn the mapping relationship between the sample features and the target task. For the proposed Chain-BERT model, additional annotation work was carried out. Specifically, in the process of constructing the chain structure, a label was annotated for every lexical relationship on the chain. This label represents the semantic relationship between the words, such as synonymy, antonymy, hyponymy, etc. Such annotation work is equivalent to providing the model with additional semantic information, enabling the model to consider not only the semantics of the word itself but also the semantic relationship between the words when processing the text.
Such an annotation method is instrumental in enhancing the performance of the Chain-BERT model. Firstly, by annotating lexical relationships in the chain structure, the semantic understanding of the text by the model can be improved. Secondly, such an annotation method enables the model to utilize the relationship information between words better. In some scenarios, the model may infer semantic information from the text through the relationship between words. Moreover, such an annotation method also aids the model in handling some complex language phenomena, such as ambiguity, metaphor, etc. In general, data annotation is a significant step in this research, providing not only the label information needed to train the model but also additional semantic information that helps enhance the model’s performance. Accurate annotation work can ensure the model’s high performance in complex linguistic environments.

3.3. Data Preprocessing

For training the Chain-BERT model, traditional text preprocessing methods need to be adjusted to meet the model’s demand for chain structures. The overall preprocessing process includes: text cleaning, word segmentation, chain structure construction, and word vector representation. Firstly, the original text is cleaned to remove special characters, punctuation, and stop words in the text, reducing the vocabulary amount the model needs to handle and improving model efficiency. This step is identical to traditional text preprocessing methods and can be represented with the following mathematical expression:
T = { t | t T , t S }
where T is the cleaned text, T is the original text, and S is the set of special characters, punctuation, and stop words that need to be removed. Secondly, the cleaned text is segmented into words or phrases, allowing the model to understand the semantics of the text. This step also aligns with traditional text preprocessing.
The subsequent step is chain structure construction. In the original BERT model, sentences are processed as a linear sequence of words. However, in Chain-BERT, this linear structure needs to be converted into a chain structure, i.e., linking some words together to form an information chain. This chain’s creation is based on the semantic relationships between words, such as synonyms, antonyms, and hyponyms, etc. To implement this step, a relationship graph of words needs to be constructed first, and then the shortest path between words is found on this graph to form a chain structure. Suppose a relationship graph G = ( V , E ) of words has been obtained, where V is the set of words and E is the set of relationships between words. For each sentence S = { w 1 , w 2 , , w n } , the shortest path between the words w i and w i + 1 is found on the graph G to form a chain structure. This process can be expressed with the following mathematical formula:
P i , i + 1 = shortest _ path ( G , w i , w i + 1 ) , i = 1 , , n 1
where P i , i + 1 is the shortest path between the words w i and w i + 1 , and the function shortest _ path ( G , w i , w i + 1 ) is a function to find the shortest path between two words on the graph G. Through these steps, the chain structure P = { P 1 , 2 , , P n 1 , n } corresponding to sentence S can be obtained. Lastly, each word in the text is converted into a fixed-length vector, similar to traditional preprocessing steps. Pre-trained word vector models, such as Word2Vec or GloVe, can be used to encode the semantic information of words into numerical data that the model can handle. Through the above preprocessing steps, ordinary text can be processed into the chain structure required by Chain-BERT, laying a good foundation for model training and evaluation.

3.4. Dataset Augmentation and Rebalancing

In addressing imbalanced classification challenges, such as those in financial fraud detection, the importance of data balancing techniques cannot be understated. An imbalance in data typically implies that one class significantly outnumbers another, causing models to exhibit a bias towards the majority class during training. This bias subsequently undermines the ability to effectively recognize instances from the minority class. To mitigate this issue, over-sampling and under-sampling strategies have been employed.
Over-sampling encompasses techniques such as simple random over-sampling and the SMOTE method. The former involves random replication of minority class samples to approximate the quantity present in the majority class. SMOTE (Synthetic Minority Over-sampling Technique), on the other hand, is centered on generating synthetic samples for the minority class. Given a sample from the minority class, the SMOTE algorithm initiates by selecting k-nearest neighbors. Subsequently, a neighbor is chosen from the set and a synthetic sample is crafted based on the difference between the two:
x n e w = x i + λ × ( x z i x i )
where x i denotes the current sample, x z i is a sample chosen from the k neighbors, and λ is a random value between 0 and 1.
Under-sampling strategies encompass simple random under-sampling and near-miss techniques. The former revolves around random elimination of majority class samples until the count aligns with that of the minority class. Near-miss, however, entails removing majority class samples that are too proximate to the minority class samples.
From a mathematical standpoint, consider the scenario where the minority class has m samples and the majority class contains n samples, with m < n . The aim for achieving balance is to have both classes with comparable or equal sample sizes. In the context of SMOTE, if each minority class sample produces s synthetic samples, the total synthetic samples generated is m × s . To achieve balance, it is required that:
m + m × s = n
Solving for s yields:
s = n m m
This equation provides the number of synthetic samples to be generated for each minority class sample. The validity of data balancing techniques can be discerned both mathematically and from a model training perspective. Consider the cross-entropy loss:
L = i = 1 N y i log ( y ^ i ) + ( 1 y i ) log ( 1 y ^ i )
where y i represents the true label, y ^ i is the predicted label, and N is the total number of samples. If majority class samples significantly outnumber those of the minority class, the term L will be predominantly influenced by the majority class, causing the model to neglect the minority class. Thus, data balancing techniques, be it over-sampling or under-sampling, aim to modify the data distribution so that during training, the model accords equal attention to both classes. This strategy enhances model performance on the minority class, ensuring its efficacy in real-world applications.

4. Proposed Method

4.1. Overall

A new model named FinChain-BERT, tailored and enhanced specifically for financial fraud detection, is proposed in this study. FinChain-BERT incorporates an innovative architecture with core elements including Fraud Focus Filter, Keywords Loss Function, and Stable-Momentum Adam Optimizer, which enable the model to efficiently detect fraudulent activities amidst voluminous financial data. This section aims to provide a comprehensive understanding of the overall architecture of FinChain-BERT and how it utilizes these components for precise financial fraud detection.
Inspiration for FinChain-BERT comes from the BERT (Bidirectional Encoder Representations from Transformers) model, yet substantial enhancements and optimizations were made to its architecture and working principles to better cater to the task of financial fraud detection. Several primary differences between FinChain-BERT and the original BERT model exist. Firstly, FinChain-BERT introduces Fraud Focus Filter at the input layer, a unique attention mechanism focusing on crucial information potentially linked to fraudulent activities, facilitating a more focused processing and understanding of financial data. Secondly, the training process of FinChain-BERT incorporates a new loss function, the Keywords Loss Function. This function not only considers prediction errors of the model but also incorporates a penalty for keywords, ensuring that if the model overlooks keywords closely associated with fraudulent activities, its loss value increases. This forces the model to pay greater attention to these keywords during training, thereby enhancing its sensitivity to financial fraud. Lastly, FinChain-BERT employs Stable-Momentum Adam Optimizer as the optimizer. This is an enhanced Adam optimizer incorporating the concept of stable momentum, allowing the model to maintain a stable learning rate during training, and thereby avoiding training instability caused by significant fluctuations in the learning rate. The combination of these components allows FinChain-BERT to excel in the task of financial fraud detection. Specifically, Fraud Focus Filter enables the model to focus on key information associated with fraudulent activities, Keywords Loss Function ensures that the model values keywords during training, and Stable-Momentum Adam Optimizer ensures the stability of the training process. These combined factors allow FinChain-BERT to achieve high precision in financial fraud detection. In addition to these improvements, FinChain-BERT also incorporates the Int-distillation technique, a model compression method combining integerization technology and knowledge distillation, significantly reducing the number of model parameters, making the model more deployable and runnable. The Int-distillation technique transforms the parameters of the model into integers, which drastically reduces the storage and computational resource requirements of the model and enhances the running speed of the model while maintaining its performance.
In summary, by introducing new components and techniques, FinChain-BERT has been deeply optimized and enhanced for the task of financial fraud detection, enabling it to achieve high-precision results. Furthermore, effective control has been achieved over the size and running speed of the model. Subsequent sections will provide detailed introductions to the working principles and implementation details of Fraud Focus Filter, Keywords Loss Function, Stable-Momentum Adam Optimizer, and Int-distillation in FinChain-BERT, demonstrating how these components and techniques collaborate with FinChain-BERT to achieve high-precision financial fraud detection.

4.2. The FinChain-BERT Model

In the realm of financial fraud detection, the BERT model, recognized for its powerful capabilities in natural language processing, is often widely employed. However, as the BERT model primarily focuses on the linear relationship between words in the processing of input text, it often fails to capture complex semantic relationships fully. Consequently, a novel model, the FinChain-BERT model, is introduced herein.
The core innovation of the FinChain-BERT model is the dissection of input text into a tree-like structure, named “Chains”, for information propagation and learning, as shown in Figure 2. This structure allows the model to comprehend complex semantic relationships in the input text more accurately, thereby enhancing the model’s precision in financial fraud detection. In the FinChain-BERT model, input text is initially segmented into several “Chains”, with each “Chain” being a sequence of words representing a clause or a semantic unit from the text. A BERT model is run separately on each “Chain”, acquiring the context representation for each word. Following this, the context representations of all “Chains” are amalgamated to form a comprehensive context representation. In this process, the tree-like structure of the “Chains” ensures the interchange of information between different “Chains”, aiding the model’s understanding of intricate semantic relationships.
Specifically, suppose the input text is segmented into N “Chains”, each “Chain” is denoted as a sequence of words C i = { w i 1 , w i 2 , , w i n i } , where n i represents the length of the ith “Chain”. For each “Chain”, a BERT model is employed to obtain the context representation of each word H i = { h i 1 , h i 2 , , h i n i } , where h i j represents the context of word w i j . Following this, the context representations of all “Chains” are amalgamated into a comprehensive context representation H = { H 1 , H 2 , , H N } . During the consolidation of all “Chains” context representations, a special attention mechanism is incorporated to calculate the weight of each “Chain”. This mechanism, termed “Chains Attention”, differs from traditional attention mechanisms as it considers not only the relationship between “Chains” but also their relevance to the specific task. The calculation formula for “Chains Attention” is as follows:
Chains Attention ( Q , K , V ) = softmax Q K T d k V
where Q, K, and V are the query matrix, key matrix, and value matrix, respectively, while d k denotes the dimension of the key vector. The role of the attention mechanism is to calculate a weighted sum of the input value matrix, with the weights derived from the dot product of the query and key matrices.
In the proposed model, the query matrix Q, key matrix K, and value matrix V are all generated from the context representations of all “Chains” H. The query and key matrices calculate the weight of each “Chain”, while the value matrix generates the final context representation. The generation process is detailed below:
Q = W q H + b q ,
K = W k H + b k ,
V = W v H + b v ,
where W q , W k , and W v are weight matrices, while b q , b k , and b v are bias terms, all learned by the model. The concept behind the FinChain-BERT model is rooted in a profound understanding of the complex semantic relationships within the text. It is acknowledged that in financial fraud detection tasks, not all information is crucial. Instead, it is these complex semantic relationships that are key determinants of model performance. Hence, a mechanism allowing the model to grasp these intricate semantic relationships is required.
In practical application, the FinChain-BERT model demonstrates significant advantages. Firstly, it effectively elevates the model’s accuracy in recognition. By processing tree-like structure “Chains”, the model gains a more accurate understanding of complex semantic relationships in the input text, thereby more accurately identifying fraudulent financial activities. Secondly, it enhances the model’s interpretability. By analyzing the weight of “Chains Attention”, it becomes clear which “Chains” the model pays more attention to, greatly assisting in the understanding of the decision-making process. Finally, the FinChain-BERT model also improves the model’s stability. As the model’s attention is more focused, the output becomes more robust to minor variations in the input.

4.3. Stable-Momentum Adam Optimizer

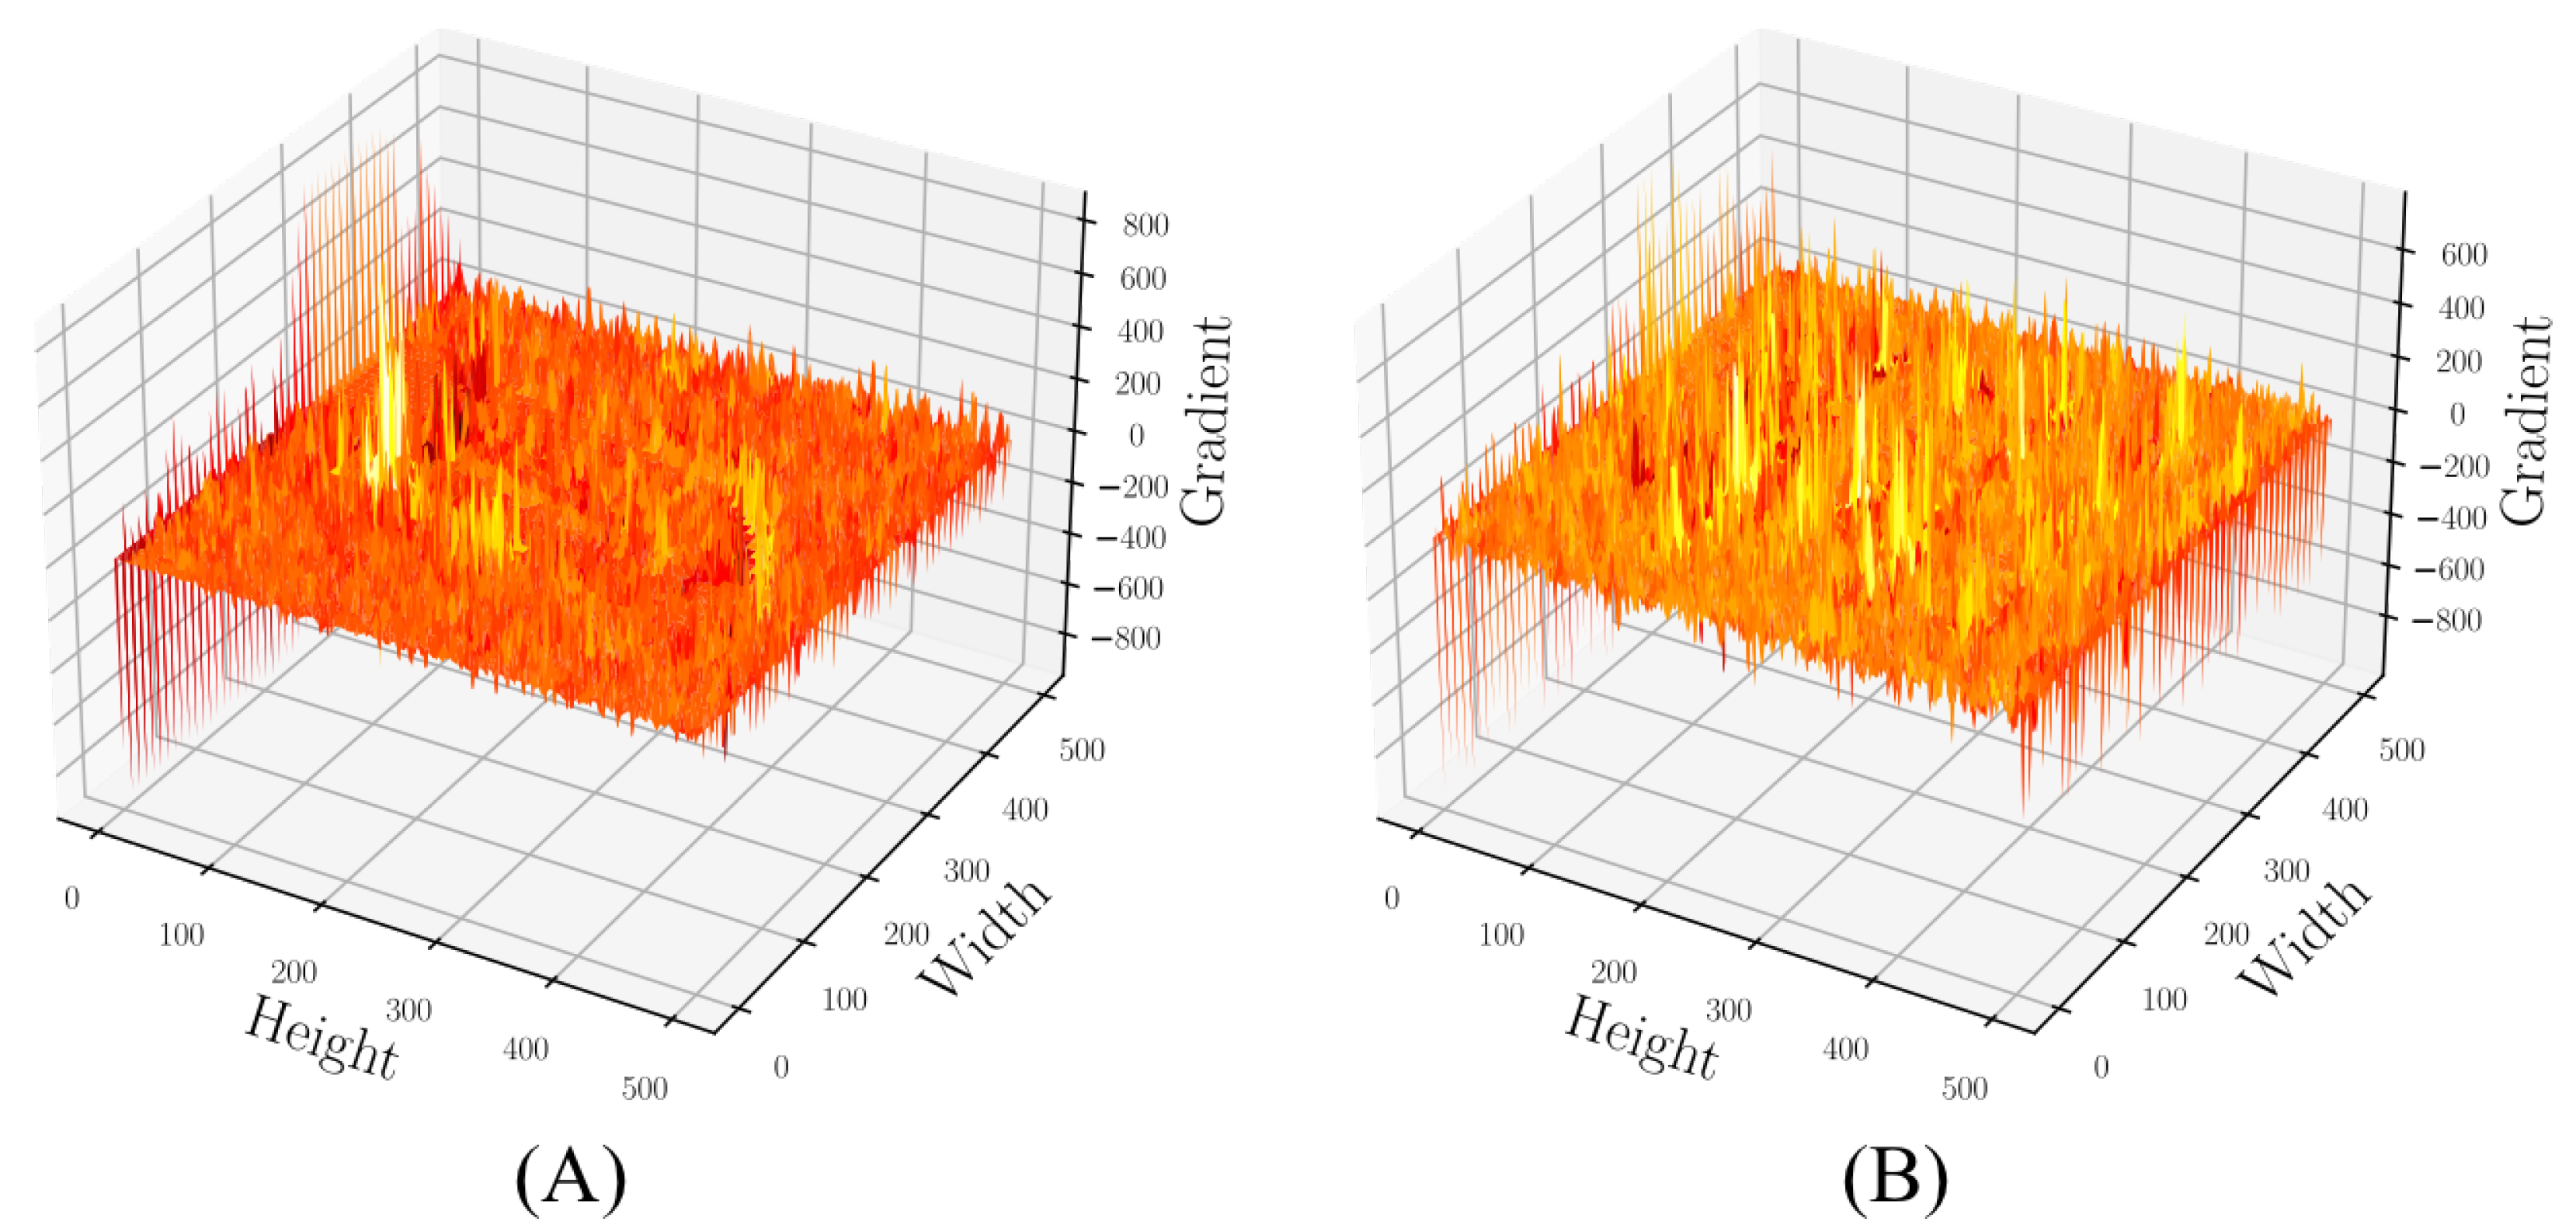
The role of the optimizer in model training is crucial in deep learning. This section will delve into the novel optimizer, Stable-Momentum Adam Optimizer, examining its mathematical principles, gradient updating formula, as well as its practical implications and advantages in the task at hand. Stable-Momentum Adam Optimizer, an innovative optimizer developed based on the Adam optimizer, primarily enhances the concept of stable momentum. Momentum is a critical technology in deep learning optimization, capable of accelerating the model’s movement speed in parameter space and improving convergence speed. However, traditional momentum methods may cause significant fluctuations in the learning rate, leading to training instability, as shown in Figure 3A. Stable-Momentum Adam Optimizer introduces stable momentum, enabling the model to train at a more stable learning rate, as shown in Figure 3A.
Firstly, a review of the working principle of the Adam optimizer is presented. The Adam optimizer combines Momentum and RMSProp methods, auto-adjusts the learning rate, and maintains an independent learning rate for each parameter. The update formula of the Adam optimizer is as follows:
m t = β 1 m t 1 + ( 1 β 1 ) g t v t = β 2 v t 1 + ( 1 β 2 ) g t 2 m t ^ = m t 1 β 1 t v t ^ = v t 1 β 2 t θ t = θ t 1 α m t ^ v t ^ + ϵ
where m t and v t are estimates of the first and second moment, g t is the current gradient, α is the learning rate, ϵ is a small constant to prevent division by zero, and β 1 and β 2 are hyperparameters.
In the Stable-Momentum Adam Optimizer, the update formula for the momentum term is modified, introducing the concept of stable momentum. The new update formula is as follows:
m t = β 1 m t 1 + ( 1 β 1 ) g t v t = β 2 v t 1 + ( 1 β 2 ) g t 2 m t ^ = m t 1 β 1 t + τ v t ^ = v t 1 β 2 t + τ θ t = θ t 1 α m t ^ v t ^ + ϵ
where τ is a hyperparameter used to adjust the stability of the momentum. When τ > 0 , the update of the momentum term becomes smoother, reducing fluctuations in the learning rate and making the model training process more stable.
Compared to other common optimizers such as SGD and Adam, the Stable-Momentum Adam Optimizer offers superior stability. Although the SGD optimizer is simple to use, it might become trapped in local optima or stall near saddle points in some complex optimization problems. While the Adam optimizer generally performs well in most tasks, its learning rate fluctuations could lead to training instability. By introducing stable momentum, the Stable-Momentum Adam Optimizer reduces learning rate fluctuations, making the model training more stable, and thereby more likely to find the global optima of the optimization problem.
In the financial fraud detection task examined in this study, the Stable-Momentum Adam Optimizer plays a pivotal role. Given that financial data often exhibits high complexity and non-linearity, traditional SGD optimizers might struggle to effectively identify the optimal solution. Although the Adam optimizer is better equipped to handle this complexity, the oscillations in its learning rate may lead to instability in the model’s training, thereby impacting the model’s performance. The Stable-Momentum Adam Optimizer is capable of preserving the exceptional performance of the Adam optimizer while providing a more stable learning process. This combination allows for better model performance in the presence of complex financial data.

4.4. Fraud Focus Filter

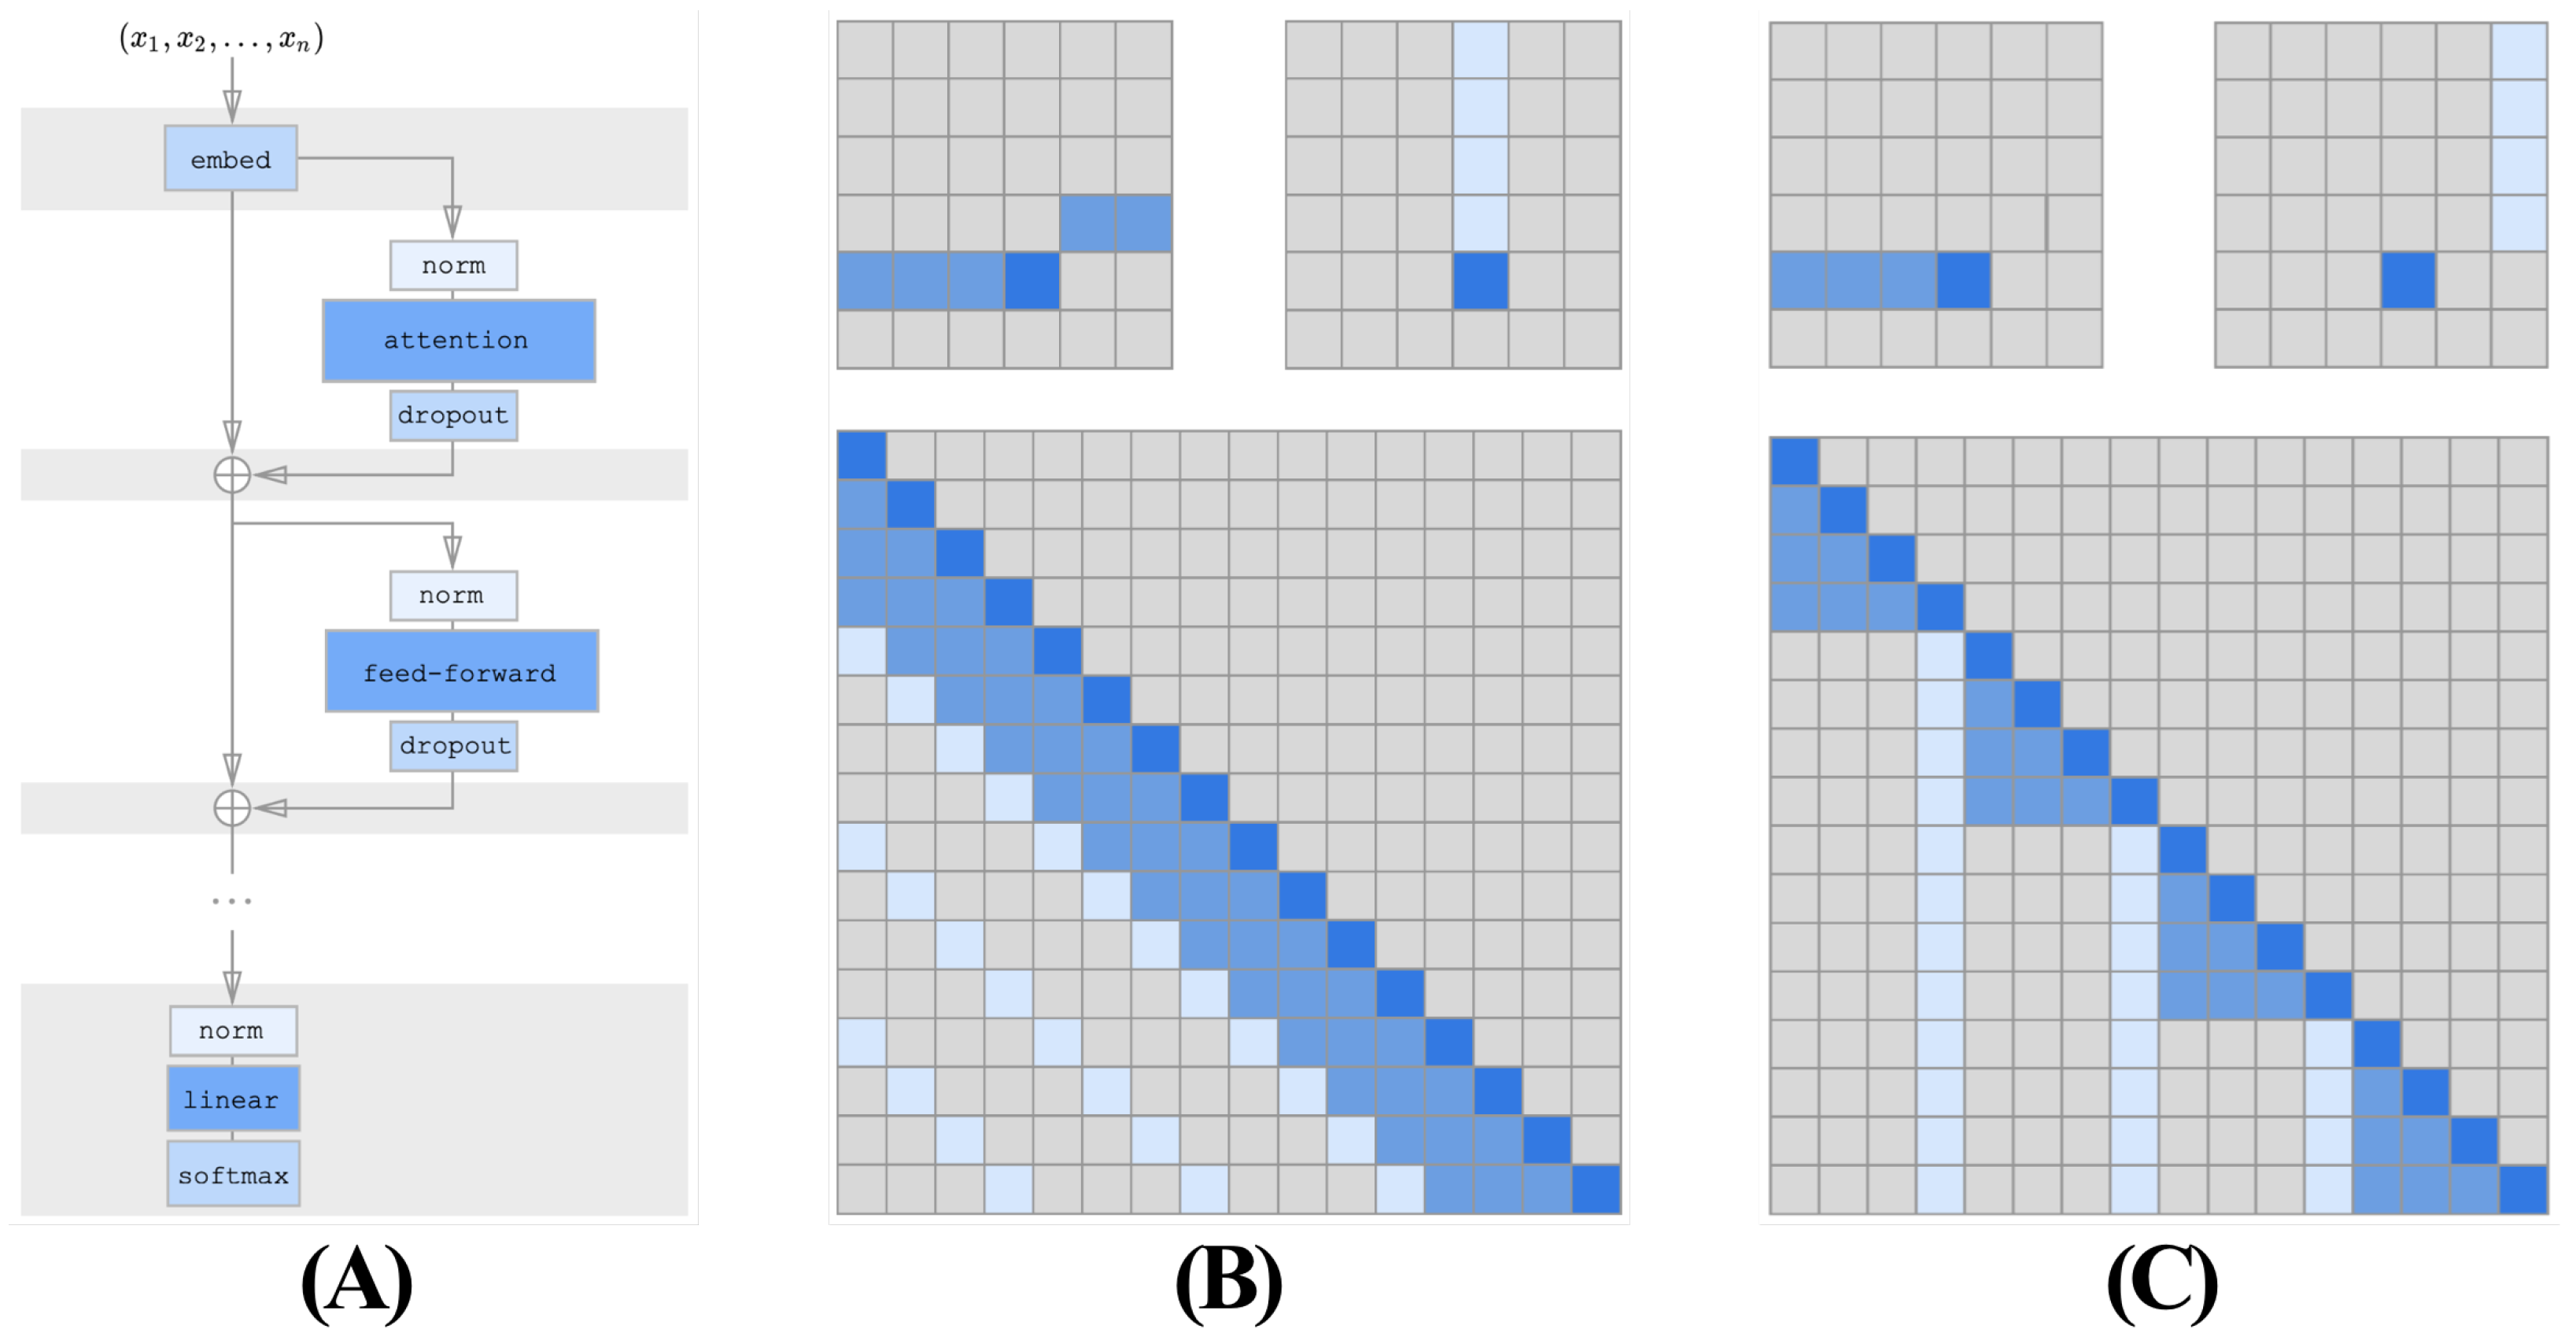
A key challenge encountered in the financial fraud detection task lies in the identification of crucial information closely related to financial fraud within a large volume of data. This requirement demands a model capable of dedicating greater attention to these pivotal pieces of information to improve accuracy. In response to this challenge, a novel module, named “Fraud Focus Filter”, is proposed, as shown in Figure 4.
The underlying principle of the filter involves enhancing the model’s focus on keywords through a specific attention mechanism. This attention mechanism differs from traditional mechanisms, as it not only considers the relationships between words but also the relevance of words to specific tasks. This reason is why it has been termed a “Filter”, implying that it can filter out information unrelated to the task at hand and focus on vital information closely linked to the task. Here, the mathematical principles underlying the Fraud Focus Filter are discussed in greater detail. The calculation formula for a traditional attention mechanism is as follows:
Attention ( Q , K , V ) = softmax Q K T d k V
where Q, K, and V represent the query matrix, key matrix, and value matrix, respectively, while d k refers to the dimension of the key vector. The attention mechanism operates by conducting a weighted summation of the input value matrix, with the weights derived from the dot product of the query matrix and the key matrix. Within the filter, an additional weight matrix W is introduced. This weight matrix enhances the model’s focus on keywords. The calculation formula is presented below:
Attention ( Q , K , V , W ) = softmax Q K T W d k V
where ⊙ signifies element-wise multiplication. The weight matrix W, which the model learns, signifies the relevance of each word to the financial fraud task. The fraud focus filter is embedded directly within the FinChain-BERT model. In each layer of the model, the Fraud Focus Filter replaces the original attention mechanism. Consequently, the model, when processing information at each layer, pays greater attention to keywords closely related to financial fraud, thus enhancing the accuracy of the model.
The conception of the fraud focus filter originated from a deep understanding of the financial fraud detection task. It was recognized that not all information is vital in such tasks; instead, key pieces of information closely related to financial fraud determine the model’s performance. Therefore, a mechanism was needed to allow the model to focus on these key pieces of information. In practical applications, the Fraud Focus Filter has demonstrated significant advantages. Firstly, it can effectively enhance the model’s accuracy. By focusing on keywords, the model can more accurately identify instances of financial fraud. Secondly, it can improve the interpretability of the model. By analyzing the weight matrix, it becomes clear which words the model focuses on, which aids in understanding the model’s decision-making process. Finally, the fraud focus filter can enhance the model’s stability. Given that the model’s focus is more concentrated, the model’s output becomes more robust to minor variations in the input.

4.5. Keywords Loss

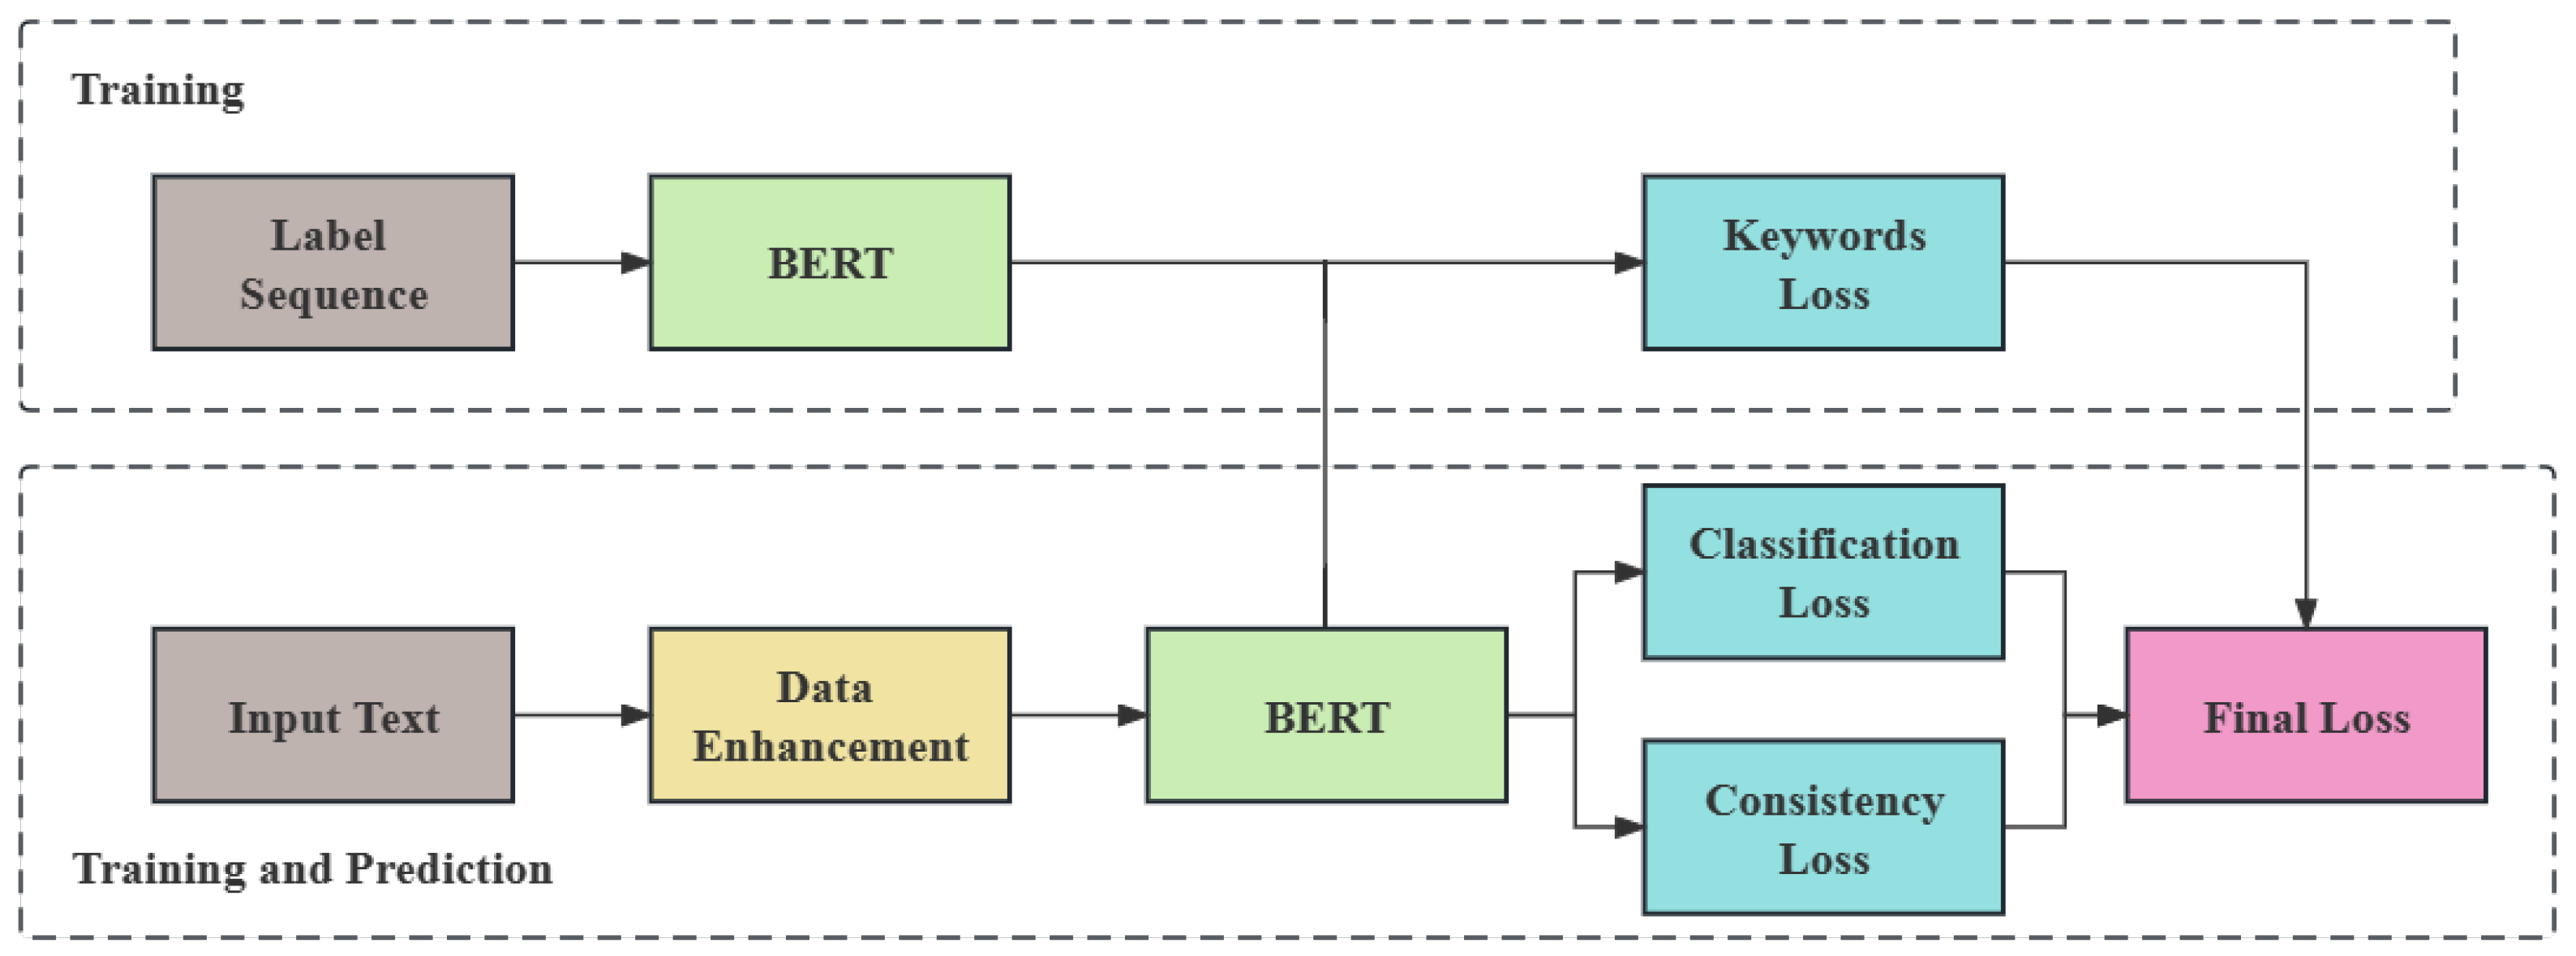
In deep learning models, the loss function serves as a pivotal component, quantifying the discrepancy between model predictions and actual targets, also defining the goal for minimization during the training process. Widely used loss functions encompass Mean Square Error Loss and Cross Entropy Loss, among others. Nevertheless, these generic loss functions frequently fail to cater to specific task demands. For instance, in financial fraud detection tasks, an emphasis is required on statements containing keywords, as opposed to all statements. In light of this, the present study introduces a novel loss function—Keywords Loss. A key innovation of Keywords Loss lies in its incorporation of keyword information into loss computation, enabling the model to focus more on keyword-containing statements, as shown in Figure 5.
Specifically, supposing an input text is divided into N “Chains”, each “Chain” represented as a word sequence C i = { w i 1 , w i 2 , , w i n i } , where w i j denotes a word and n i is the length of the ith “Chain”. For each “Chain”, the probability P k w ( C i ) of containing keywords is calculated and then weighted into each “Chain’s” loss. The keyword probability can be calculated by a keyword model, with the specific formula being:
P k w ( C i ) = 1 n i j = 1 n i I ( w i j Keywords ) ,
where I is the indicator function, and if w i j is a keyword, then I ( w i j Keywords ) = 1 , otherwise I ( w i j Keywords ) = 0 . According to this formula, each “Chain’s” keyword weight can be determined. Afterwards, this weight is added to each “Chain’s” loss to obtain the final loss. The specific calculation formula is:
L = i = 1 N P k w ( C i ) L i ,
where L i represents the loss of the ith “Chain”, which can be calculated by the traditional BERT loss function. The major distinction between this new loss function and traditional BERT loss function is the introduction of keyword weights, making the model pay more attention to keyword-containing “Chains” during training. This is because in financial fraud detection tasks, those “Chains” containing keywords often play a vital role in determining whether fraudulent behavior exists. By utilizing this new loss function, the model can focus more on these crucial pieces of information, thereby enhancing the accuracy of detection. When used in conjunction with the Fraud Focus Filter, Keywords Loss can further boost the model’s performance. Fraud Focus Filter is a mechanism that can concentrate the model’s attention on parts suspected of fraud, while Keywords Loss can guide the model to further pay attention to those “Chains” with keywords within these suspected parts. In this manner, the model’s focus can be more concentrated, thereby increasing the model’s detection accuracy.
The conception of Keywords Loss stems from an in-depth understanding of financial fraud detection tasks. It was recognized that in such tasks, keywords often play a vital role, something traditional loss functions fail to exploit adequately. Therefore, this novel loss function was designed to enable the model to utilize keyword information better. In practical application, Keywords Loss demonstrates significant advantages. Firstly, it enhances the model’s detection accuracy. By focusing on keywords, the model can more accurately identify fraudulent behavior. Secondly, it improves the model’s interpretability. By analyzing each “Chain’s” keyword weight, an understanding can be gained as to why the model predicts in a certain way. Finally, it enhances the model’s stability. Since the model’s attention is more concentrated, it becomes more robust to small changes in input.

4.6. Int-Distillation

With the continuous development of deep learning models, the model size keeps increasing. This requires more computational resources and storage space and raises the demand for hardware devices. However, in many practical applications, models need to be run under limited device circumstances, which calls for model lightweighting. The Int-Distillation technology proposed in this study is an effective method for model lightweighting. It combines integer quantization and knowledge distillation technologies, enabling the model to maintain high prediction accuracy while significantly reducing the model size.

4.6.1. Integer Quantization

Integer quantization is a common model lightweighting technology. Its main idea is to convert model weights and activation values from floating-point numbers to integers, thereby reducing model storage and computational requirements. Typically, integer quantization can be achieved using the following formula:
q = round ( r · s + z ) ,
where r is the real value, s is the scale factor, z is the zero point, and q is the integer value. During the quantization process, it is necessary to ensure that the difference between the quantized value and the original value is minimized as much as possible to ensure the model’s prediction accuracy.

4.6.2. Knowledge Distillation

Knowledge distillation is a model compression technology, as shown in Figure 6. Its main idea is to let a smaller model (student model) learn the knowledge of a larger model (teacher model) to improve the prediction accuracy of the smaller model. During the knowledge distillation process, the smaller model is trained so that its predicted probability distribution closely matches the predicted probability distribution of the larger model. Specifically, the following loss function is minimized:
L = α × L CE ( y , y ^ student ) + ( 1 α ) × T 2 L KL ( softmax ( y ^ teacher T ) , softmax ( y ^ student T ) ) ,
where y denotes the actual label, y ^ student and y ^ teacher represent the prediction results of the smaller and larger model, respectively, L CE is the Cross Entropy Loss, L KL symbolizes KL Divergence, and T signifies the temperature parameter.

4.6.3. Combination

Int-Distillation embodies a method that integrates integer quantization and knowledge distillation techniques. In the process of Int-Distillation, a larger model is trained initially, followed by the education of a smaller model through knowledge distillation to assimilate the larger model’s knowledge. During knowledge distillation, attempts are made not only to bring the smaller model’s prediction results closer to the larger model’s prediction results, but also to closely align the weights and activation values of the smaller model with the weights and activation values of the larger model post integer quantization. Through this strategy, not only is the prediction accuracy of the smaller model ensured, but the storage and computational requirements of the model are also reduced.
The principal objective of model lightweighting is to allow the model to operate under limited device circumstances. By accomplishing model lightweighting, models can be deployed on hardware devices, facilitating offline inference, reducing latency, decreasing energy consumption, and enhancing user experience. In the context of financial fraud detection tasks, the practical significance and advantages of Int-Distillation are apparent. Firstly, as financial fraud detection tasks demand high prediction accuracy from the models, model lightweighting cannot be achieved merely by reducing the model size. Int-Distillation ensures the prediction accuracy of the smaller model by letting it learn the knowledge of the larger model through knowledge distillation. Secondly, financial fraud detection tasks necessitate real-time processing of a vast volume of financial transaction data, thereby requiring the model to possess efficient inferencing capabilities. Int-Distillation augments the inferencing efficiency of the model by reducing its storage and computational requirements through integer quantization. Lastly, financial fraud detection tasks need to run models under limited device situations, such as on mobile devices or embedded devices. Int-Distillation facilitates the operation of the model on such devices through model lightweighting, thereby achieving offline inference, minimizing latency, decreasing energy consumption, and improving user experience.

4.7. Experimental Settings

4.7.1. Platform and Testbed

Experiments presented in this study were performed on a hardware platform with an advanced graphics processing unit. The specifications of this platform are as follows: an Intel(R) Xeon(R) CPU E5-2620 v4 @ 2.10GHz, 64GB of memory, and an NVIDIA Tesla V100 GPU. Utilizing such a platform ensures the stability and accuracy of the experiments, as it provides ample computational resources for model training and inference. Python was chosen as the programming language to implement and test the models due to its comprehensive suite of data science and machine learning libraries that facilitate model implementation and optimization. Out of all the available Python libraries, PyTorch (version 1.8.1) was selected as the primary library for model implementation. The choice is justified by PyTorch’s offering of a concise and intuitive way to define and manipulate models, as well as its support for advanced hardware acceleration technologies. Tensorboard (version 2.4.1) was also utilized in these experiments for visualization of model training. The operating system employed for the experiments was Ubuntu 18.04.
BERT and its various variants were chosen as baseline models for the tests. BERT is a highly popular natural language processing model, exhibiting exceptional performance across numerous tasks, which makes it an appropriate baseline. In addition, several variants of BERT, including RoBERTa [22], ALBERT [23], and DistilBERT [24], were selected. These variants have slightly fine-tuned BERT’s structure, resulting in improved performance on certain tasks. The rationale for choosing these models as baselines is to make a comprehensive comparison between the proposed model and existing technologies. Furthermore, this selection demonstrates the superiority of the proposed model across various tasks and scenarios.
In the experiments, the baseline models were initially trained on the same tasks and evaluated on the same hardware platform and operating system to ensure fairness in comparison. Subsequently, the performance and advantages of the proposed model were evaluated by comparing it with these baseline models. Through these detailed experimental settings, it is expected to thoroughly assess the model and identify potential strengths and weaknesses for improvement in future research.

4.7.2. Evaluation Metric

In multi-class problems, metrics such as precision, recall, and accuracy are typically computed for each class to evaluate the model’s performance for each category. This approach is often referred to as “per-class metrics” or the “macro-averaging” method. Assuming there are C classes, with c { 1 , 2 , , C } , the definitions for each metric are provided as follows:
1.
Precision. For each class c, precision is defined as the number of samples correctly classified as class c divided by the total number of samples predicted as class c:
P r e c i s i o n c = T r u e P o s i t i v e s c T r u e P o s i t i v e s c + F a l s e P o s i t i v e s c
where T r u e P o s i t i v e s c represents the count of samples that are both truly and predicted as class c, while F a l s e P o s i t i v e s c is the number of samples that are predicted as class c but truly belong to a different class.
2.
Recall. For each class c, recall is defined as the number of samples correctly classified as class c divided by all actual instances of class c:
R e c a l l c = T r u e P o s i t i v e s c T r u e P o s i t i v e s c + F a l s e N e g a t i v e s c
where T r u e P o s i t i v e s c remains consistent with the previous definition and F a l s e N e g a t i v e s c denotes the count of samples that truly belong to class c but are predicted differently.
3.
Accuracy. Generally, the accuracy in multi-class problems is the proportion of all samples that are correctly classified across all classes. However, for per-class accuracy for each class c, it is given as the sum of samples correctly classified for class c and those correctly classified for all other classes, divided by the total sample count:
A c c u r a c y c = T r u e P o s i t i v e s c + T r u e N e g a t i v e s c T o t a l S a m p l e s
where T r u e N e g a t i v e s c represents the samples that are neither truly nor predicted as class c and T o t a l S a m p l e s is the overall number of samples.
In the end, an overall performance metric can be derived by averaging the metrics, namely P r e c i s i o n c , R e c a l l c , and A c c u r a c y c , across all classes. Such definitions ensure that the model’s performance across diverse categories, especially in scenarios with class imbalances, can be assessed.

4.7.3. Experiment Design

In the field of machine learning and deep learning, a common practice for dataset partitioning is to divide it into training, validation, and testing sets. The training set is employed for model training, while the validation set serves to adjust and validate the model. The final performance evaluation of the model is conducted using the test set. In the design of this experiment, the dataset was partitioned into 80% for training, 10% for validation, and 10% for testing. This division strategy is based on the commonly adopted 8:1:1 ratio in machine learning. Such a ratio ensures the sufficiency of training data, while simultaneously providing enough data for model tuning and performance assessment. The specific partitioning operation was conducted randomly, ensuring each sample was distributed into the training, validation, and testing sets in such a way as to maintain the proportionality among various types of samples. This random distribution ensures the representativeness of data, and mitigates potential model bias due to data ordering.
Hyperparameters in machine learning models require manual adjustment. In this experiment, the required hyperparameters include the learning rate, batch size, and number of training epochs, among others. The learning rate is a significant parameter when updating model parameters, determining the step length of updates. If the learning rate is set too high, the model may oscillate around the optimal solution and fail to converge. Conversely, if the learning rate is set too low, the convergence speed of the model may be slow. In this experiment, a learning rate of 0.001 was adopted, a commonly utilized value. Batch size refers to the number of samples input for model training each time, and its setting depends on hardware resources (e.g., GPU memory) and dataset size. In this experiment, a batch size of 64 was adopted, another commonly utilized value. The number of training epochs refers to the number of times all training data is used for model training. The setting of training epochs requires a balance between model performance and training time. In this experiment, the number of training epochs was set to 20, based on results of preliminary experiments.

5. Results and Discussion

5.1. Fraud Detection Results

The primary objective of this experiment design is to validate the superiority of the proposed FinChain-BERT model through a comparative performance evaluation on the fraud detection task. Precision, recall, and accuracy serve as key metrics in this experiment.
From Table 2, it is observed that the FinChain-BERT model achieved superior performance on all metrics. Specifically, precision, recall, and accuracy of FinChain-BERT reached 0.97, 0.96, and 0.97, respectively, surpassing the performance of other models. This indicates the excellent capability of FinChain-BERT in fraud detection tasks. Subsequent analysis is conducted from the perspectives of model features and mathematical theory.
Initial observations showed that the performance of RNN and LSTM models was relatively unsatisfactory. This is mainly due to the issues of vanishing and exploding gradients when these models process long sequence data. Despite LSTM’s ability to alleviate these problems to some extent through its gating mechanism, its performance still lags behind models based on the Transformer when dealing with complex text data. Additionally, the incapability of RNN and LSTM to effectively utilize global textual information, as they can only process text in a sequential manner, also limited their performance. On the other hand, Transformer-based models such as BERT, RoBERTa, ALBERT, and DistillBERT outperformed RNN and LSTM. This can be attributed to the Transformer’s ability to process all inputs in parallel, capturing global textual information, and enhancing the model’s ability to grasp key information through its self-attention mechanism. Specifically, BERT, by employing the masked language model and next sentence prediction as pre-training tasks, enables a more comprehensive understanding of text context and semantic relationships, thereby improving model performance. However, BERT, RoBERTa, ALBERT, and DistillBERT models, while processing text, rely predominantly on local lexical information and global information from the entire text, but insufficiently handle complex relationships between words (such as synonyms, antonyms, hyponyms, etc.), which might limit their performance in certain tasks. Ultimately, the FinChain-BERT model demonstrated the best results. This can be mainly attributed to its amalgamation of BERT’s strengths and the advantages of chain structure. The chain structure allows for an explicit representation and utilization of complex relationships between words, providing the model with more semantic information and better understanding and processing of the text. Furthermore, the chain structure’s design allows the model to more effectively handle complex language phenomena, such as ambiguity and metaphor. From a mathematical perspective, the chain structure, by explicitly illustrating the relationships between words, adds additional constraints to the model input. This helps the model to learn the data distribution more effectively, thereby enhancing model performance.
In conclusion, the experiment results validate the superior performance of FinChain-BERT in fraud detection tasks, primarily attributable to its unique chain structure and Transformer-based model design. This underscores the significant value of utilizing structural textual information and complex relationships between words when processing intricate text tasks.

5.2. Ablation Studies

5.2.1. Ablation Experiment on Different Optimizers

The primary aim of this experimental design is to understand the impact of different optimizers on the performance of the FinChain-BERT model, by comparing their performance metrics, thus providing optimization strategies for practical applications.
As can be observed from Table 3, the FinChain-BERT model using the Stable-Momentum Adam optimizer yields the best results across all metrics. Specifically, it achieves an accuracy of 0.97, a recall of 0.96, and a precision of 0.97. These results surpass the performance of models using other optimizers, demonstrating the superiority of Stable-Momentum Adam in optimizing the FinChain-BERT model. A mathematical analysis of the experiment results from the perspective of the characteristics of the optimizers is subsequently provided.
First, an analysis of the SGD optimizer is given. Stochastic Gradient Descent (SGD) is the simplest optimizer, and its basic idea is to update parameters using the gradient of each sample or small batch of samples. Its mathematical formula can be expressed as:
θ = θ η J ( θ ) ,
where θ is the parameter, η is the learning rate, J ( θ ) is the loss function, and J ( θ ) is the gradient of θ at J ( θ ) . The main advantage of SGD is its simplicity and computational efficiency. However, it may oscillate during the optimization process, leading to slower convergence.
Next, the Adam optimizer is analyzed. The Adaptive Moment Estimation (Adam) optimizer combines the advantages of momentum and RMSProp, considering both the first-order moment estimation and the second-order moment estimation of the gradient. Its mathematical formula can be expressed as:
m t = β 1 m t 1 + ( 1 β 1 ) g t
v t = β 2 v t 1 + ( 1 β 2 ) g t 2
m ^ t = m t / ( 1 β 1 t ) , v ^ t = v t / ( 1 β 2 t )
θ = θ η m ^ t / ( v ^ t + ϵ ) ,
where m t and v t are the first and second moment estimations of the gradient, β 1 and β 2 are the decay rates of the first and second moment estimations, g t is the gradient of θ at time t, m ^ t and v ^ t are the bias-corrected first and second moment estimations, η is the learning rate, and ϵ is a small constant added to prevent division by zero. Adam has an adaptive learning rate adjustment mechanism and can handle issues such as gradient vanishing, sparse gradient, and noisy gradient effectively. However, it might converge to suboptimal solutions prematurely under certain circumstances.
Lastly, the Stable-Momentum Adam optimizer is examined. The Stable-Momentum Adam optimizer, based on the Adam optimizer, includes a stable momentum term. This allows the model to better maintain momentum during the optimization process, thereby improving optimization stability and effectiveness, as talked in Section 4.3. The Stable-Momentum Adam optimizer can maintain optimization stability, avoid premature convergence to suboptimal solutions, and also retains the advantages of the Adam optimizer, allowing it to achieve better results when optimizing the FinChain-BERT model.

5.2.2. Ablation Experiment on Different Loss Functions

The primary aim of the ablation experiment design detailed in this paper was to assess the influence of different loss functions on the performance of the FinChain-BERT model. By comparing the results achieved with different loss functions, insights can be garnered about the potential impact on the model’s performance and inform strategies for optimization. The focus of this section is a detailed analysis of the results from two specific loss functions: the Negative Log-Likelihood (NLL) loss function and the Keywords Loss Function.
Firstly, the NLL loss function is a frequently used loss function in classification tasks and is particularly applicable to multi-classification problems. The primary use of NLL is to measure the consistency between the model’s predicted probability distribution and the actual probability distribution. This can be formulated as:
L N L L ( y , f ( X ) ) = log f ( X ) y ,
where f ( X ) is the model’s predicted probability distribution for input X and y is the true label of the class. The smaller the value of this function, the closer the model’s prediction is to the true result. However, as NLL focuses only on the probability of the correct class and imposes no restrictions on predictions for incorrect classes, it could lead to overconfidence in predicting incorrect classes, which in turn can affect the model’s generalization capabilities. As shown in Table 4, when the FinChain-BERT model utilizes the NLL loss function, the accuracy, recall, and precision rates were 0.89, 0.88, and 0.91, respectively, a performance that is weaker in comparison to the keywords loss function. Next, an analysis of the Keywords Loss Function is presented. This loss function, based on keywords, enhances the model’s focus on key information by integrating keyword information, hence improving the model’s performance as discussed in Section 4.5. According to Table 4, the use of the Keywords Loss Function in the FinChain-BERT model led to an accuracy, recall, and precision rate of 0.97, outperforming the model when the NLL loss function was used.

5.2.3. Ablation Experiment on Int-Distillation

The ablation study presented in this article aims to compare different lightweighting techniques, with a focus on their application and impact on the performance of the FinChain-BERT model. In this section, an analysis of the experimental results of four models is provided: the original FinChain-BERT, the distilled FinChain-BERT, the integer-quantized FinChain-BERT, and the integer-distilled FinChain-BERT.
Initially, the original FinChain-BERT model, which undergoes no lightweighting process, is examined. As illustrated in Table 5, the precision, recall, and accuracy rates of the original model are 0.97, 0.96, and 0.97, respectively, with the model size being 140 MB. While the performance of the original model is optimal, its size is also the largest, potentially making it unsuitable for scenarios requiring smaller models or constrained computational resources. Following this, the distilled FinChain-BERT model is observed, with precision, recall, and accuracy rates at 0.93, 0.94, and 0.94, respectively, and the model size at 110 MB. Despite a decrease in performance compared to the original model, the reduction in model size renders it more advantageous under conditions of limited computational resources. Next, the integer-quantized FinChain-BERT model, which primarily converts model parameters from floating-point numbers to integers of low-bit width, is considered. Although integer quantization significantly reduces the storage demand and computational complexity of the model, it may cause a certain loss in performance. This model yields precision, recall, and accuracy rates of 0.94, 0.96, and 0.95, respectively, with the model size being 89MB. Hence, the integer-quantized model successfully reduces the model size while maintaining relatively high performance. Lastly, the integer-distilled FinChain-BERT model is investigated. This model utilizes a lightweighting technique that combines distillation and integer quantization, leveraging the knowledge transfer characteristics of distillation and the storage and computational efficiency of integer quantization. As indicated in Table 5, the precision, recall, and accuracy rates of the integer-distilled model are 0.92, 0.91, and 0.92, respectively, with the model size being 43MB. While its performance is lower, the integer-distilled model, being the smallest, may be the optimal choice under extremely limited storage and computational resources.

5.3. Test on Model Robustness

The design of this experiment aimed to test the robustness of the model. Robustness is used to measure the model’s performance in various situations, especially under “anomalous” circumstances, such as increased noise or changes in input data. From the provided experimental results, it can be observed that the experiment primarily focused on two aspects: performance comparison of the model under different batch sizes and the addition of noise to features using differential privacy methods.
Batch size refers to the number of samples processed during each forward and backward propagation in neural network training, which affects the training speed, memory consumption, and the stability and accuracy of the model. Differential privacy, on the other hand, is a privacy-preserving technique. By introducing a certain degree of randomness (i.e., noise), the influence of a single entry in the dataset on the output is minimized, thus enhancing data privacy. The essence of differential privacy is to process the data randomly while meeting specific privacy requirements, ensuring that the output statistically remains independent of the inclusion or exclusion of specific data entries. The noise level reflects the size of the ϵ value in differential privacy. The ϵ value describes the privacy loss of the data; a larger ϵ suggests more noise, while a smaller ϵ indicates the opposite.
From Table 6, when analyzing the performance corresponding to different batch sizes, it was found that with a batch size of 128, the model updates frequently. Such a small batch size may cause the model to react significantly to minor changes in the data, resulting in considerable fluctuations and potentially impacting the model’s performance. As the batch size increased to 256 and 384, the stability and accuracy of the model gradually improved. This improvement can be attributed to the fact that a larger batch size can reduce the randomness during model training, allowing the model to better approximate the distribution of the entire dataset. When the batch size reached its maximum value of 480, the model achieved optimal performance, suggesting that this dataset might be more suitable for larger batch sizes for this model. Regarding the noise levels in differential privacy, when there was no noise, the model displayed its inherent performance. Under slight noise, there was a minor decline in model performance, but the overall performance remained commendable, indicating that the model retained good robustness at this noise level. As the noise level increased to moderate and high levels, there was a noticeable decline in various performance metrics, especially precision and recall.
From a mathematical perspective, the robustness of a model is related to its structure, parameters, and training methods. Different batch sizes can influence the frequency of model weight updates and the direction of the gradient, possibly leading to different local optima. The introduction of noise might cause shifts in data distribution, potentially compromising the model’s ability to fit the original data, while enhancing adaptability to perturbed data. In conclusion, the experimental results demonstrated that the model exhibits varying adaptability to different batch sizes and, to a certain extent, verified the robustness of the model under specific noise levels.

5.4. Limits and Future Work

In this study, a thorough exploration and empirical investigation of the loss functions and lightweight techniques for the FinChain-BERT model was conducted. However, it is important to note that there are still limitations in this study, signifying potential future research directions. Although a comparison analysis was carried out for a variety of loss functions and lightweight techniques, the scope of the analysis is not broad enough. For instance, in terms of the loss functions, only the negative log likelihood function and Keywords Loss Function were compared. Future research may consider more diverse loss functions, such as Hinge Loss and Mean Squared Error, among others. Regarding lightweight techniques, the focus was mainly on model distillation and integer quantization. However, other lightweight techniques, such as model pruning, also merit further exploration. For future work, a deeper investigation into more loss functions and lightweight techniques is planned. Especially in the design of loss functions, the development of new types of loss functions more suitable for the FinChain-BERT model, such as graph-based loss functions, is planned. In terms of lightweight techniques, the exploration of more effective model compression and optimization techniques will be pursued, with the aim to further reduce the model size while maintaining its performance. Furthermore, the testing and validation of the model in different domains and tasks will also be considered to verify its wide applicability.

6. Conclusions

The focus of this study lies in exploring the application of NLP techniques in precise financial fraud detection, with a specific emphasis on the implementation and optimization of the FinChain-BERT model. As for the innovation and contributions of the FinChain-BERT model, firstly, the successful application of NLP techniques in financial fraud detection tasks has been demonstrated through the FinChain-BERT model. By harnessing deep learning technology, an improved performance in handling complex financial text information has been achieved. Secondly, a comparative analysis of the negative log-likelihood function and Keywords Loss Function has been conducted in the context of loss function selection. Research results reveal the superior performance of the Keywords Loss Function on the FinChain-BERT model as compared to the negative log-likelihood function. Furthermore, significant contributions have been made in the aspect of model lightweighting, where model distillation, integer quantization, and integer distillation have been experimentally compared. This offers a new possibility for model applications in resource-limited environments. Experimental results have also validated the effectiveness of the FinChain-BERT model and its optimizations. Whether in the selection of loss functions or the application of lightweighting techniques, the FinChain-BERT model has exhibited impressive performance. The use of Keywords Loss Function enabled the model to reach accuracy, recall, and precision rates of 0.97, significantly outperforming the negative log-likelihood function. Simultaneously, the application of integer distillation technology successfully reduced the model size to 43 MB, a result of considerable significance for environments with limited computational resources.
However, as with any research endeavor, this study has its limitations:
1.
Model Overhead: While we optimized the model, its deep architecture may still demand substantial computational resources, which might be challenging to provide in real-time detection scenarios.
2.
Adaptability: Our study’s focus was primarily on financial fraud detection. The adaptability of the FinChain-BERT model to other forms of fraud or malicious activities remains to be examined.
There are multiple avenues for extending this research:
1.
Expanding Datasets: Enriching the training datasets with more diverse real-world financial fraud scenarios would be beneficial. This would enhance the model’s capability to generalize and detect new fraud patterns.
2.
Model Transferability: Investigating the model’s transferability to other domains, such as insurance fraud or e-commerce fraud, can provide insights into its versatility and applicability.
3.
Hybrid Approaches: Combining the FinChain-BERT model with other machine learning techniques or fraud detection algorithms could yield more robust and comprehensive fraud detection systems.
In summary, while this study significantly advances the application of NLP in financial fraud detection, there remain several challenges and opportunities. It is our hope that our research will lay the groundwork for future studies, ensuring continued progress in this vital domain.

Author Contributions

Conceptualization, X.Y. and L.J.; Methodology, Y.S.; Software, L.J.; Validation, X.Y., Y.S. and S.W.; Formal analysis, K.P.; Resources, K.P.; Data curation, C.Z., Y.S. and K.P.; Writing—original draft, X.Y., C.Z., Y.S., K.P., L.J., S.W. and C.L.; Writing—review & editing, S.W. and C.L.; Visualization, X.Y. and C.Z.; Project administration, C.L.; Funding acquisition, C.L. All authors have read and agreed to the published version of the manuscript.

Funding

This research was funded by the National Natural Science Foundation of China, grant number 61202479.

Conflicts of Interest

The authors declare no conflict of interest.

References

  1. Syed, A.A.; Ahmed, F.; Kamal, M.A.; Trinidad Segovia, J.E. Assessing the role of digital finance on shadow economy and financial instability: An empirical analysis of selected South Asian countries. Mathematics 2021, 9, 3018. [Google Scholar] [CrossRef]
  2. Hashim, H.A.; Salleh, Z.; Shuhaimi, I.; Ismail, N.A.N. The risk of financial fraud: A management perspective. J. Financ. Crime 2020, 27, 1143–1159. [Google Scholar] [CrossRef]
  3. Craja, P.; Kim, A.; Lessmann, S. Deep learning for detecting financial statement fraud. Decis. Support Syst. 2020, 139, 113421. [Google Scholar] [CrossRef]
  4. Zhu, X.; Ao, X.; Qin, Z.; Chang, Y.; Liu, Y.; He, Q.; Li, J. Intelligent financial fraud detection practices in post-pandemic era. Innovation 2021, 2, 100176. [Google Scholar] [CrossRef] [PubMed]
  5. Singh, N.; Lai, K.h.; Vejvar, M.; Cheng, T.E. Data-driven auditing: A predictive modeling approach to fraud detection and classification. J. Corp. Account. Financ. 2019, 30, 64–82. [Google Scholar] [CrossRef]
  6. Jan, C.L. Detection of financial statement fraud using deep learning for sustainable development of capital markets under information asymmetry. Sustainability 2021, 13, 9879. [Google Scholar] [CrossRef]
  7. Xiuguo, W.; Shengyong, D. An analysis on financial statement fraud detection for Chinese listed companies using deep learning. IEEE Access 2022, 10, 22516–22532. [Google Scholar] [CrossRef]
  8. Lokanan, M.E.; Sharma, K. Fraud prediction using machine learning: The case of investment advisors in Canada. Mach. Learn. Appl. 2022, 8, 100269. [Google Scholar] [CrossRef]
  9. De Oliveira, N.R.; Pisa, P.S.; Lopez, M.A.; de Medeiros, D.S.V.; Mattos, D.M. Identifying fake news on social networks based on natural language processing: Trends and challenges. Information 2021, 12, 38. [Google Scholar] [CrossRef]
  10. Nanomi Arachchige, I.A.; Sandanapitchai, P.; Weerasinghe, R. Investigating machine learning & natural language processing techniques applied for predicting depression disorder from online support forums: A systematic literature review. Information 2021, 12, 444. [Google Scholar]
  11. Kanakogi, K.; Washizaki, H.; Fukazawa, Y.; Ogata, S.; Okubo, T.; Kato, T.; Kanuka, H.; Hazeyama, A.; Yoshioka, N. Tracing cve vulnerability information to capec attack patterns using natural language processing techniques. Information 2021, 12, 298. [Google Scholar] [CrossRef]
  12. Zhang, Y.; He, S.; Wa, S.; Zong, Z.; Lin, J.; Fan, D.; Fu, J.; Lv, C. Symmetry GAN Detection Network: An Automatic One-Stage High-Accuracy Detection Network for Various Types of Lesions on CT Images. Symmetry 2022, 14, 234. [Google Scholar] [CrossRef]
  13. Taherdoost, H.; Madanchian, M. Artificial intelligence and sentiment analysis: A review in competitive research. Computers 2023, 12, 37. [Google Scholar] [CrossRef]
  14. Dang, N.C.; Moreno-García, M.N.; De la Prieta, F. Sentiment analysis based on deep learning: A comparative study. Electronics 2020, 9, 483. [Google Scholar] [CrossRef]
  15. Villavicencio, C.; Macrohon, J.J.; Inbaraj, X.A.; Jeng, J.H.; Hsieh, J.G. Twitter sentiment analysis towards COVID-19 vaccines in the Philippines using naïve bayes. Information 2021, 12, 204. [Google Scholar] [CrossRef]
  16. Kwon, H.J.; Ban, H.J.; Jun, J.K.; Kim, H.S. Topic modeling and sentiment analysis of online review for airlines. Information 2021, 12, 78. [Google Scholar] [CrossRef]
  17. Zhang, Y.; Li, D.; Wang, Y.; Fang, Y.; Xiao, W. Abstract text summarization with a convolutional seq2seq model. Appl. Sci. 2019, 9, 1665. [Google Scholar] [CrossRef]
  18. Zaremba, W.; Sutskever, I.; Vinyals, O. Recurrent neural network regularization. arXiv 2014, arXiv:1409.2329. [Google Scholar]
  19. Graves, A.; Graves, A. Long short-term memory. In Supervised Sequence Labelling with Recurrent Neural Networks; Springer: Berlin/Heidelberg, Germany, 2012; pp. 37–45. [Google Scholar]
  20. Vaswani, A.; Shazeer, N.; Parmar, N.; Uszkoreit, J.; Jones, L.; Gomez, A.N.; Kaiser, Ł.; Polosukhin, I. Attention is all you need. In Proceedings of the Advances in Neural Information Processing Systems 30 (NIPS 2017), Long Beach, CA, USA, 4–9 December 2017; Volume 30. [Google Scholar]
  21. Federation, C.C. Negative Financial Information and Subject Determination. Available online: https://www.datafountain.cn/competitions/353 (accessed on 17 August 2019).
  22. Liu, Y.; Ott, M.; Goyal, N.; Du, J.; Joshi, M.; Chen, D.; Levy, O.; Lewis, M.; Zettlemoyer, L.; Stoyanov, V. RoBERTa: A Robustly Optimized BERT Pretraining Approach. arXiv 2019, arXiv:1907.11692. [Google Scholar]
  23. Lan, Z.; Chen, M.; Goodman, S.; Gimpel, K.; Sharma, P.; Soricut, R. Albert: A lite bert for self-supervised learning of language representations. arXiv 2019, arXiv:1909.11942. [Google Scholar]
  24. Sanh, V.; Debut, L.; Chaumond, J.; Wolf, T. DistilBERT, a distilled version of BERT: Smaller, faster, cheaper and lighter. arXiv 2019, arXiv:1910.01108. [Google Scholar]
  25. Devlin, J.; Chang, M.; Lee, K.; Toutanova, K. BERT: Pre-training of Deep Bidirectional Transformers for Language Understanding. arXiv 2018, arXiv:1810.04805. [Google Scholar]
  26. Ruder, S. An overview of gradient descent optimization algorithms. arXiv 2016, arXiv:1609.04747. [Google Scholar]
  27. Kingma, D.P.; Ba, J. Adam: A method for stochastic optimization. arXiv 2014, arXiv:1412.6980. [Google Scholar]
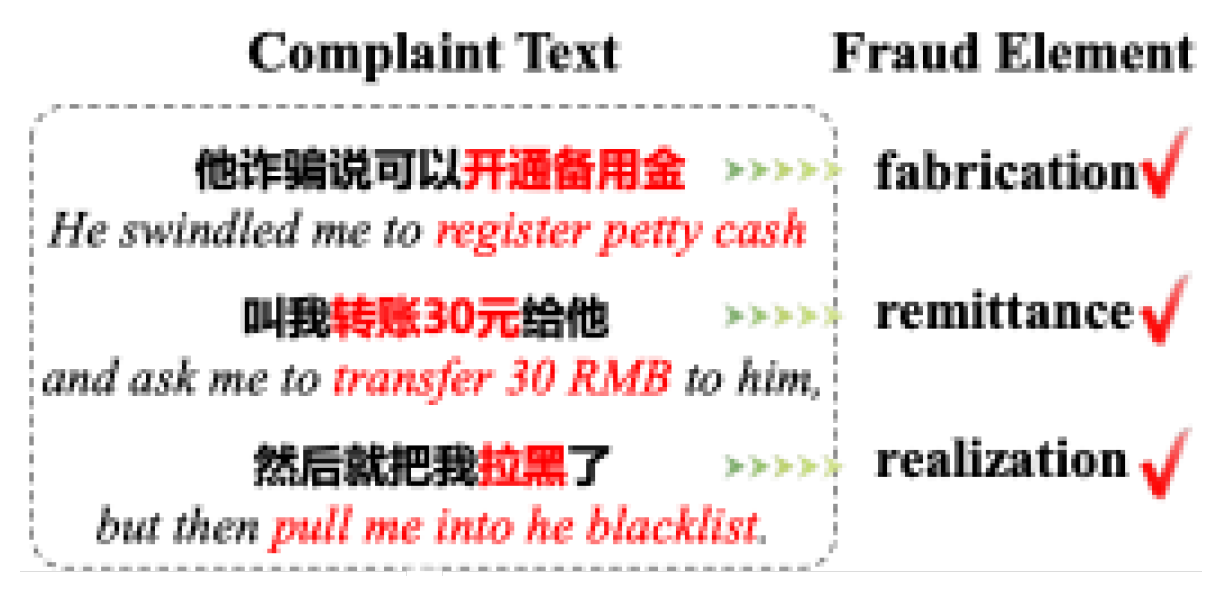
Figure 1. Samples of the dataset used in this paper. The black parts are normal information, while the red parts contain primary fraud elements.
Information 14 00499 g001
Figure 2. The dissection of input text into a chain structure.
Information 14 00499 g002
Figure 3. Visualization of gradients in training. (A) Stable-Momentum Adam optimizer. (B) Adam optimizer. The red color means a dense gradient distribution, while the yellow parts represent an even and sparse gradient distribution.
Information 14 00499 g003
Figure 4. Illustration of fraud focus filter. (A) The filter structure. (B,C) Visualizations of focus on keywords mode.
Information 14 00499 g004
Figure 5. Illustration of the keywords loss function used in this paper.
Information 14 00499 g005
Figure 6. Illustration of the knowledge distillation module.
Information 14 00499 g006
Table 1. Example training data illustrating the mapping from complaint texts ( X i ) to categories ( Y i ) using the function Y = f ( X ) + e .
Input ( X i )Output ( Y i )
register petty cashFabrication
transfer 30 RMBRemittance
pull me into the blacklistRealization
Table 2. Results of fraud detection.
ModelPrecisionRecallAccuracy
FinChain-BERT0.970.960.97
RNN [18]0.750.720.84
LSTM [19]0.860.830.87
BERT [25]0.920.890.91
RoBERTa [22]0.940.950.95
ALBERT [23]0.900.860.89
DistillBERT [24]0.930.910.92
Table 3. Results of different optimizers.
OptimizerPrecisionRecallAccuracy
SGD [26]0.930.890.91
Adam [27]0.950.920.94
Stable-Momentum Adam0.970.960.97
Table 4. Results of different loss functions.
Loss FunctionsPrecisionRecallAccuracy
Negative Log-Likelihood Loss Function0.910.880.89
Keywords Loss Function0.970.960.97
Table 5. Results of different lightweight methods.
Loss FunctionsPrecisionRecallAccuracyModel Size
Original FinChain-BERT0.970.960.97140 MB
Distilled FinChain-BERT0.930.940.94110 MB
Integer Quantization FinChain-BERT0.940.960.9589 MB
Int-Distillation FinChain-BERT0.920.910.9243 MB
Table 6. Results of the robustness of our method.
Batch SizePrecisionRecallAccuracy
1280.910.920.92
2560.940.950.95
3840.950.960.95
Maximum (480)0.970.960.97
Noise LevelPrecisionRecallAccuracy
00.970.960.97
50.970.940.95
100.930.910.92
250.900.920.91
Disclaimer/Publisher’s Note: The statements, opinions and data contained in all publications are solely those of the individual author(s) and contributor(s) and not of MDPI and/or the editor(s). MDPI and/or the editor(s) disclaim responsibility for any injury to people or property resulting from any ideas, methods, instructions or products referred to in the content.