Article

Text to Causal Knowledge Graph: A Framework to Synthesize Knowledge from Unstructured Business Texts into Causal Graphs

by
Seethalakshmi Gopalakrishnan
1,
Victor Zitian Chen
2,
Wenwen Dou
1,
Gus Hahn-Powell
3,
Sreekar Nedunuri
1 and
Wlodek Zadrozny
1,4,*
1
Department of Computer Science, University of North Carolina at Charlotte, Charlotte, NC 28223, USA
2
Fidelity Investments, 100 New Millennium Way, Durham, NC 27709, USA
3
Department of Linguistics, University of Arizona, Tucson, AZ 85721, USA
4
School of Data Science, University of North Carolina at Charlotte, Charlotte, NC 28223, USA
*
Author to whom correspondence should be addressed.
Information 2023, 14(7), 367; https://doi.org/10.3390/info14070367
Submission received: 7 May 2023 / Revised: 19 June 2023 / Accepted: 22 June 2023 / Published: 28 June 2023

Abstract

:
This article presents a state-of-the-art system to extract and synthesize causal statements from company reports into a directed causal graph. The extracted information is organized by its relevance to different stakeholder group benefits (customers, employees, investors, and the community/environment). The presented method of synthesizing extracted data into a knowledge graph comprises a framework that can be used for similar tasks in other domains, e.g., medical information. The current work addresses the problem of finding, organizing, and synthesizing a view of the cause-and-effect relationships based on textual data in order to inform and even prescribe the best actions that may affect target business outcomes related to the benefits for different stakeholders (customers, employees, investors, and the community/environment).

1. Introduction

The research for this article was motivated by the need to solve the problem of extracting business knowledge from business texts, such as technical articles and financial reports.
The business problem involved is illustrated in the estimate by the International Federation of Accountants (IFAC) that the efforts of integrating various reporting data may cost the financial industry alone $780 billion annually [1]. Furthermore, in the current climate, not only do managerial accountants and analysts need to monitor and analyze financial activities, but they also need to do so by making causal links to non-financial behaviors and outcomes, such as sustainability, corporate social responsibility (CSR), environmental, social, and governance (ESG) activities, and/or integrated reporting [2,3]. It was found in recent accounting research that decision-makers rely heavily on cause-and-effect insights (e.g., materiality) that underlie accounting reporting to make financial and strategic decisions [4]. While more financial and non-financial reporting is making more company information accessible, it is also creating analytic paralysis for both internal decision-makers and external analysts, who struggle to make sense of the complex, and often hidden, causal links among different key performance indicators (KPIs) and their drivers.
This article addresses the above business need by providing a framework in which a collection of documents could be translated into a knowledge graph representing causal relations expressed in the texts. Such a Text-to-Knowledge Graph tool allows for the timely synthesis of fragmented knowledge within and across reporting documents. Within enterprise performance management, this tool would assist managers, auditors, accountants, and analysts to automatically detect, extract, and deconstruct causal propositions within and across company reports and to then sort and visually connect the extracted causes and effects into a knowledge graph, which is a visual representation of variables (“entities”) and their relationships (“links”).

Contributions in This Article

The article describes a prototype of the proposed framework, which we call Text2CausalGraph, and evaluates its performance. Our specific contributions include the following:
  • We created a new annotated dataset of cause-and-effect relationships and performance term classifications, based on the S&P Financial Company 10-K reports.
  • We created a pipeline to automatically read a text document and process it to create a knowledge graph.
  • We compared the extracted causalities against a domain taxonomy and classified the extracted causalities.
  • We developed a novel approach to bridge machine reading with domain expertise (e.g., a pre-built taxonomy from domain experts).
  • The presented architecture can be used as a framework for extracting causal information in other domains, for example, in medical texts.

2. Related Work

Causality extraction is the process of extracting the cause and effect from a sentence. In the past few years, much work on causality extraction has been done, but still, it remains a challenging task. A survey on the extraction of causal relations from text [5] categorizes the existing methodologies into knowledge-based, statistical machine learning-based, and deep learning-based methodologies. We briefly show the diversity of these approaches below.
Earlier works in the area of causality extraction used rules and linguistic features to extract cause/effect tuples [6,7,8]. Machine learning models can also be used to extract causality from text. Linguistic features, such as verb pair rules, etc., as well as discourse features, can be used to train classifiers, such as Naive Bayes and Support Vector machines [9,10]. In recent times deep learning-based models have been used to extract causalities from text [11,12,13].
Causalities can be extracted at sentence level (intra-sentence) [14,15,16,17], or across sentences (inter-sentence) [18,19,20]. A model can classify a sentence as being causal-based on the presence of an explicit connective (explicit causality) [11,13,21]. In the absence of causal connectives, semantic information can be used to find the causalities (which is called implicit causality) [22,23].
A recent work on causality extraction [12] extends the SemEval 2010 Task 8 dataset by adding more data and uses BILSTM-CRF with Flair embeddings [24] to extract cause/effect relationships. A similar work [25] uses CNN on the SemEval-2010 Task 8 dataset [26], Causal-TimeBank dataset [27], and Event StoryLine dataset [28], whereas [29] uses a Recursive Neural Tensor Network (RNTN) model [30]. Some of the works consider causality extraction as a span extraction or sequence labeling task [31]. CausalizeR [32] is a similar work that extracts the causal relationships from literature, based on grammatical rules.
Finally, the emergence of large language models creates a new environment for extracting causality-related information. Some models, such as GPT-3, may exhibit subpar performance (as shown in the Appendix C to this article). On the other hand, GPT-4 has the potential to outperform existing methods [33]. At the time of writing, we did not have access to GPT-4.

3. Data

We collected and manually annotated the 2020 SEC 10-K Documents of 65 S&P Financial Companies. Five graduate students, trained in business analytics, business administration, and/or economics, were hired to manually annotate the causal insights from the documents, based on a predefined dictionary of causal trigger words (or cue phrases). At least two students carefully read each sentence with trigger words to ensure it described a cause-and-effect relationship.
As is customary in the area of causality extraction [21,34], only sentences with trigger words were considered causal. Thus, the article addresses explicit causality. However, this is not a major limitation, since causal sentences without causal triggers are relatively rare.
We identified and manually annotated 2234 sentences that were causal in nature. For each of the identified causal sentences, the cause/effect relationship was marked using tags. In the manual annotation, we marked the effects with the <outcome> tag. Five graduate students manually annotated causes, triggers, and outcomes. After one round of discussions to resolve disagreements, there was a 100% inter-rater agreement. However, the 100% agreement did not imply complete consistency, e.g., some phrases included the determiner ’the’ in some sentences but omitted it in others. An example sentence is given below:
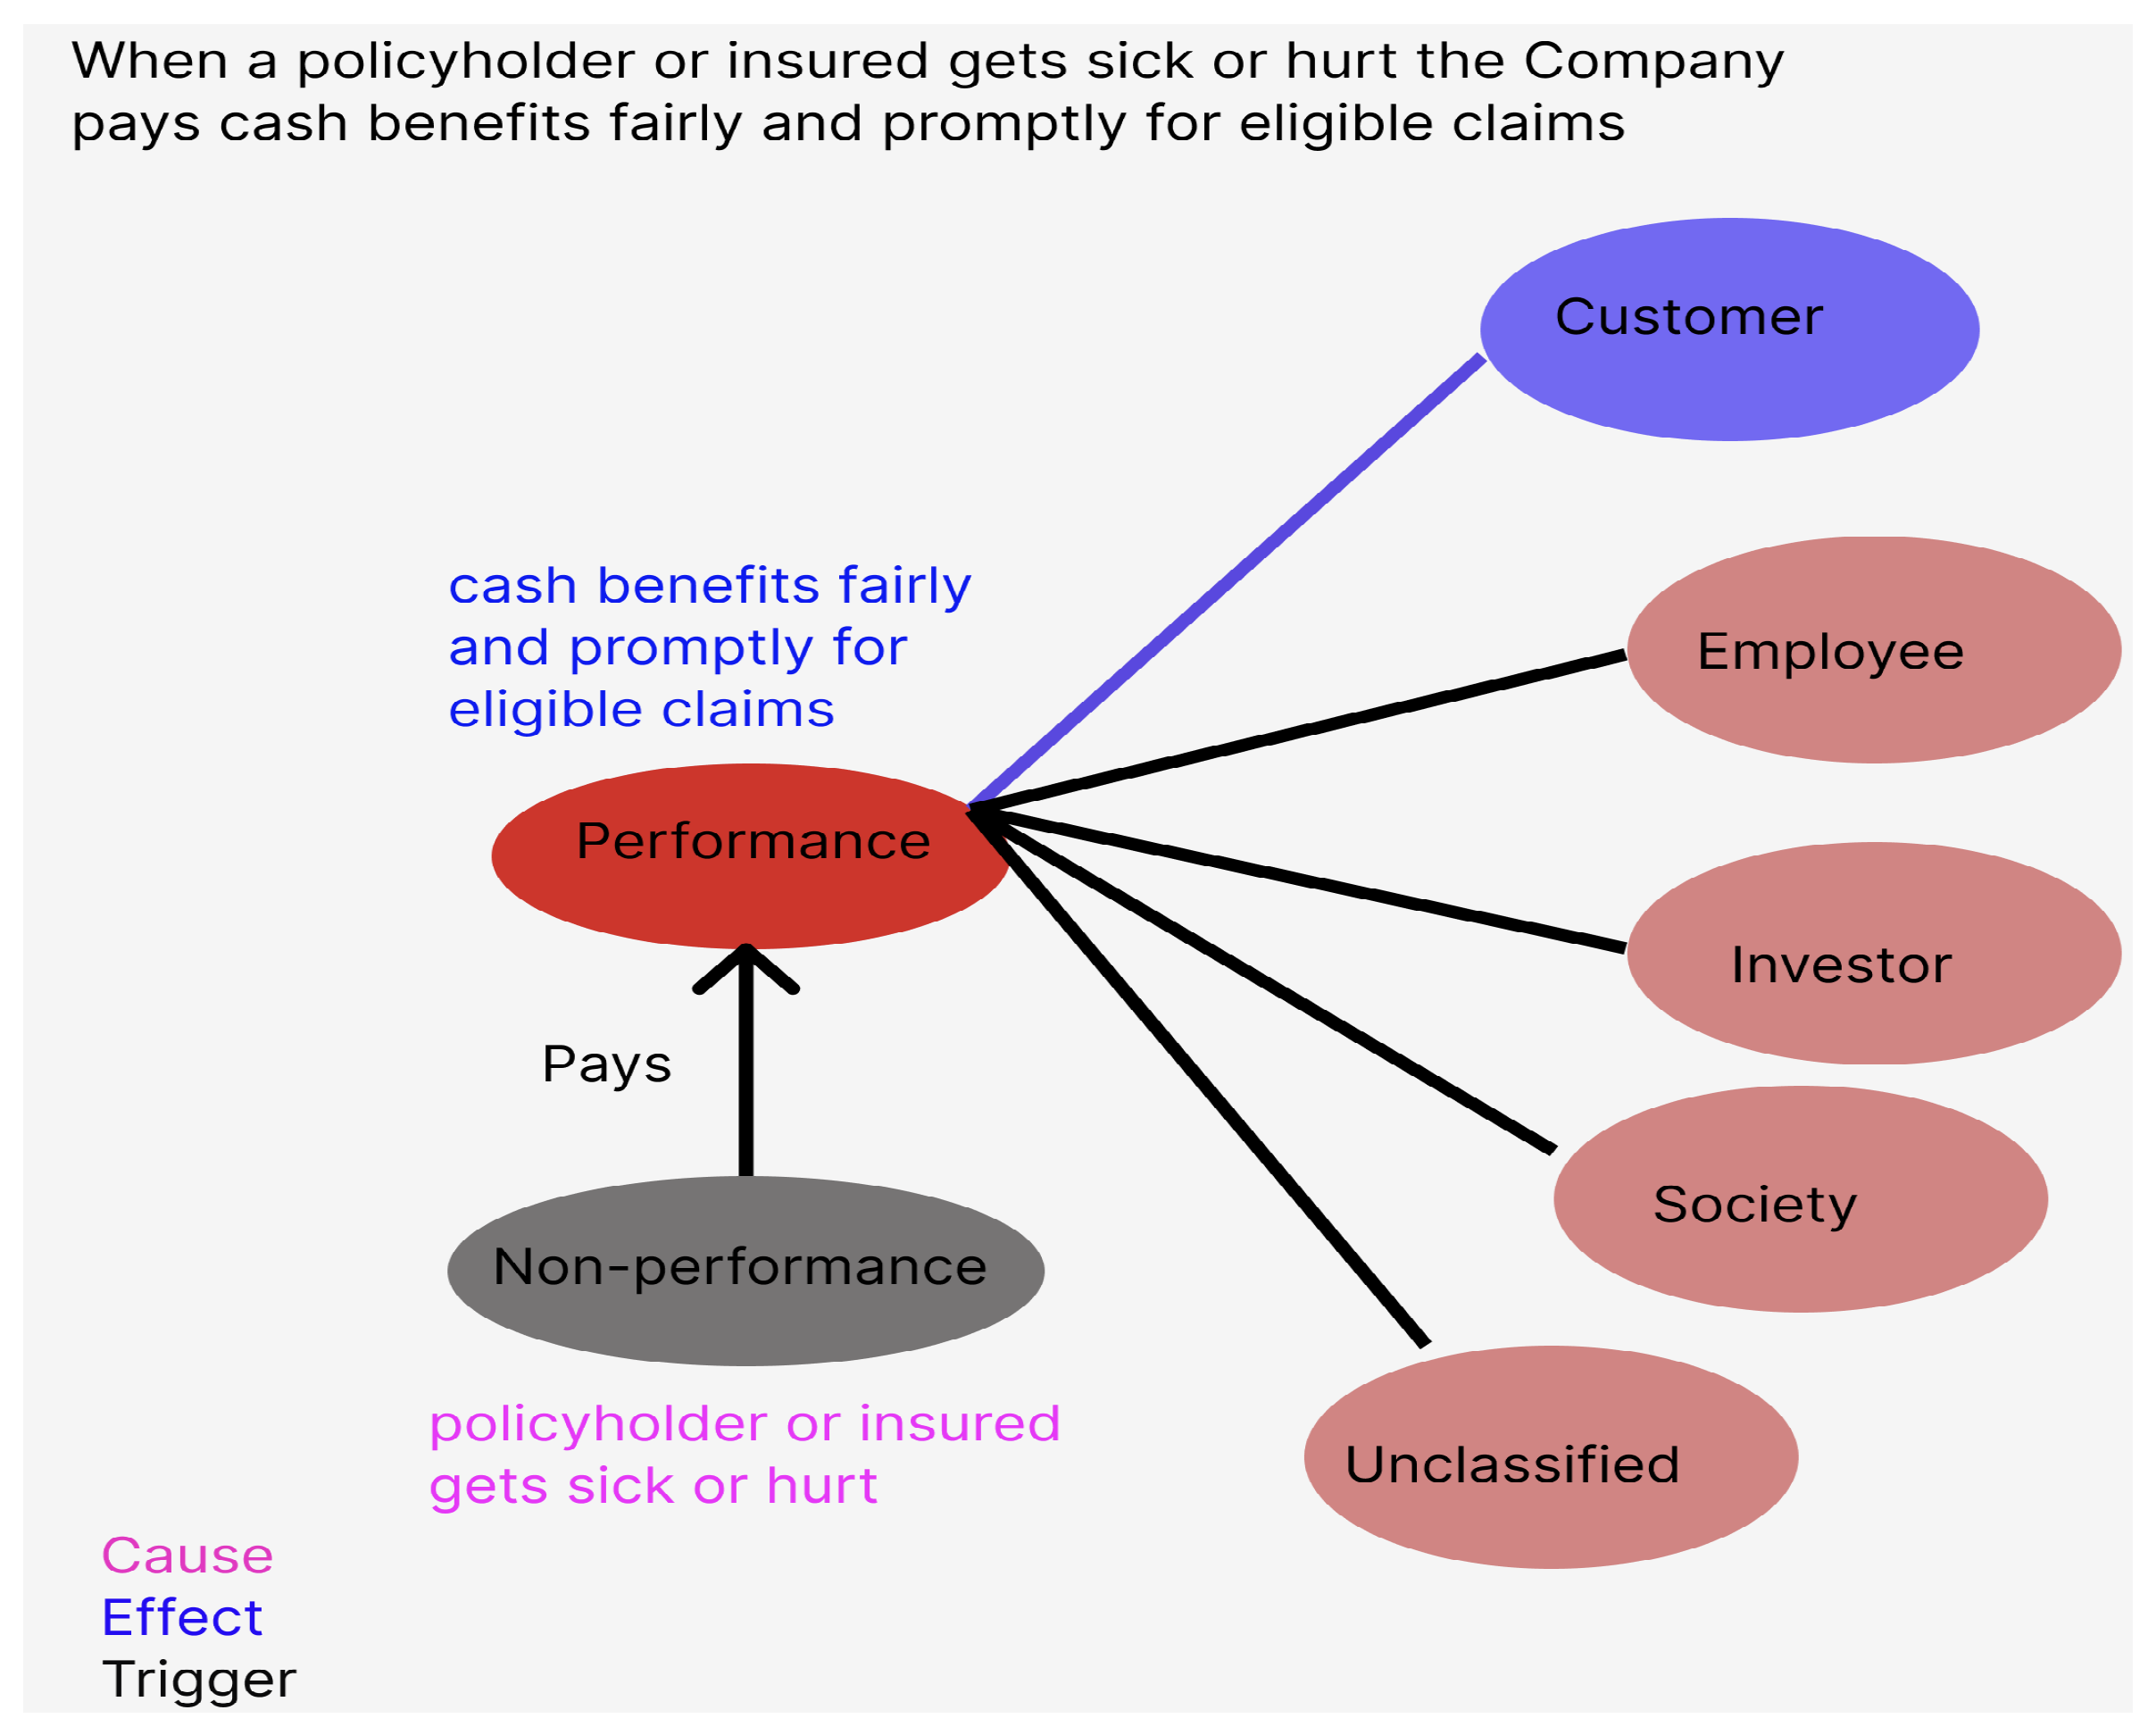
<causal-relation> When a <cause> policyholder or insured person becomes sick or hurt </cause>, the Company <trigger> pays </trigger> <outcome> cash benefits fairly and promptly for eligible claims </outcome> </causal-relation>.
Each of the identified causal relationships was mapped onto a two-level taxonomy representing different stakeholder aspects of business performance indicators. Below is the stakeholder taxonomy we developed for representing business performance indicators.
In the stakeholder taxonomy, shown in Table 1, terms relating to the performance of the company having unclear relations to particular stakeholders were categorized as “unclassified”. We did not apply the “non-performance” label because the aforementioned terms might affect the performance of the company.
Example:
Due to the size of Aflac Japan, where functional currency is the Japanese yen, fluctuations in the exchange rate between the yen and the U.S. dollar can have a significant effect on the Company’s reported financial position and results of operations. (⋯) claims and most expenses are paid in yen. (⋯) yen-denominated assets and U.S. dollar-denominated assets, which may be hedged to yen, (⋯)
Here, the cause fluctuation in the yen/dollar exchange rate is considered “unclassified” because the exchange rate is related to the performance of the company, but no specific stakeholder impact is mentioned.

4. Methodology

The prototype, named Text2CausalGraph (to reflect that it finds causal insights and converts them into a knowledge graph), comprises a series of machine learning modules to automatically detect, extract, label, and synthesize the causal insights from unstructured text in company reports.
The overall architecture is given in Figure 1. The system’s operation includes four steps. Given a text document, the first step is to classify whether the given sentence is causal or not. From a list of classified causal sentences, cause/effect is extracted, and then the extracted causalities are classified, based on a stakeholder taxonomy. The final step is to visualize the classified taxonomy results (this is work in progress, and is not reported on in this article). In this pipeline, all the models are fine-tuned on manually-annotated gold data using transformer-based deep learning models.
The following subsections explain the modules we developed and the model’s performance. The steps we follow in this process are given in Algorithm 1. The performance results, documented in Section 4.3, are based on splitting the manually-annotated data into training and testing portions.
Algorithm 1 Text to Knowledge Graph. The sample output of Algorithm 1 is shown in Figure 2.
Input: 
Organizational data: a set of annual reports of Standard & Poor Financial company documents in textual format.
Model: a pipeline to process unstructured text into a knowledge graph.
Output: 
K G — A knowledge graph, based on stakeholder taxonomy classification, obtained from the extracted causal statements.
1:
for each of the test documents in pdf form uploaded by the user. do
2:
   Extract the text from the pdf document.
3:
   Classify whether a sentence is causal or not using a transformer-based deep learning model.
4:
   Extract the causalities from the classified causal sentences.
5:
   Classify the extracted causalities based on the stakeholder taxonomy.
6:
   Construct the Knowledge graph K G
7:
end for
8:
return K G

4.1. Data Preparation and Preprocessing

As an initial step, 62 reports for the year 2019 from the 10-K annual report documents of Standard & Poor (S&P 500) Financial Companies were retrieved from the Securities and Exchange Commission (SEC) website. On the SEC website, the data is in Inline (eXtensible Business Reporting Language) XBRL format (IXBRL) format. We extracted this text in JSON format without filtering using Trafilatura [35], a Python package, and cleaned the data using the NLTK package [36]. From this extracted and cleaned text, the causal sentences were identified using the causal trigger words. We used about two dozen trigger words and their variants, (manually) adopted from the [37] and from online sources http://web.mit.edu/course/21/21.guide/tran-cwp.htm, https://languageonschools.com/free-english-lessons/conjunctions/transition-words-cause-and-effect/, https://continuingstudies.uvic.ca/elc/studyzone/570/pulp/hemp5 (last accessed on 15 June 2023). If a trigger word was present in a sentence, it was marked as a possible causal sentence using tags <causal-relation>. A JSON dataset, with possible causal sentences marked, was given to a set of graduate students, who read the sentences and marked which part of a sentence was cause/effect. They were marked using the tags given in Example 1.
The next step was to convert the annotated tags into the BIO label format. Whenever there was a cause tag, the beginning of that tag would be marked as the “B-C”, beginning of the cause, and the rest of the cause was marked as “I-C”, inside the cause. Similarly, the beginning of the effect would be marked as “B-E”, and the rest of the effect as “I-E”, and the beginning of a causal trigger would be marked as “B-CT”, and the rest of the causal trigger as “I-CT”. The rest of the words, which were not cause/effect/trigger, were marked with “O” to indicate outside (i.e., not a label of interest). From the annotated tags, BIO labels were marked using regular expressions. The data in the BIO label format was simplified into the IO label format, which improved the consistency of annotations.

4.2. Machine Learning for Automatic Causal Sentence Detection and Extraction

BERT [38] for sequence classification was fine-tuned on our dataset. We ran two sets of experiments to classify the causal sentences. For both sets of experiments, the positive sample consisted of manually-annotated causal sentences. The differences lay in the negative samples. The first set of negative classes consisted of all cases containing a causal trigger where the sentence did not contain a causal relation (selected from organizational data), and a random sample of sentences without causal relations and without causal triggers (selected from Twitter data). The second set of negative samples consisted of all cases of a causal trigger where the sentence did not contain a causal relation. Our data had an equal number of positive and negative samples. The obtained data was divided into train and test data. In the first case, we obtained a macro F1-score of 89%, and, in the second case, an 88% macro F1-score. The detailed results of the causal sentence classification for the two above-mentioned scenarios are given in Appendix A Table A1 and Table A2.

4.3. Machine Learning for Automatic Causality Extraction

BERT is a state-of-the-art performing model for many NLP tasks, including relation extraction [39,40]. We used SpanBERT and DistilBERT models, adapted for token classification for causality extraction. Based on an 80% training set and 20% test set from the manually-annotated gold data, the performance of the SpanBERT model had a macro average F1-score of 0.89, macro average precision of 0.87, and macro average recall of 0.91 and DistilBERT had an average F1-score of 0.86, macro average precision of 0.81, and macro average recall of 0.91.
From Table 2, it can be observed that Span BERT’s performance was better for the causal triggers. However, DistilBERT performed slightly better for cause and effect. Since the cause/effect was important, we discuss the DistilBERT’s performance in Section 5.
During the error analysis, we identified that, in most places, stop words were annotated as “O” and predicted as cause/effect or vice versa. In order to avoid this, as a post-processing step, we removed stop words from the list of tokens. We used the list of NLTK stop words, excluding negations. The results, after removing the stop words, are summarized in Table 3.
From DistilBERT’s performance, after removing stop words, and by comparing Table 2 and Table 3, we ascertained that, for the cause and effect, the F1-score reduced if we removed the stop words, but for the causal triggers the F1-score increased from 0.81 to 0.92. SpanBERT’s performance on the cause and effect slightly increased after removing the stop words.
We also tried using the BERT-large model for the same causality extraction task. BERT-large obtained a macro average F1-score of 0.83, macro precision of 0.78, and macro recall of 0.90, which was lower than the performances of DistilBERT and SpanBERT.
Finally, we noted that when using the BIO-label format to include the beginning and the inside tags for cause, effect, and trigger, we obtained a macro average F1-score of 0.60, accuracy of 0.73, macro average precision of 0.73, and macro average recall of 0.60 using DistilBERT. The results of running DistilBERT, SpanBERT, and BERT-large on our dataset are summarized in Table A3 in the Appendix B.

4.4. Automatic Classification of Causes and Effects into a Stakeholder Taxonomy

In Section 4.3, we extracted the cause/effect relations from the sentences. The next step was to classify whether the extracted cause/effect was relevant to a stakeholder. The taxonomy defined in Table 1 was used for classification. Even though a cause/effect could be relevant to multiple stakeholders, we assigned the most relevant one as the stakeholder label. In future experiments, we will experiment with multiple stakeholders, and see how this impacts the clarity of the system’s message.
We chose the logistic regression model, based on its performance in our prior experiments with similar data.
The logistic regression model was trained on the extracted cause and effect phrases, along with the stakeholder taxonomy labels. in regard to the test data, the model predicted the stakeholder taxonomic labels when a cause/effect phrase was given. The cause/effect phrases were transformed into vectors using the scikit-learn count vectorizer with TF-IDF n-gram range 1 through 3. Based on an 80% training set and 20% test set, with five-fold validation, the performance for the selected model had an average macro F1-score of 0.78, accuracy of 0.89, macro average precision of 0.76, and average macro recall of 0.79 for Level 1. For Level 2, we obtained a macro average F1-score of 0.45, accuracy of 0.88, macro average precision of 0.47, and macro average recall of 0.44.
From Table 4 and Table 5 it can be observed that imbalanced data was the reason for the poor performance of the logistic regression model on certain labels. (We are working on increasing the size of the dataset to have a balanced dataset).
We also tried running BERT. However, the results were low compared to using logistic regression, with an average F1-score of 0.65 on Level 1 labels and 0.28 on Level 2 labels. This might have been because BERT is trained on sentences, and we fine-tuned the model on phrases of cause/effect extracted from sentences. Furthermore, the data was highly imbalanced. Out of a total of 14,508 annotated phrases, 12,532 had non-performance labels, and the rest, 1976, had performance labels. BERT gave a higher performance of around 92% for the non-performance category and a very low F1-score for the performance level category.

4.5. Visualizing the Output

The output of the process described in Section 4.4 was a table with the following information: a full sentence that was causal, cause/effect phrase, and classification of cause/effect into Level 1 and Level 2 stakeholder taxonomy, as given in Table 1. From this table, the relationships between the causes and the effects can be visualized by conversion into a directed graph or a knowledge graph. The graph can be visualized as the relationship between the causes, the effects, and the labels in the taxonomy. A sample visualization for a sentence is given in Figure 2.

5. Error Analysis

We performed an error analysis on the DistilBERT model’s predictions on the test data. The overall statistics of error are shown at the end of this section. However, we did not find any clear error patterns.
Below are some example errors from our predictions. In Example 1, cause was predicted as effect; in Example 2, effect was predicted as cause; and in Example 3, DistilBERT predicted CT wrongly, and SpanBERT predicted CT correctly (an example of a pattern where DistilBERT performed poorly for causal triggers compared to SpanBERT). From this error analysis, we observed different types of errors and better performance from SpanBERT for causal triggers and DistilBERT for cause/effect, but we did not see any consistent pattern in the errors. Errors are provided for illustration.
Example 1.
Input text: Over time, certain sectors of the financial services industry have become more concentrated as institutions involved in a broad range of financial services have been acquired by or merged into other firms. These developments could result in the Company’s competitors gaining greater capital and other resources, such as a broader range of products and services and geographic diversity. The Company may experience pricing pressures as a result of these factors and as some of its competitors seek to increase market share by reducing prices or paying higher rates of interest on deposits.
Step 1 (extracting causal sentences using BERT) produces:
The Company may experience pricing pressures as a result of these factors and as some of its competitors seek to increase market share by reducing prices or paying higher rates of interest on deposits.
Step 2: Extract causalities (which part of the sentence is cause/effect in the classified causal sentence in Step 1, above)
Gold data:
O E E E E E CT CT CT O O C O O O O O C C C C C C C C C C C C C C C C C
Prediction:
E E E E E E CT CT CT O O C O O E E C E E E E E E E E E E E E E E E E
Example 2.
Input text: In times of market stress, unanticipated market movements, or unanticipated claims experience resulting from greater than expected morbidity, mortality, longevity, or persistency, the effectiveness of the Company’s risk management strategies may be limited, resulting in losses to the Company. Under difficult or less liquid market conditions, the Company’s risk management strategies may be ineffective or more difficult or expensive to execute because other market participants may be using the same or similar strategies to manage risk.
Step 1: Classify whether a sentence is causal or not using the transformer-based model (BERT):
Under difficult or less liquid market conditions, the Company’s risk management strategies may be ineffective or more difficult or expensive to execute because other market participants may be using the same or similar strategies to manage risk.
Step 2: Extract causalities, i.e., which part of the sentence is cause/effect in the classified causal sentence in Step 1.
Gold data:
O O O O O O O C C C C C C C C C C C C C C C C CT E E E E E E E E E E E E E E
Prediction:
O C C C C E E E E E E E E E E E E E E E E E E CT C C C C C C C C C C C C C C
Example 3.
Input text: If the contractual counterparty made a claim against the receivership (or conservatorship) for breach of contract, the amount paid to the counterparty would depend upon, among other factors, the receivership (or conservatorship) assets available to pay the claim and the priority of the claim relative to others. In addition, the FDIC may enforce most contracts entered into by the insolvent institution, notwithstanding any provision that would terminate, cause a default, accelerate, or give other rights under the contract solely because of the insolvency, the appointment of the receiver (or conservator), or the exercise of rights or powers by the receiver (or conservator).
Step 1: The causal label is produced using the transformer-based model (BERT): In addition, the FDIC may enforce most contracts entered into by the insolvent institution, notwithstanding any provision that would terminate, cause a default, accelerate, or give other rights.
Step 2: Extract causalities (which part of the sentence is cause/effect in the classified causal sentence in Step 1)
Gold data:
O O C C C C C C C C C C C C C C C C C C CT O E E E E E E
Prediction—DistilBERT:
O O O E O C C C C C C C C C C C C C C C C C E E E E E E
Prediction—SpanBERT:
O O C C C C C C C C C C C C C C C C C C CT E E E E E E E
Overall, out of a total of 29674 tokens, 38% was E, 38% was of type C, 6% CT, and the rest of were O. Based on the error analysis results, 5% of E predicted as C, 1% of E predicted as O, 11% of C predicted as E, 3% of C predicted as O, 2% of CT predicted as E, 3% of CT predicted as O. Less than 1% of E predicted as CT, C predicted as CT, CT predicted as C.

6. Conclusions

In this article, we presented a framework for extracting a causal knowledge graph from text documents. Secondly, we described a prototype, Text2Graph, applying this framework to organizational performance and financial data, which we curated as part of the project. We also showed how to integrate extracted causalities into a stakeholder taxonomy.
The results showed the feasibility of causal information extraction and the conversion of this information into a potentially actionable knowledge graph. This is the first step in addressing the needs of business analysts by integrating information from multiple textual sources into a single knowledge model.
Even though it is a common practice in NLP, the use of a predefined set of trigger words (cues) to identify the causal sentences is an obvious limitation of this work. However, addressing implicit causality is an open research problem and will likely require the use of common sense and a good domain model, as well as new annotated data sets).
In the future, we plan to look into a perhaps easier problem of inter-sentence causality extraction. A portion of our datasets has already been annotated with inter-sentence causalities, and, with some extra work, we should be able to start experimenting. Furthermore, the assignment of taxonomic labels will be improved by expanding our current data set to address the issue of imbalanced data.

Author Contributions

S.G. performed the majority of the experiments and contributed to writing. V.Z.C. directed the data development, project development, and design of the pipeline. W.D. oversaw the project activities and provided feedback throughout the development cycle. G.H.-P. conceptualized the approach for causal relation extraction and stakeholder taxonomy classification. S.N. Worked on data preparation, processing part and developed a causal sentence classification model; all his work was during his studies at UNCC. W.Z. designed parts of the experiments, provided feedback and contributed to writing. All authors have read and agreed to the published version of this manuscript.

Funding

This research was partly funded by the National Science Foundation (NSF) grant number 2141124.

Data Availability Statement

Our data and implementation are available at https://github.com/GoPeaks-AI/text2causalgraph.git, accessed on 6 May 2023.

Acknowledgments

The authors acknowledge the help of Yifei (Alice) Dong, Golnaz Dadgar, Ryan Hammond, Punit Mashruwala, Ravi Duvvuri in data preparation/annotation. We are also grateful for the detailed comments of the referees; these comments helped make the paper much more clear.

Conflicts of Interest

Gus Hahn-Powell declares a financial interest in Lum AI. This interest has been properly disclosed to the University of Arizona Institutional Review Committee and is managed in accordance with its conflict of interest policies. Victor Z. Chen notes that the reported research was done independently from, and does not represent, the author’s affiliation. The other authors declare no conflict of interest.

Abbreviations

    The following abbreviations are used in this manuscript:
NLPNatural Language Processing
IFACInternational Federation of Accountants
CSRCorporate Social Responsibility
ESGEnvironmental, Social, and Governance
SEMStructural Equation Modeling
SCITESelf-attentive BiLSTM-CRF wIth Transferred Embeddings
BiLSTM-CRFBidirectional Long Short-Term Memory-Conditional Random Field
CNNConvolutional neural network
NLTKNatural Language Toolkit
SECSecurities and Exchange Commission
BERTBidirectional Encoder Representations from Transformers

Appendix A

Table A1. Summary of BERT’s performance for the causal sentence classification. Here, for the positive sentences, we use the sentences with causal relations from our data. For the negative sample, we have sentences that do not contain causal relations from our data and a random sample of sentences from Twitter data that do not contain causal triggers. We merge the data to form the negative sample.
PrecisionRecallF1-Score
Class 0: Negative class with all cases of a causal trigger where the sentence does not contain a causal relation and random sample of sentences without causal relations and without causal triggers0.910.860.88
Class 1: Positive class, consisting of sentences that contain causal relations0.860.910.89
Table A2. Summary of BERT’s performance for the causal sentence classification. Here, for the positive sentences, we use sentences with causal relations from our data. For the negative sample, we have sentences that do not contain causal relations selected from our data.
PrecisionRecallF1-Score
Class 0: Negative class with all cases of a causal trigger where the sentence does not contain a causal relation0.910.830.87
Class 1: Positive class, which consists of sentences that contain causal relations0.850.920.88

Appendix B

The results of the causality extraction in Bio label format are summarized below. Here, in most cases, the model could not differentiate between the B-C/B-E and I-C/I-E. The performance of the model was inferior for the BIO label compared to the IO label predictions. Most of the “beginning of cause/effect” labels were predicted as “inside of cause/effect”. Adding a Conditional Random Field (CRF) layer on top of the BERT may help improve the predictions [41].
Table A3. Summary of DistilBERT’s performance on causality extraction task. Each token in the text is assigned a BIO label. The results given above were obtained by splitting the manually-annotated gold data into training and testing partitions. and the training partition was used to fine-tune BERT.
PrecisionRecallF1-Score
Beginning of effect0.670.060.10
Beginning of cause0.680.270.39
Inside of cause0.760.830.79
Inside of causal trigger0.760.950.84
Inside of effect0.720.940.82
Beginning of causal trigger0.890.850.87
Table A4. Summary of SpanBERT’s performance on causality extraction task. Each token in the text is assigned a BIO label. The results given above were obtained by splitting the manually-annotated gold data into training and testing partitions, and the training partition is used to fine-tune BERT.
PrecisionRecallF1-Score
Beginning of effect0.620.630.62
Beginning of cause0.560.590.57
Inside of cause0.780.870.83
Inside of causal trigger0.940.960.95
Inside of effect0.840.900.87
Beginning of causal trigger0.940.960.95
Table A5. Summary of BERT-large performance on causality extraction task. Each token in the text is assigned a BIO label. The results given above were obtained by splitting the manually annotated gold data into training and testing partitions, and the training partition was used to fine-tune BERT. A score of 0.00 for recall when the precision was 1.00 was due to rounding the score by scikit-learn python library.
PrecisionRecallF1-Score
Beginning of effect1.000.000.00
Beginning of cause0.830.020.04
Inside of cause0.700.870.77
Inside of causal trigger0.630.700.66
Inside of effect0.710.910.80
Beginning of causal trigger0.740.670.70

Appendix C

In recent times, prompting large language models has given state-of-the-art performing results for many NLP tasks [42,43]. We tried a few-shot prompting of GPT-3 on a sample of 100 sentences from our dataset. The model’s results are summarized in Table A6. At the time of running these experiments, we did not have access to GPT-4.
Table A6. Few-shot prompting of GPT-3.5 on the organizational causality extraction dataset. This result was on a sample of 100 sentences from the dataset.
PrecisionRecallF1-Score
Cause0.490.280.36
Causal trigger0.050.050.05
Effect0.470.380.42
From Table A7 it can be observed that the Large Language Model GPT-3.5 performed poorly on a sample of 100 sentences from our data. [44] discusses the performance of ChatGPT for causal reasoning and causal interpretation. Their experiments showed that ChatGPT was not a good causal reasoner, which our results also indicate.
Table A7. Few-shot prompting of GPT-3.5 on the Level 1 labels of the stakeholder taxonomy. This result was on a sample of 100 sentences from the dataset.
PrecisionRecallF1-Score
Non-Performance0.720.800.76
Performance0.120.080.10

References

  1. IFAC; International Federation of Accountants. Regulatory Divergence: Costs, Risks and Impacts. 2018. Available online: https://www.ifac.org/knowledge-gateway/contributing-global-economy/publications/regulatory-divergence-costs-risks-and-impacts (accessed on 26 April 2023).
  2. Khan, M.; Serafeim, G.; Yoon, A. Corporate sustainability: First evidence on materiality. Account. Rev. 2016, 91, 1697–1724. [Google Scholar] [CrossRef] [Green Version]
  3. Naughton, J.P.; Wang, C.; Yeung, I. Investor sentiment for corporate social performance. Account. Rev. 2019, 94, 401–420. [Google Scholar] [CrossRef]
  4. Green, W.J.; Cheng, M.M. Materiality judgments in an integrated reporting setting: The effect of strategic relevance and strategy map. Account. Organ. Soc. 2019, 73, 1–14. [Google Scholar] [CrossRef]
  5. Yang, J.; Han, S.C.; Poon, J. A survey on extraction of causal relations from natural language text. Knowl. Inf. Syst. 2022, 64, 1161–1186. [Google Scholar] [CrossRef]
  6. Radinsky, K.; Davidovich, S.; Markovitch, S. Learning causality for news events prediction. In Proceedings of the 21st International Conference on World Wide Web, Lyon, France, 16–20 April 2012; pp. 909–918. [Google Scholar]
  7. Ittoo, A.; Bouma, G. Minimally-supervised learning of domain-specific causal relations using an open-domain corpus as knowledge base. Data Knowl. Eng. 2013, 88, 142–163. [Google Scholar] [CrossRef]
  8. Kang, N.; Singh, B.; Bui, C.; Afzal, Z.; van Mulligen, E.M.; Kors, J.A. Knowledge-based extraction of adverse drug events from biomedical text. BMC Bioinform. 2014, 15, 1–8. [Google Scholar] [CrossRef] [PubMed] [Green Version]
  9. Pechsiri, C.; Kawtrakul, A.; Piriyakul, R. Mining Causality Knowledge from Textual Data. In Proceedings of the Artificial Intelligence and Applications, Innsbruck, Austria, 13–16 February 2006; pp. 85–90. [Google Scholar]
  10. Keskes, I.; Zitoune, F.B.; Belguith, L.H. Learning explicit and implicit arabic discourse relations. J. King Saud-Univ.-Comput. Inf. Sci. 2014, 26, 398–416. [Google Scholar] [CrossRef] [Green Version]
  11. Xu, Y.; Mou, L.; Li, G.; Chen, Y.; Peng, H.; Jin, Z. Classifying relations via long short term memory networks along shortest dependency paths. In Proceedings of the 2015 Conference on Empirical Methods in Natural Language Processing, Lisbon, Portugal, 17–21 September 2015; pp. 1785–1794. [Google Scholar]
  12. Li, Z.; Li, Q.; Zou, X.; Ren, J. Causality extraction based on self-attentive BiLSTM-CRF with transferred embeddings. Neurocomputing 2021, 423, 207–219. [Google Scholar] [CrossRef]
  13. Wang, L.; Cao, Z.; De Melo, G.; Liu, Z. Relation classification via multi-level attention cnns. In Proceedings of the 54th Annual Meeting of the Association for Computational Linguistics (Volume 1: Long Papers), Berlin, Germany, 7–12 August 2016; pp. 1298–1307. [Google Scholar]
  14. Garcia, D.; EDF-DER; IMA-TIEM. COATIS, an NLP system to locate expressions of actions connected by causality links. In Proceedings of the Knowledge Acquisition, Modeling and Management: 10th European Workshop, EKAW’97, Sant Feliu de Guixols, Catalonia, Spain, 15–18 October 1997; Proceedings 10. pp. 347–352. [Google Scholar]
  15. Khoo, C.S.; Chan, S.; Niu, Y. Extracting causal knowledge from a medical database using graphical patterns. In Proceedings of the 38th Annual Meeting of The Association for Computational Linguistics, Hing Kong, China, 3–6 October 2000; pp. 336–343. [Google Scholar]
  16. Pakray, P.; Gelbukh, A. An open-domain cause-effect relation detection from paired nominals. In Proceedings of the Nature-Inspired Computation and Machine Learning: 13th Mexican International Conference on Artificial Intelligence, MICAI 2014, Tuxtla Gutiérrez, Mexico, 16–22 November 2014; Proceedings, Part II 13. pp. 263–271. [Google Scholar]
  17. Smirnova, A.; Cudré-Mauroux, P. Relation extraction using distant supervision: A survey. ACM Comput. Surv. (CSUR) 2018, 51, 1–35. [Google Scholar] [CrossRef]
  18. Marcu, D.; Echihabi, A. An unsupervised approach to recognizing discourse relations. In Proceedings of the 40th Annual Meeting of The Association for Computational Linguistics, Philadelphia, PA, USA, 7–12 July 2002; pp. 368–375. [Google Scholar]
  19. Jin, X.; Wang, X.; Luo, X.; Huang, S.; Gu, S. Inter-sentence and implicit causality extraction from chinese corpus. In Proceedings of the Advances in Knowledge Discovery and Data Mining: 24th Pacific-Asia Conference, PAKDD 2020, Singapore, 11–14 May 2020; Proceedings, Part I 24. pp. 739–751. [Google Scholar]
  20. Oh, J.H.; Torisawa, K.; Hashimoto, C.; Sano, M.; De Saeger, S.; Ohtake, K. Why-question answering using intra-and inter-sentential causal relations. In Proceedings of the 51st Annual Meeting of the Association for Computational Linguistics (Volume 1: Long Papers), Sofia, Bulgaria, 4–9 August 2013; pp. 1733–1743. [Google Scholar]
  21. Girju, R. Automatic detection of causal relations for question answering. In Proceedings of the ACL 2003 Workshop on Multilingual Summarization and Question Answering, Sapporo, Japan, 11 July 2003; pp. 76–83. [Google Scholar]
  22. Martínez-Cámara, E.; Shwartz, V.; Gurevych, I.; Dagan, I. Neural disambiguation of causal lexical markers based on context. In Proceedings of the IWCS 2017—12th International Conference on Computational Semantics—Short Papers, Montpellier, France, 19–22 September 2017. [Google Scholar]
  23. Ittoo, A.; Bouma, G. Extracting explicit and implicit causal relations from sparse, domain-specific texts. In Proceedings of the Natural Language Processing and Information Systems: 16th International Conference on Applications of Natural Language to Information Systems, NLDB 2011, Alicante, Spain, 28–30 June 2011; Proceedings 16. pp. 52–63. [Google Scholar]
  24. Akbik, A.; Bergmann, T.; Blythe, D.; Rasul, K.; Schweter, S.; Vollgraf, R. FLAIR: An easy-to-use framework for state-of-the-art NLP. In Proceedings of the 2019 Conference of the North American Chapter of the Association for Computational Linguistics (Demonstrations), Minneapolis, MN, USA, 2–7 June 2019; pp. 54–59. [Google Scholar]
  25. Li, P.; Mao, K. Knowledge-oriented convolutional neural network for causal relation extraction from natural language texts. Expert Syst. Appl. 2019, 115, 512–523. [Google Scholar] [CrossRef]
  26. Hendrickx, I.; Kim, S.N.; Kozareva, Z.; Nakov, P.; Séaghdha, D.O.; Padó, S.; Pennacchiotti, M.; Romano, L.; Szpakowicz, S. Semeval-2010 task 8: Multi-way classification of semantic relations between pairs of nominals. arXiv 2019, arXiv:1911.10422. [Google Scholar]
  27. Mirza, P. Extracting temporal and causal relations between events. In Proceedings of the ACL 2014 Student Research Workshop, Baltimore, MD, USA, 22–27 June 2014; pp. 10–17. [Google Scholar]
  28. Caselli, T.; Vossen, P. The event storyline corpus: A new benchmark for causal and temporal relation extraction. In Proceedings of the Events and Stories in the News Workshop, Vancouver, BC, Canada, 4 August 2017; pp. 77–86. [Google Scholar]
  29. Fischbach, J.; Springer, T.; Frattini, J.; Femmer, H.; Vogelsang, A.; Mendez, D. Fine-grained causality extraction from natural language requirements using recursive neural tensor networks. In Proceedings of the 2021 IEEE 29th International Requirements Engineering Conference Workshops (REW), Notre Dame, IN, USA, 20–24 September 2021; pp. 60–69. [Google Scholar]
  30. Socher, R.; Lin, C.C.; Manning, C.; Ng, A.Y. Parsing natural scenes and natural language with recursive neural networks. In Proceedings of the 28th international conference on machine learning (ICML-11), Bellevue, DC, USA, 28 June–2 July 2011; pp. 129–136. [Google Scholar]
  31. Lyu, C.; Ji, T.; Sun, Q.; Zhou, L. DCU-Lorcan at FinCausal 2022: Span-based Causality Extraction from Financial Documents using Pre-trained Language Models. In Proceedings of the 4th Financial Narrative Processing Workshop@ LREC2022, Marseille, France, 20–25 June 2022; pp. 116–120. [Google Scholar]
  32. Ancin-Murguzur, F.J.; Hausner, V.H. causalizeR: A text mining algorithm to identify causal relationships in scientific literature. PeerJ 2021, 9, e11850. [Google Scholar] [CrossRef]
  33. Kıcıman, E.; Ness, R.; Sharma, A.; Tan, C. Causal Reasoning and Large Language Models: Opening a New Frontier for Causality. arXiv 2023, arXiv:2305.00050. [Google Scholar]
  34. Fischbach, J.; Frattini, J.; Spaans, A.; Kummeth, M.; Vogelsang, A.; Mendez, D.; Unterkalmsteiner, M. Automatic detection of causality in requirement artifacts: The cira approach. In Proceedings of the Requirements Engineering: Foundation for Software Quality: 27th International Working Conference, REFSQ 2021, Essen, Germany, 12–15 April 2021; Proceedings 27. pp. 19–36. [Google Scholar]
  35. Barbaresi, A. Trafilatura: A web scraping library and command-line tool for text discovery and extraction. In Proceedings of the 59th Annual Meeting of the Association for Computational Linguistics and the 11th International Joint Conference on Natural Language Processing: System Demonstrations, Bangkok, Thailand, 1–6 August 2021; pp. 122–131. [Google Scholar]
  36. Bird, S. NLTK: The natural language toolkit. In Proceedings of the COLING/ACL 2006 Interactive Presentation Sessions, Sydney, Australia, 17–18 July 2006; pp. 69–72. [Google Scholar]
  37. Barrett, E.; Paradis, J.; Perelman, L.C. The Mayfield Handbook of Technical & Scientific Writing; Mayfield Company: Mountain View, CA, USA, 1998. [Google Scholar]
  38. Devlin, J.; Chang, M.W.; Lee, K.; Toutanova, K. Bert: Pre-training of deep bidirectional transformers for language understanding. arXiv 2018, arXiv:1810.04805. [Google Scholar]
  39. Shi, P.; Lin, J. Simple bert models for relation extraction and semantic role labeling. arXiv 2019, arXiv:1904.05255. [Google Scholar]
  40. Lin, C.; Miller, T.; Dligach, D.; Bethard, S.; Savova, G. A BERT-based universal model for both within-and cross-sentence clinical temporal relation extraction. In Proceedings of the 2nd Clinical Natural Language Processing Workshop, Minneapolis, MN, USA, 7 June 2019; pp. 65–71. [Google Scholar]
  41. Souza, F.; Nogueira, R.; Lotufo, R. Portuguese named entity recognition using BERT-CRF. arXiv 2019, arXiv:1909.10649. [Google Scholar]
  42. Singhal, K.; Azizi, S.; Tu, T.; Mahdavi, S.S.; Wei, J.; Chung, H.W.; Scales, N.; Tanwani, A.; Cole-Lewis, H.; Pfohl, S.; et al. Large Language Models Encode Clinical Knowledge. arXiv 2020, arXiv:2212.13138. [Google Scholar]
  43. Si, C.; Gan, Z.; Yang, Z.; Wang, S.; Wang, J.; Boyd-Graber, J.; Wang, L. Prompting gpt-3 to be reliable. arXiv 2022, arXiv:2210.09150. [Google Scholar]
  44. Gao, J.; Ding, X.; Qin, B.; Liu, T. Is ChatGPT a Good Causal Reasoner? A Comprehensive Evaluation. arXiv 2023, arXiv:2305.07375. [Google Scholar]
Figure 1. An architecture diagram showing the extraction and classification of causal statements from the S&P financial companies. The method consists of four main steps: causal sentence classification, causality extraction, classification of causalities based on stakeholder taxonomy, and construction of a knowledge graph. For this pipeline, the input is a set of text documents, and the output a knowledge graph showing the relations of cause and effect.
Information 14 00367 g001
Figure 2. Knowledge graph for a sample sentence. Here the cause (policyholder or insured person becomes sick or hurt) is a non-performance label. The trigger word “pays” triggers an effect (cash benefits paid fairly and promptly for eligible claims). The effect is a performance label, and it can be further categorized into a customer at level 1 stakeholder taxonomy.
Information 14 00367 g002
Table 1. Stakeholder Taxonomy which we used to classify the extracted causal statements. The causal statements extracted (Section 4.3) were classified using the machine learning model (Section 4.4) into categories.
Level 1Level 2Level 2 Description
Performance (P)Investors (INV)The economic or financial outcomes for the firm, which benefit investors, shareholders, debtholders, or financiers.
Customers (CUS)The value and utility of products/services the firm creates for, and delivers to, customers, clients, or users.
Employees (EMP)The benefits and welfare employees (workers and managers) receive from an organization.
Society (SOC)An organization’s efforts and impacts on addressing community, environmental, and general public concerns.
Unclassified
Non-performance (NP) Sentences which do not fall under a performance category.
Table 2. Summary of SpanBERT and DistilBERT’s performance on the Organizational data for the Causality Extraction task (CE-ORG). Each token in the text was assigned a cause (C), effect (E), and Causal Trigger (CT) label. The results given above were obtained by splitting the manually-annotated gold data into train and test partitions, from which the training partition was used to fine-tune BERT.
P(Span)R(Span)F1(Span)P(Distil)R(Distil)F1(Distil)
Cause0.820.860.840.780.930.85
Causal trigger0.930.970.950.770.860.81
Effect0.860.900.880.880.940.91
Table 3. Summary of the results of causality extraction after removing the stop words from the list of the tokens. Here we used a set of common English stop words that crucially omitted negation tokens (for example, not) from the ignored set.
P(Span)R(Span)F1(Span)P(Distil)R(Distil)F1(Distil)
Cause0.830.880.850.790.870.83
Causal trigger0.930.970.950.910.930.92
Effect0.870.910.890.800.940.86
Table 4. Performance of logistic regression model on Level 1 labels of the stakeholder taxonomy. The results summarized in this table were based on splitting the manually-annotated data into training and testing sets, and training a logistic regression model.
PrecisionRecallF1-ScoreSupport
Business Performance0.580.650.6212532
Business Non-performance0.940.930.941976
Table 5. Performance of classification model on Level 2 labels of the stakeholder taxonomy. The results summarized in this table were based on splitting the manually-annotated data into training and testing sets, and training a machine learning model. In the manually-annotated data, there were many Non-performance labels, and we obtained a higher F1 score in that category.
PrecisionRecallF1-ScoreSupport
Customer0.110.060.0831
Employee0.610.520.56204
Investor0.560.700.621013
Society0.220.110.1535
Unclassified0.360.320.34693
Business Non-performance0.940.930.9412532
Disclaimer/Publisher’s Note: The statements, opinions and data contained in all publications are solely those of the individual author(s) and contributor(s) and not of MDPI and/or the editor(s). MDPI and/or the editor(s) disclaim responsibility for any injury to people or property resulting from any ideas, methods, instructions or products referred to in the content.

