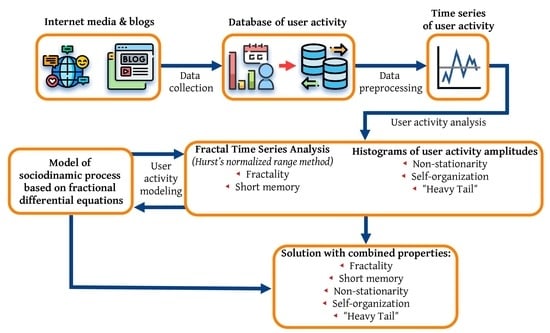
1. Introduction
News articles and blogs, under which Internet users can leave their comments, can act as online indicators of public opinion, making them one of the most important online platforms. News articles or blogs that address a socially significant topic usually attract both its proponents and opponents, who enter into discussions and leave reciprocal comments. Additionally, the more resonant the news or blog is, the higher the user activity and the greater the number of commentators (with multi-tiered comment replies). The analysis of the activity of news or blog users is an important scientific objective.
From the point of view of system engineering and knowledge management, research on processes in social networks and network mass media, on the one hand, should be based on the use of a significant number of interdisciplinary approaches, including tools for system analysis, mathematical modeling of complex systems, psychology, analysis of multimodal data (for example, texts, graphics, audio, and video), and much more. On the other hand, such studies give rise to a new understanding in knowledge management, which should contribute to the emergence of new engineering solutions in user social network communication systems.
Changes in user activity on social and other media time series, as well as the analysis of their dynamics and characteristics, plays an important role in predicting trends in sociodynamic processes and social moods (e.g., during electoral campaigns).
Complex systems (social and online media are systems of this kind) can be defined as structures in which a person acts as at least one of the elements. On the one hand, the effect of many random factors results in the stochastic characteristics of such systems. In addition to stochasticity, there is sometimes uncertainty associated with people’s irrational behavior. On the other hand, the human factor requires the system to become self-organized and develop its own memory about its previous states. All this leads to organized complexity (emergence), which cannot be thought of as the result of a simple summation of elemental characteristics, but rather a result of systemic relations and the adaptive redistribution of functions between elements. It should be noted that most processes observed in complex social and economic systems can only be described with a non-stationary time series. Due to the non-linearity and variability of time series characteristics, traditional modeling methods such as the autoregressive integrated moving average model (ARIMA), the Box–Jenkins model and many others often lead to inaccurate or faulty results.
Studies on the time series of sociodynamic processes using the R/S analysis show that in many cases they are fractal and their Hurst exponent differs significantly from 0.5.
In addition, if we study how the amplitudes of deviations of the time series levels depend on the time interval for their calculation, we can see not only non-stationarity (mathematical expectation and dispersion of distributions depend on the time interval for amplitude calculations), but also a heavy tail as the probability plots lie above the normal probability plot.
Fractality of the time series for the observed processes can be due to the fact that the variables describing them (the time and level of a series) are characterized by fractional variables of measurement. Therefore, it is advisable to use fractional differential equations, such as the diffusion type, to approximate the functions for the probability density of their parameters.
In this paper, we analyze and describe the development of such a model and compare the modeling results with the observed data.
The rest of the paper is organized as follows.
Section 2 briefly describes the problems of modeling a non-stationary time series and modern research on the dynamics of social processes.
Section 3 is devoted to the selection of data sources and collection of statistics about user activity on news resources.
Section 4 presents the objective of the research and describes the data processing and analysis of observed time series.
Section 5 describes the design of the sociodynamic processes model based on the use of a differential diffusion equation with fractional derivatives. Finally,
Section 6 presents our conclusions and discusses future work.
2. Review of the Problems of Modeling Non-Stationary Time Series and Modern Research in Dynamics of Social Processes
In practical tasks that involve observations of a random non-stationary process running within a sliding window, the number of errors appearing due to the acceptance of a particular statistical hypothesis is many times greater than the level of significance at which the decision for the given criterion is made.
In the case of non-stationary time series, all asymptotic criteria guaranteeing an increase in the accuracy of the approximation with an increase in the sample size prove inadequate. Similar problems arise when using smoothed moving averages. If a series is non-stationary, the average (moving, or growing; taken by a sample of increasing size or any other) values are insufficient evaluations of the distribution moments because there is no probability convergence in general.
In the non-stationary case, the very concept of general totality is absent, rendering the instruments of mathematical statistics inapplicable except where the functional belonging of a process model is known a priori while, in practice, the distribution class is usually unknown.
When we study stationary random processes, according to Glivenko’s theorem (regarding the convergence of empirical probability to theoretical distribution), the more observed values are taken into account, the more accurate the theoretical characteristics of the random variable distribution for a particular interval will be. For non-stationary random processes, this condition cannot be met due to its specificity, which makes it difficult to use the results of their analysis for further forecasting. Non-stationarity makes it impossible to obtain time series values large enough to build a general population. In the analysis of a stationary process, the obtained values of mathematical expectation and dispersion of a random variable can be used to make a prediction on any time interval of observation; in the case of a non-stationary time series, there is a moment of discord after which the previously obtained characteristics of the distribution cannot predict the future behavior of the time series.
The aforementioned restrictions of the existing analysis models and descriptions of non-stationary time series encouraged us to explore new methods of studying them.
Some of these new research avenues include the use of neural networks [
1,
2,
3,
4], fuzzy logic methods [
5], non-parametric models based on the use of the chaos theory and support vector regression [
6], sets of rules based on genetic algorithms [
7,
8], self-organizing adaptive models [
9], and many others.
With this in mind, it is worth highlighting papers related to the topic of our research.
In [
10], the authors study two concepts in detail, i.e., temporal sentiment analysis and the causal relationship of moods. Temporal sentiment analysis is useful for generalizing events based on mood and time. Causal relationship is useful for identifying causal relations of events, and also for predicting events. These two concepts in combination led to the development of an event forecasting model that can predict a period of time between events and the sentiment of upcoming events. This paper introduces a generalized forecasting model based on temporal sentiment analysis to find out the causal relationship between events, which can be used to predict event sentiment and the time period between the events. The proposed method is evaluated using indicators of performance, accuracy, and response.
The authors of the article in [
11] discuss various forecasting problems associated with the Internet, summarize and classify the relevant forecasting methods, analyze their advantages and disadvantages and indicate cutting-edge and critical problems in this area.
The study in [
12] describes a model for forecasting news events on news feeds, which is based on stochastic dynamics of changes in the structure of news clusters with the memory of previous states and a self-organized structure. Event forecasting is based on event text description, text vectorization, and calculations of cosines of the angles between the text vector and centroids of various semantic clusters in the information system (IS). Modeling involves building probabilistic patterns of transitions between states on the IS, which take into account a set of previous steps. Based on the proposed approach, we have obtained a nonlinear second-order differential equation and have formulated and solved a boundary value problem of forecasting news. This makes it possible to obtain a theoretical dependence of the probability density function of the non-stationary time series parameters that describe IS evolution of time. Experimental verification of the developed model has proved its soundness and adequacy.
The article [
13] describes a model for forecasting events on news feeds, which is built on the use of stochastic dynamics of changes in the structure of non-stationary time series in news clusters (states of the information space) based on the use of diffusion approximation. Forecasting events on a news feed is based on their text description, vectorization and finding the cosine of the angle between a given vector and centroids of various semantic clusters on the information space.
Changes over time in the cosine of such angles between the vector and the centroids can be represented as point wandering along the segment [0, 1]. This segment has a trap at the event occurrence threshold point in which the wandering point may eventually fall into. When creating the model, the authors took into account the probabilistic patterns of transitions between states in the information space.
Based on this approach, we obtained a nonlinear second-order differential equation and formulated and solved a boundary value problem of forecasting news, which made it possible to obtain a theoretical time dependence of the probability density function of the non-stationary time series parameters that describe information space evolution. The research results described in the paper have made it possible to draw a number of very important conclusions. The developed model for predicting news feed events is adequate and consistent (all news events used to test the model occurred with a high probability (approx. 80%) or, if they are fictional news, they can only happen after an unacceptably long time). Analysis of the news feed event prediction model based on a simple diffusion model confirms the possibility of predicting news feed events based on their text description, vectorization and finding the cosine of the angle between this vector and centroids of various information clusters. A change in this cosine over time can be thought of as a point wandering along the segment [0, 1], which includes a trap that the wandering point can eventually fall into. The result of modeling the time dependence of the event probability with experimentally identified sets of model parameters is not contradictory from the point of view of probabilistic behavior (among other things, with big times, probabilities asymptotically tend to 1). Estimates of the accuracy and reliability of news forecasting suggest that the developed model can be used for forecasting, and the relative accuracy of forecasting can be higher than 70%.
In [
14], using the example of a financial time series, the authors show the possibility of obtaining important ubiquitous physical characteristics when taking into account the aggregation of multiple systems. They also discuss the possibility of obtaining not only an abnormal diffusion process, but also a nonlinear diffusion equation, which leads to a probability distribution with the use of a set of non-Markovian processes. This probability distribution demonstrates a behavior in the structure of its tails in accordance with the power law. It also reflects the abnormal transport characteristics of the particle ensemble. This ubiquitous behavior, with the power law in diffusion transport and the structure of the probability distribution, is associated with the rapid fluctuation phenomenon represented in the noise parameter.
A description of some of the modern methods for analyzing the time series of the dynamics of processes in social, economic and sociotechnical systems can be found in the review [
15].
3. Selection of Data Sources and Collection of Statistics about User Activity on News Resources
To collect data and carry out research, we chose the website of “Echo of Moscow”, a Russian radio station (the Board of “Echo of Moscow”, CJSC adopted a resolution of 3 March 2022 to liquidate the radio channel and the relevant electronic periodical “Echo of Moscow”), the news resource “RIA Novosti”, and the “VKontakte” social media community related to news discussion (
https://vk.com/ria, accessed on 10 May 2022).
The news portal of ”Echo of Moscow” was chosen for the following reasons: it was among the top ten news websites in Russia and in July 2021 it ranked ninth (by number of visitors) and seventh (by user activity). Additionally, at the end of July 2021, it was in the top eight most cited radio stations and ranked first (by hyperlinks on social media) at the end of August 2021 and fourth (by citation index).
Using specially designed software applications (parsers) and a network API (
https://dev.vk.com/guide, accessed on 10 May 2022), we downloaded news from the ”VKontakte” site in the period of time from 1 January 2019 to April 2022. Inside the social media, each post has its own unique address
https://vk.com/ria?w=wall{owner_id}_{post_id} (accessed on 10 May 2022), where {owner_id} is a unique community identifier; in the case of ”RIA Novosti”, it is “-15755094”, and {post_id} is a unique post (news) identifier. In addition, each post (news) has a number of parameters such as: text, date and time of publication, and number of views and user comments. The comments have the following parameters: unique ID on the social media, unique user ID, text, date and time of publication, comment hierarchy level, and relation with parental comment on the level of commenting (who of the users commented, when discussing news, and whom of the other users).
The website of the ”Echo of Moscow” radio station distributed news by date; each individual date was available using the link (
https://echo.msk.ru/news/{year}/{month}/{day}/”, accessed on 20 February 2022). Each news article had a number of parameters such as: text, unique news number on the website, title, page address (URL), metadata (date and time of publication, number of views and comments), user comments (unique comment number, unique user number, comment date and time, comment hierarchy level, relation with parental comment on the level of commenting) and available information about commentators (i.e., unique user number on the website, city, occupation, place of work, name or nickname, sign-up date, number of recommendations and views of the user profile, total number of comments for the observed period, etc.). On average, the number of news articles varied from 160 to 190 per day. When collecting the data, we also downloaded information on interactions between users commenting on the articles discussing the news. We downloaded data from the website of the Russian radio station ”Echo of Moscow” for the past 10 years. For example, the total number of news articles published on ”Echo of Moscow” in 2020 was 65,560, with 196,609,650 views and 564,764 comments.
Since comments can be left by chat bots, spammers and unscrupulous users who write comments on a professional basis, it was necessary to introduce data cleaning rules. Those who wrote more than 7365 comments (on average more than 20 per day) or wrote them with a frequency of more than 1 comment in 5 min were classified as unscrupulous users.
Based on the data obtained, we created a news archive database that we used for analysis and modeling.
Figure 1 shows an example of a time series of daily user activity on the ”RIA Novosti” website for commenting on news from January 2013 until December 2020. The activity was defined as the ratio of the total number of unique comments left by users to all news within one day to the total number of unique views of all published news during one day.
4. Data Processing and Analysis of Observed Time Series—Objective Setting
Preliminary research and analysis of the time series dynamics and identification of their characteristics can be implemented using the rescaled Hurst range method [
16], which helps to determine their fractal dimensionality and classify their behavior. It is possible to rescale the range of values of the
R series levels with a standard deviation of the values of the
S series levels and present their relation (rescaled range) as the equation:
R/S =
CτH, where
C stands for a certain constant,
τ stands for the number of observations (series levels) that make up the time series (TS) in question, and
H is the Hurst exponent. The presence of fractures in the
R/S (
τ) dependence suggests that there are characteristic time scales and frequencies. The value
H makes it possible to classify the time series by their behavior.
Using the standard algorithm of the Hurst technique [
16] to determine the dependence of the
R/S logarithm on the sample logarithm for the time series level of user activity on the ”RIA Novosti” website, such as commenting on news articles (see
Figure 2, line 1), the following linear equation can be obtained:
y = 0.25
x − 1.12 with the correlation coefficient R
2 = 0.99.
In this case, H = 0.25 and, therefore, the observed time series, is non-persistent (ergodic). Since the value of the Hurst exponent is significantly different from 0.5, this means that the structure of this series is fractal, and the processes it describes have a short-term memory.
For the time series level of user activity, such as commenting, on the ”Echo of Moscow” website, where the R/S logarithm is dependent on the logarithm of sample size (see
Figure 2, line 2), the following linear equation can be obtained:
y = 0.18
x + 0.27 with the correlation coefficient R
2 = 0.89. In this case,
H = 0.18 and, therefore, the observed time series is also non-persistent (ergodic).
The significant difference between the Hurst exponent from the value equal to 0.5 suggests that the observed characteristics of the user activity time series under study should differ significantly from the normal distribution law. However, this requires an additional check.
To further process the observed data and identify the properties of the probability density functions for user activity on online news resources (this is necessary to analyze the characteristics and dynamics of the observed processes), the following algorithm can be used:
First, we can set the size of the sliding window (i.e., the time interval between the observed values of user activity on online resources), e.g., one day, two days, three days, etc., and from the time series select activity-related data for a given time range (a sliding window size).
Furthermore, using the selected data, we can calculate amplitudes of changes in user activity on the online news resources for various selected time intervals (sliding window sizes). These data are presented in
Figure 3.
We should then sort the sets of values obtained for each of the measured intervals in ascending order (i.e., from negative to positive) and plot amplitude histograms for online news resources user activity deviations for each sliding window size.
Based on the histograms, we can calculate distribution moments (mathematical expectation, dispersion, asymmetry, and excess) for the intervals selected for calculating amplitudes of online resources user activity deviations (sliding window sizes). Mathematical expectation, dispersion, asymmetry and excess can be calculated using the following formulas:
where
calculated by the number of amplitudes
.
- 5.
We can then build dependences for mathematical expectation (see
Figure 4) and dispersion (see
Figure 5) of amplitudes of online resources user activity deviations on the calculated time intervals (sliding window sizes).
The histograms and the dependence of mathematical expectation, dispersion, asymmetry (the third distribution moment) and excess (the fourth distribution moment) of the amplitudes of online resources user activity deviations on the calculated time intervals (sliding window sizes) allow us to determine whether the time series under study are non-stationary and to use the observed characteristics in order to model their evolution, which is necessary to predict their dynamics.
Let us analyze the observed data.
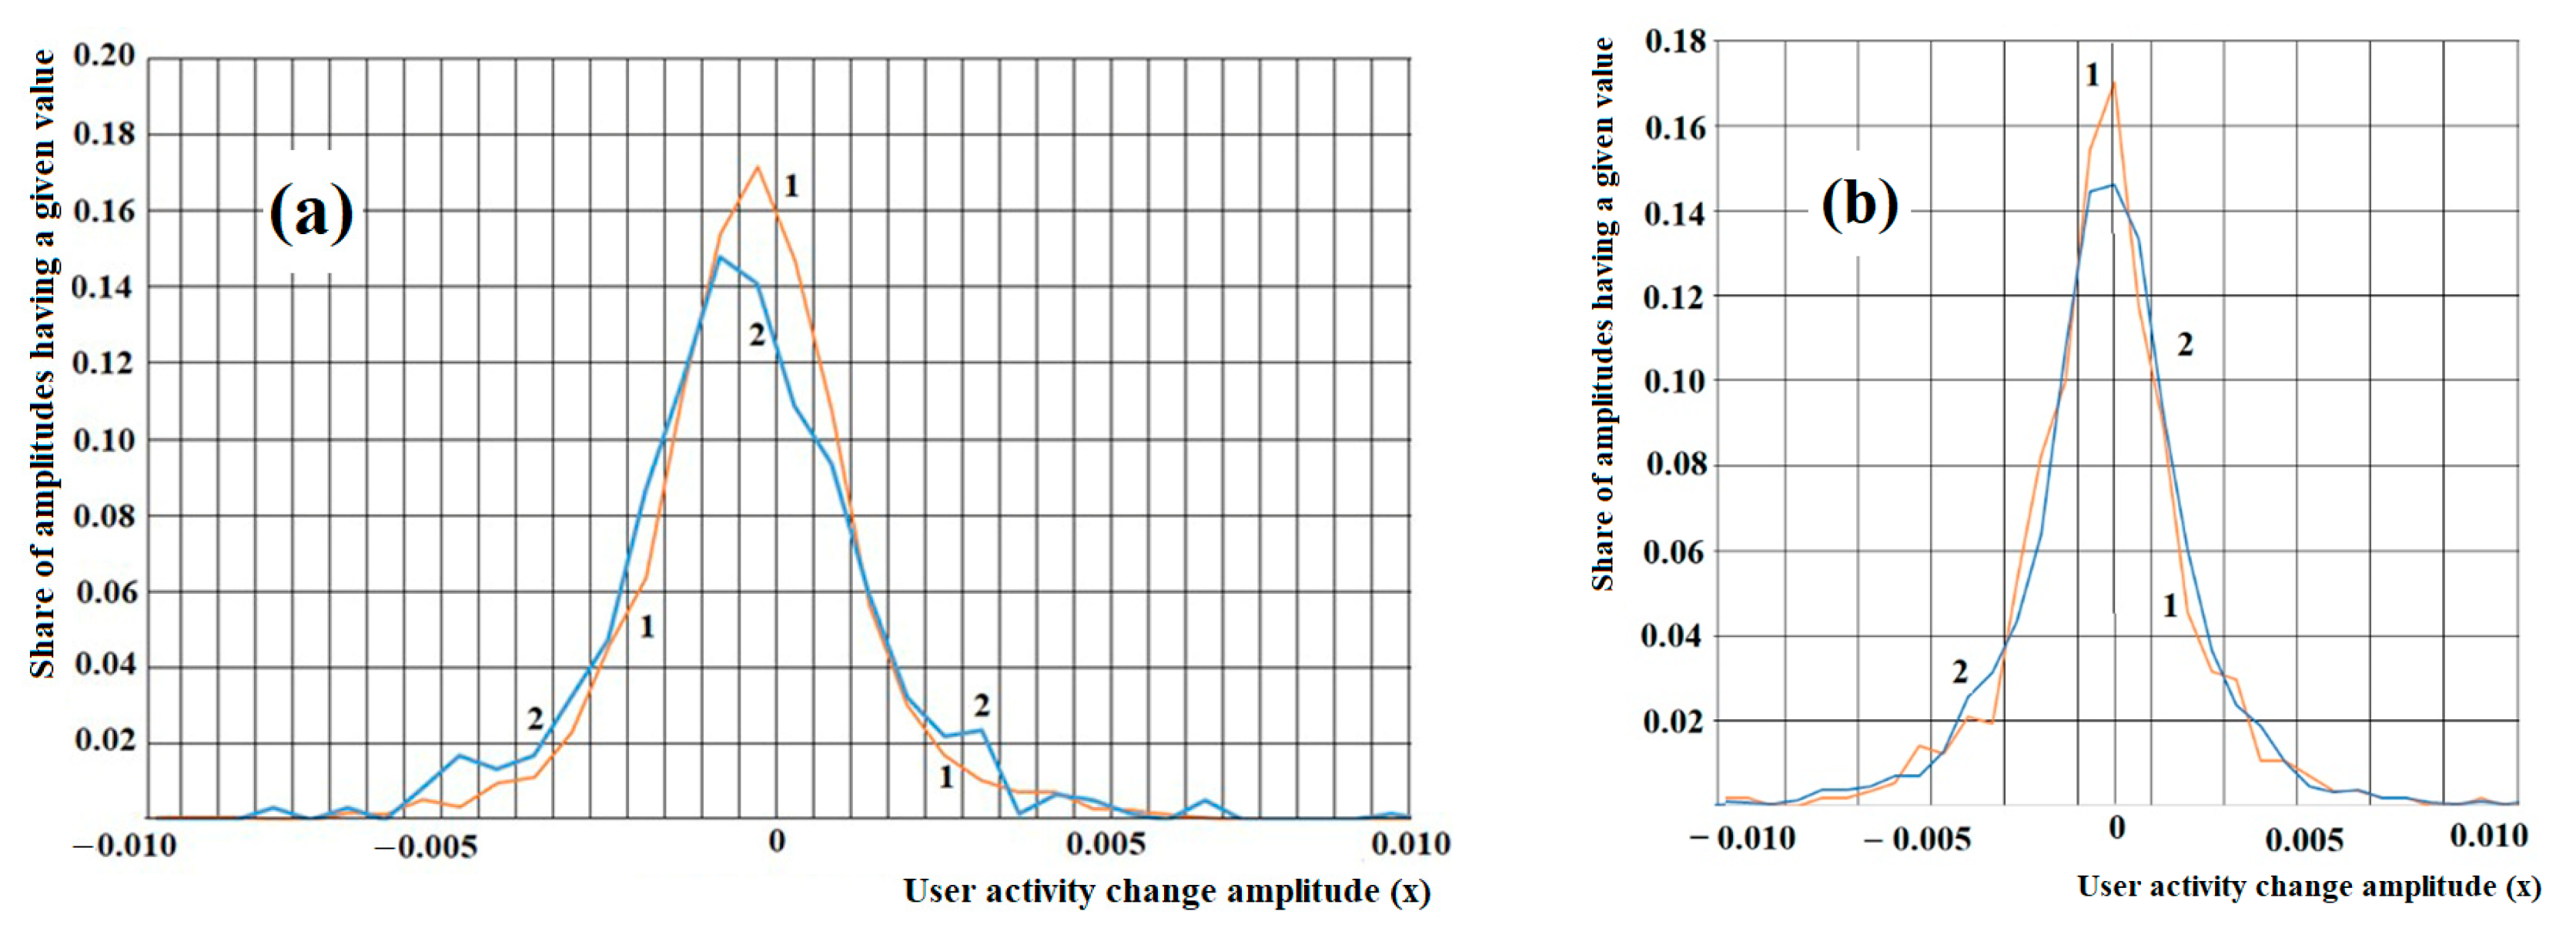
Figure 3 shows amplitude histograms for relevant values for amplitudes of ”RIA Novosti” and ”Echo of Moscow” user activity changes when commenting on news articles with a sliding window of 1 day (a) and 20 days (b). As can be seen in
Figure 3, the amplitude distributions have sharp peaks with heights that practically do not depend on the amplitude calculation time interval (sliding window size).
With an increase in the calculation time interval of amplitudes of online resources user activity deviations (the sliding window size), the histograms increase slightly in width; however, their heights and positions relative to zero remain almost constant (no shift is observed), which would be ordinary if these distributions were stationary. In this case, we would have a zero or constant mathematical expectation.
However, data processing revealed that the mathematical expectations of user news commenting activity change amplitudes are dependent on the time interval (sliding window) used to calculate these amplitudes, which indicates that the time series under study are non-stationary, and their parameters cannot be described with the normal distribution law (see
Figure 4). For example, if the amplitude value is
x, and the calculation interval is
t (the sliding window value), then the normal distribution law is
the value of mathematical expectation
μ(
t) will be zero:
where
is a numerical coefficient (constant value) characterizing the properties of the process under consideration.
In addition, data processing revealed that the change in the amplitude of users commenting on news articles is complex and non-linearly related to the amplitude calculation interval (sliding window) (see
Figure 5). The dispersion
2 (
t) was calculated as an average value of the square-amplitude. With the normal distribution law, there would be a linear dependence on the sliding window size for the amplitude dispersion, as follows:
The deviation from the linear law in this case also suggests that the observed time series are non-stationary.
When calculating asymmetry ( is the third moment) and excess ( is the fourth moment) of the change in user activity amplitude distribution for the observed data, it was difficult to distinguish any specific dependence on the calculation time interval (sliding window). Therefore, one can assume that they do not depend on the calculation time interval.
To confirm that they do not depend on the time interval, it is necessary to study the behavior of the remainder (deviation of the observed value from the average) and verify the hypothesis that they are normally distributed with an average equal to zero and have homogeneous dispersion. For the ”RIA Novosti” asymmetry, the average value is −0.17; for the ”Echo of Moscow” asymmetry, the average value is +0.046, for the ”RIA Novosti” excess, it is 3.14; and for the ”Echo of Moscow” excess, it is 5.16. The calculated mathematical expectation for the ”RIA Novosti” remainder distribution in the study of asymmetry equals to zero, with dispersion being equal to 0.01; asymmetry is almost zero; and excess is 0.0002. For the ”RIA Novosti” excess, the study of the remainder gives the following values: mathematical expectation is zero, dispersion is 0.15, asymmetry is 0.06, and excess is 0.11. The calculated mathematical expectation for the ”Echo of Moscow” remainder distribution, in the study of asymmetry, equals to zero, with dispersion being equal to 0.04; asymmetry being almost zero; and excess being 0.005. For the ”Echo of Moscow” excess, the study of the remainder gives the following values: mathematical expectation is zero, dispersion is 0.81, asymmetry is 0.017, and excess is 1.48. Therefore, based on the data obtained, it is possible to adopt the hypothesis that asymmetry and excess of change in user activity amplitude distribution almost do not depend on the amplitude calculation interval.
Asymmetry characterizes a shift in the distribution function, and, for symmetrical functions (e.g., the Poisson distribution), it is equal to 0. In this case, there is a little asymmetry value and the amplitude distribution is almost symmetrical.
The excess characterizes the distribution’s tail. With large positive excess values, the distribution function decreases slower when it moves from the average than in case of small values. For a normal distribution, the excess is equal to 3. With an excess value of more than 3, the probability plot will lie above the normal probability plot, and if it is less than 3, the probability plot will lie below the normal probability plot. In the above cases, there is a heavy tail: the probability plots will lie above the normal probability plot.
Processing and analyzing the observed data allows us to draw some conclusions:
The time series describing the discussed processes are non-stationary (the mathematical expectation and dispersion of the user news commenting activity change amplitude, in a complicated way, depends on the amplitude calculation interval (sliding window)).
The analysis of the observed non-stationary time series shows that the processes and systems they describe have a short-term memory (the Hurst exponent is significantly less than 0.5).
In the distribution of the user news commenting activity change amplitudes, asymmetry has a little value and the amplitude distribution is almost symmetrical.
In the distribution of the user news commenting activity change amplitudes, there is a heavy tail: the probability plots will lie above the normal probability plot, and, therefore, these processes cannot be described by this law.
When modeling dynamics of the processes in question and forecasting how the relevant time series may evolve, it is necessary to search for other approaches and models that would fully take into account their described properties.
Therefore, a model of approximating density functions for the parameters of non-stationary time series should take into account all of the above.
To create a model that will fully take into account the identified characteristics of the observed time series, it is necessary to discuss their fractality properties. The significant difference in the relevant Hurst exponents from 0.5 indicates that the processes or systems they describe have memory and that their structure is fractal [
17]. Fractality may be due to the fact that the observed processes are characterized by fractional variables. Accordingly, it can be assumed that this should be taken into account when deriving approximating density functions for their parameters.
The normal distribution law
can be obtained from the study of changes in the state
x of a system, in which these states can randomly change over time on an infinite set (e.g., the value of deviation amplitudes, depending on the chosen amplitude calculation interval). Such processes are usually normal diffusion-type processes and they are described by a differential equation of the following type:
In this case, for dispersion
, we will observe a linear law of its dependence on time (
). However, in some cases [
18,
19,
20,
21,
22], there is a significant deviation from the linear law. In this case, there can be a “slower” growth
from
t (
, where 0 <
β < 1), and such a process is qualified as a sub-diffusion [
18,
19], and a “quicker” growth
from
t (
, where 1 <
β < 2), and such a process is qualified as a super-diffusion [
20]. The distribution function describing sub-diffusive processes is derived from a fractional differential equation of the following type:
while the distribution function describing super-diffusive processes is derived from the equation:
where
α and
β are fractional derivative exponents, and
D stands for some coefficient (diffusion coefficient). There may also be processes of abnormal diffusion [
21] described by the general fractional differential equation (with Caputo derivatives):
It should be emphasized that in these cases, fractality can be considered both for variable t (time) and for variable x, which is viewed as a spatial coordinate in diffusion processes; however, in the general case, variable x can be thought to be as a parameter describing the state of a process or system (e.g., in our case, as the value of the user news commenting activity change amplitude).
The fractional nature of operators for time variables
t and state variable
x allows describing non-local processes, where transition to this state of a system (or process)
x depends not only on the local characteristics of the process or the system behavior in the vicinity of point
x under consideration but also on values
x accepted by it in the entire range of values under study, i.e., it depends globally on the distribution over all states
x and on the process history (memory). Fractional-order equations, both by time and a coordinate, can be used to account for memory effects. The effects of nonlocality by time
t and nonlocality by state
x on the probability density of finding a system or a process in state
x are qualitatively different. Nonlocality by time affects the probability density at the initial time, whereas nonlocality by
x affects the asymptotic behavior of the probability density over long time intervals [
18,
19,
20,
21,
22].
The increasing prevalence of models involving the mathematical apparatus of fractional derivatives should be noted. In particular, they are used in modeling the operation of neural networks. In this regard, we can mention, for example, the papers [
23,
24].
The article in [
23] describes a neural network with bidirectional fractional-order associative memory with octonion values (FOOVBAMNN). For FOOVBAMNN, the suggested models have general activation functions and special higher-dimensional linear threshold functions. The octonion multiplication operation, which is essentially neither commutative nor associative, uses the Cayley-Dickson construction, and the FOOVBAMNN system is divided into four complex-valued fractional-order systems with Caputo derivatives. To solve the global Mittag-Leffler synchronization problem, FOOVBAMNN uses related inequalities and construction of linear feedback controllers.
The article in [
24] analyzes the unified criteria of global dissipativity and stability of multidimensional memristive neural networks (FSMVMNN) for fractional-order systems with delay. Using the mathematical apparatus of multidimensional algebra, fractional derivatives, and non-smooth analysis, a FSMVMNN model was created in [
24] to suggest a more unified method for analyzing the dynamic behavior of multidimensional neural networks. The advantages of the method developed include the use of fewer calculations to obtain the required results.
6. Conclusions
This research has explored user activity for commenting on news articles on online media outlets. Based on the collected data, we have built user activity time series and, using the Hurst rescaled range (R/S analysis), have studied their dynamics and identified their characteristics, such as fractal dimension and type of behavior.
Studies have shown that the observed time series have a Hurst exponent significantly less than 0.5, which indicates their non-persistence (ergodicity); in addition, the structures of these time series are fractal, and the processes that they describe can have a short-term memory.
The statistical processing of the observed data made it possible to determine the observed functions for the distribution of user activity deviation amplitudes with different time intervals for calculating these amplitudes, as well as the dependence of mathematical expectation, dispersion, excess, and asymmetry on the amplitude calculation interval.
Data processing revealed that the mathematical expectations of the changes in user activity amplitudes depend on the calculated time interval (sliding window), which indicates that the time series under study are non-stationary and their parameters cannot be described with the normal distribution law.
In addition, the dependences of users’ news commenting activity change amplitude dispersion on the amplitude calculation interval (sliding window) are complex and non-linear, which also proves the non-stationary character.
Asymmetry characterizes a shift in the distribution function, and, for symmetrical functions (e.g., the Poisson distribution), it is equal to 0.
For the time series under study, there is a little value of asymmetry of the functions for the distribution of series level deviation amplitudes, and they are almost symmetrical. Asymmetry characterizes a shift in the distribution function, and, for symmetrical functions (e.g., the Poisson distribution), it is equal to 0.
In the above cases, there is a heavy tail; the probability plots will lie above the normal probability plot. This is represented by the excess value. For a normal distribution, the excess is equal to 3. With an excess value of more than 3, the probability plot will lie above the normal probability plot, and if it is less than 3, the probability plot will lie below the normal probability plot. For the time series under study, there are positive values of excess in the distribution of related levels of deviation amplitudes, which means that the distribution function decreases slower as it moves away from the average.
To create a model that will fully take into account the identified characteristics of the observed time series, it is necessary to discuss their fractality properties.
Fractality may be due to the fact that the observed processes are characterized by fractional variables. Therefore, it can be assumed that this should be taken into account when deriving approximating density functions for the distribution of their parameters, for example, using the abnormal diffusion equation:
where
α and
β stand for fractional derivative exponents, and
D is an exponent of some diffusion.
It should be emphasized that in these cases, fractality can be considered both for variable t (time) and for variable x, which is viewed as a spatial coordinate in diffusion processes; however, usually, variable x can be considered a parameter describing the state of a process or system (e.g., in our case, as the value of the user news commenting activity change amplitude).
This paper has discussed the possibility of modeling sociodynamic processes based on the use of the differential diffusion equation with fractional derivatives.
The analysis of the model and the comparison of the related theoretical results with the observed data have proved that this model corresponds to it reasonably well and that it is adequate.
The goal of future research is to model and analyze time series of sociodynamic processes using models that account of self-organization and the presence of memory in the system. In addition, models will also be used of stochastic fuzzy differential equations with both fuzzy coefficients and derivatives with respect to fuzzy variables, which will be the time and state variables of the levels of the time series.


