


FuseLGNet: Fusion of Local and Global Information for Detection of Parkinson’s Disease


Abstract
:1. Introduction
2. Related Work
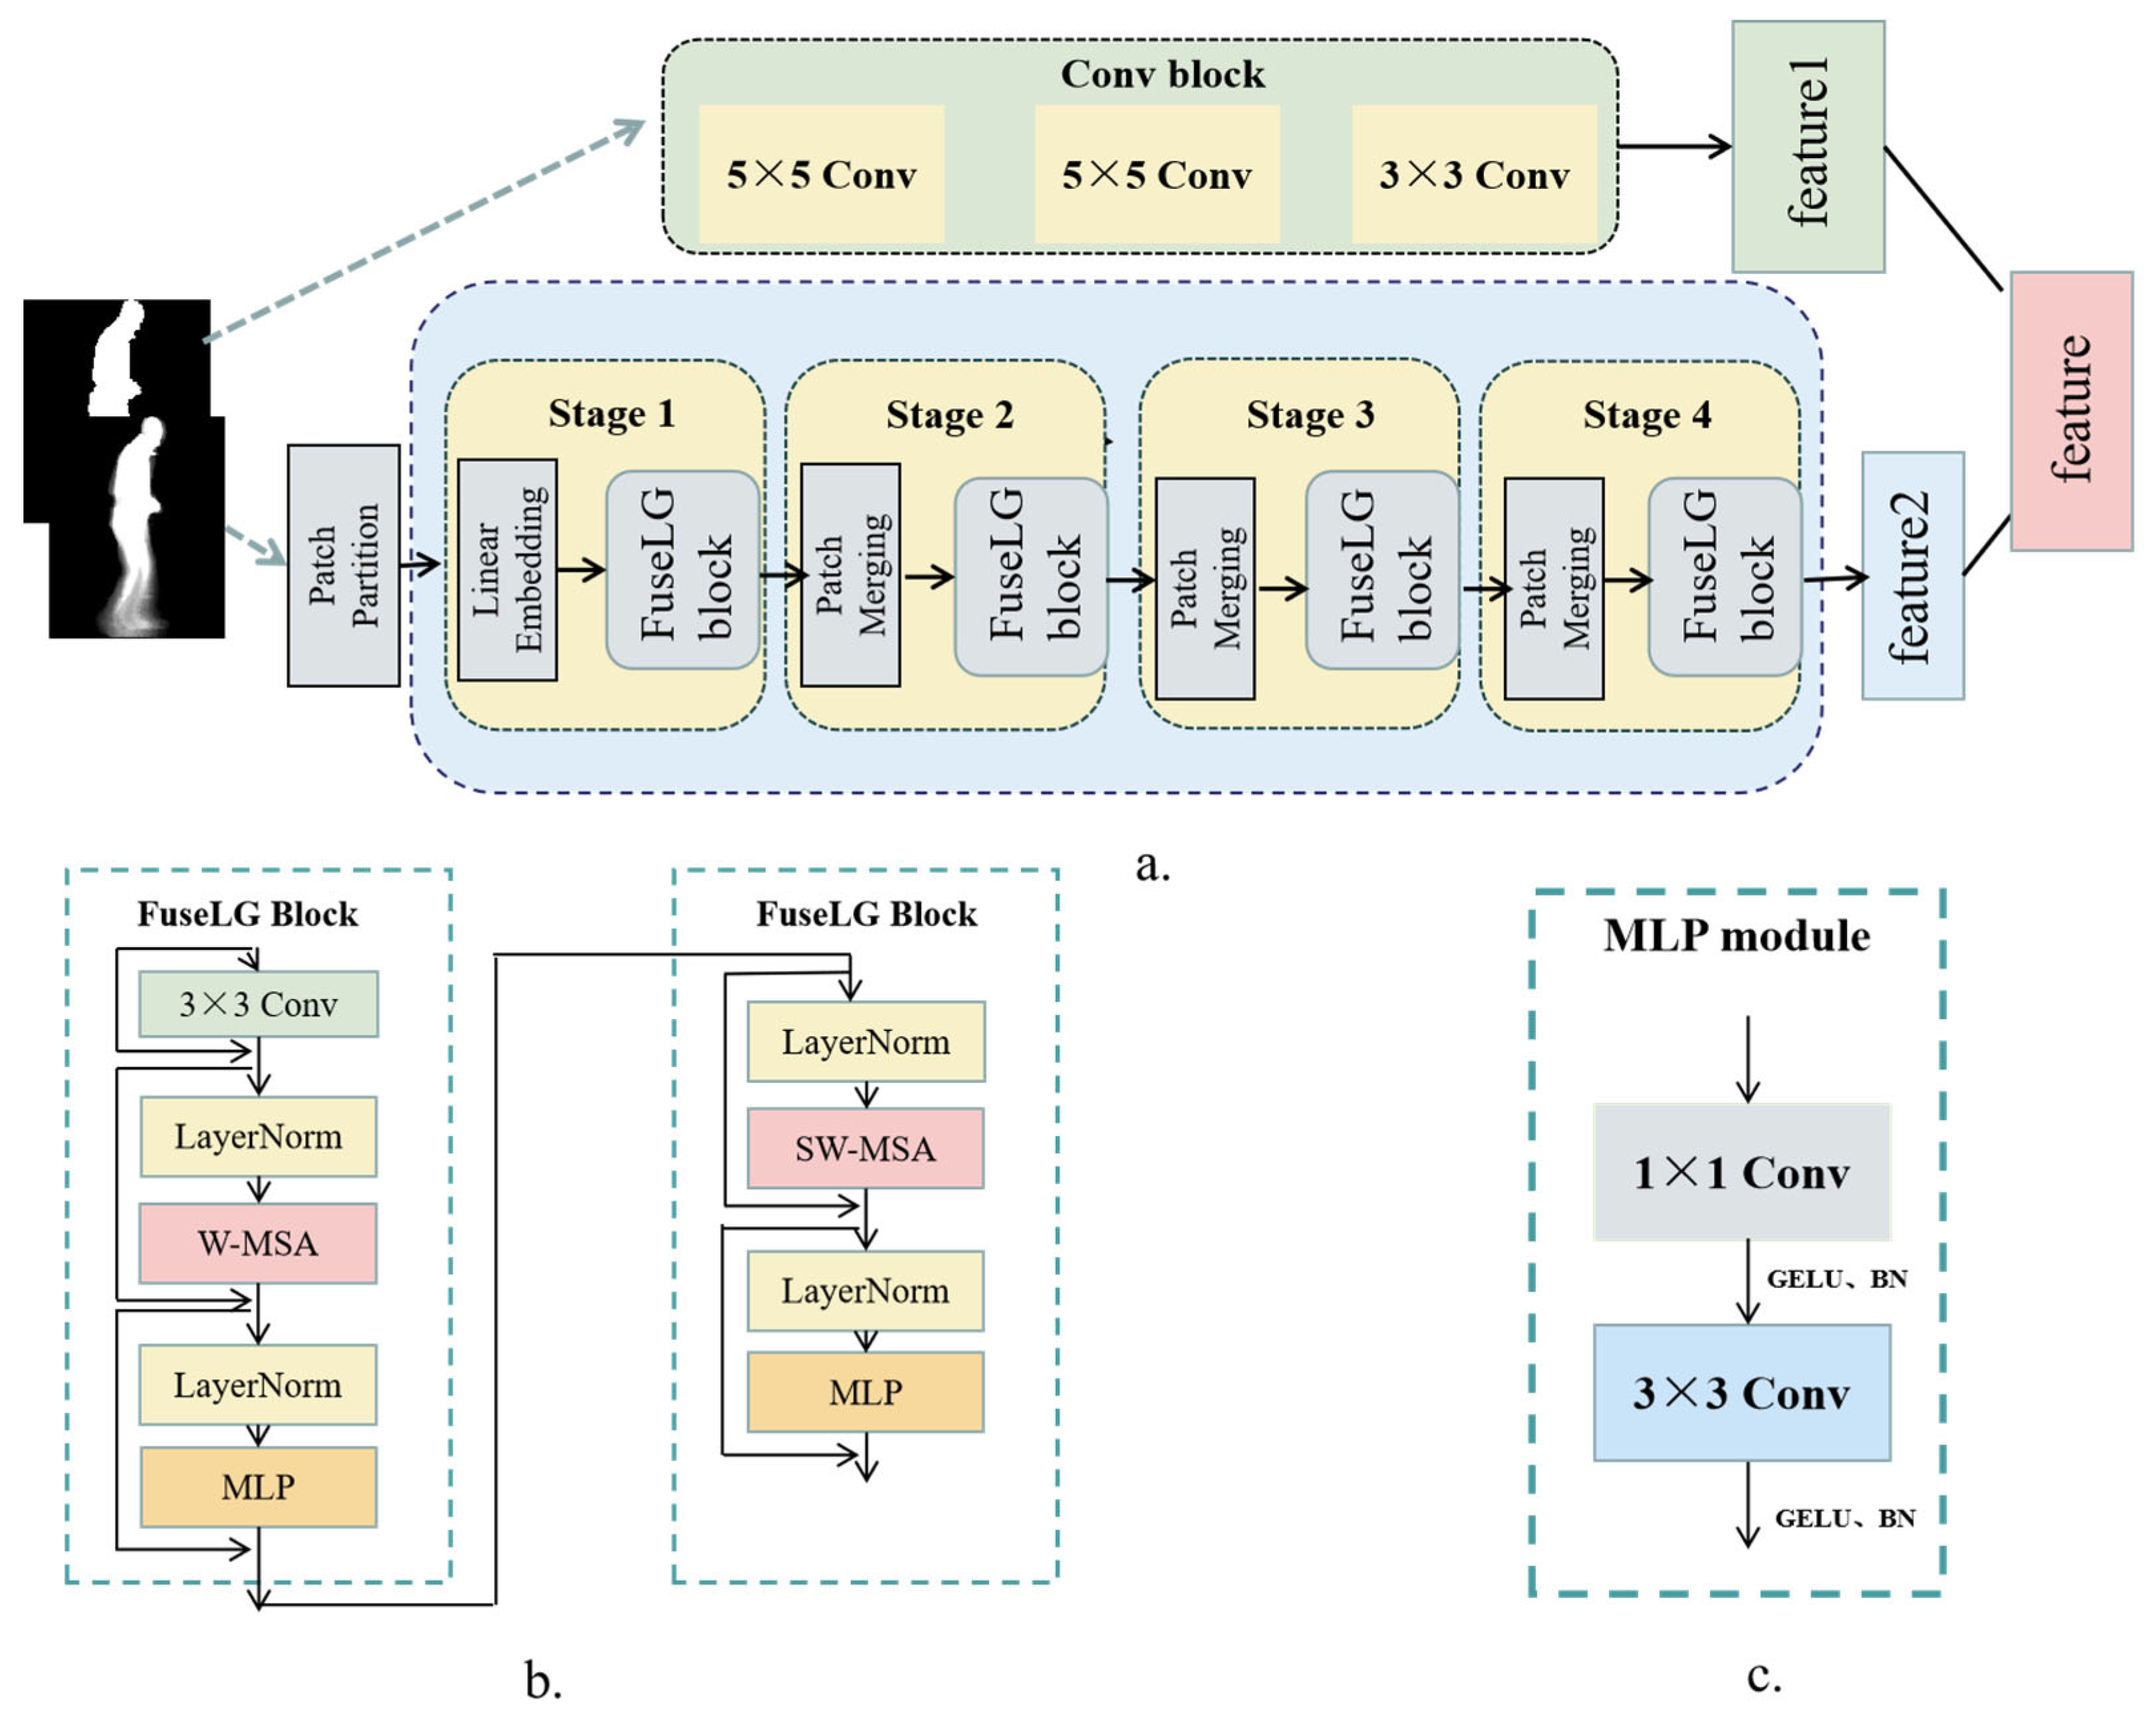
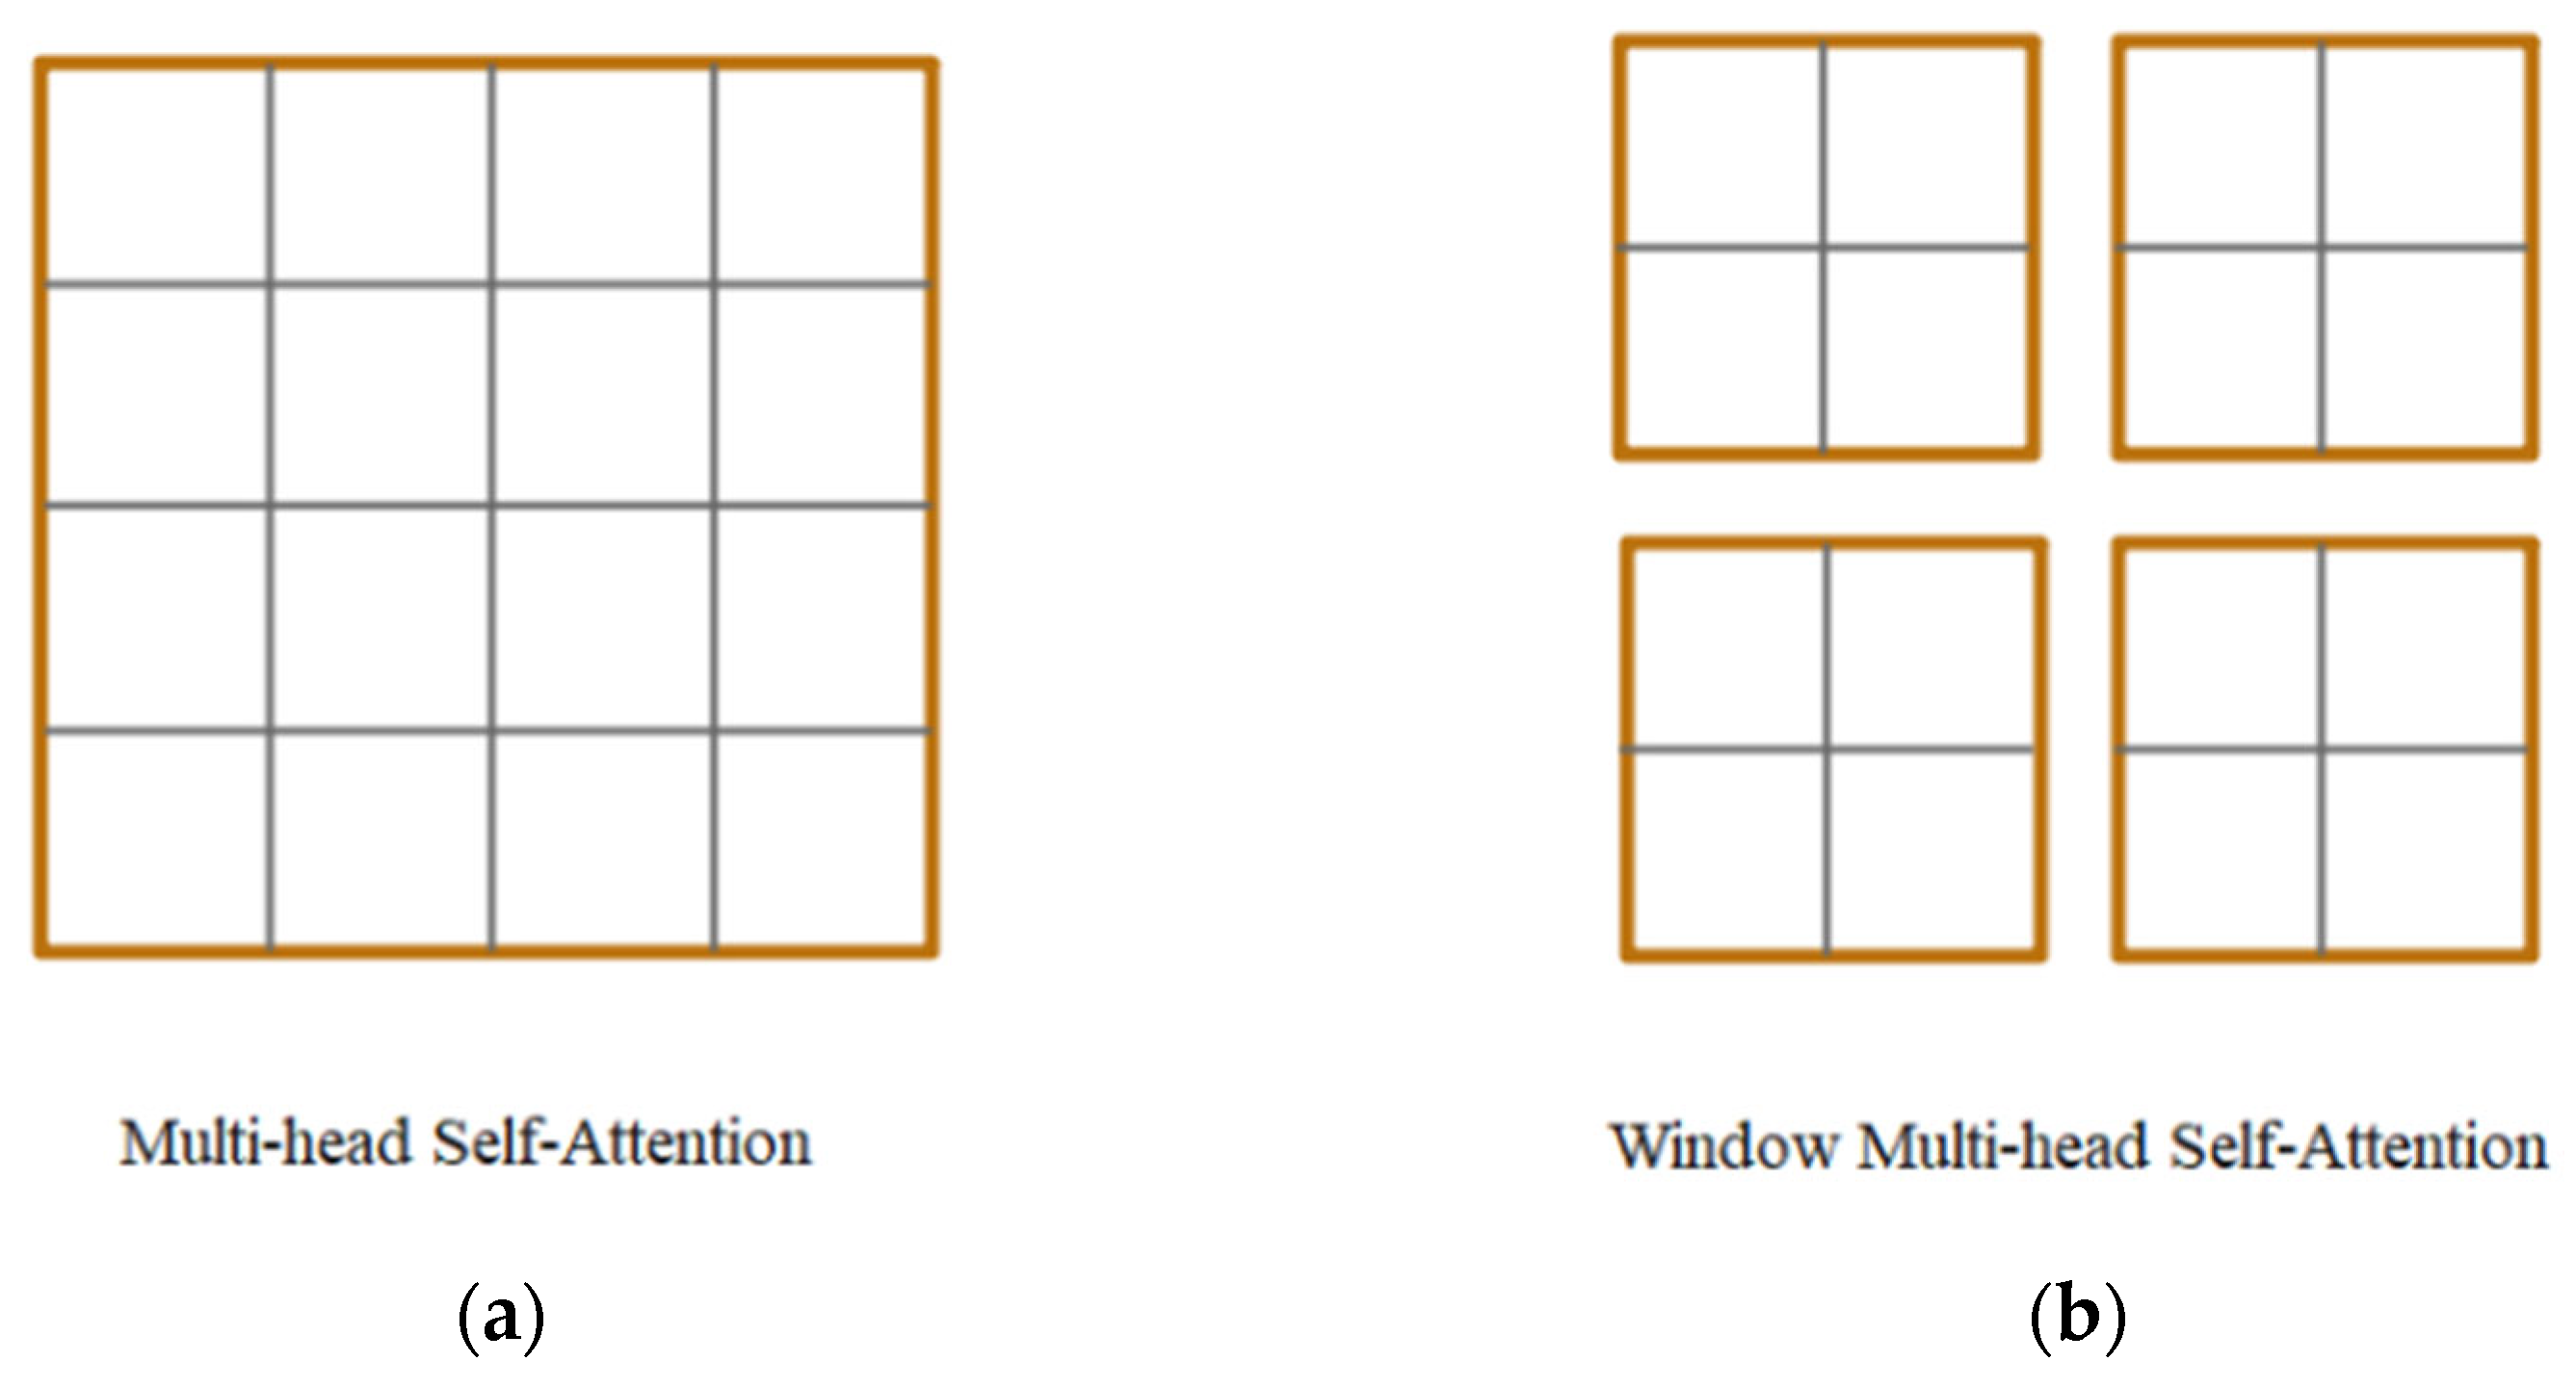
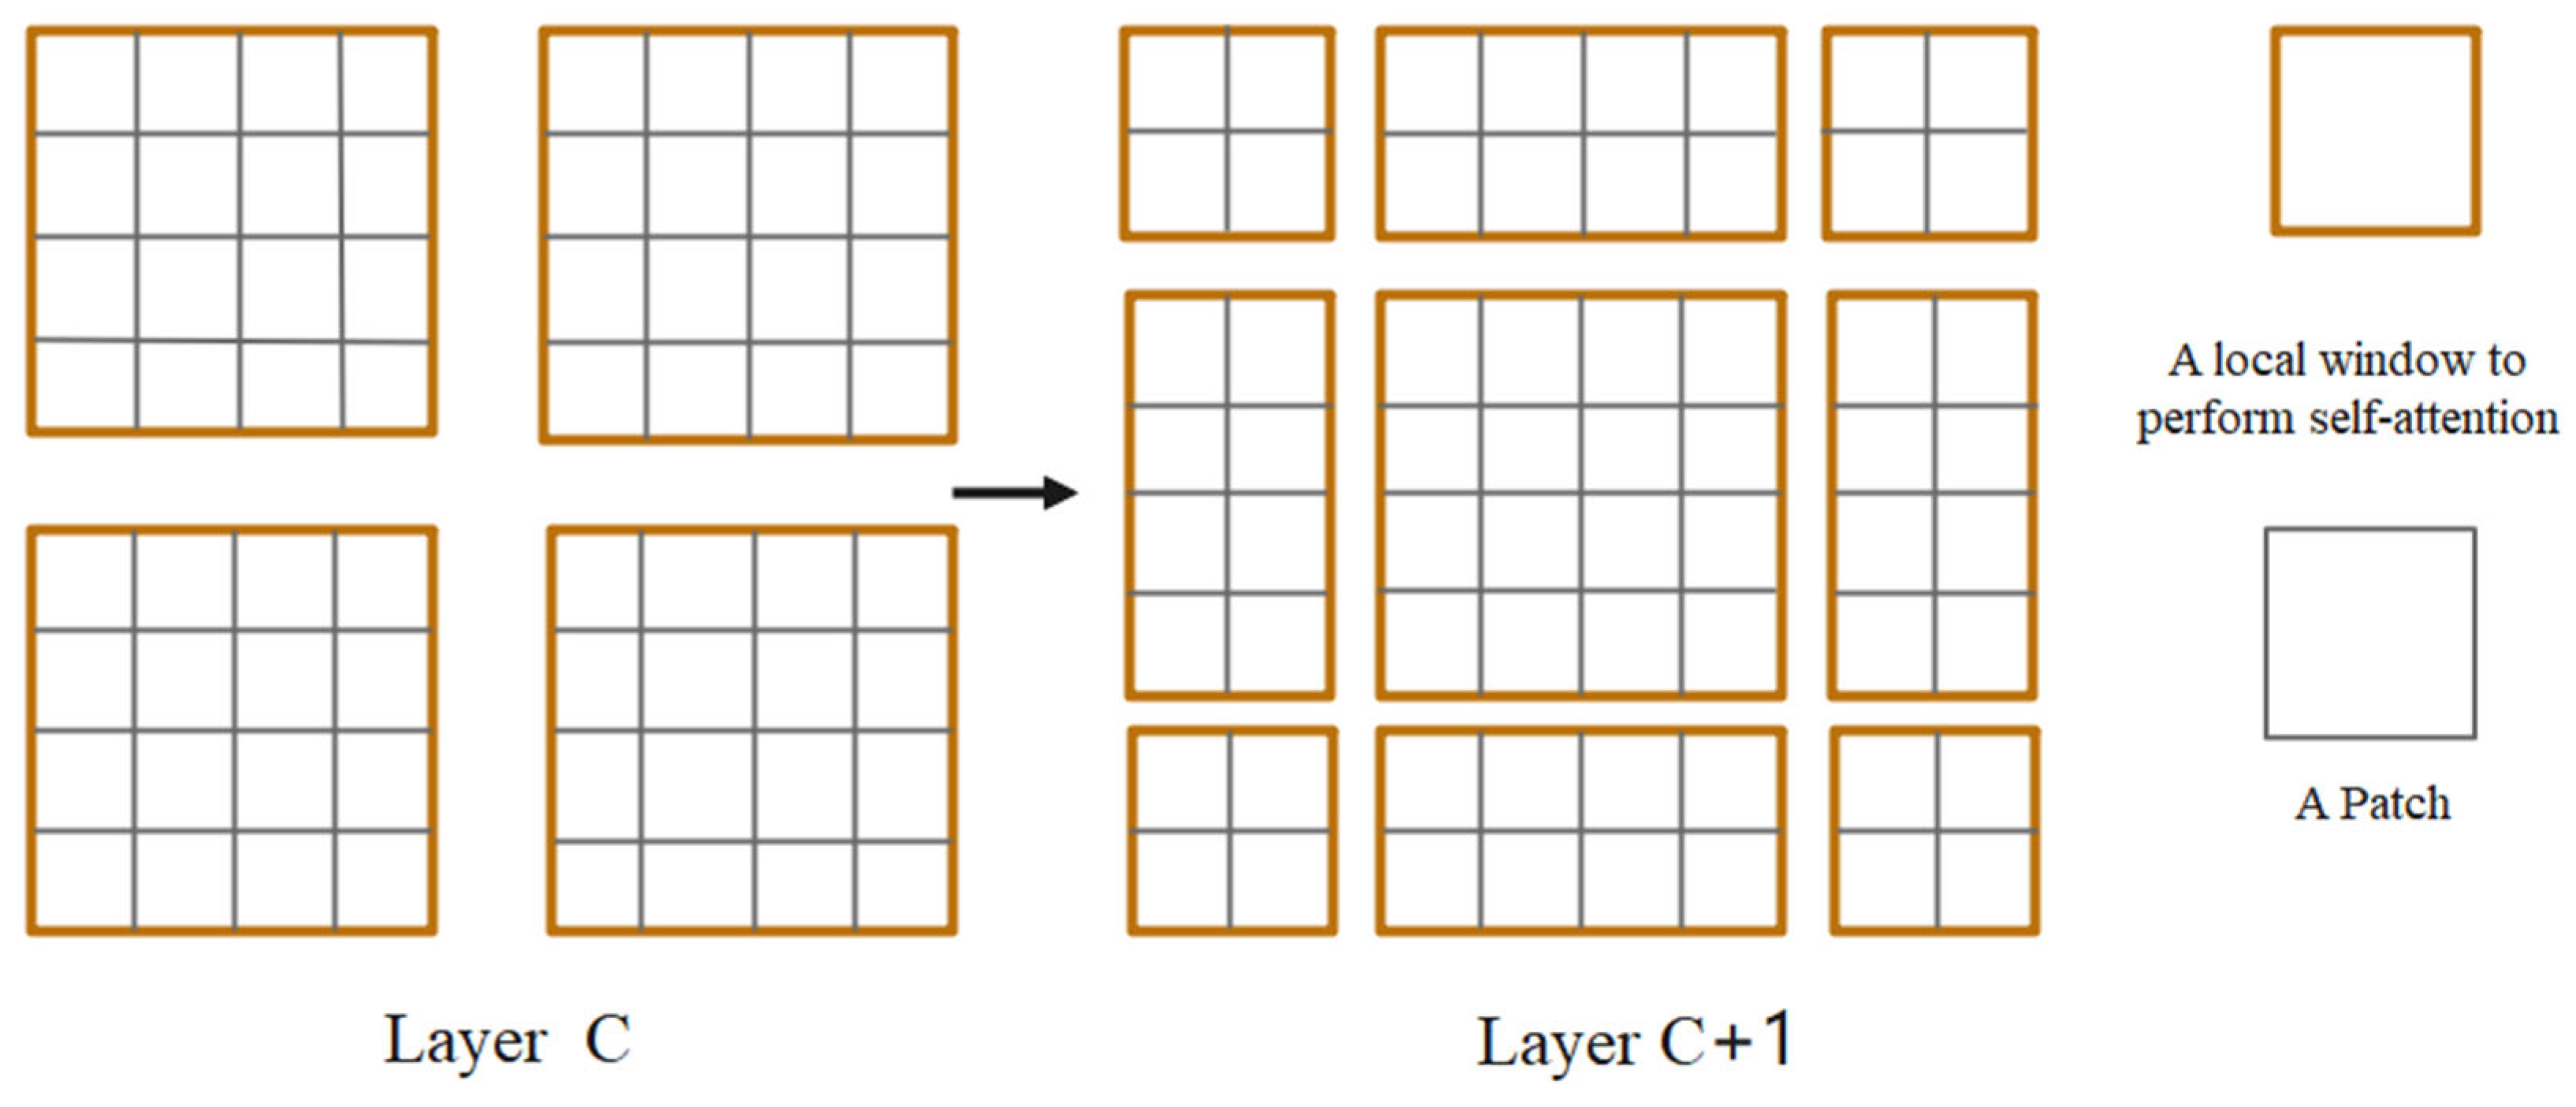
3. Method
- : query, , where and are the height and width of the input image, respectively.
- : key, , where is the dimension of the key.
- : value, , where is the dimension of the value.
- : the number of multiple outputs or categories of the neural network.
- : output vector; is the value of the output or category in , and represents the category to be calculated at that time.
4. Experiment
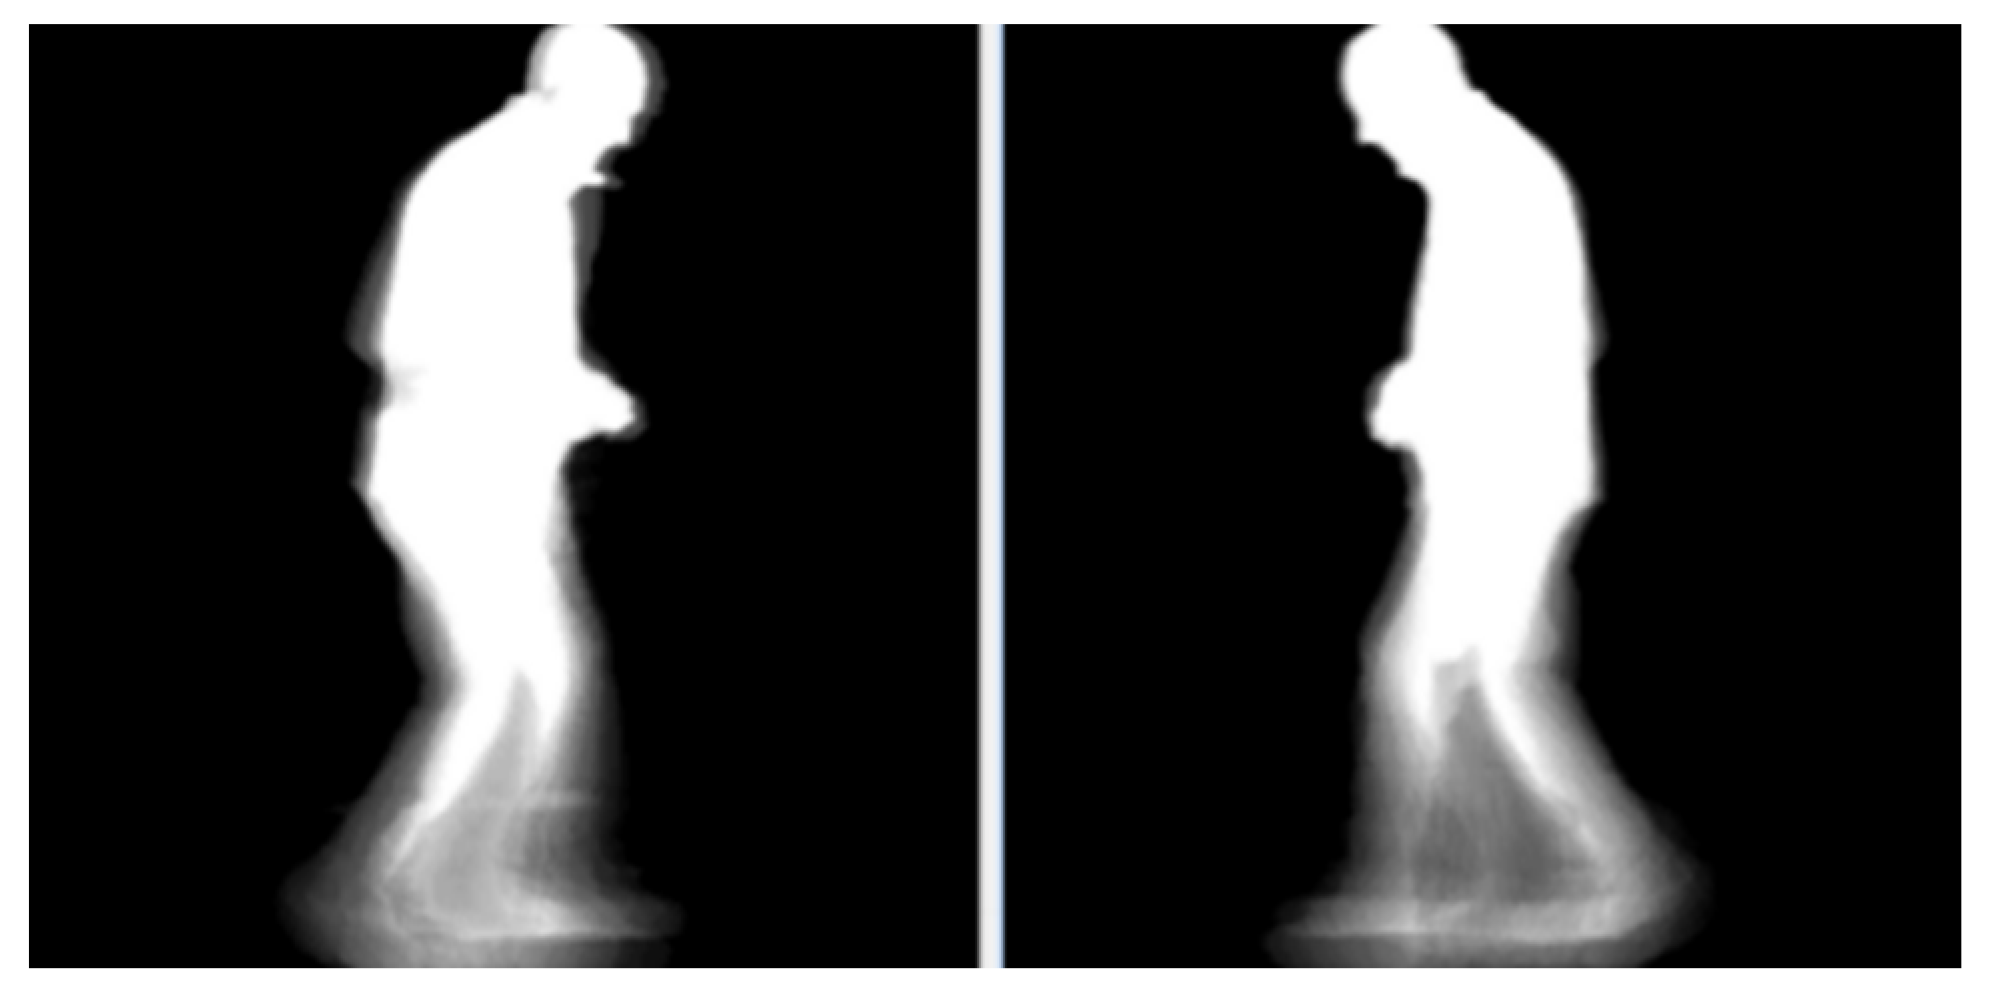
4.1. Dataset
4.2. Training Details
4.3. Experimental Results
5. Conclusions
Author Contributions
Funding
Data Availability Statement
Acknowledgments
Conflicts of Interest
References
- Camps, J.; Samà, A.; Martín, M.; Rodríguez-Martín, D.; Pérez-López, C.; Arostegui, J.M.M.; Cabestany, J.; Català, A.; Alcaine, S.; Mestre, B.; et al. Deep learning for freezing of gait detection in Parkinson’s disease patients in their homes using a waist-worn inertial measurement unit. Knowl. Based Syst. 2018, 139, 119–131. [Google Scholar] [CrossRef]
- Mileti, I.; Germanotta, M.; Alcaro, S.; Pacilli, A.; Imbimbo, I.; Petracca, M.; Erra, C.; Di Sipio, E.; Aprile, I.; Rossi, S.; et al. Gait partitioning methods in Parkinson’s disease patients with motor fluctuations: A comparative analysis. In Proceedings of the 2017 IEEE International Symposium on Medical Measurements and Applications (MeMeA), Rochester, MN, USA, 7–10 May 2017; pp. 402–407. [Google Scholar]
- Chen, M.; Huang, B.; Xu, Y. Intelligent shoes for abnormal gait detection. In Proceedings of the 2008 IEEE International Conference on Robotics and Automation, Pasadena, CA, USA, 19–23 May 2008; pp. 2019–2024. [Google Scholar]
- Nguyen, T.N.; Huynh, H.H.; Meunier, J. Skeleton-based abnormal gait detection. Sensors 2016, 16, 1792. [Google Scholar] [CrossRef] [PubMed]
- Agostini, V.; Balestra, G.; Knaflitz, M. Segmentation and classification of gait cycles. IEEE Trans. Neural Syst. Rehabil. Eng. 2013, 22, 946–952. [Google Scholar] [CrossRef] [PubMed]
- Morris, T.R.; Cho, C.; Dilda, V.; Shine, J.M.; Naismith, S.L.; Lewis, S.J.G.; Moore, S.T. Clinical assessment of freezing of gait in Parkinson’s disease from computer-generated animation. Gait Posture 2013, 38, 326–329. [Google Scholar] [CrossRef] [PubMed]
- Lv, Z.; Li, J.; Dong, C.; Li, H.; Xu, Z. Deep learning in the COVID-19 epidemic: A deep model for urban traffic revitalization index. Data Knowl. Eng. 2021, 135, 101912. [Google Scholar] [CrossRef] [PubMed]
- Xu, Z.; Lv, Z.; Li, J.; Sun, H.; Sheng, Z. A Novel Perspective on Travel Demand Prediction Considering Natural Environmental and Socioeconomic Factors. IEEE Intell. Transp. Syst. Mag. 2023, 15, 136–159. [Google Scholar] [CrossRef]
- Cheng, Z.; Jian, S.; Rashidi, T.H.; Maghrebi, M.; Waller, S.T. Integrating household travel survey and social media data to improve the quality of od matrix: A comparative case study. IEEE Trans. Intell. Transp. Syst. 2020, 21, 2628–2636. [Google Scholar] [CrossRef]
- Zhao, A.; Wu, H.; Chen, M.; Wang, N. DCACorrCapsNet: A deep channel-attention correlative capsule network for COVID-19 detection based on multi-source medical images. IET Image Process. 2022, 53, 126378. [Google Scholar] [CrossRef]
- Cai, N.; Feng, S.; Gui, Q.; Zhao, L.; Pan, H.; Yin, J.; Lin, B. Hybrid silhouette-skeleton body representation for gait recognition. In Proceedings of the 2021 13th International Conference on Intelligent Human-Machine Systems and Cybernetics (IHMSC), Hangzhou, China, 21–22 August 2021; pp. 216–220. [Google Scholar]
- Krizhevsky, A.; Sutskever, I.; Hinton, G.E. ImageNet classification with deep convolutional neural networks. Commun. ACM 2017, 60, 84–90. [Google Scholar] [CrossRef]
- Vaswani, A.; Shazeer, N.; Parmar, N.; Uszkoreit, J.; Jones, L.; Gomez, A.N.; Kaiser, Ł.; Polosukhin, I. Attention is all you need. In Proceedings of the 31st International Conference on Neural Information Processing Systems (NIPS’17), Long Beach, CA, USA, 4–9 December 2017; Curran Associates Inc.: Red Hook, NY, USA, 2017; pp. 6000–6010. [Google Scholar]
- Zhang, Y.; Yan, W.; Yao, Y.; Ahmed, J.B.; Tan, Y.; Gu, D. Prediction of freezing of gait in patients with Parkinson’s disease by identifying impaired gait patterns. IEEE Trans. Neural Syst. Rehabil. Eng. 2020, 28, 591–600. [Google Scholar] [CrossRef]
- Borzì, L.; Mazzetta, I.; Zampogna, A.; Suppa, A.; Olmo, G.; Irrera, F. Prediction of Freezing of Gait in Parkinson’s Disease Using Wearables and Machine Learning. Sensors 2021, 21, 614. [Google Scholar] [CrossRef]
- Zhao, A.; Qi, L.; Li, J.; Dong, J.; Yu, H. A hybrid spatio-temporal model for detection and severity rating of Parkinson’s disease from gait data. Neurocomputing 2018, 315, 1–8. [Google Scholar] [CrossRef]
- Tong, S.; Fu, Y.; Yue, X.; Ling, H. Multi-View Gait Recognition Based on a Spatial-Temporal Deep Neural Network. IEEE Access 2018, 6, 57583–57596. [Google Scholar] [CrossRef]
- Li, H.; Lv, Z.; Li, J.; Xu, Z.; Yue, W.; Sun, H.; Sheng, Z. Traffic Flow Forecasting in the COVID-19, A Deep Spatial-Temporal Model Based on Discrete Wavelet Transformation. ACM Trans. Knowl. Discov. Data 2022. [Google Scholar] [CrossRef]
- Wang, Y.; Lv, Z.; Sheng, Z.; Sun, H.; Zhao, A. A deep spatio-temporal meta-learning model for urban traffic revitalization index prediction in the COVID-19 pandemic. Adv. Eng. Inform. 2022, 53, 101678. [Google Scholar] [CrossRef]
- Lv, Z.; Li, J.; Dong, C.; Xu, Z. DeepSTF: A Deep Spatial–Temporal Forecast Model of Taxi Flow. Comput. J. 2021, bxab178. [Google Scholar] [CrossRef]
- Cheng, Z.; Rashidi, T.H.; Jian, S.; Maghrebi, M.; Waller, S.T.; Dixit, V. A Spatio-Temporal autocorrelation model for designing a carshare system using historical heterogeneous Data: Policy suggestion. Transp. Res. Part C Emerg. Technol. 2022, 141, 103758. [Google Scholar] [CrossRef]
- Albuquerque, P.; Verlekar, T.T.; Correia, P.L.; Soares, L.D. A spatiotemporal deep learning approach for automatic pathological gait classification. Sensors 2021, 21, 6202. [Google Scholar] [CrossRef] [PubMed]
- Zhao, A.; Li, J.; Dong, J.; Qi, L.; Zhang, Q.; Li, N.; Wang, X.; Zhou, H. Multimodal Gait Recognition for Neurodegenerative Diseases. IEEE Trans Cybern. 2022, 52, 9439–9453. [Google Scholar] [CrossRef] [PubMed]
- Li, G.; Guo, L.; Zhang, R.; Qian, J.; Gao, S. TransGait: Multimodal-based gait recognition with set transformer. Appl. Intell. 2023, 53, 1535–1547. [Google Scholar] [CrossRef]
- Liang, Y.; Li, Y.; Guo, J.; Li, Y. Resource Competition in Blockchain Networks Under Cloud and Device Enabled Participation. IEEE Access 2022, 10, 11979–11993. [Google Scholar] [CrossRef]
- Xu, Z.; Lv, Z.; Li, J.; Shi, A. A Novel Approach for Predicting Water Demand with Complex Patterns Based on Ensemble Learning. Water Resour. Manag. 2022, 36, 4293–4312. [Google Scholar] [CrossRef]
- Zhao, A.; Wang, Y.; Li, J. Transferable Self-Supervised Instance Learning for Sleep Recognition. IEEE Trans. Multimed. 2022. [Google Scholar] [CrossRef]
- Wang, Y.; Zhao, A.; Li, J.; Lv, Z.; Dong, C.; Li, H. Multi-attribute Graph Convolution Network for Regional Traffic Flow Prediction. Neural Process. Lett. 2022. [Google Scholar] [CrossRef]
- Zhao, A.; Li, J. Two-channel lstm for severity rating of parkinson’s disease using 3d trajectory of hand motion. Multimed. Tools Appl. 2022, 81, 33851–33866. [Google Scholar] [CrossRef]
- El Maachi, I.; Bilodeau, G.A.; Bouachir, W. Deep 1D-Convnet for accurate Parkinson disease detection and severity prediction from gait. Expert Syst. Appl. 2020, 143, 113075. [Google Scholar] [CrossRef]
- Albuquerque, P.; Machado, J.P.; Verlekar, T.T.; Correia, P.L.; Soares, L.D. Remote Gait type classification system using markerless 2D video. Diagnostics 2021, 11, 1824. [Google Scholar] [CrossRef]
- Lv, Z.; Li, J.; Li, H.; Xu, Z.; Wang, Y. Blind travel prediction based on obstacle avoidance in indoor scene. Wirel. Commun. Mob. Comput. 2021, 2021, 5536386. [Google Scholar] [CrossRef]
- Lv, Z.; Li, J.; Dong, C.; Zhao, W. A deep spatial-temporal network for vehicle trajectory prediction. In Lecture Notes in Computer Science, Proceedings of the International Conference on Wireless Algorithms, Systems, and Applications, Qingdao, China, 13–15 September 2020; Springer: Cham, Switzerland, 2020; pp. 359–369. [Google Scholar]
- Lv, Z.; Li, J.; Xu, Z.; Wang, Y.; Li, H. Parallel computing of spatio-temporal model based on deep reinforcement learning. In Lecture Notes in Computer Science, Proceedings of the International Conference on Wireless Algorithms, Systems, and Applications, Nanjing, China, 25–27 June 2021; Springer: Cham, Switzerland, 2021; pp. 391–403. [Google Scholar]
- Loureiro, J.; Correia, P.L. Using a skeleton gait energy image for pathological gait classification. In Proceedings of the 2020 15th IEEE International Conference on Automatic Face and Gesture Recognition (FG 2020), Buenos Aires, Argentina, 16–20 November 2020; pp. 503–507. [Google Scholar]


| DataSet | Direction | Data Type | PD Patients | CO |
|---|---|---|---|---|
| GAIT-IST | front | GEI | 143 | 312 |
| Silhouettes | 3996 | 12,216 | ||
| back | GEI | 121 | 304 | |
| Silhouettes | 3471 | 11,767 | ||
| GAIT-IT | front | GEI | 330 | 998 |
| Silhouettes | 23,858 | 85,882 | ||
| back | GEI | 326 | 989 | |
| Silhouettes | 23,441 | 86,811 |
| KNN | Efficient-Net | EfficientNetV2 | ViT | ST | FuseLGNet | |
|---|---|---|---|---|---|---|
| front | 91% | 95.56% | 96.67% | 97.78% | 98.81% | 98.89% |
| back | 91% | 91.67% | 92.86% | 94.04% | 96.43% | 97.62% |
| KNN | Efficient-Net | EfficientNetV2 | ViT | ST | FuseLGNet | |
|---|---|---|---|---|---|---|
| front | 56% | 95.77% | 95.80% | 97.50% | 98.94% | 99.78% |
| back | 87% | 94.26% | 95.37% | 96.03% | 98.66% | 99.63% |
| KNN | Efficient-Net | EfficientNetV2 | ViT | ST | FuseLGNet | |
|---|---|---|---|---|---|---|
| front | 87% | 91.70% | 93.96% | 95.09% | 96.24% | 96.60% |
| back | 82% | 92.38% | 93.51% | 91.60% | 95.42% | 95.42% |
| Efficient-Net | EfficientNetV2 | ViT | ST | FuseLGNet | |
|---|---|---|---|---|---|
| front | 91.51% | 92.38% | 93.81% | 99.39% | 99.78% |
| back | 91.97% | 92.52% | 93.92% | 98.58% | 99.89% |
Disclaimer/Publisher’s Note: The statements, opinions and data contained in all publications are solely those of the individual author(s) and contributor(s) and not of MDPI and/or the editor(s). MDPI and/or the editor(s) disclaim responsibility for any injury to people or property resulting from any ideas, methods, instructions or products referred to in the content. |
© 2023 by the authors. Licensee MDPI, Basel, Switzerland. This article is an open access article distributed under the terms and conditions of the Creative Commons Attribution (CC BY) license (https://creativecommons.org/licenses/by/4.0/).
Share and Cite
Chen, M.; Ren, T.; Sun, P.; Wu, J.; Zhang, J.; Zhao, A. FuseLGNet: Fusion of Local and Global Information for Detection of Parkinson’s Disease. Information 2023, 14, 119. https://doi.org/10.3390/info14020119
Chen M, Ren T, Sun P, Wu J, Zhang J, Zhao A. FuseLGNet: Fusion of Local and Global Information for Detection of Parkinson’s Disease. Information. 2023; 14(2):119. https://doi.org/10.3390/info14020119
Chicago/Turabian StyleChen, Ming, Tao Ren, Pihai Sun, Jianfei Wu, Jinfeng Zhang, and Aite Zhao. 2023. "FuseLGNet: Fusion of Local and Global Information for Detection of Parkinson’s Disease" Information 14, no. 2: 119. https://doi.org/10.3390/info14020119
APA StyleChen, M., Ren, T., Sun, P., Wu, J., Zhang, J., & Zhao, A. (2023). FuseLGNet: Fusion of Local and Global Information for Detection of Parkinson’s Disease. Information, 14(2), 119. https://doi.org/10.3390/info14020119