


Top-Down Models across CPU Architectures: Applicability and Comparison in a High-Performance Computing Environment


Abstract
:1. Introduction and Related Work
1.1. Top-Down Model
1.2. Contributions
- Define the Top-Down model in AMD Zen 2.
- Implement the Top-Down model in Intel Skylake, AMD Zen 2, A64FX, Power9, and Kunpeng 920 CPUs.
- Apply the Top-Down model to study the effect of code modifications in a production HPC code across different CPU architectures.
- Compare the Top-Down model across systems with different CPU architectures.
2. HPC Systems and Their Top-Down Model
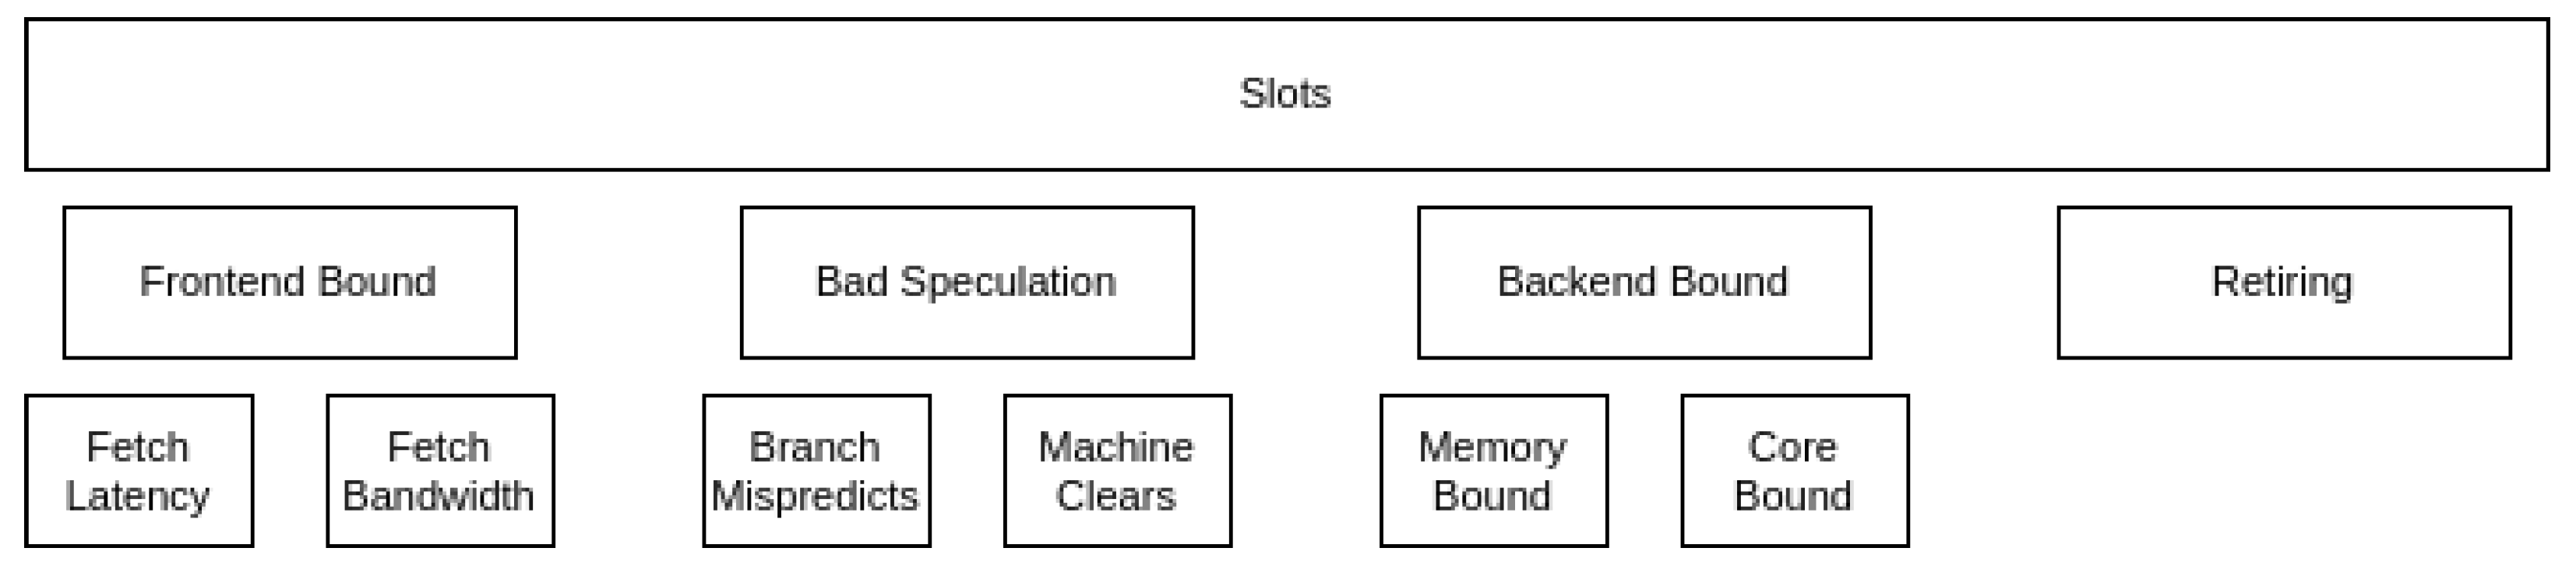
2.1. MareNostrum 4 General Purpose
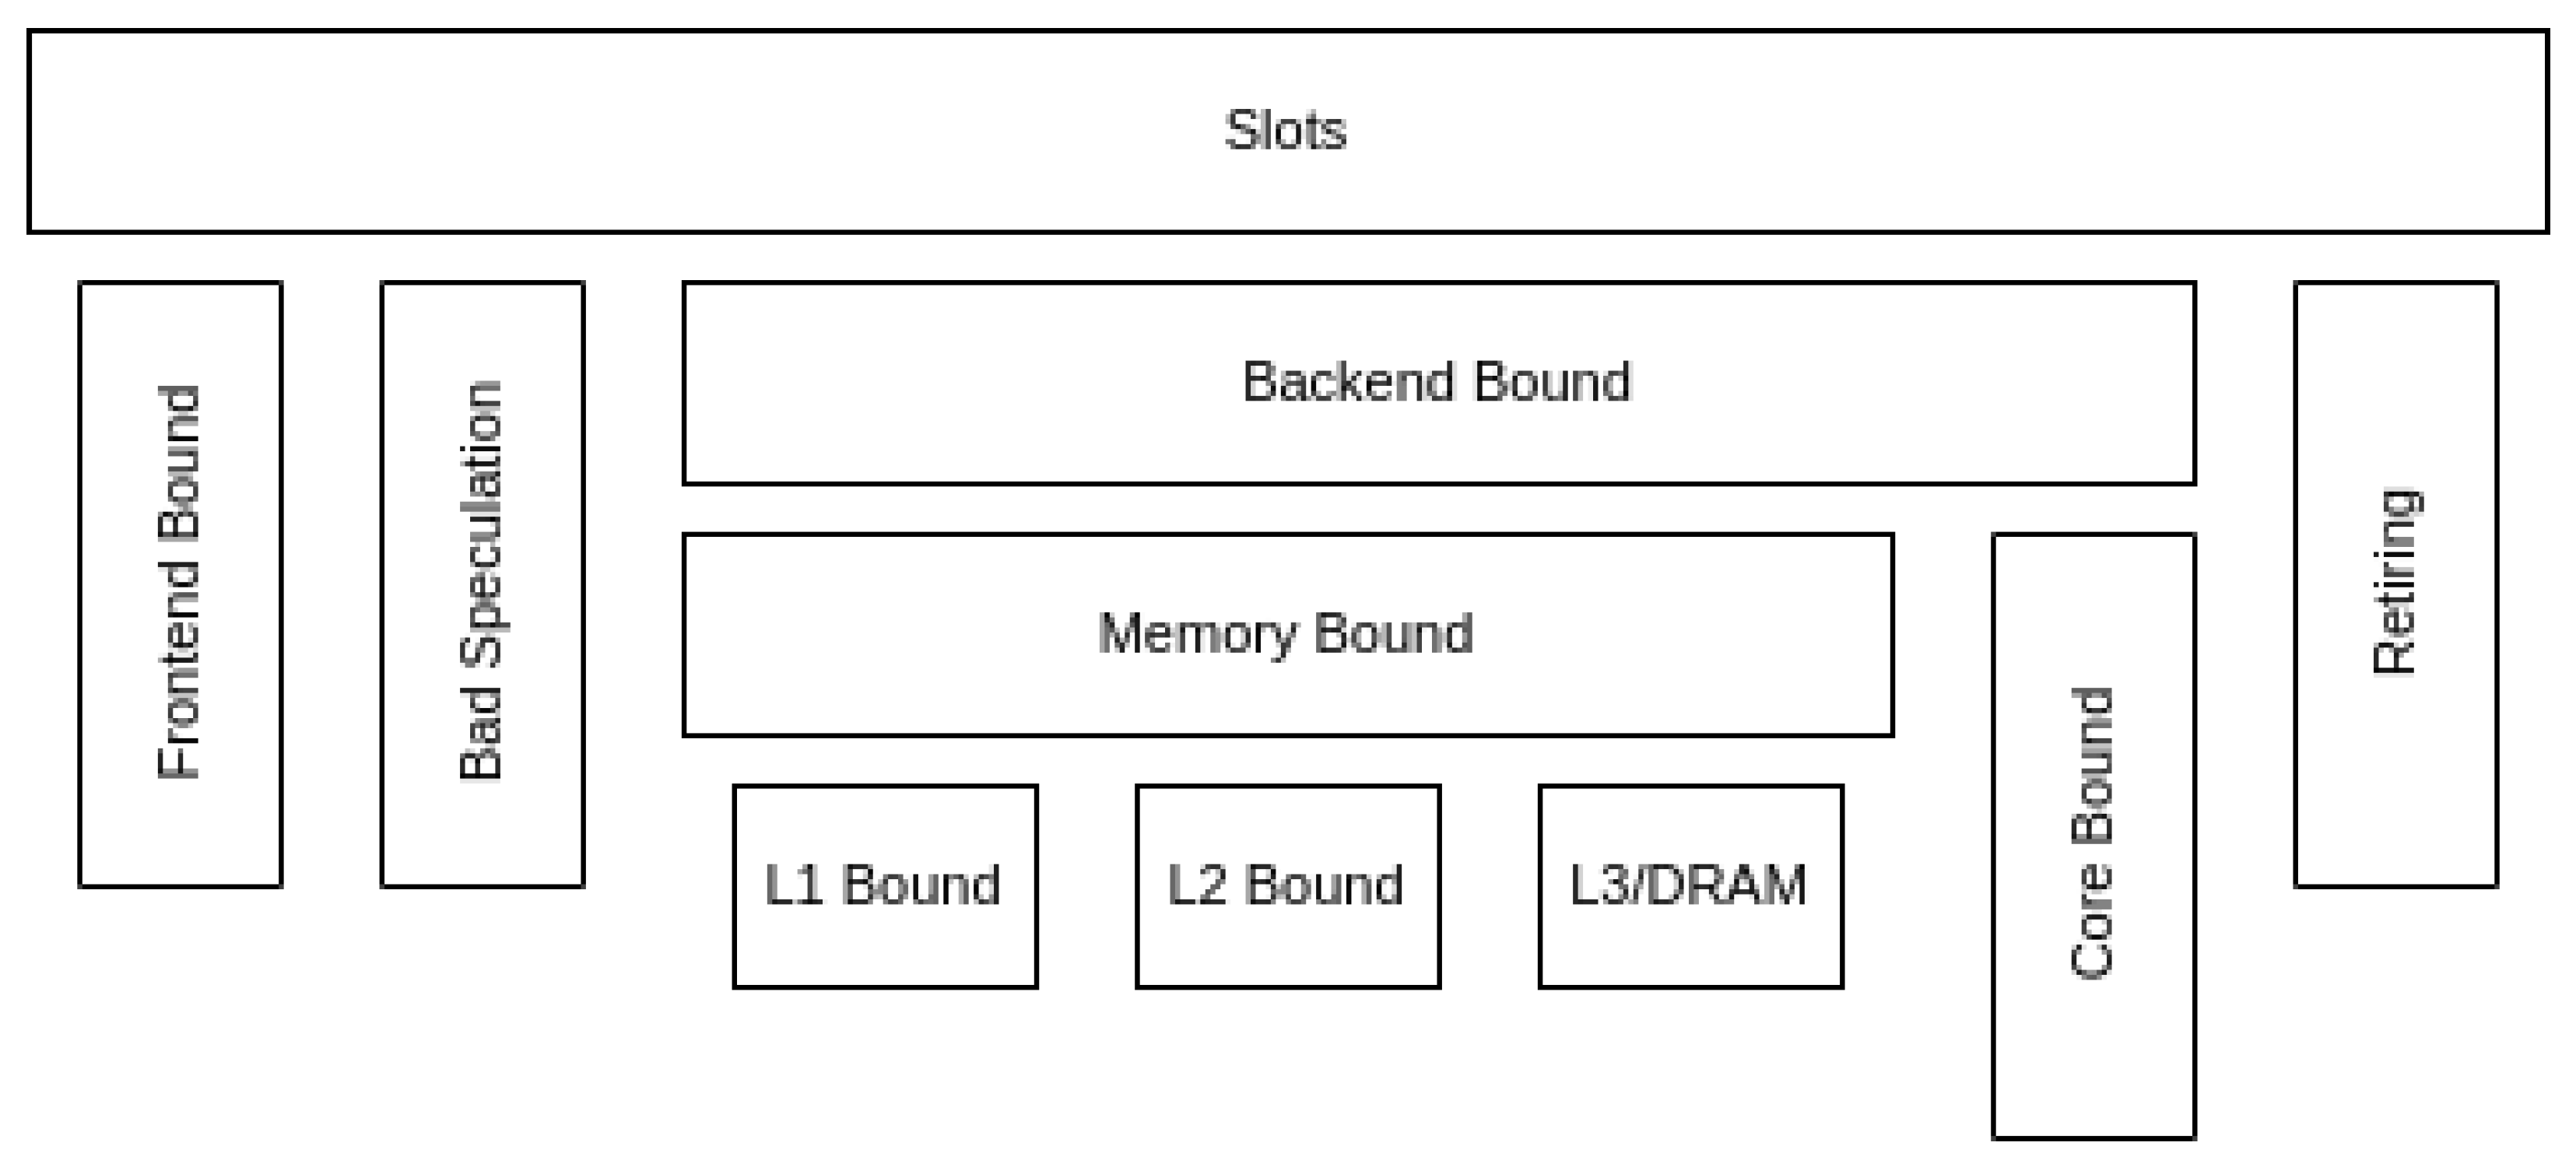
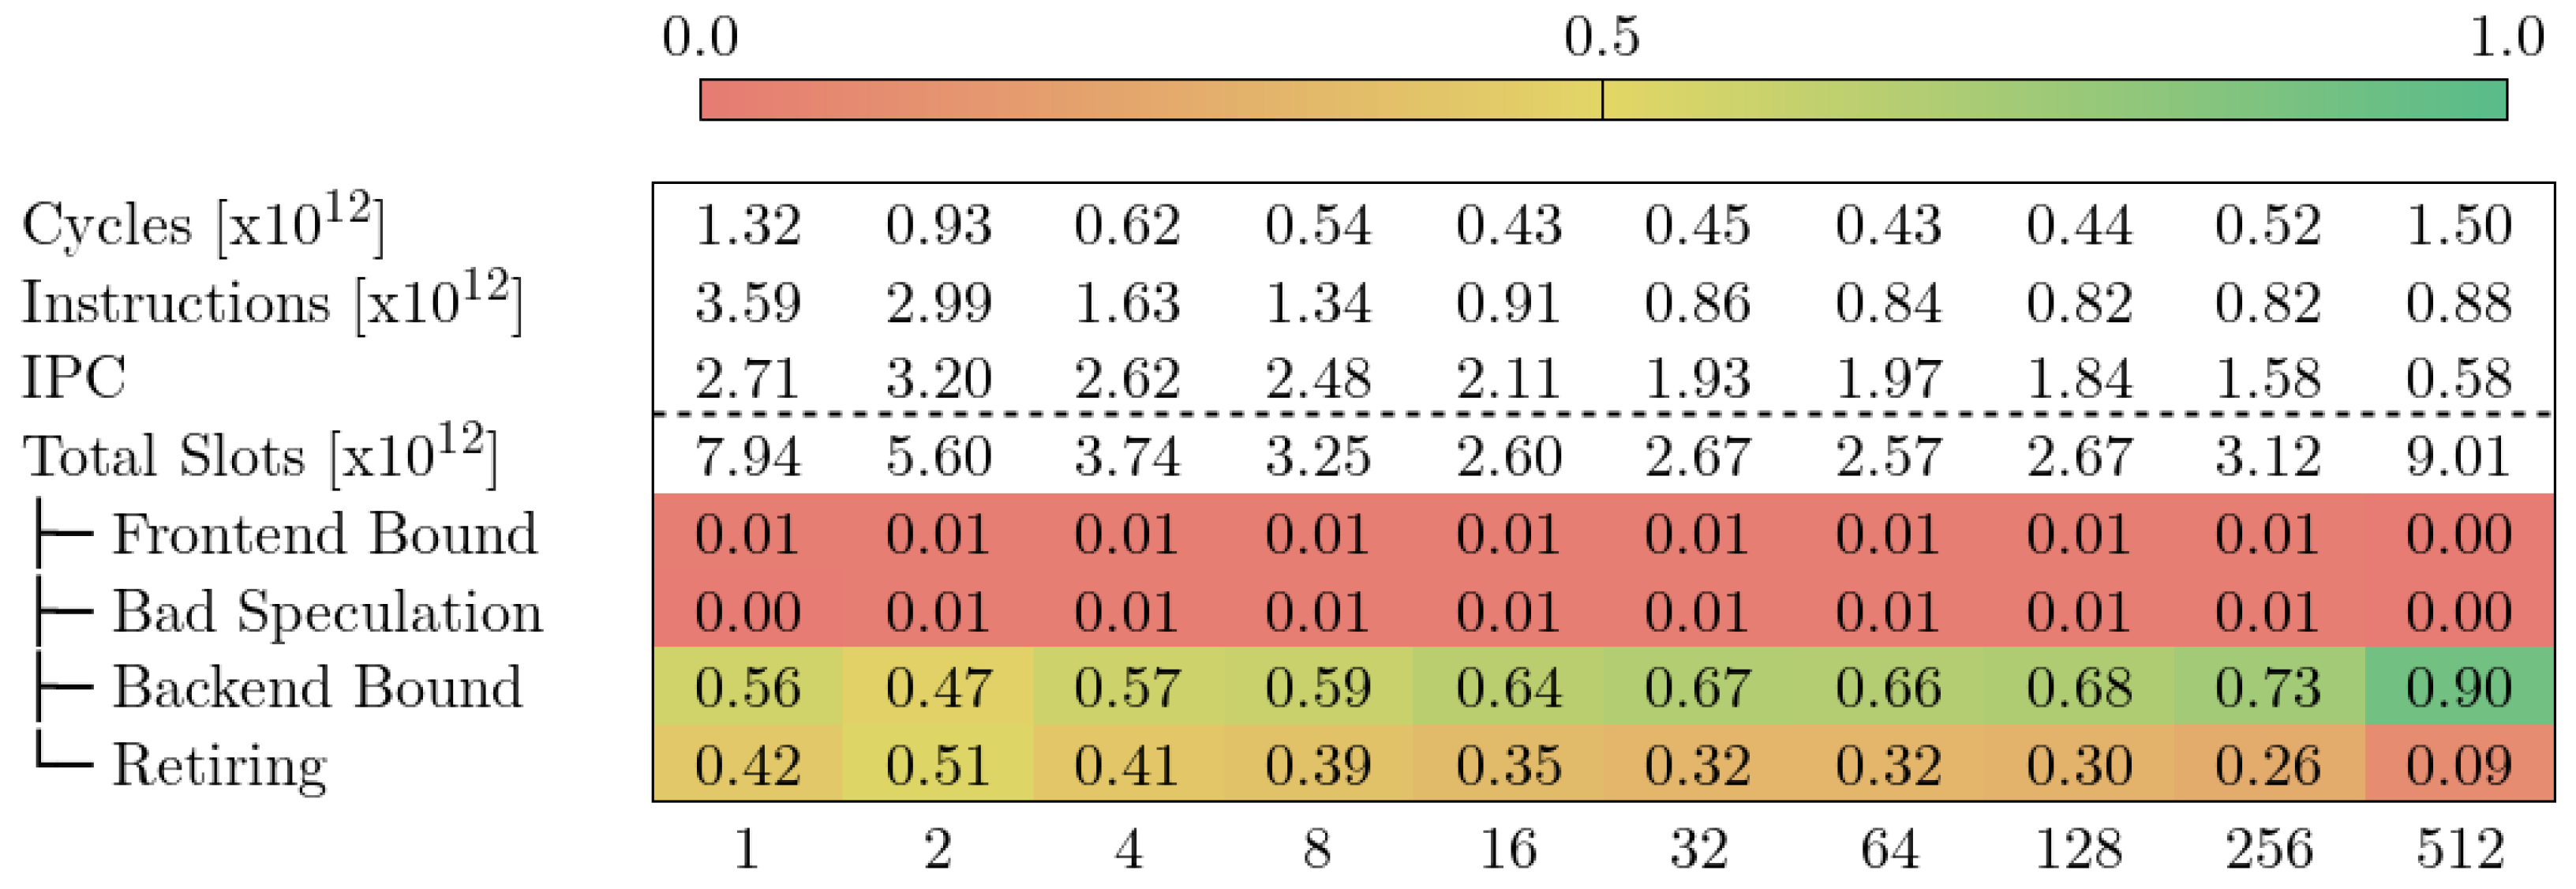
- Frontend Bound: the slot was lost due to insufficient OPs to execute.
- Bad Speculation: the slot was used, but to execute a speculative instruction that was later cleared.
- Back-end Bound: the slot was lost due to the back-end resources being occupied by an older OP.
- Retiring: the slot was used for an instruction that eventually retired. A high number in this metric means that the pipeline has not lost slots due to stalls. This does not mean that the hardware resources are being utilized efficiently. It only means that work is flowing into the pipeline.
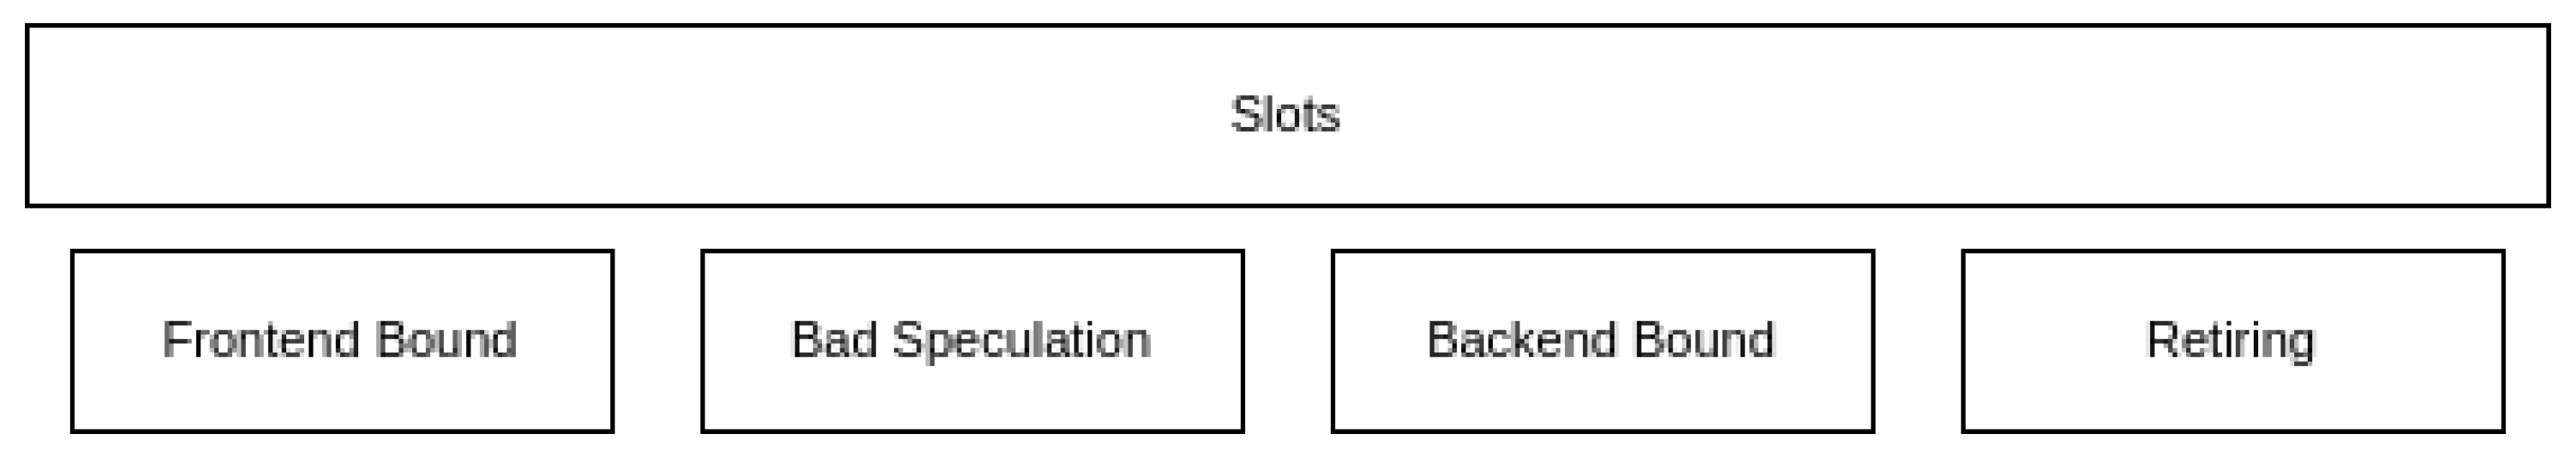
2.2. CTE-AMD
- Frontend Bound is based on the counter UOPS_QUEUE_EMPTY, which does not consider whether the back-end is stalled or not.
- Bad Speculation requires a micro-architectural parameter, Mispredict_Cost, which represents the average cycles lost due to a misprediction. We define this constant as 18 based on the publicly available experimental data [10].
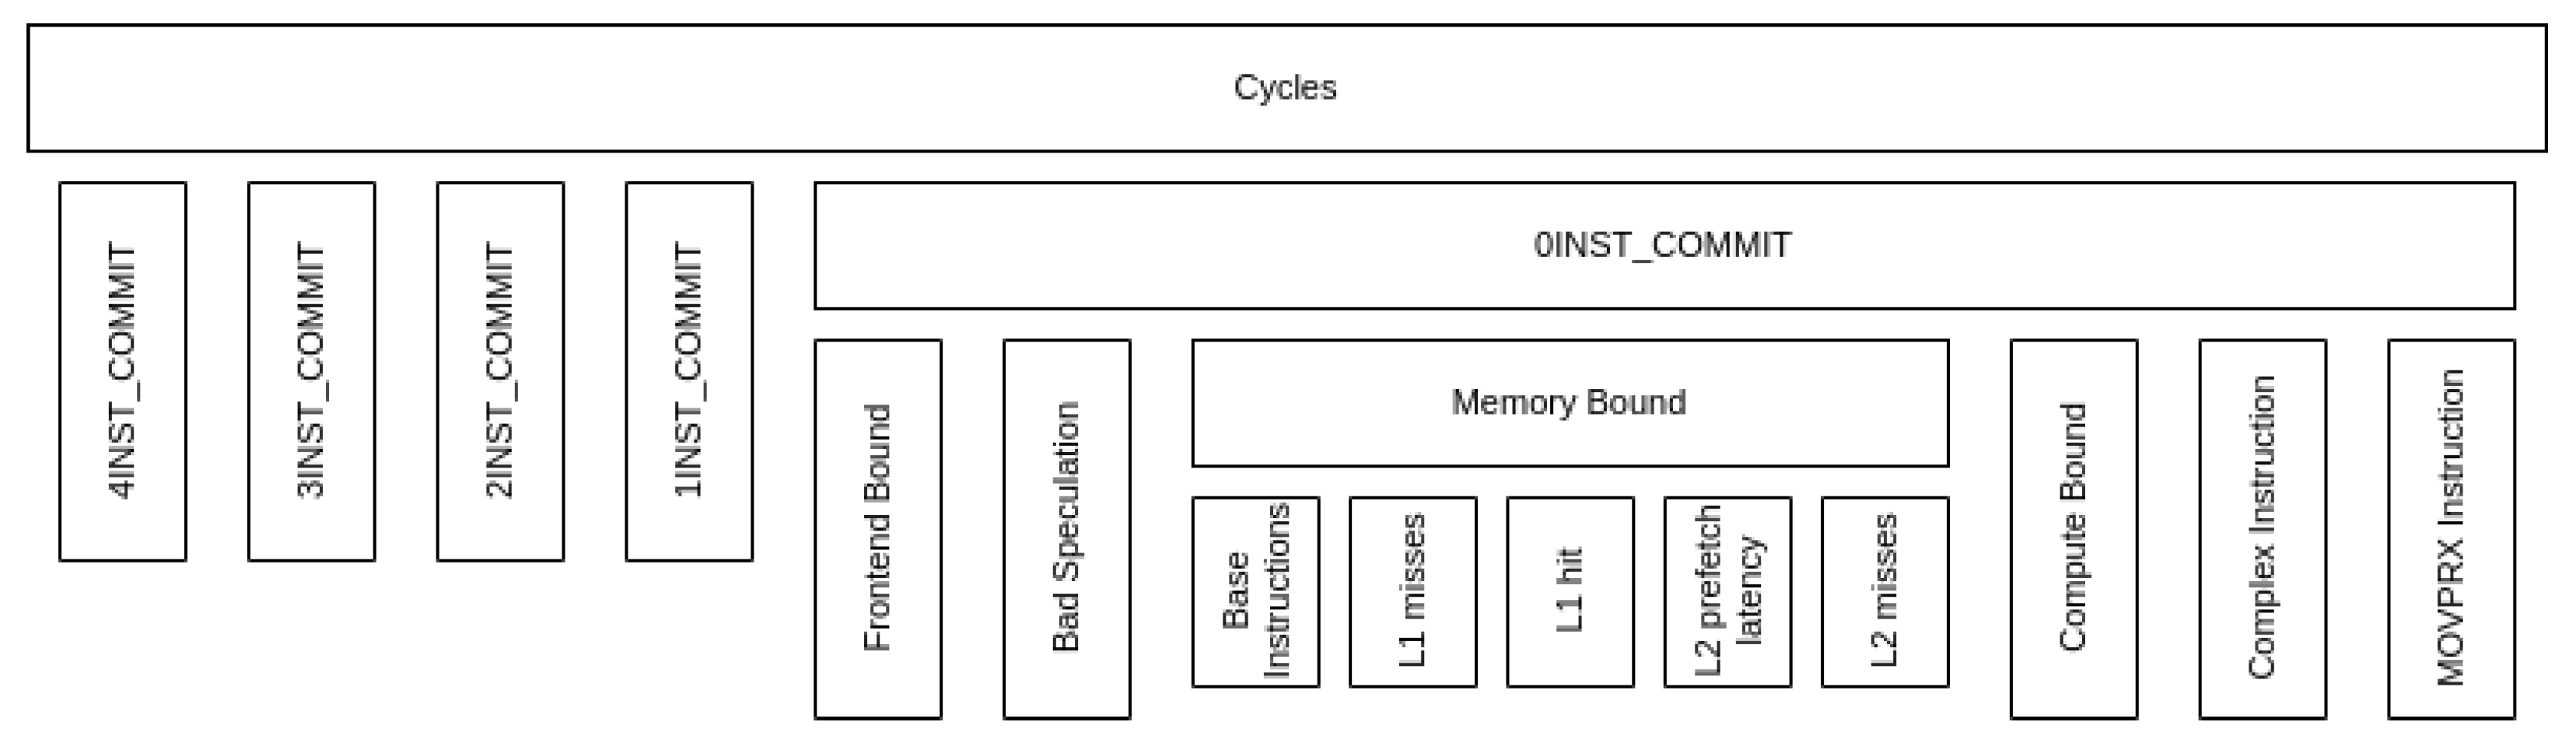
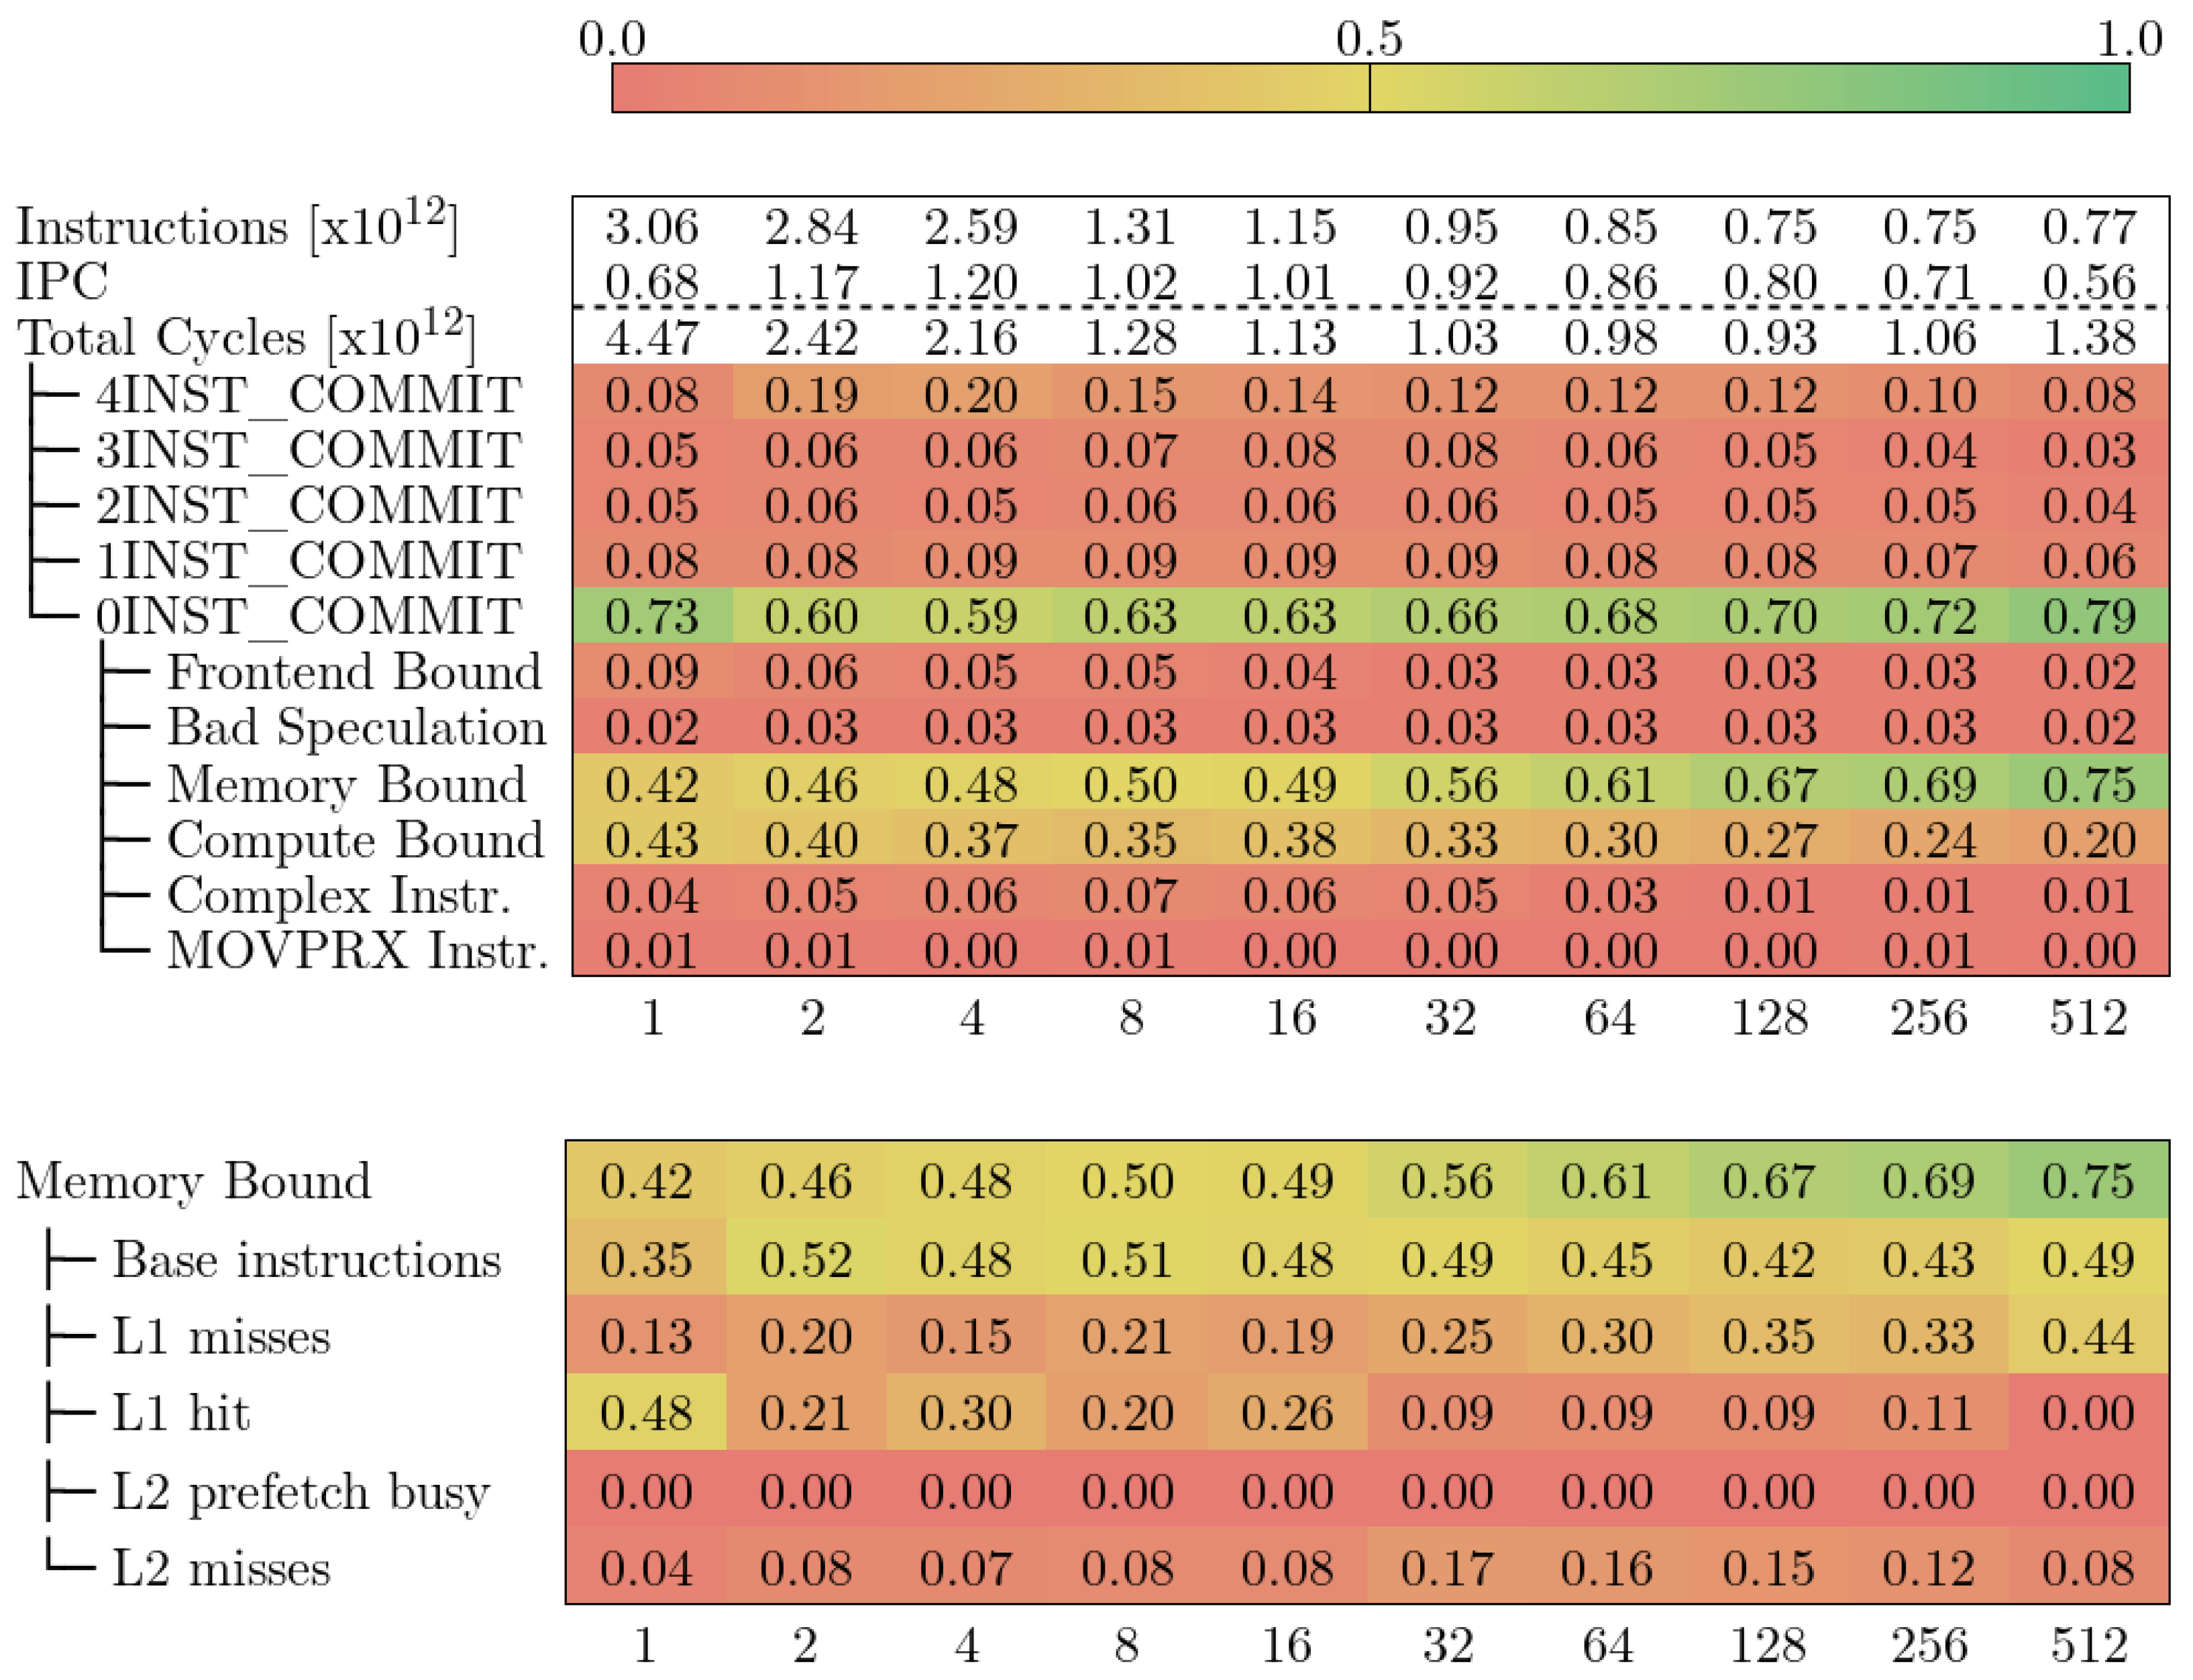
2.3. CTE-Arm
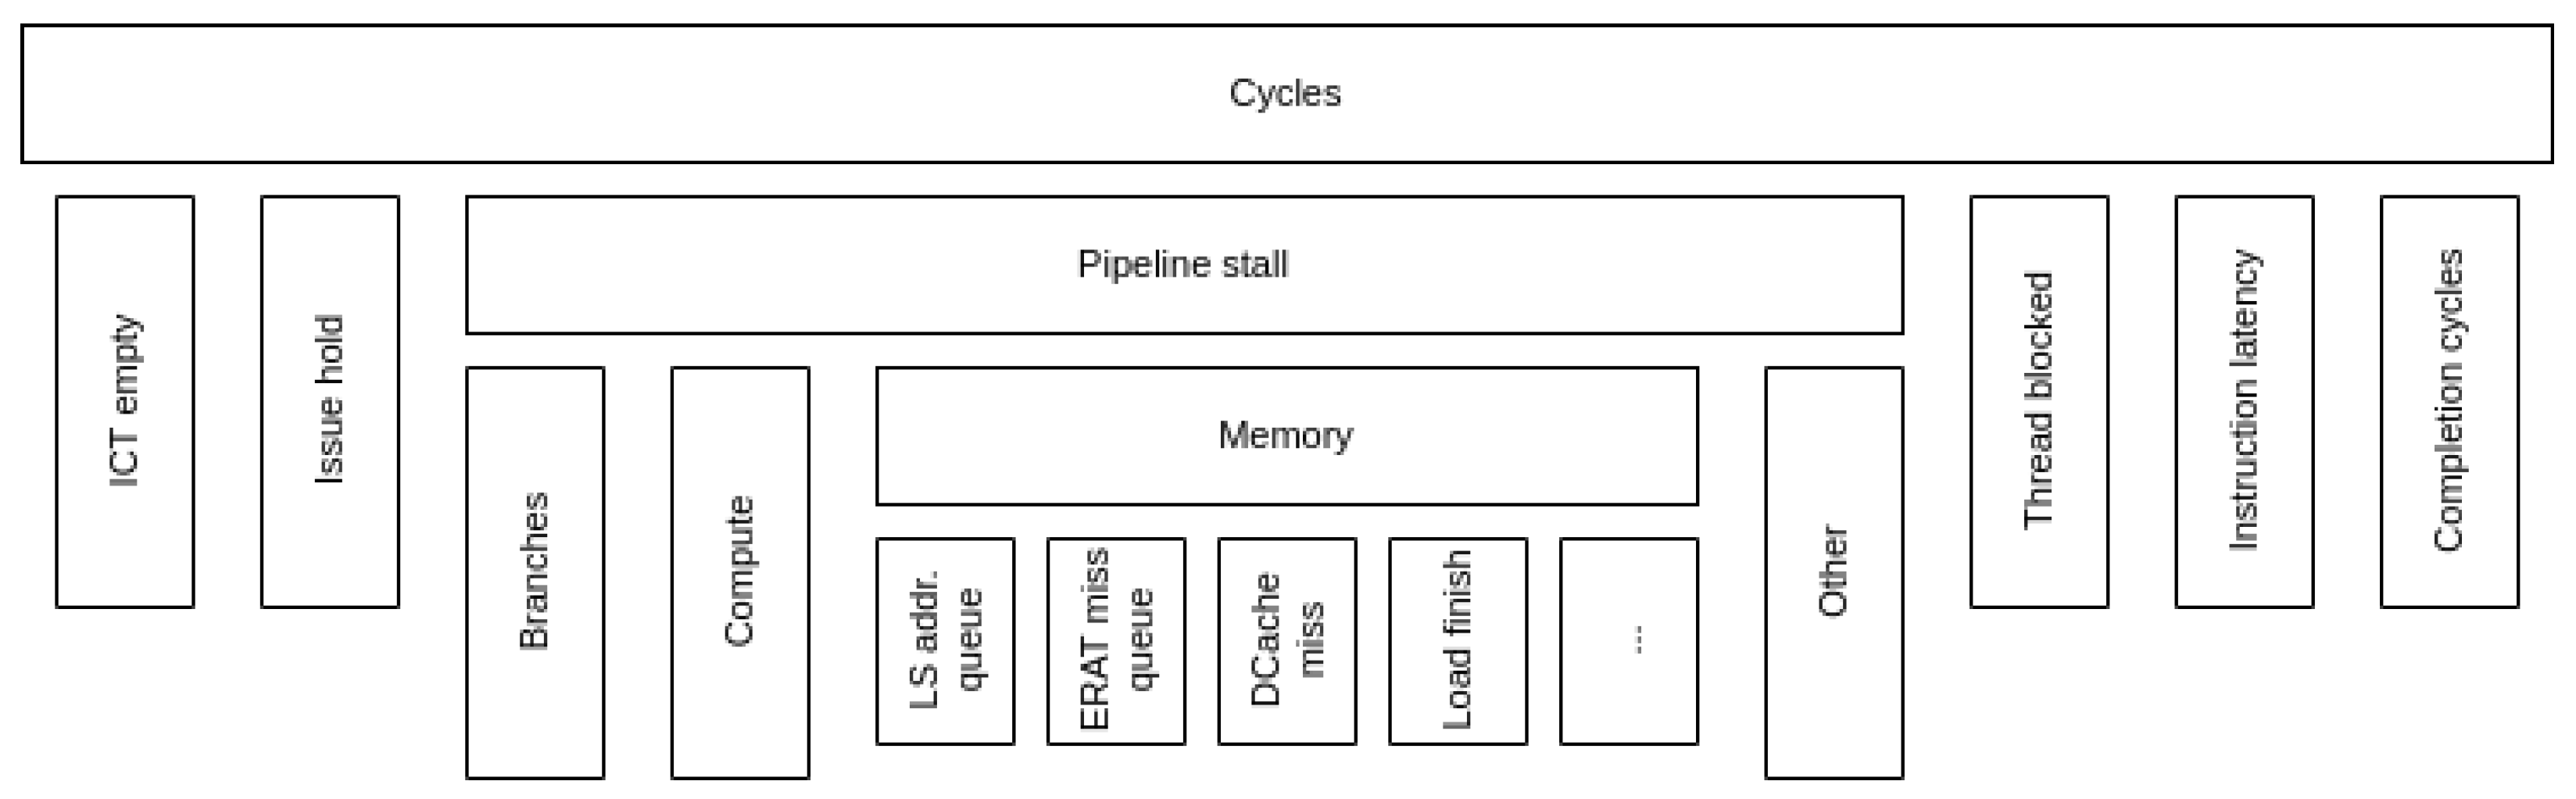
2.4. CTE-Power
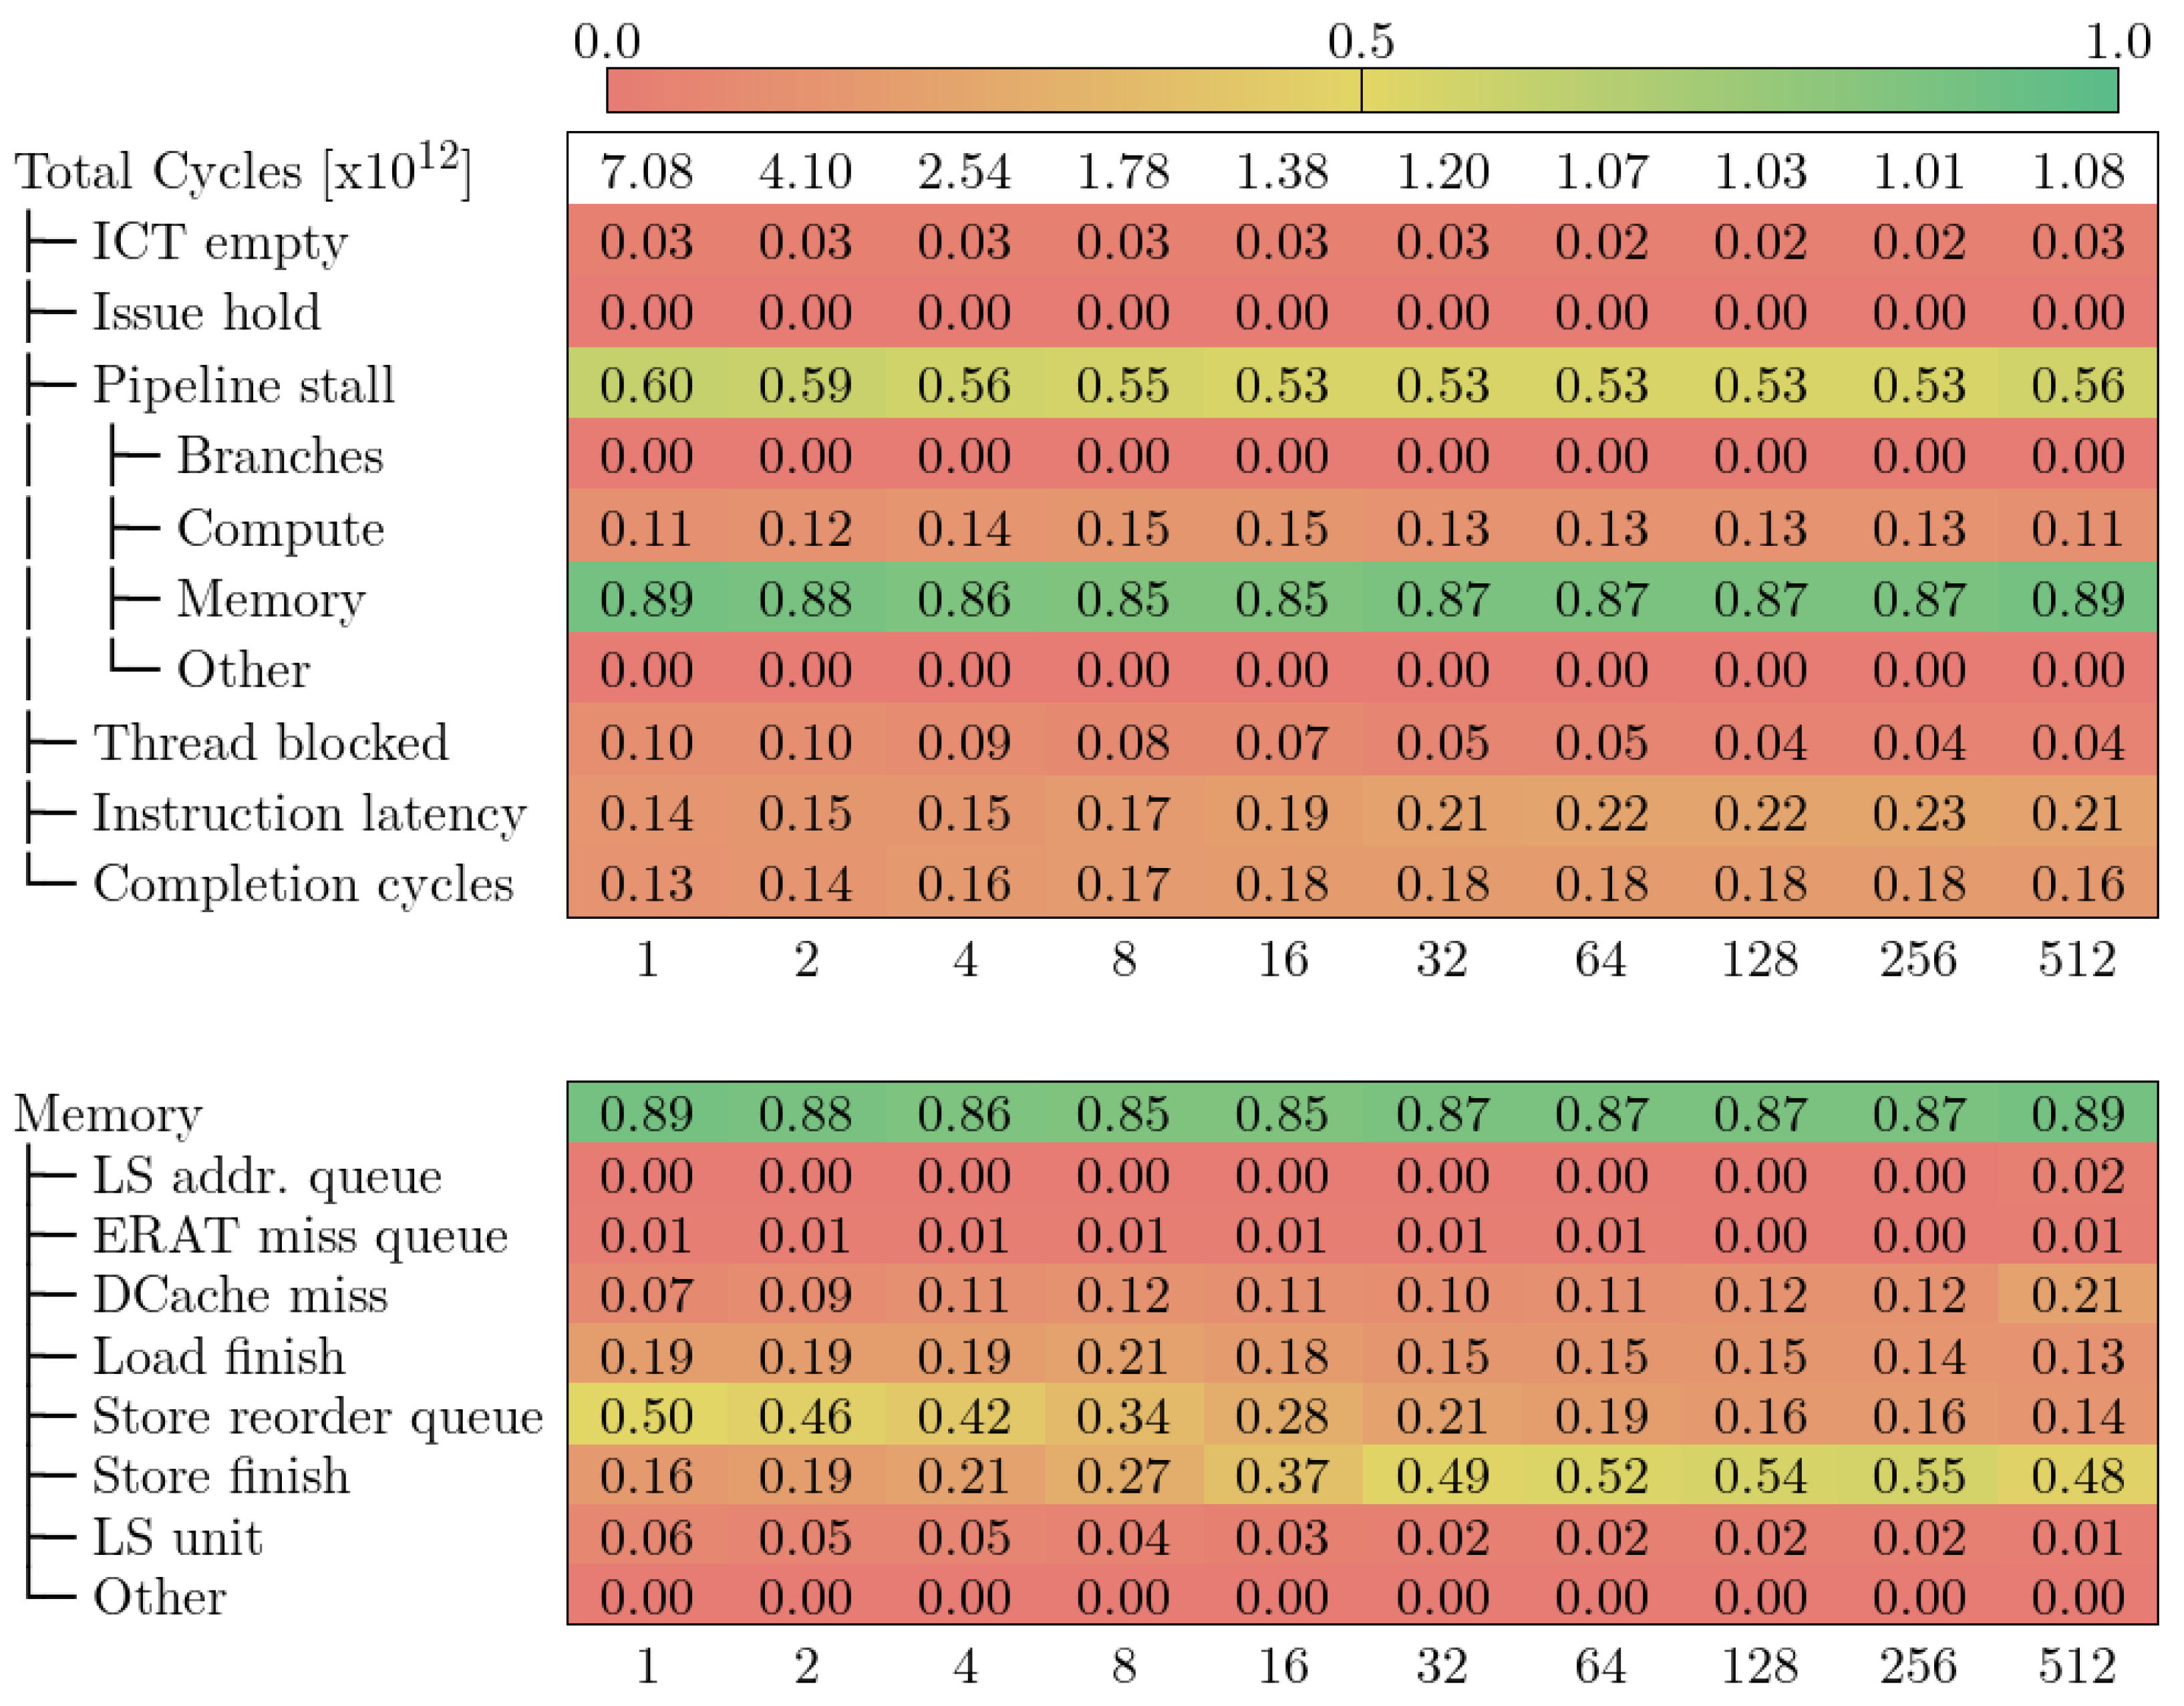
- ICT empty no instruction to complete (the pipeline is empty). Similar to Frontend Bound in other models.
- Issue hold next-to-complete instruction (i.e., oldest in the pipeline) is held in the issue stage.
- Pipeline stall similar to the Back-end Bound category in previous models.
- Thread blocked the next-to-complete instruction is held because an instruction from another hardware thread is occupying the pipeline.
- Instruction latency cycles waiting for the instruction to finish due to the pipeline latency.
- Completion cycles cycles in which at least one instruction has been completed. Similar to the Retiring category in previous models.
2.5. CTE-Kunpeng
3. HPC Application: Alya
General Structure
4. Model Implementation
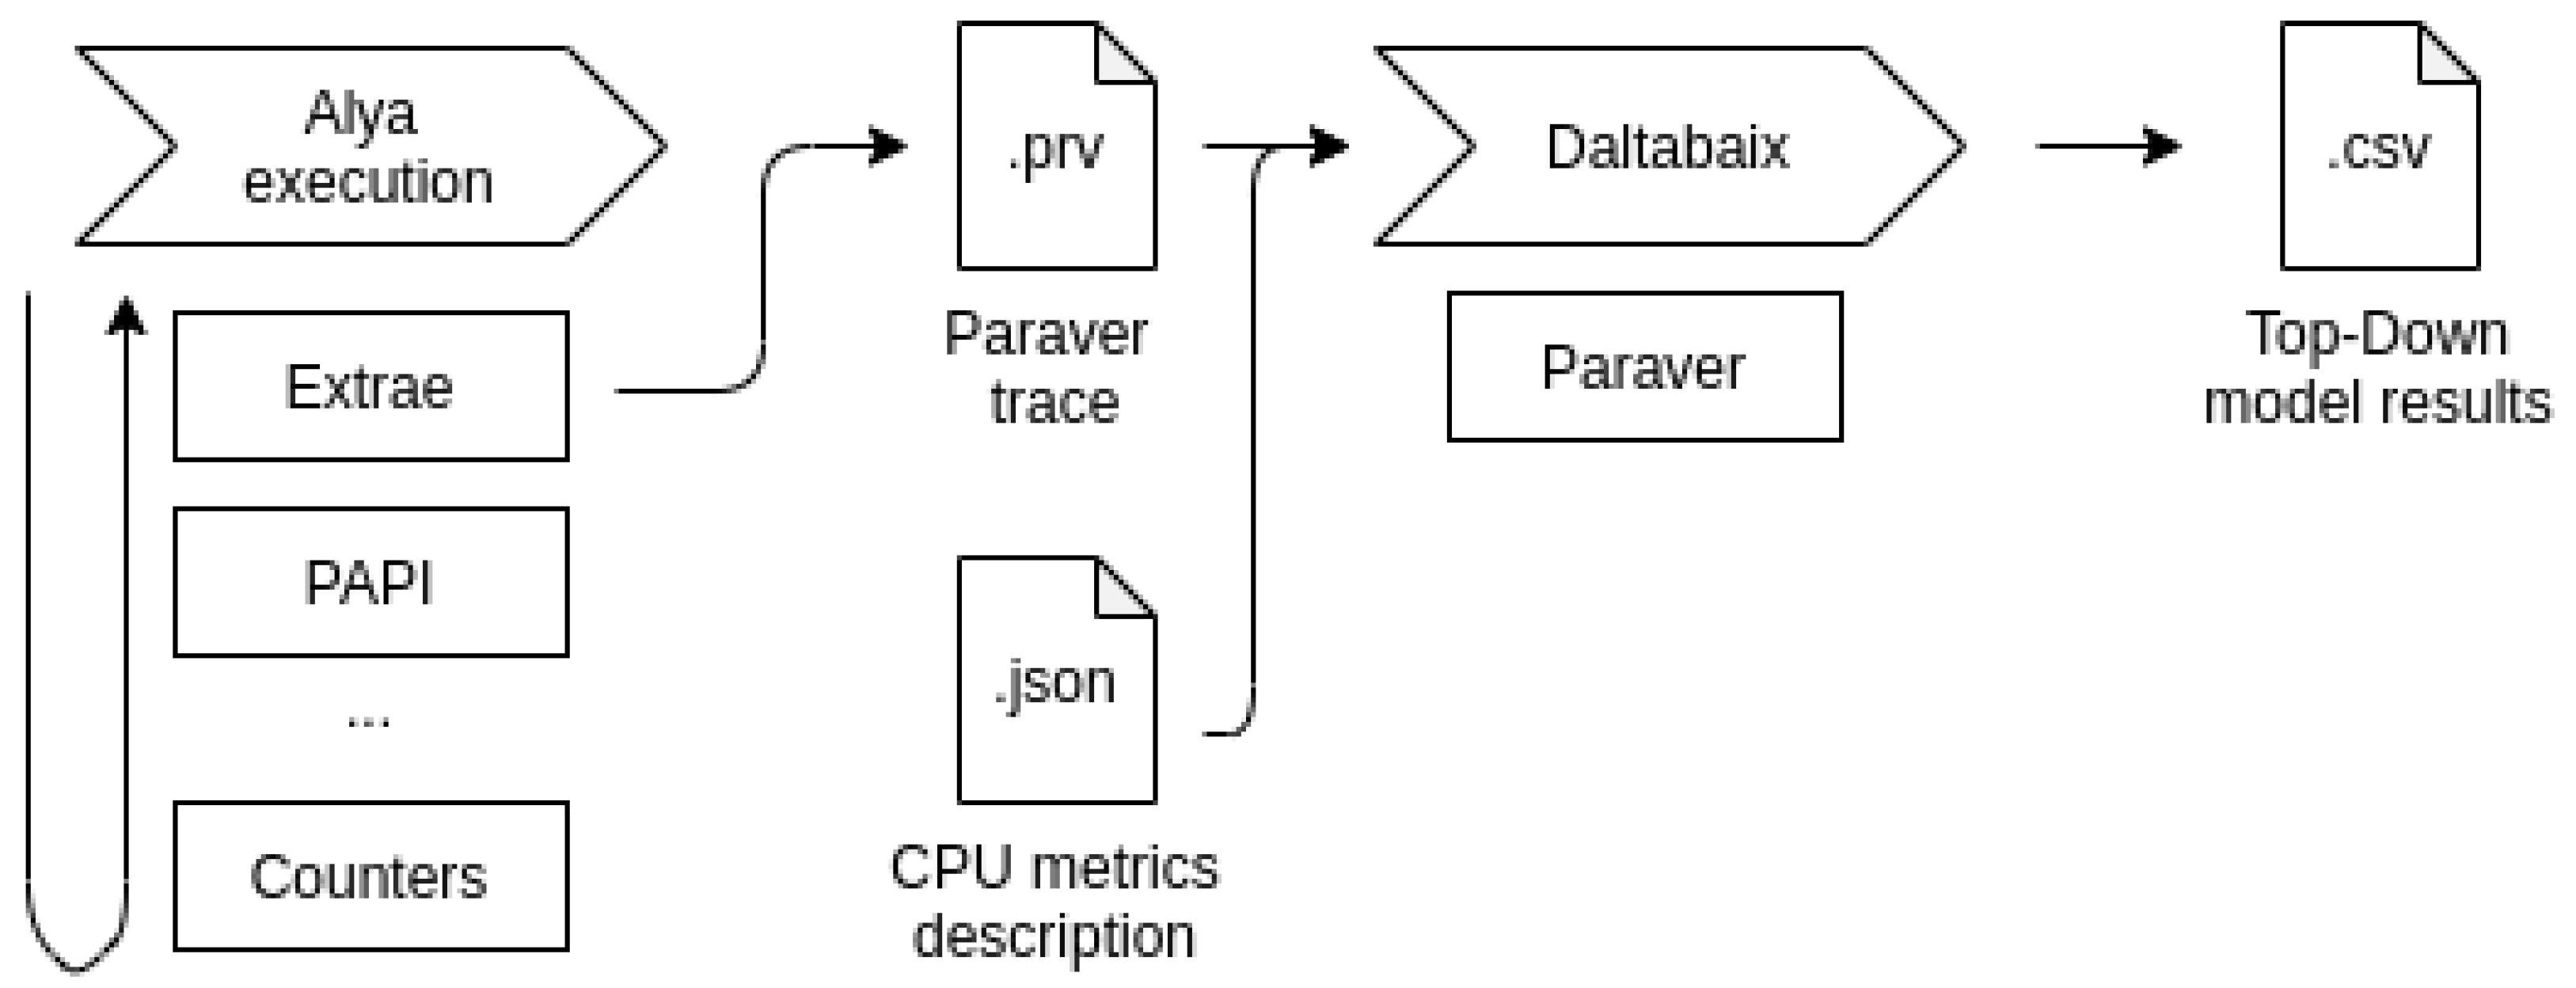
4.1. Tools
4.2. Measurement Methodology
5. Results
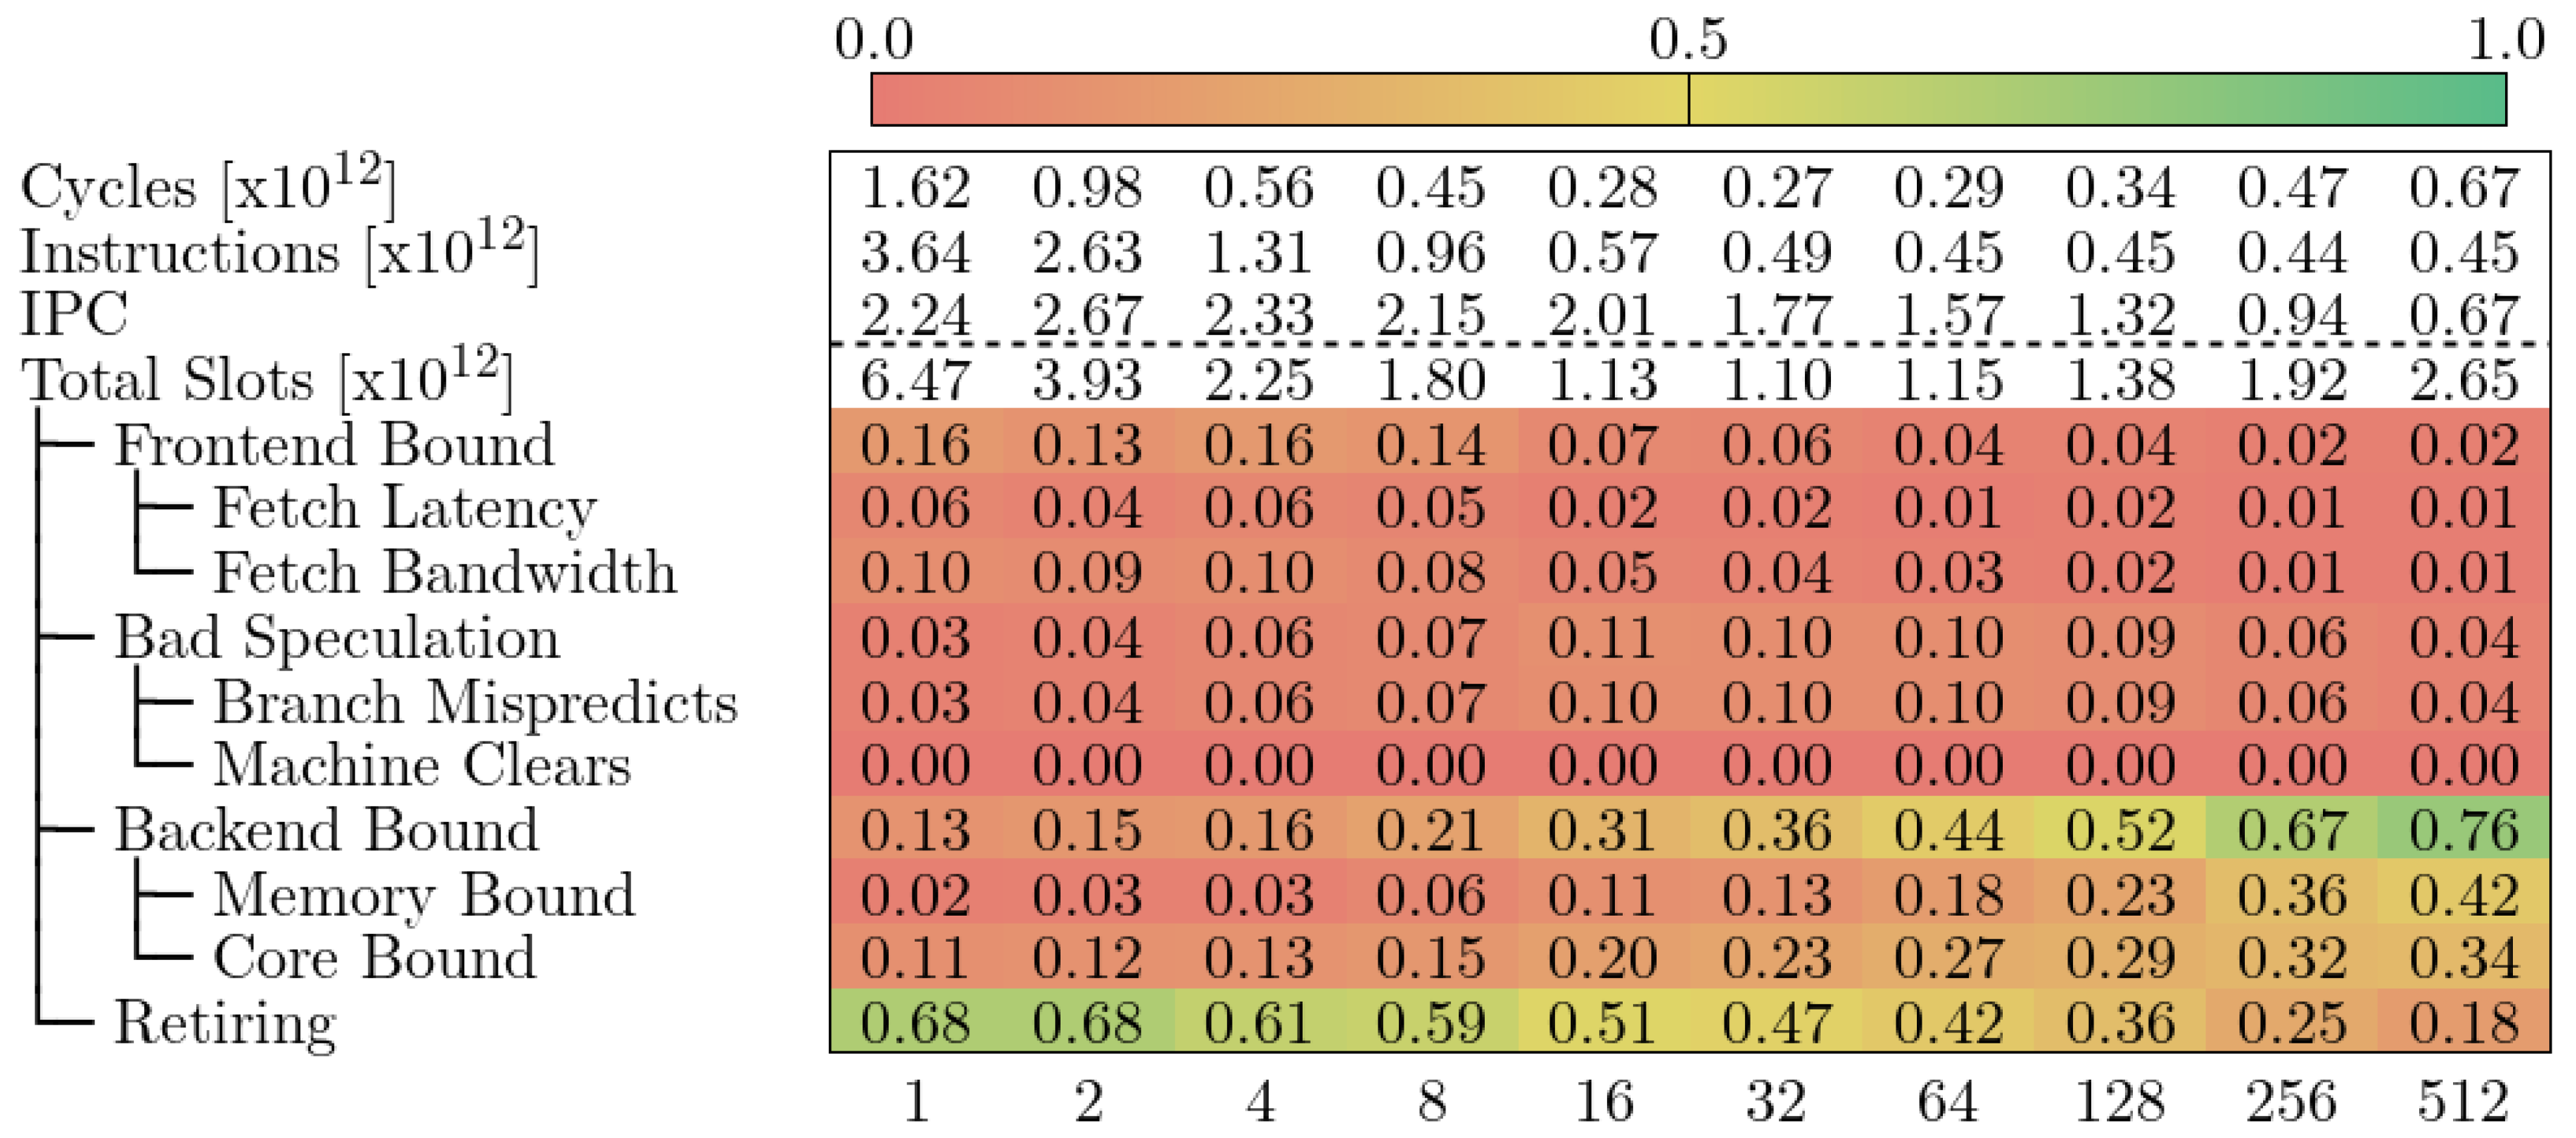
5.1. MareNostrum 4
5.2. CTE-AMD
5.3. CTE-Arm
5.4. CTE-Power
- Store reorder queue is defined by the counter PM_CMPLU_STALL_SRQ, which measures the cycles in which a store operation was stalled because the store reorder buffer (SRQ) was full (i.e., too many store operations were in-flight at the same time).
- Store finish is defined by the counter PM_CMPLU_STALL_STORE_FINISH, which measures the cycles waiting for a store operation that requires all its dependencies to be met to finish (i.e., the nominal latency of a store operation).
5.5. CTE-Kunpeng
6. Conclusions and Discussion
- It requires additional information (either micro-architectural details or further hardware counters) to draw a complete picture when analyzing and improving the performance of a scientific application;
- It does not quantify how much each of the resources within the compute node is used/saturated;
- It does not allow us to easily compare clusters of the same architecture or different architectures.
Author Contributions
Funding
Institutional Review Board Statement
Data Availability Statement
Conflicts of Interest
Appendix A. Event Sets and Metrics

| MareNostrum 4 | |
|---|---|
| EventSet1 | UOPS_RETIRED:RETIRE_SLOTS,
BR_MISP_RETIRED:ALL_BRANCHES MACHINE_CLEARS:COUNT, EXE_ACTIVITY:BOUND_ON_STORES |
| EventSet2 | CPU_CLK_THREAD_UNHALTED,
CYCLE_ACTIVITY:STALLS_MEM_ANY IDQ_UOPS_NOT_DELIVERED:CORE IDQ_UOPS_NOT_DELIVERED:CYCLES_0_UOPS_DELIV_CORE UOPS_ISSUED:ANY, INT_MISC:RECOVERY_CYCLES |
| CTE-AMD | |
| EventSet1 | UOPS_QUEUE_EMPTY,
RETIRED_BRANCH_INSTRUCTIONS_MISPREDICTED RETIRED_TAKEN_BRANCH_INSTRUCTIONS_MISPREDICTED RETIRED_INDIRECT_BRANCH_INSTRUCTIONS_MISPREDICTED |
| EventSet2 | CYCLES_NOT_IN_HALT,
RETIRED_UOPS,
RETIRED_INSTRUCTIONS |
| CTE-Arm | |
| EventSet1 | CPU_CYCLES,
0INST_COMMIT,
1INST_COMMIT 2INST_COMMIT, 3INST_COMMIT, 4INST_COMMIT |
| EventSet2 | LD_COMP_WAIT,
EU_COMP_WAIT,
BR_COMP_WAIT ROB_EMPTY, UOP_ONLY_COMMIT, SINGLE_MOVPRFX_COMMIT |
| EventSet3 | LD_COMP_WAIT_EX,
LD_COMP_WAIT_L2_MISS LD_COMP_WAIT_L2_MISS_EX, LD_COMP_WAIT_L1_MISS LD_COMP_WAIT_L1_MISS_EX, LD_COMP_WAIT_PFP_BUSY |
| CTE-Power | |
| EventSet1 | PM_RUN_CYC,
PM_CMPLU_STALL_BRU,
PM_NTC_ISSUE_HELD_ARB PM_NTC_ISSUE_HELD_DARQ_FULL, PM_NTC_ISSUE_HELD_OTHER |
| EventSet2 | PM_CMPLU_STALL_EXEC_UNIT,
PM_CMPLU_STALL_NTC_DISP_FIN PM_CMPLU_STALL_SRQ_FULL, PM_ICT_NOSLOT_CYC |
| EventSet3 | PM_CMPLU_STALL_EMQ_FULL,
PM_CMPLU_STALL_LOAD_FINISH PM_CMPLU_STALL_NTC_FLUSH, PM_CMPLU_STALL_THRD |
| EventSet4 | PM_1PLUS_PPC_CMPL,
PM_CMPLU_STALL_DCACHE_MISS PM_CMPLU_STALL_LMQ_FULL, PM_CMPLU_STALL_LSU_MFSPR |
| EventSet5 | PM_CMPLU_STALL_LARX,
PM_CMPLU_STALL_LRQ_FULL PM_CMPLU_STALL_LSAQ_ARB, PM_CMPLU_STALL_STORE_DATA |
| EventSet6 | PM_CMPLU_STALL_ERAT_MISS,
PM_CMPLU_STALL_HWSYNC PM_CMPLU_STALL_LHS, PM_CMPLU_STALL_LRQ_OTHER |
| EventSet7 | PM_CMPLU_STALL_LSU_FIN,
PM_CMPLU_STALL_ST_FWD PM_CMPLU_STALL_STORE_FIN_ARB, PM_CMPLU_STALL_STORE_FINISH |
| EventSet8 | PM_CMPLU_STALL_EIEIO,
PM_CMPLU_STALL_SLB,
PM_CMPLU_STALL_TLBIE |
| EventSet9 | PM_CMPLU_STALL_LWSYNC,
PM_CMPLU_STALL_PASTE PM_CMPLU_STALL_STORE_PIPE_ARB |
| EventSet10 | PM_CMPLU_STALL_STCX,
PM_CMPLU_STALL_TEND |
| CTE-Kunpeng | |
| EventSet1 | INST_RETIRED,
CPU_CYCLES FETCH_BUBBLE, INST_SPEC |
| EventSet2 | MEM_STALL_ANYLOAD,
MEM_STALL_ANYSTORE,
EXE_STALL_CYCLE MEM_STALL_L1MISS, MEM_STALL_L2MISS |
| MareNostrum 4 | |
|---|---|
| Pipeline_Width | 4 |
| Clocks | CPU_CLK_THREAD_UNHALTED |
| Slots | Pipeline_Width×Clocks |
| Frontend_Bound | IDQ_UOPS_NOT_DELIVERED:CORE/Slots |
| Fetch_Latency | Pipeline_Width×IDQ_UOPS_NOT_DELIVERED:CYCLES_0_UOPS_DELIV_CORE/Slots |
| Fetch_Bandwidth | Frontend_Bound−Fetch_Latency |
| Bad_Speculation | (UOPS_ISSUED:ANY - UOPS_RETIRED:RETIRE_SLOTS + Pipeline_Width × INT_MISC:RECOVERY_CYCLES)/Slots |
| Branch_Mispredicts | Mispred_Clears_Fraction×Bad_Speculation |
| Machine_Clears | Bad_Speculation−Branch_Mispredicts |
| Mispred_Clears_Fraction | BR_MISP_RETIRED:ALL_BRANCHES/(BR_MISP_RETIRED:ALL_BRANCHES + MACHINE_CLEARS:COUNT) |
| Backend_Bound | 1 −Frontend_Bound− (UOPS_ISSUED:ANY + Pipeline_Width× INT_MISC:RECOVERY_CYCLES)/ Slots |
| Memory_Bound | Memory_Bound_Fraction×Backend_Bound |
| Core_Bound | Backend_Bound−Memory_Bound |
| Memory_Bound_Fraction | CYCLE_ACTIVITY:STALLS_MEM_ANY + EXE_ACTIVITY:BOUND_ON_STORES)/Backend_Bound_Cycles |
| Retiring | UOPS_RETIRED:RETIRE_SLOTS/Slots |
| CTE-AMD | |
| Pipeline_Width | 6 |
| Mispredict_Cost | 18 |
| Clocks | CYCLES_NOT_IN_HALT |
| Slots | Pipeline_Width×Clocks |
| Frontend_Bound | UOPS_QUEUE_EMPTY/Slots |
| Bad_Speculation | Branch_Instructions×Mispredict_Cost/Slots |
| Branch_Instructions | RETIRED_BRANCH_INSTRUCTIONS_MISPREDICTED + RETIRED_INDIRECT_BRANCH_INSTRUCTIONS_MISPREDICTED + RETIRED_TAKEN_BRANCH_INSTRUCTIONS_MISPREDICTED |
| Backend_Bound | 1 − (Frontend_Bound + Bad_Speculation + Retiring) |
| Retiring | RETIRED_UOPS/Slots |
| CTE-Arm | |
| Clocks | CYCLES_NOT_IN_HALT |
| 4_Instruction_Commit | 4INST_COMMIT/Clocks |
| 3_Instruction_Commit | 3INST_COMMIT/Clocks |
| 2_Instruction_Commit | 2INST_COMMIT/Clocks |
| 1_Instruction_Commit | 1INST_COMMIT/Clocks |
| 0_Instruction_Commit | 0INST_COMMIT/Clocks |
| Frontend_Bound | ROB_EMPTY /0_INST_COMMIT |
| Bad_Speculation | BR_COMP_WAIT /0_INST_COMMIT |
| Memory_Bound | LD_COMP_WAIT /0_INST_COMMIT |
| Compute_Bound | EU_COMP_WAIT /0_INST_COMMIT |
| Complex_Instructions | UOP_ONLY_COMMIT /0_INST_COMMIT |
| MOVPRX_Instructions | SINGLE_MOVPRX_COMMIT/0_INST_COMMIT |
| CTE-Power | |
| Clocks | PM_RUN_CYC |
| No_Instruction_To_Execute | PM_ICT_NOSLOT_CYC/Clocks |
| Instruction_Held_In_Issue | PM_ISSUE_HOLD/Clocks |
| Backend_Bound | PM_CMPLU_STALL/Clocks |
| Stalled_By_Other_Thread | PM_CMPLU_STALL_THRD/Clocks |
| ??? | PM_1PLUS_PPC_CMPL/Clocks |
| Completion_Cycles | 1 − (No_Instruction_To_Execute + Instruction_Held_In_Issue + Backend_Bound + Stalled_By_Other_Thread + ???) |
| CTE-Kunpeng | |
| Pipeline_Width | 4 |
| Clocks | CPU_CYCLES |
| Slots | Pipeline_Width×Clocks |
| Frontend_Bound | FETCH_BUBBLE/Slots |
| Bad_Speculation | (INST_SPEC − INST_RETIRED)/Slots |
| Backend_Bound | 1 − (Frontend_Bound + Bad_Speculation + Retiring) |
| Memory_Bound | Memory_Stall_Cycles/EXE_STALL_CYCLE |
| Core_Bound | (EXE_STALL_CYCLE − Memory_Stall_Cycles)/EXE_STALL_CYCLE |
| Memory_Stall_Cycles | MEM_STALL_ANYLOAD + MEM_STALL_ANYSTORE |
| Retiring | INST_RETIRED/Slots |
References
- Top500 List. 2022. Available online: https://www.top500.org/lists/top500/2022/11/ (accessed on 1 November 2022).
- Williams, S.; Waterman, A.; Patterson, D. Roofline: An Insightful Visual Performance Model for Multicore Architectures. Commun. ACM 2009, 52, 65–76. [Google Scholar] [CrossRef]
- Ofenbeck, G.; Steinmann, R.; Caparros, V.; Spampinato, D.G.; Püschel, M. Applying the roofline model. In Proceedings of the 2014 IEEE International Symposium on Performance Analysis of Systems and Software (ISPASS), Monterey, CA, USA, 23–25 March 2014; IEEE: Piscataway, NJ, USA, 2014; pp. 76–85. [Google Scholar]
- Ilic, A.; Pratas, F.; Sousa, L. Cache-aware Roofline model: Upgrading the loft. IEEE Comput. Archit. Lett. 2014, 13, 21–24. [Google Scholar] [CrossRef]
- Banchelli, F.; Garcia-Gasulla, M.; Houzeaux, G.; Mantovani, F. Benchmarking of State-of-the-Art HPC Clusters with a Production CFD Code. In Proceedings of the Platform for Advanced Scientific Computing Conference, Geneva, Switzerland, 29 June–1 July 2020. [Google Scholar] [CrossRef]
- Yasin, A. A Top-Down method for performance analysis and counters architecture. In Proceedings of the 2014 IEEE International Symposium on Performance Analysis of Systems and Software (ISPASS), Monterey, CA, USA, 23–25 March 2014; pp. 35–44. [Google Scholar] [CrossRef]
- Intel. Top-Down Microarchitecture Analysis Method; Intel: Santa Clara, CA, USA, 2022. [Google Scholar]
- Jarus, M.; Oleksiak, A. Top-Down Characterization Approximation based on performance counters architecture for AMD processors. Simul. Model. Pract. Theory 2016, 68, 146–162. [Google Scholar] [CrossRef]
- Banchelli, F.; Oyarzun, G.; Garcia-Gasulla, M.; Mantovani, F.; Both, A.; Houzeaux, G.; Mira, D. A portable coding strategy to exploit vectorization on combustion simulations. arXiv 2022, arXiv:2210.11917. [Google Scholar]
- Fog, A. The Microarchitecture of Intel, AMD, and VIA CPUs—An Optimization Guide for Assembly Programmers and Compiler Makers; Copenhagen University College of Engineering: Ballerup, Denmark, 2022. [Google Scholar]
- A64FX Microarchitecture Manual. 2021. Available online: https://raw.githubusercontent.com/fujitsu/A64FX/master/doc/A64FX_Microarchitecture_Manual_en_1.6.pdf (accessed on 7 August 2023).
- POWER9 Performance Monitor Unit User’s Guide. 2018. Available online: https://wiki.raptorcs.com/w/images/6/6b/POWER9_PMU_UG_v12_28NOV2018_pub.pdf (accessed on 7 August 2023).
- Unified European Applications Benchmark Suite. Available online: https://prace-ri.eu/training-support/technical-documentation/benchmark-suites/ (accessed on 7 August 2023).
- Terpstra, D.; Jagode, H.; You, H.; Dongarra, J. Collecting Performance Data with PAPI-C. In Tools for High Performance Computing 2009: Proceedings of the 3rd International Workshop on Parallel Tools for High Performance Computing, September 2009, ZIH, Dresden; Müller, M.S., Resch, M.M., Schulz, A., Nagel, W.E., Eds.; Springer: Berlin/Heidelberg, Germany, 2010; pp. 157–173. [Google Scholar]
- Extrae. 2023. Available online: https://tools.bsc.es/extrae (accessed on 7 August 2023).
- Pillet, V.; Pillet, V.; Labarta, J.; Cortes, T.; Cortes, T.; Girona, S.; Girona, S.; Computadors, D.D.D. PARAVER: A Tool to Visualize and Analyze Parallel Code. In Proceedings of WoTUG-18: Transputer and Occam Developments; Technical Report; IOS Press: Amsterdam, The Netherlands, 1995. [Google Scholar]
- Gonzalez, J.; Gimenez, J.; Labarta, J. Automatic detection of parallel applications computation phases. In Proceedings of the 2009 IEEE International Symposium on Parallel & Distributed Processing, Chengdu, China, 10–12 August 2009; pp. 1–11. [Google Scholar] [CrossRef]


| MareNostrum 4 | CTE-AMD | CTE-Arm | CTE-Power | CTE-Kunpeng | |
|---|---|---|---|---|---|
| Cluster architecture | |||||
| Number of nodes | 3456 | 33 | 192 | 52 | 16 |
| CPU Model | Xeon Platinum 8160 | EPYC 7742 | FX1000 | Power9 8335-GTH | Kunpeng 920 |
| Architecture | x86_64 | x86_64 | aarch64 | ppc64le | aarch64 |
| CPUs per node | 2 | 1 | 1 | 2 | 2 |
| Cores per CPU | 24 | 64 | 48 | 20 | 64 |
| Frequency (MHz) | 2100 | 2250 | 2200 | 3000 | 2600 |
| Multi-Threading | No | No | No | No | No |
| Floating-point performance | |||||
| Vector/SIMD extension | AVX512 | AVX2 | SVE/NEON | VSX | NEON |
| Vector/SIMD size (B) | 8 | 4 | 8/2 | 2 | 2 |
| Peak performance (GFlop/s) | 67.20 | 54.16 | 70.40/17.60 | 24.0 | 10.40 |
| Memory subsystem | |||||
| L1 Cache (KiB) | 32 private | 32 private | 64 private | 32 private | 64 private |
| L2 Cache (MiB) | 1 private | 0.5 shared | 32 shared | 0.5 shared | 0.5 private |
| L3 Cache (MiB) | 33 shared | 16 shared | - | 1 shared | 32 shared |
| Main Memory (GB) | 96 | 1024 | 32 | 512 | 256 |
| System software | |||||
| Kernel | Linux/4.4.120 | Linux/4.18.0 | Linux/4.18.0 | Linux/4.14.0 | Linux/4.14.0 |
| OS | SUSE/12.2 | Rocky Linux/8.5 | Red Hat/8.1 | Red Hat/7.5 | CentOS/7 |
| Compiler | intel/2020.1 | intel/2018.4 | arm/20.3 | pgi/20.4 | gcc/11.2.0 |
| PAPI Library | papi/6.0.0 | papi/6.0.0.1 | papi/git-2020-10-08 | papi/6.0.0 | papi/6.0.0.1 |
| MPI Library | impi/2018.4 | impi/2018.4 | openmpi/4.0.5 | openmpi/3.0.0 | openmpi/4.1.3 |
| Tracing Library | extrae/3.8.3 | extrae/3.8.3 | extrae/3.8.3 | extrae/3.8.3 | extrae/3.8.3 |
| Top-Down model | |||||
| Hierarchy levels | 2 | 1 | 3 | 6 | 3 |
| Metrics relative to | Total Slots | Total Slots | Parent metric | Parent metric | Total Slots (Except for memory metrics) |
| Parameters | Pipeline_Width | Pipeline_Width, Mispredict_Cost | - | - | Pipeline_Width |
| Required event sets | 2 | 2 | 3 | 10 | 2 |
Disclaimer/Publisher’s Note: The statements, opinions and data contained in all publications are solely those of the individual author(s) and contributor(s) and not of MDPI and/or the editor(s). MDPI and/or the editor(s) disclaim responsibility for any injury to people or property resulting from any ideas, methods, instructions or products referred to in the content. |
© 2023 by the authors. Licensee MDPI, Basel, Switzerland. This article is an open access article distributed under the terms and conditions of the Creative Commons Attribution (CC BY) license (https://creativecommons.org/licenses/by/4.0/).
Share and Cite
Banchelli, F.; Garcia-Gasulla, M.; Mantovani, F. Top-Down Models across CPU Architectures: Applicability and Comparison in a High-Performance Computing Environment. Information 2023, 14, 554. https://doi.org/10.3390/info14100554
Banchelli F, Garcia-Gasulla M, Mantovani F. Top-Down Models across CPU Architectures: Applicability and Comparison in a High-Performance Computing Environment. Information. 2023; 14(10):554. https://doi.org/10.3390/info14100554
Chicago/Turabian StyleBanchelli, Fabio, Marta Garcia-Gasulla, and Filippo Mantovani. 2023. "Top-Down Models across CPU Architectures: Applicability and Comparison in a High-Performance Computing Environment" Information 14, no. 10: 554. https://doi.org/10.3390/info14100554
APA StyleBanchelli, F., Garcia-Gasulla, M., & Mantovani, F. (2023). Top-Down Models across CPU Architectures: Applicability and Comparison in a High-Performance Computing Environment. Information, 14(10), 554. https://doi.org/10.3390/info14100554