
Analysis of the Correlation between Mass-Media Publication Activity and COVID-19 Epidemiological Situation in Early 2022

 ,
,  , ,
, ,  ,
,  , ,
, , 
Abstract
:1. Introduction
2. Related Works
2.1. AI for Healthcare System Analysis
2.2. NLP and Topic Modeling for Healthcare System Analysis
3. Methods
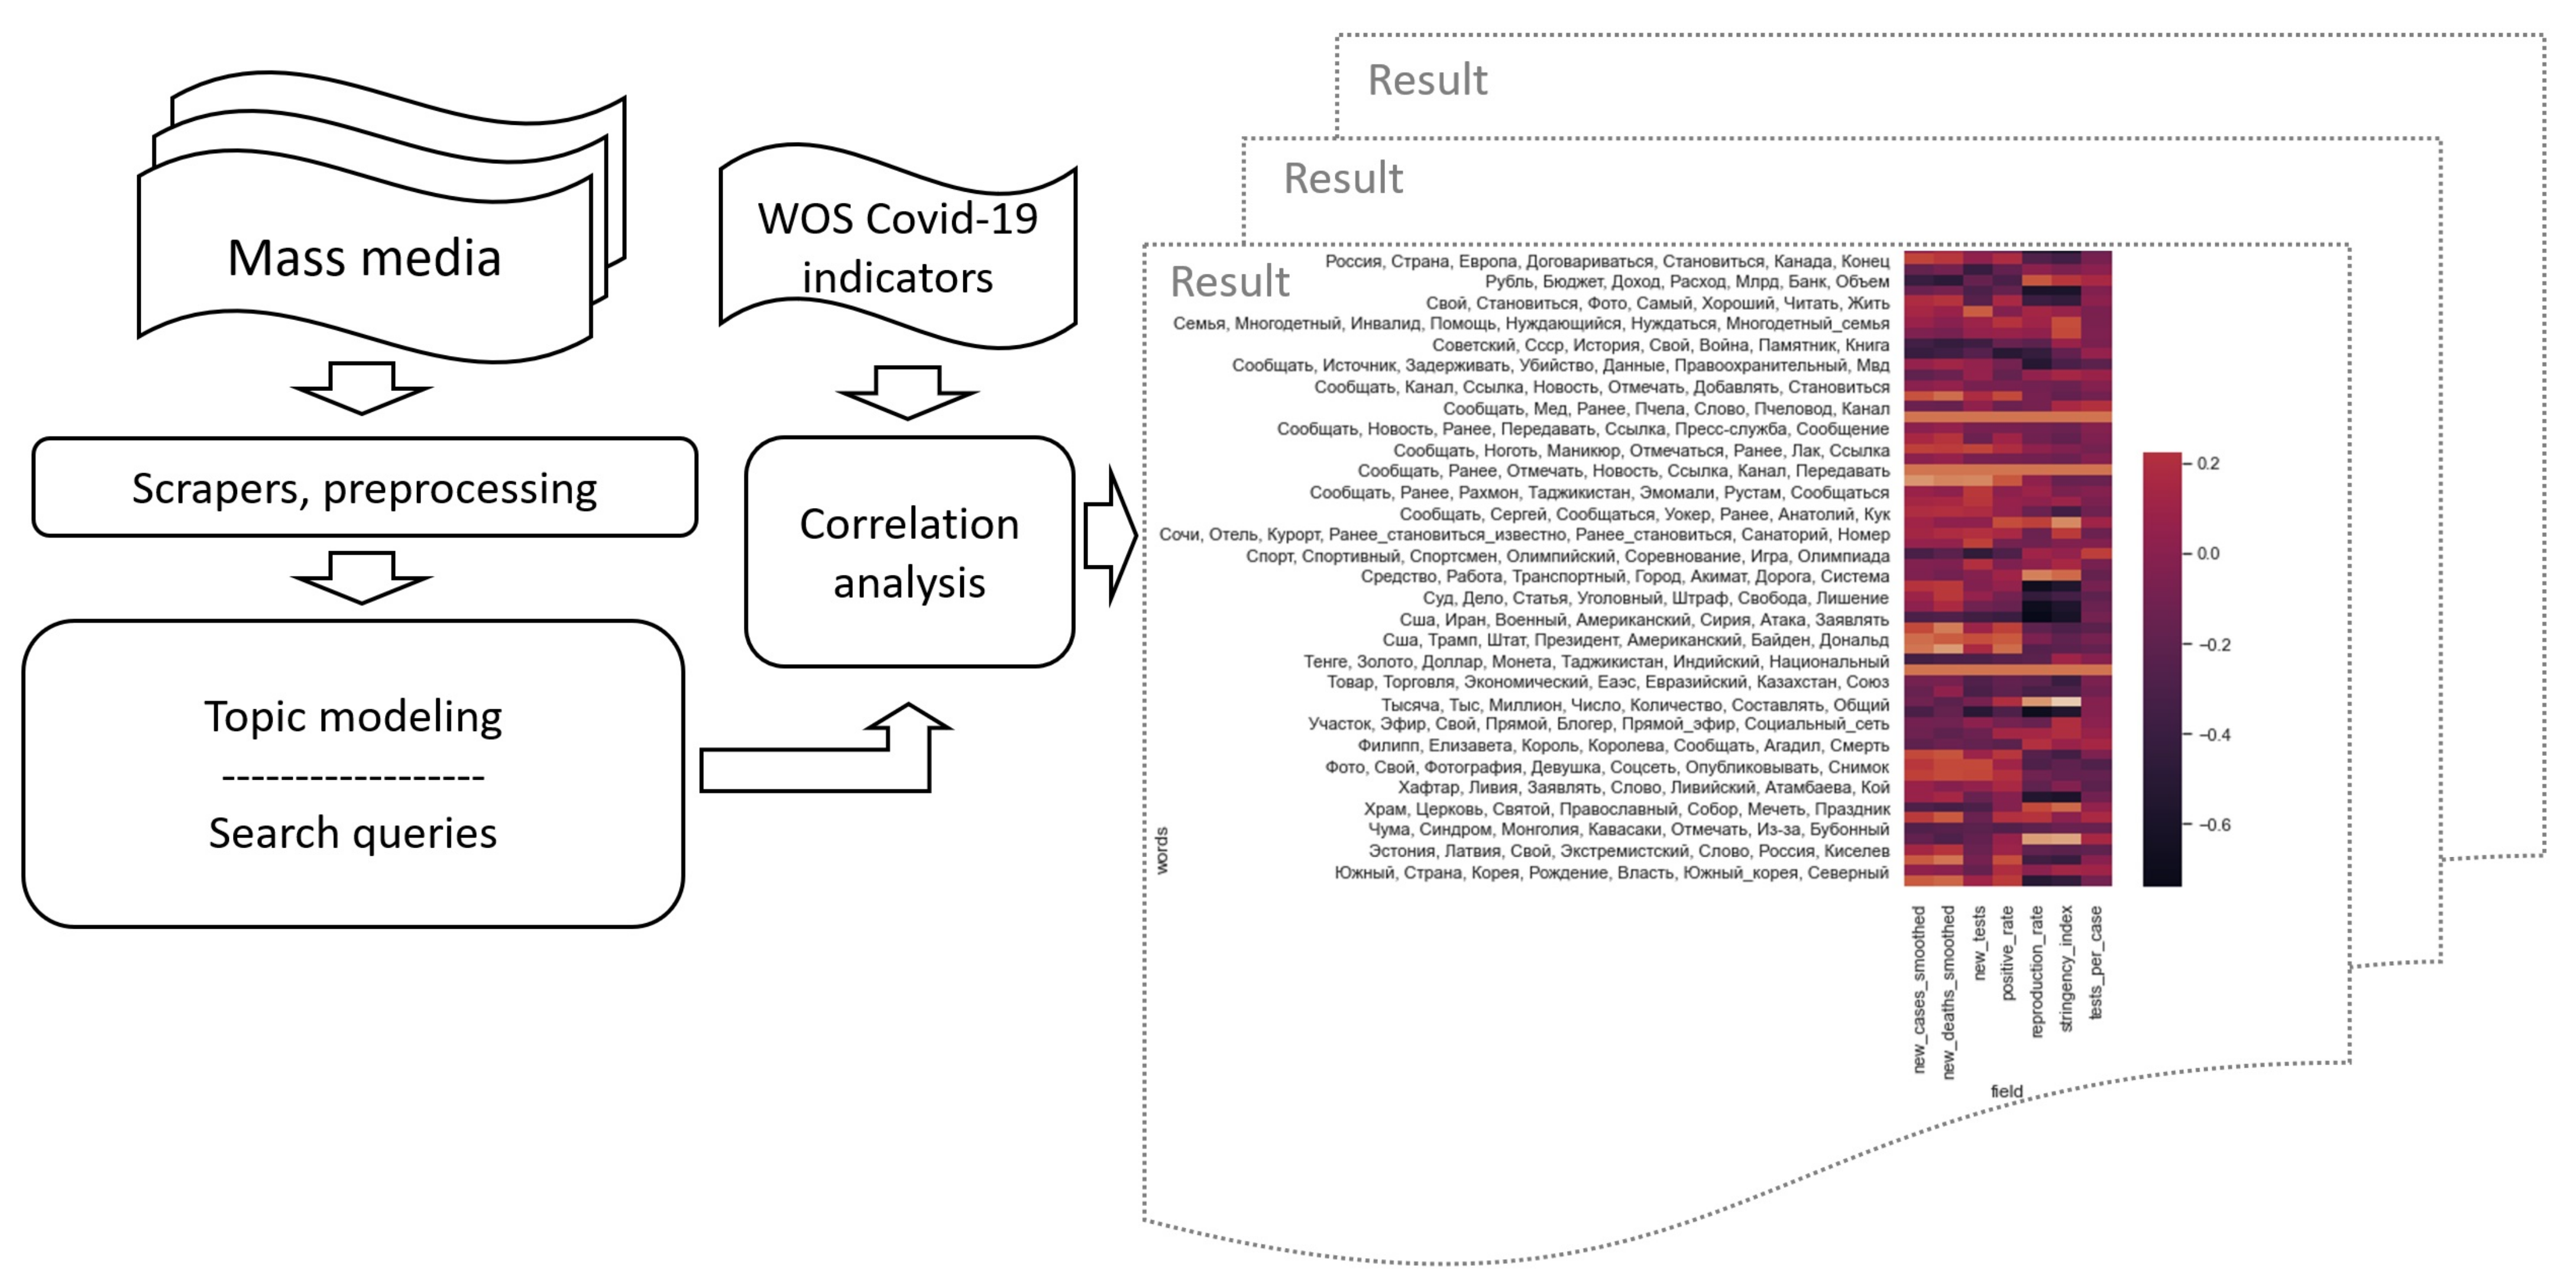
- 1.
- Create a corpus of documents using an automatic data collection system;
- 2.
- Make a hierarchical thematic model using the methods described in [27];
- 3.
- Calculate correlations between groups of dynamic media indicators and objective epidemiological indicators.
3.1. Corpus of Documents
3.2. Preprocessing
3.3. The Creation of a Hierarchical Thematic Model
3.4. Correlation Analysis
3.5. Source Code
3.6. Threats to Validity
4. Results and Discussion
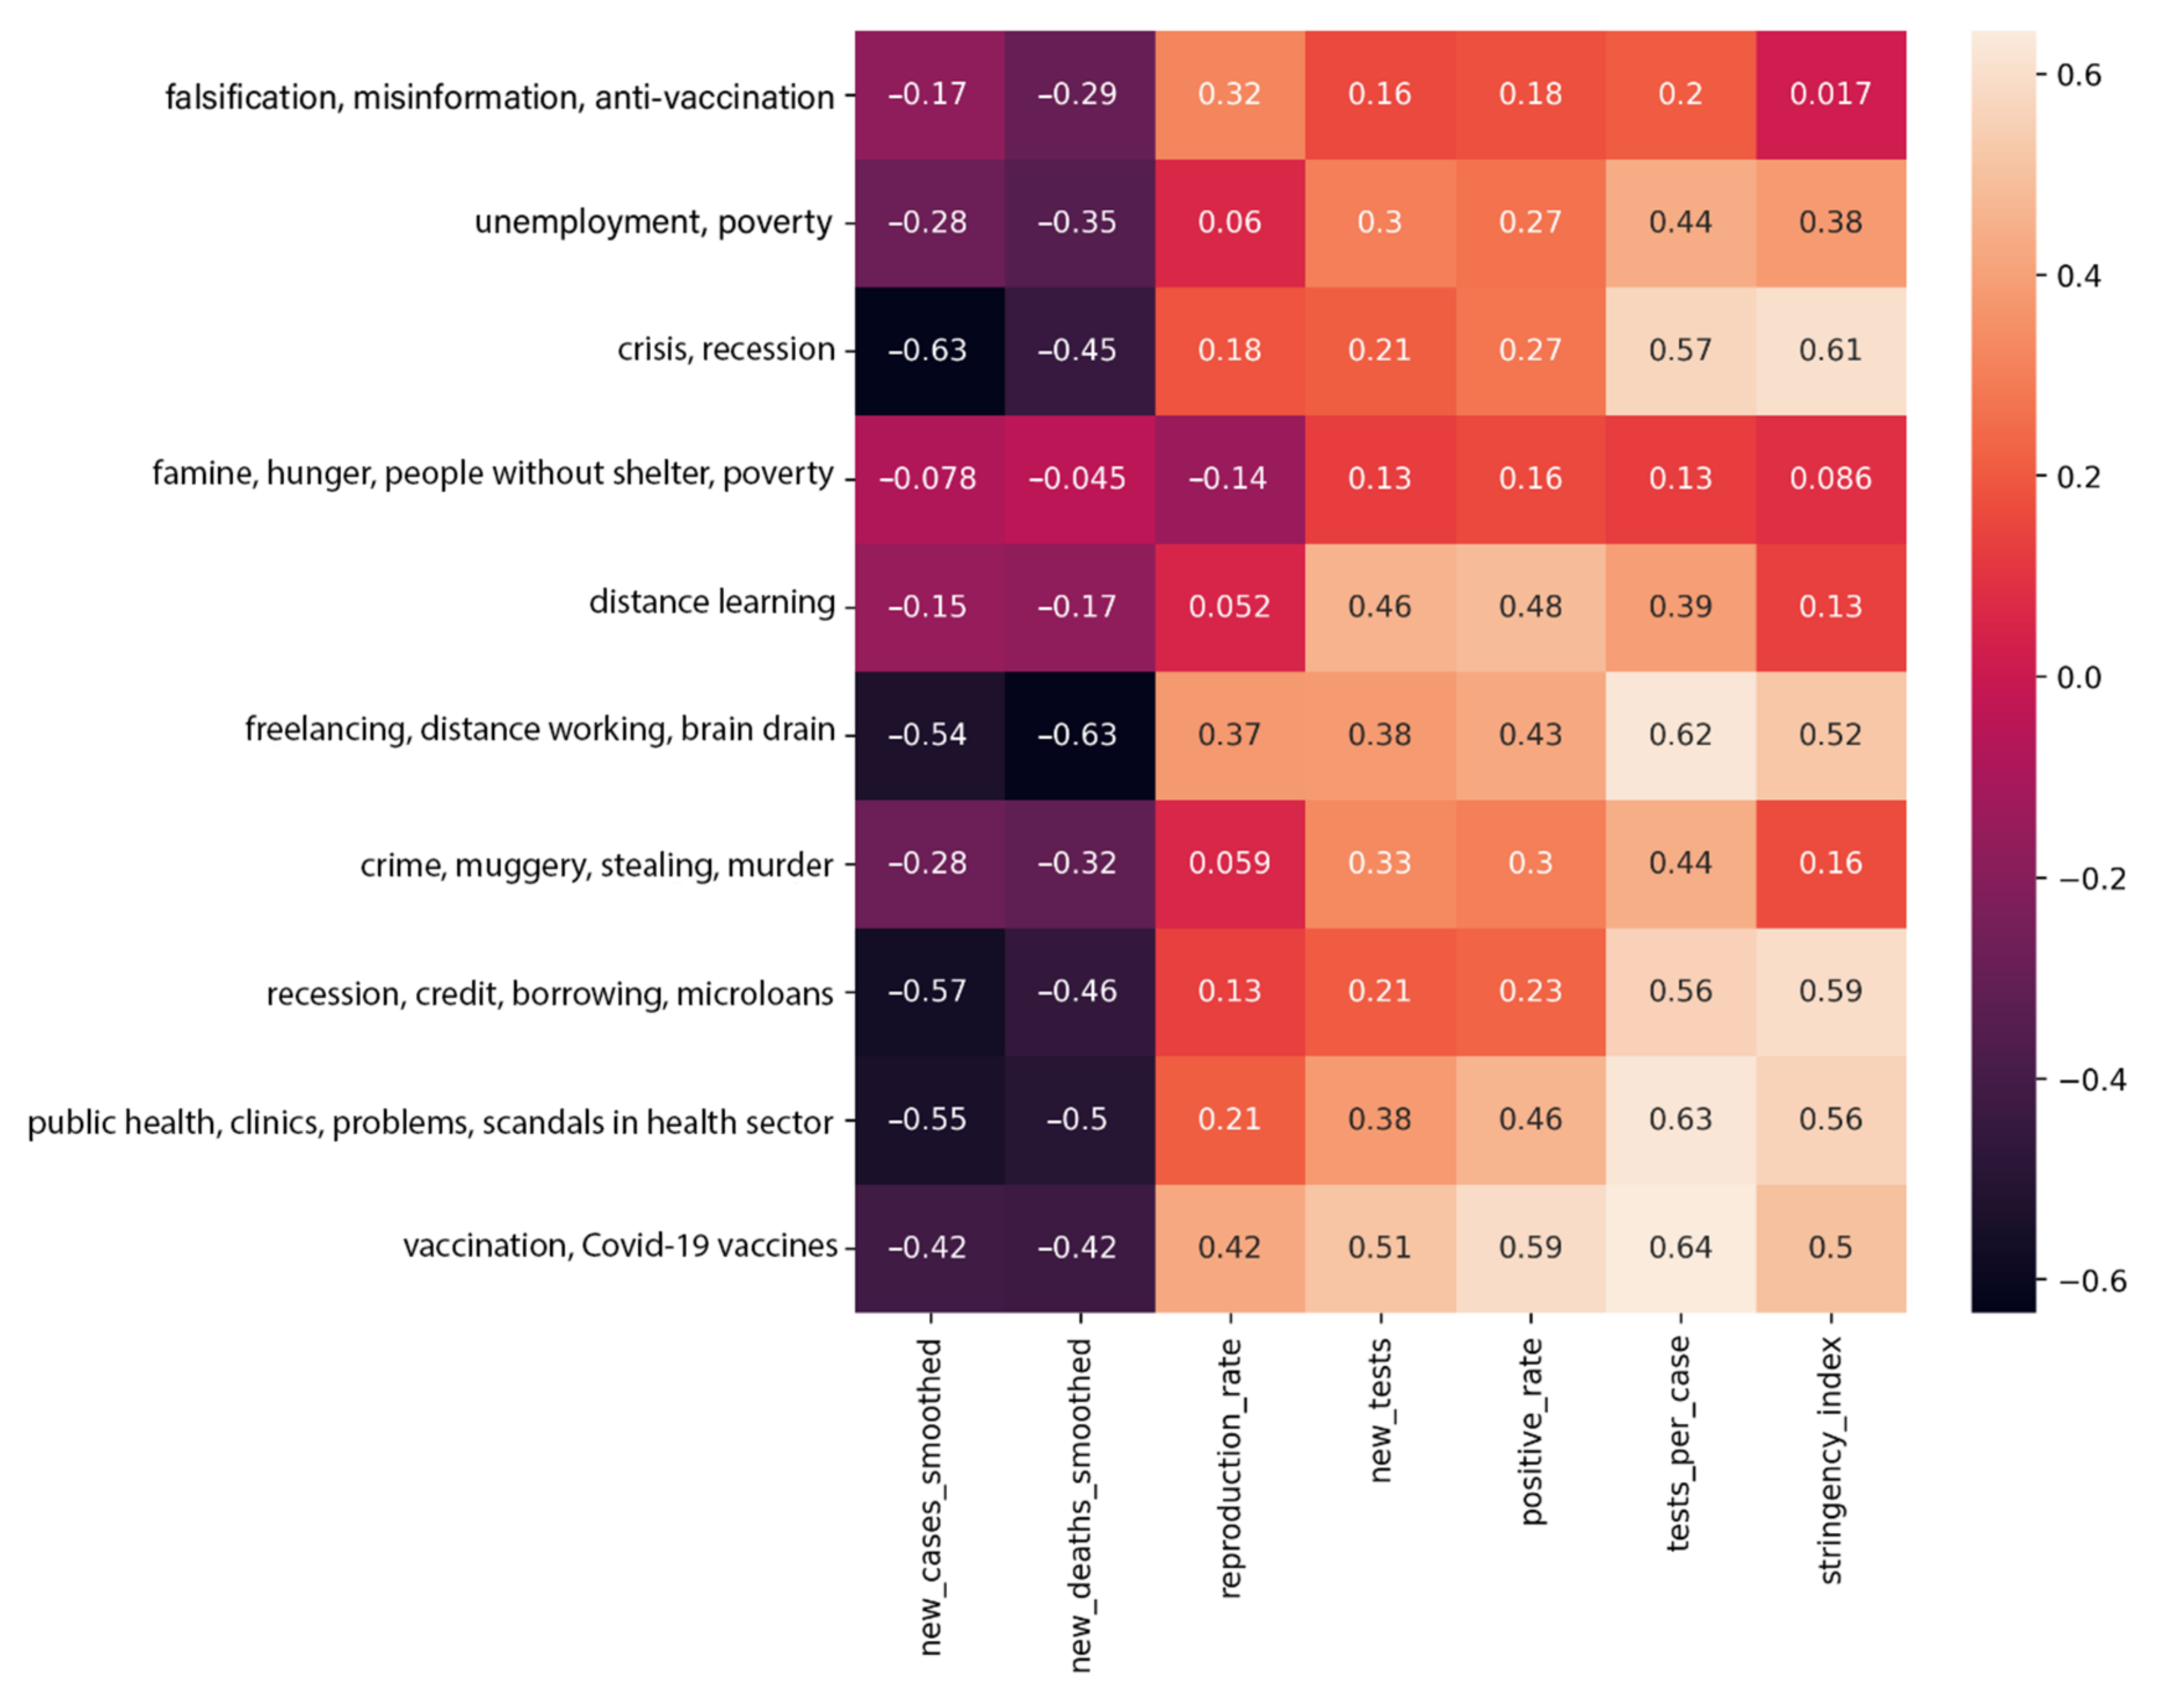
- Falsification, misinformation, anti-vaccination;
- Unemployment, poverty;
- Crisis, recession;
- Famine, hunger, people without shelter, poverty;
- Distance learning;
- Freelancing, distance working, brain drain;
- Crime, muggery, stealing, murder;
- Recession, credit, borrowing, microloans;
- Public health, clinics, problems, scandals in health sector;
- Vaccination, COVID-19 vaccines.
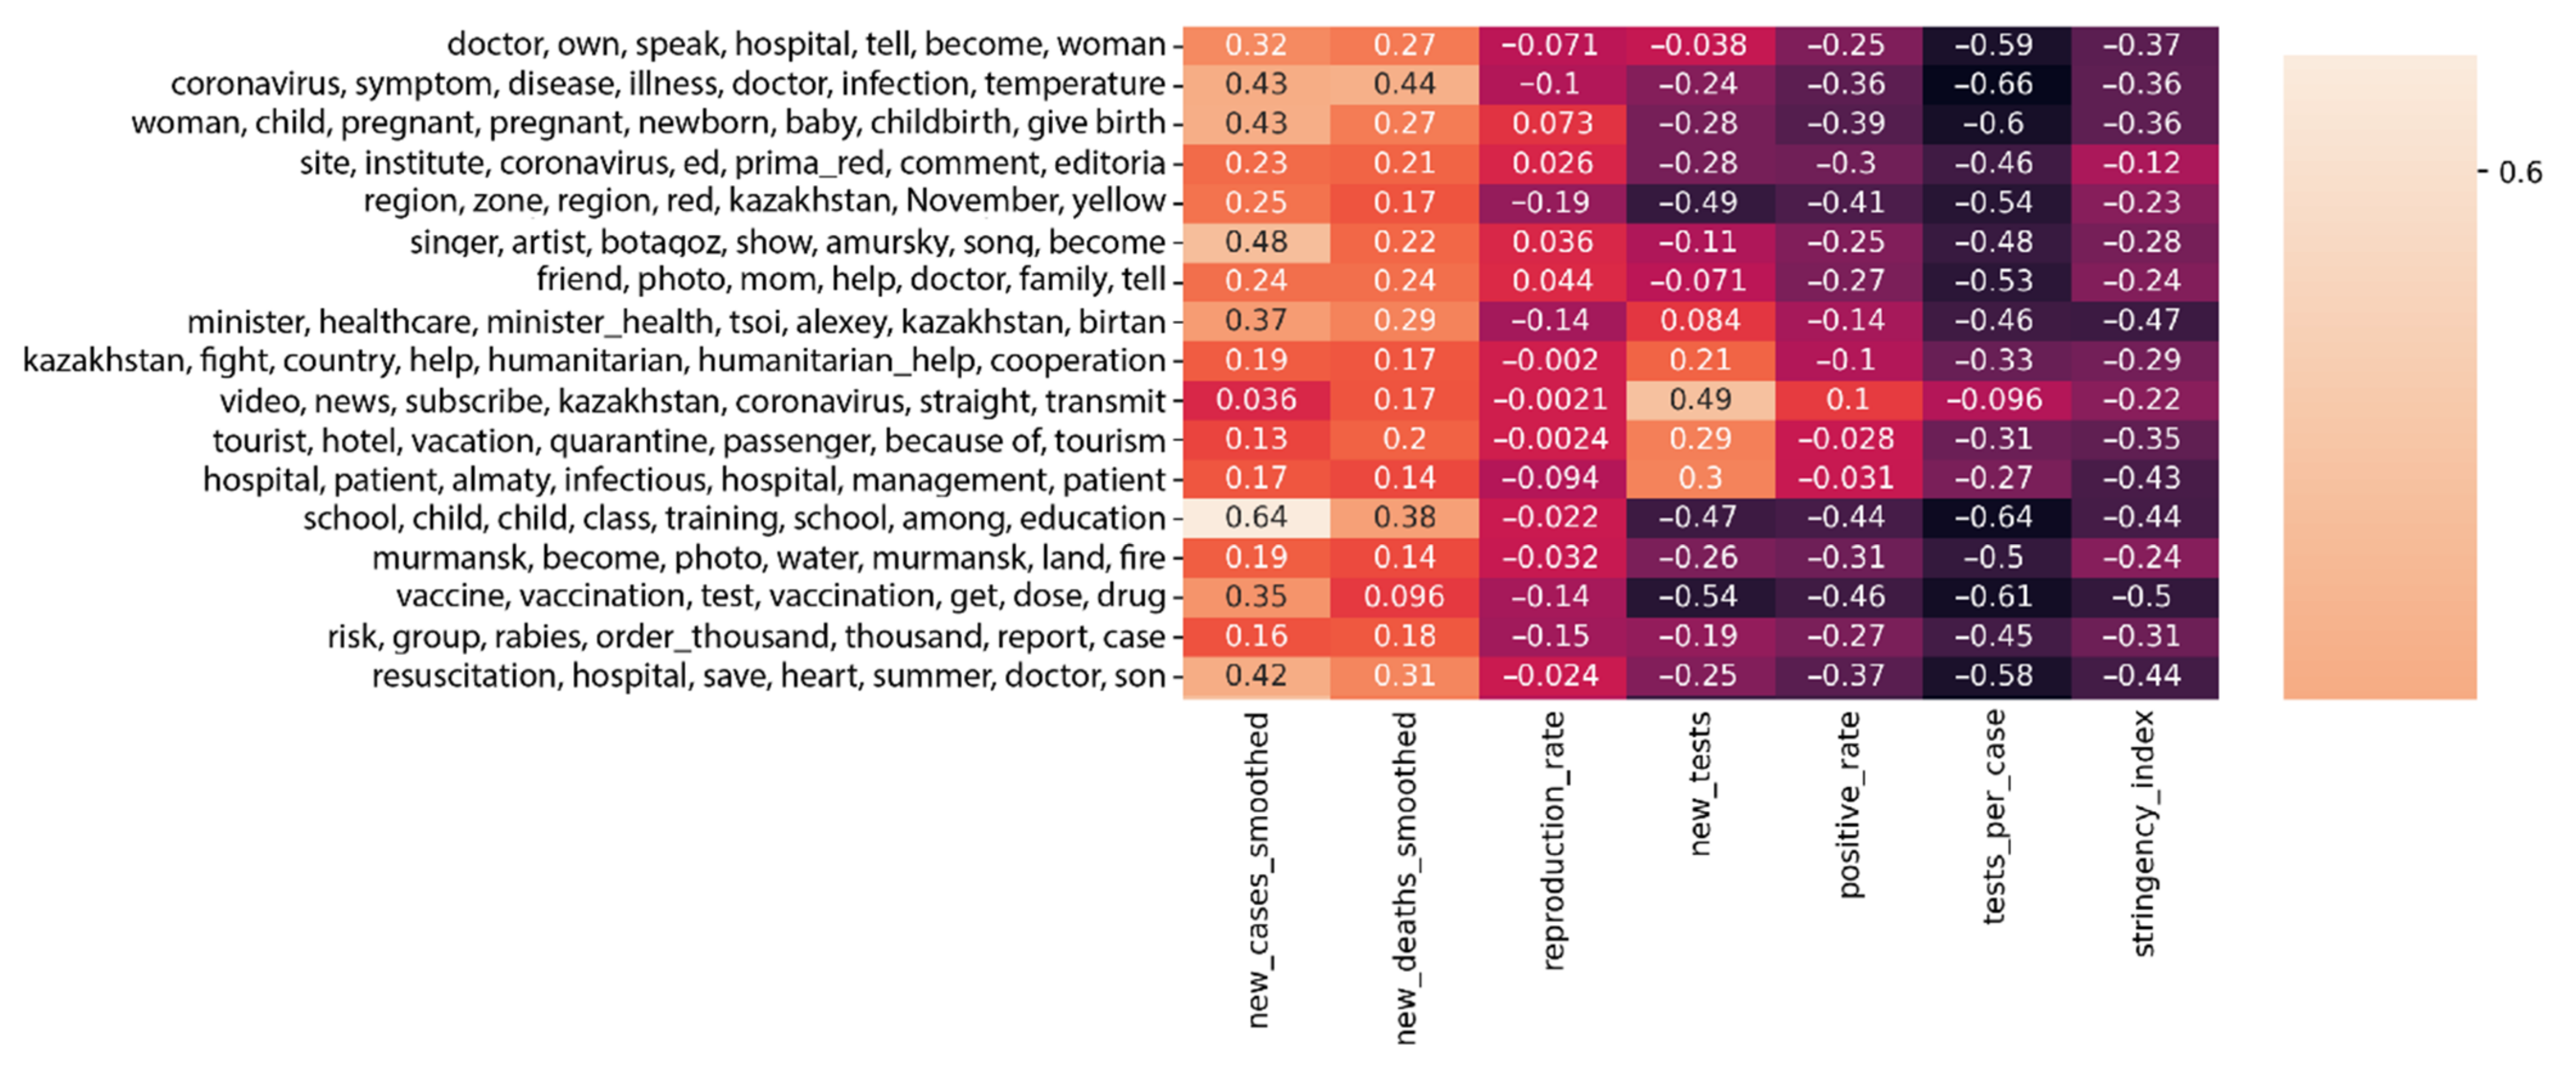
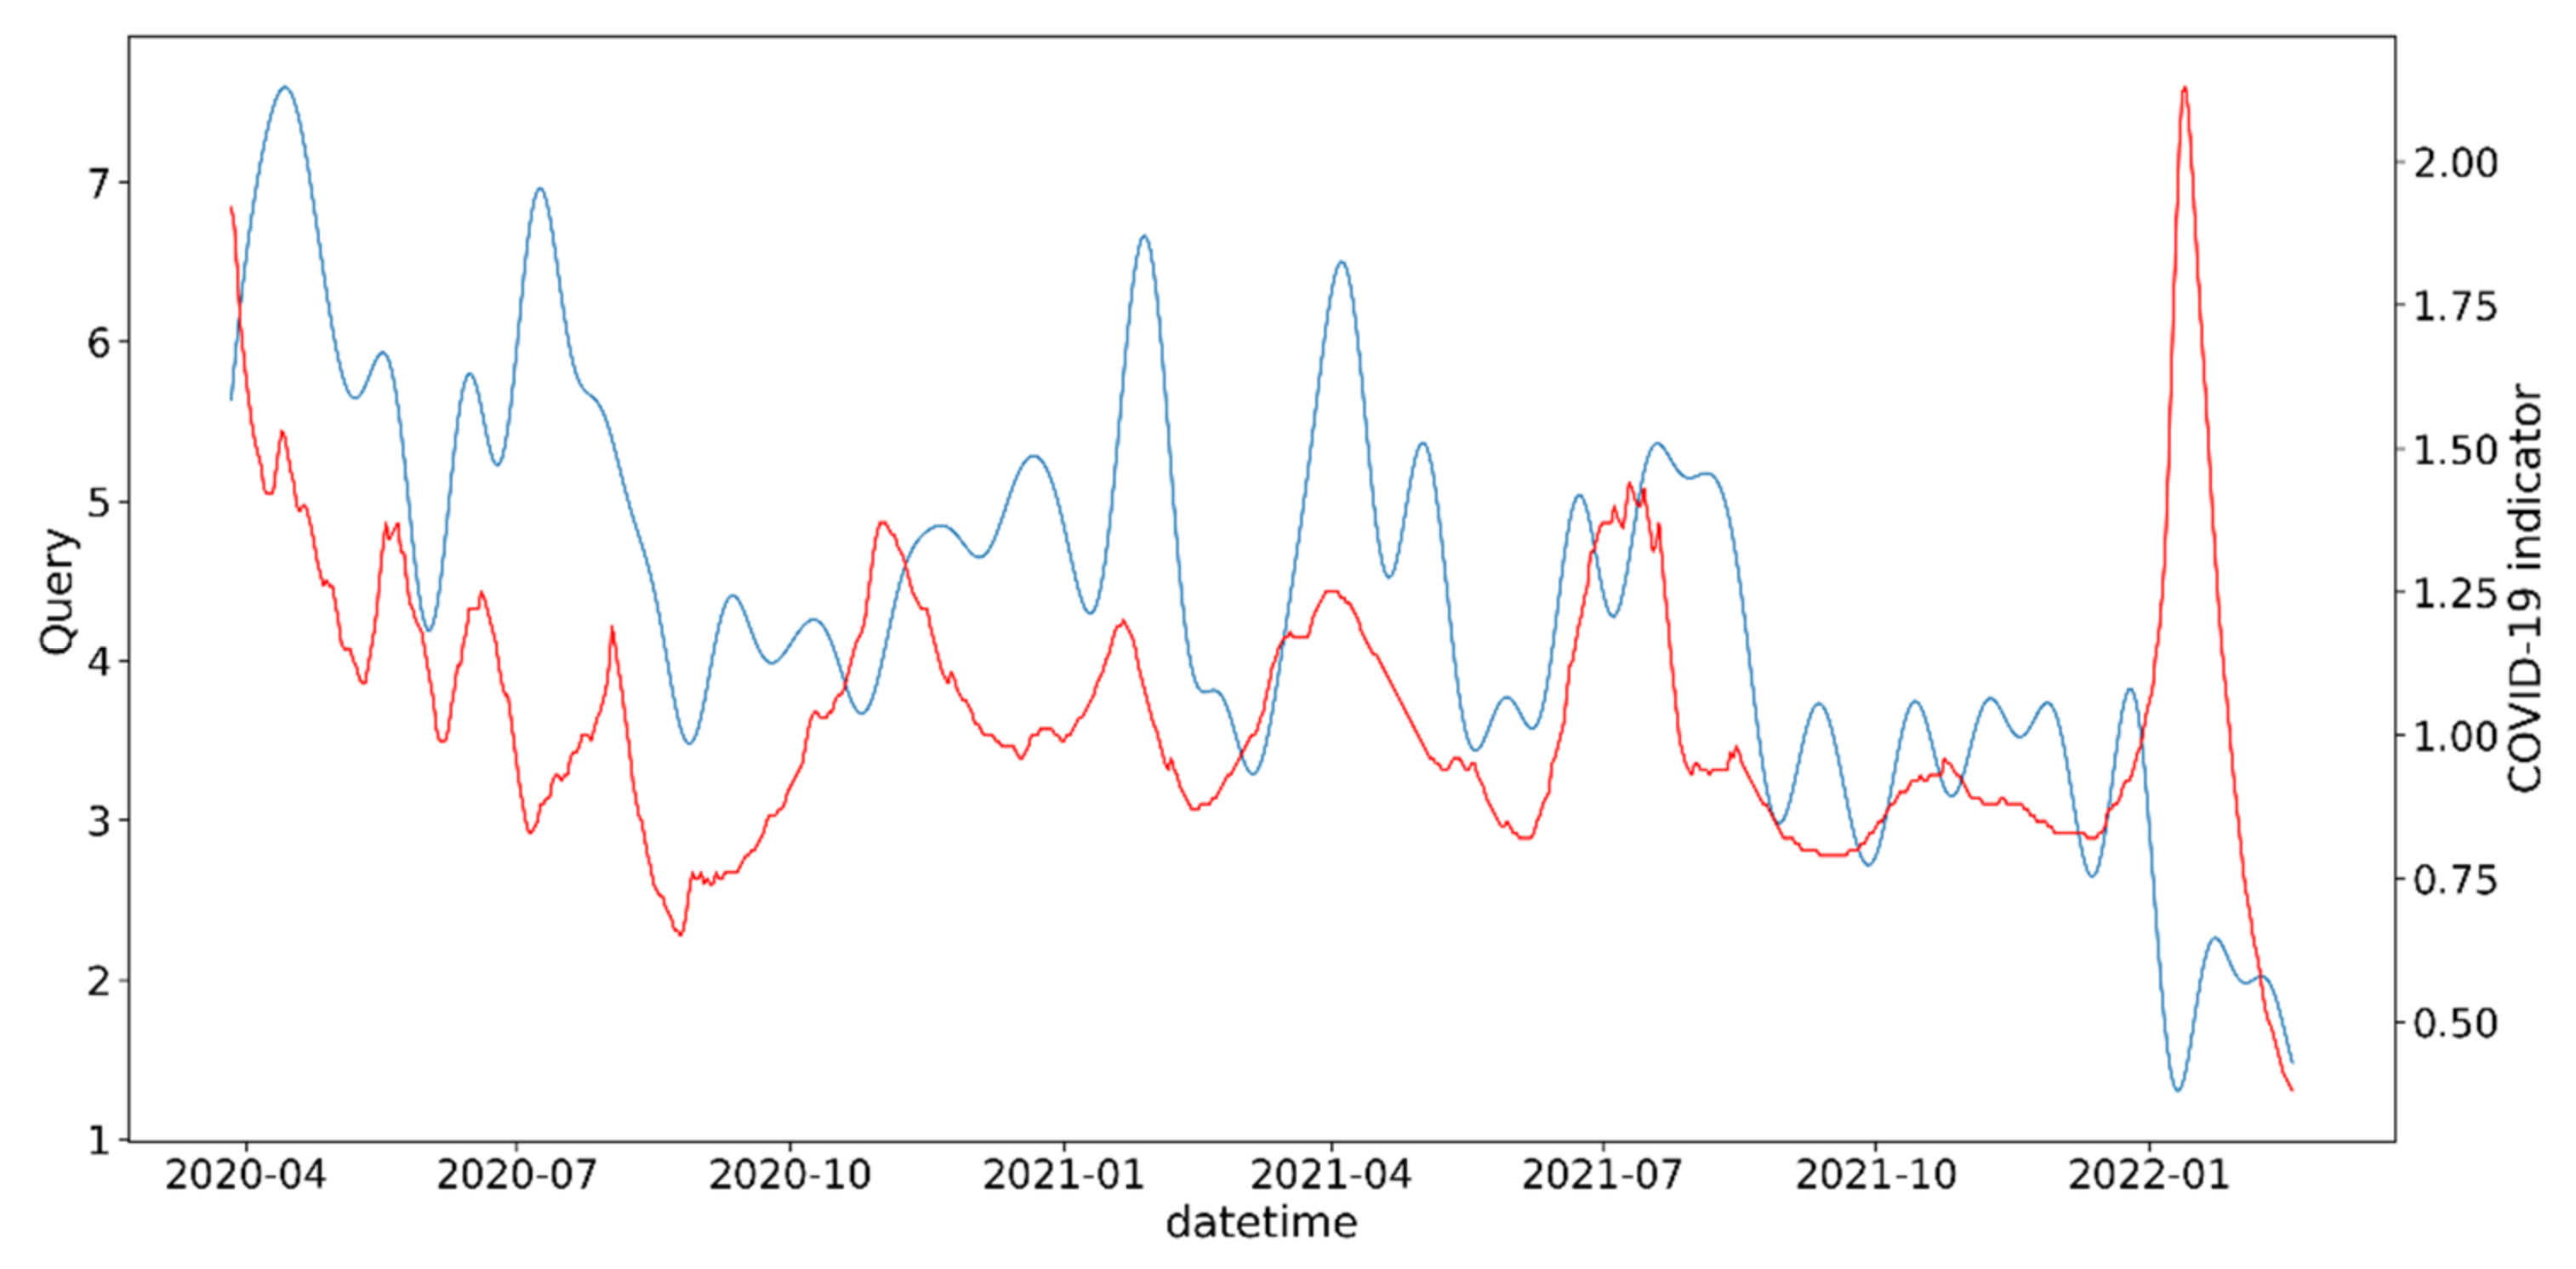
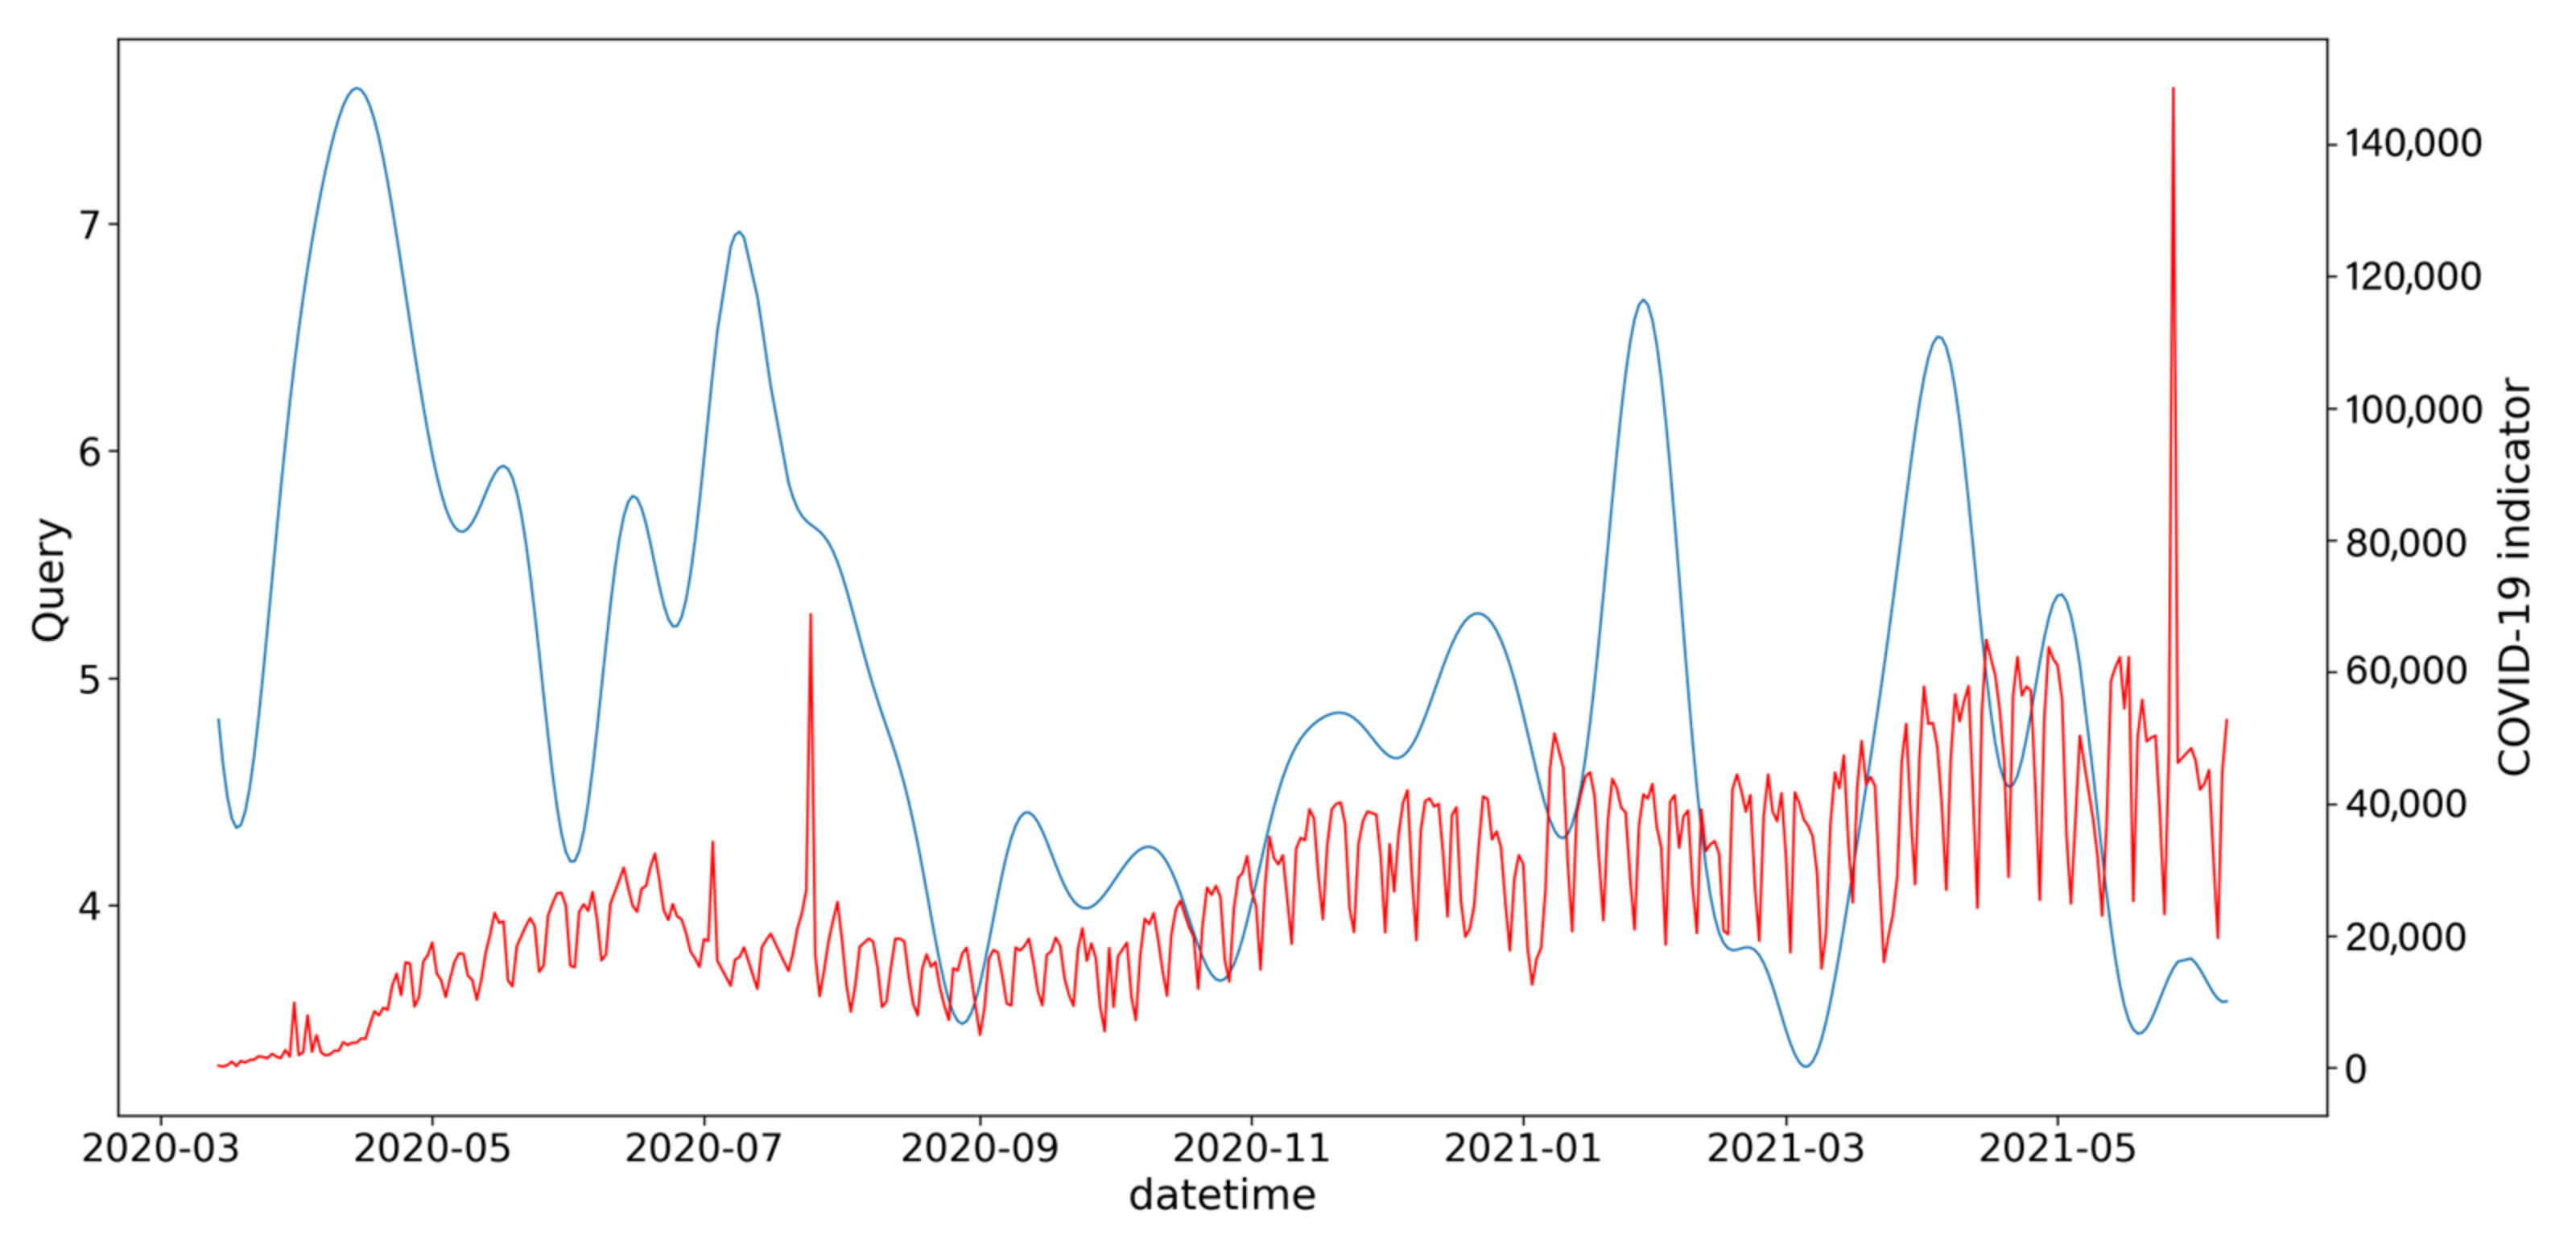
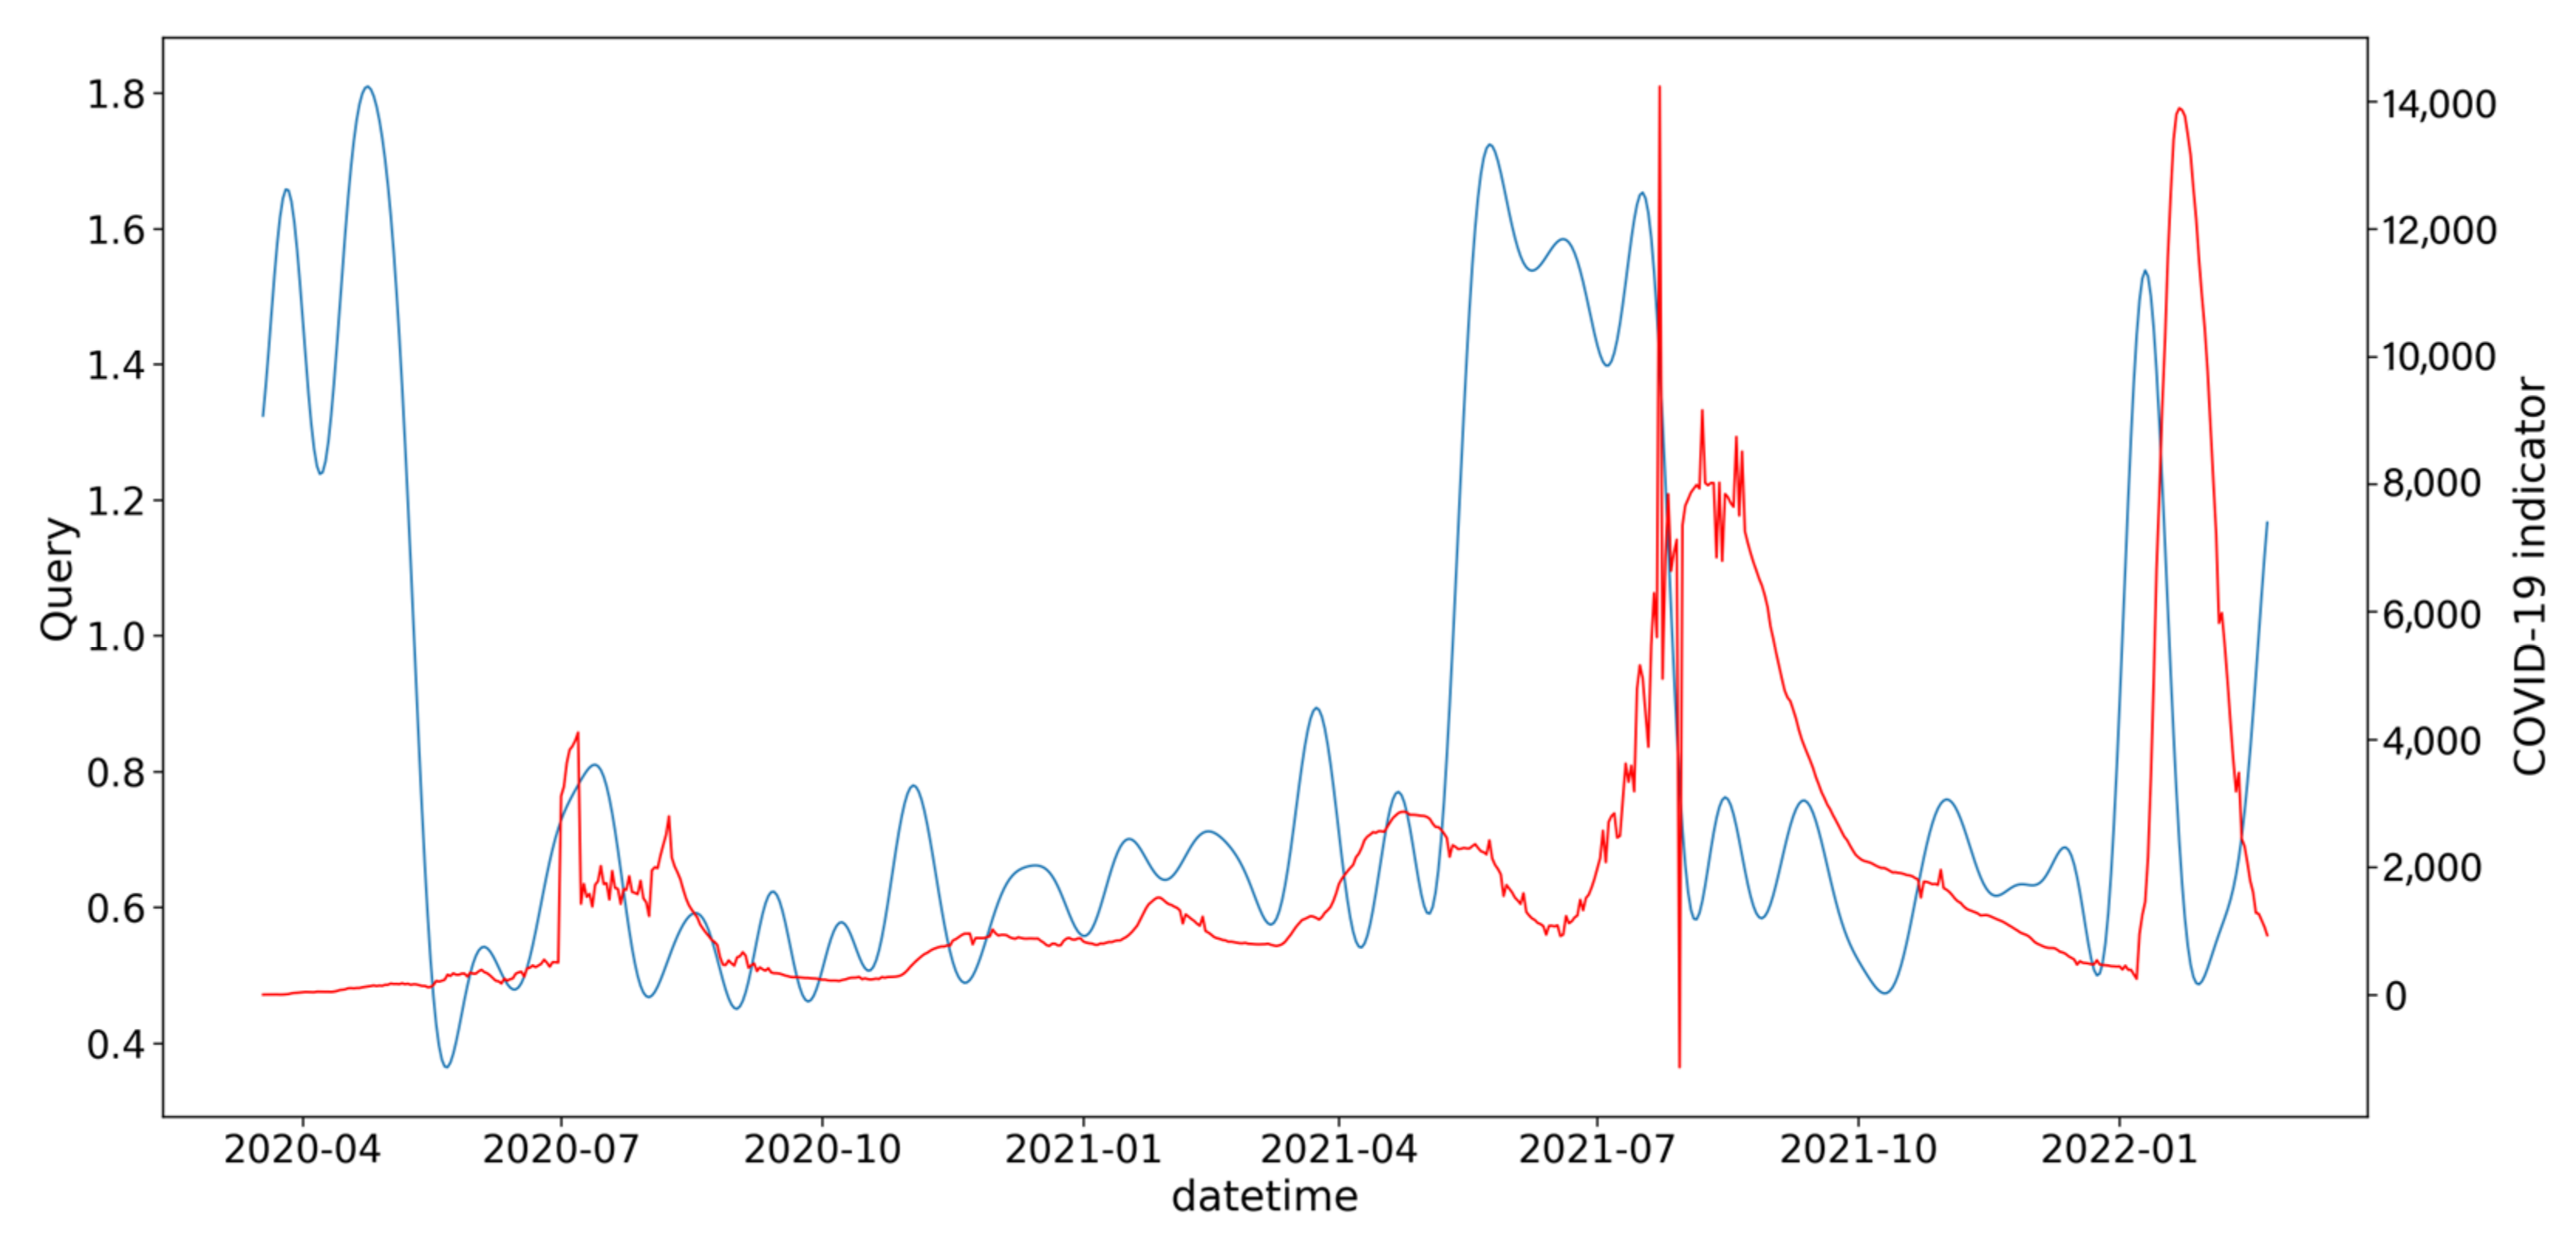
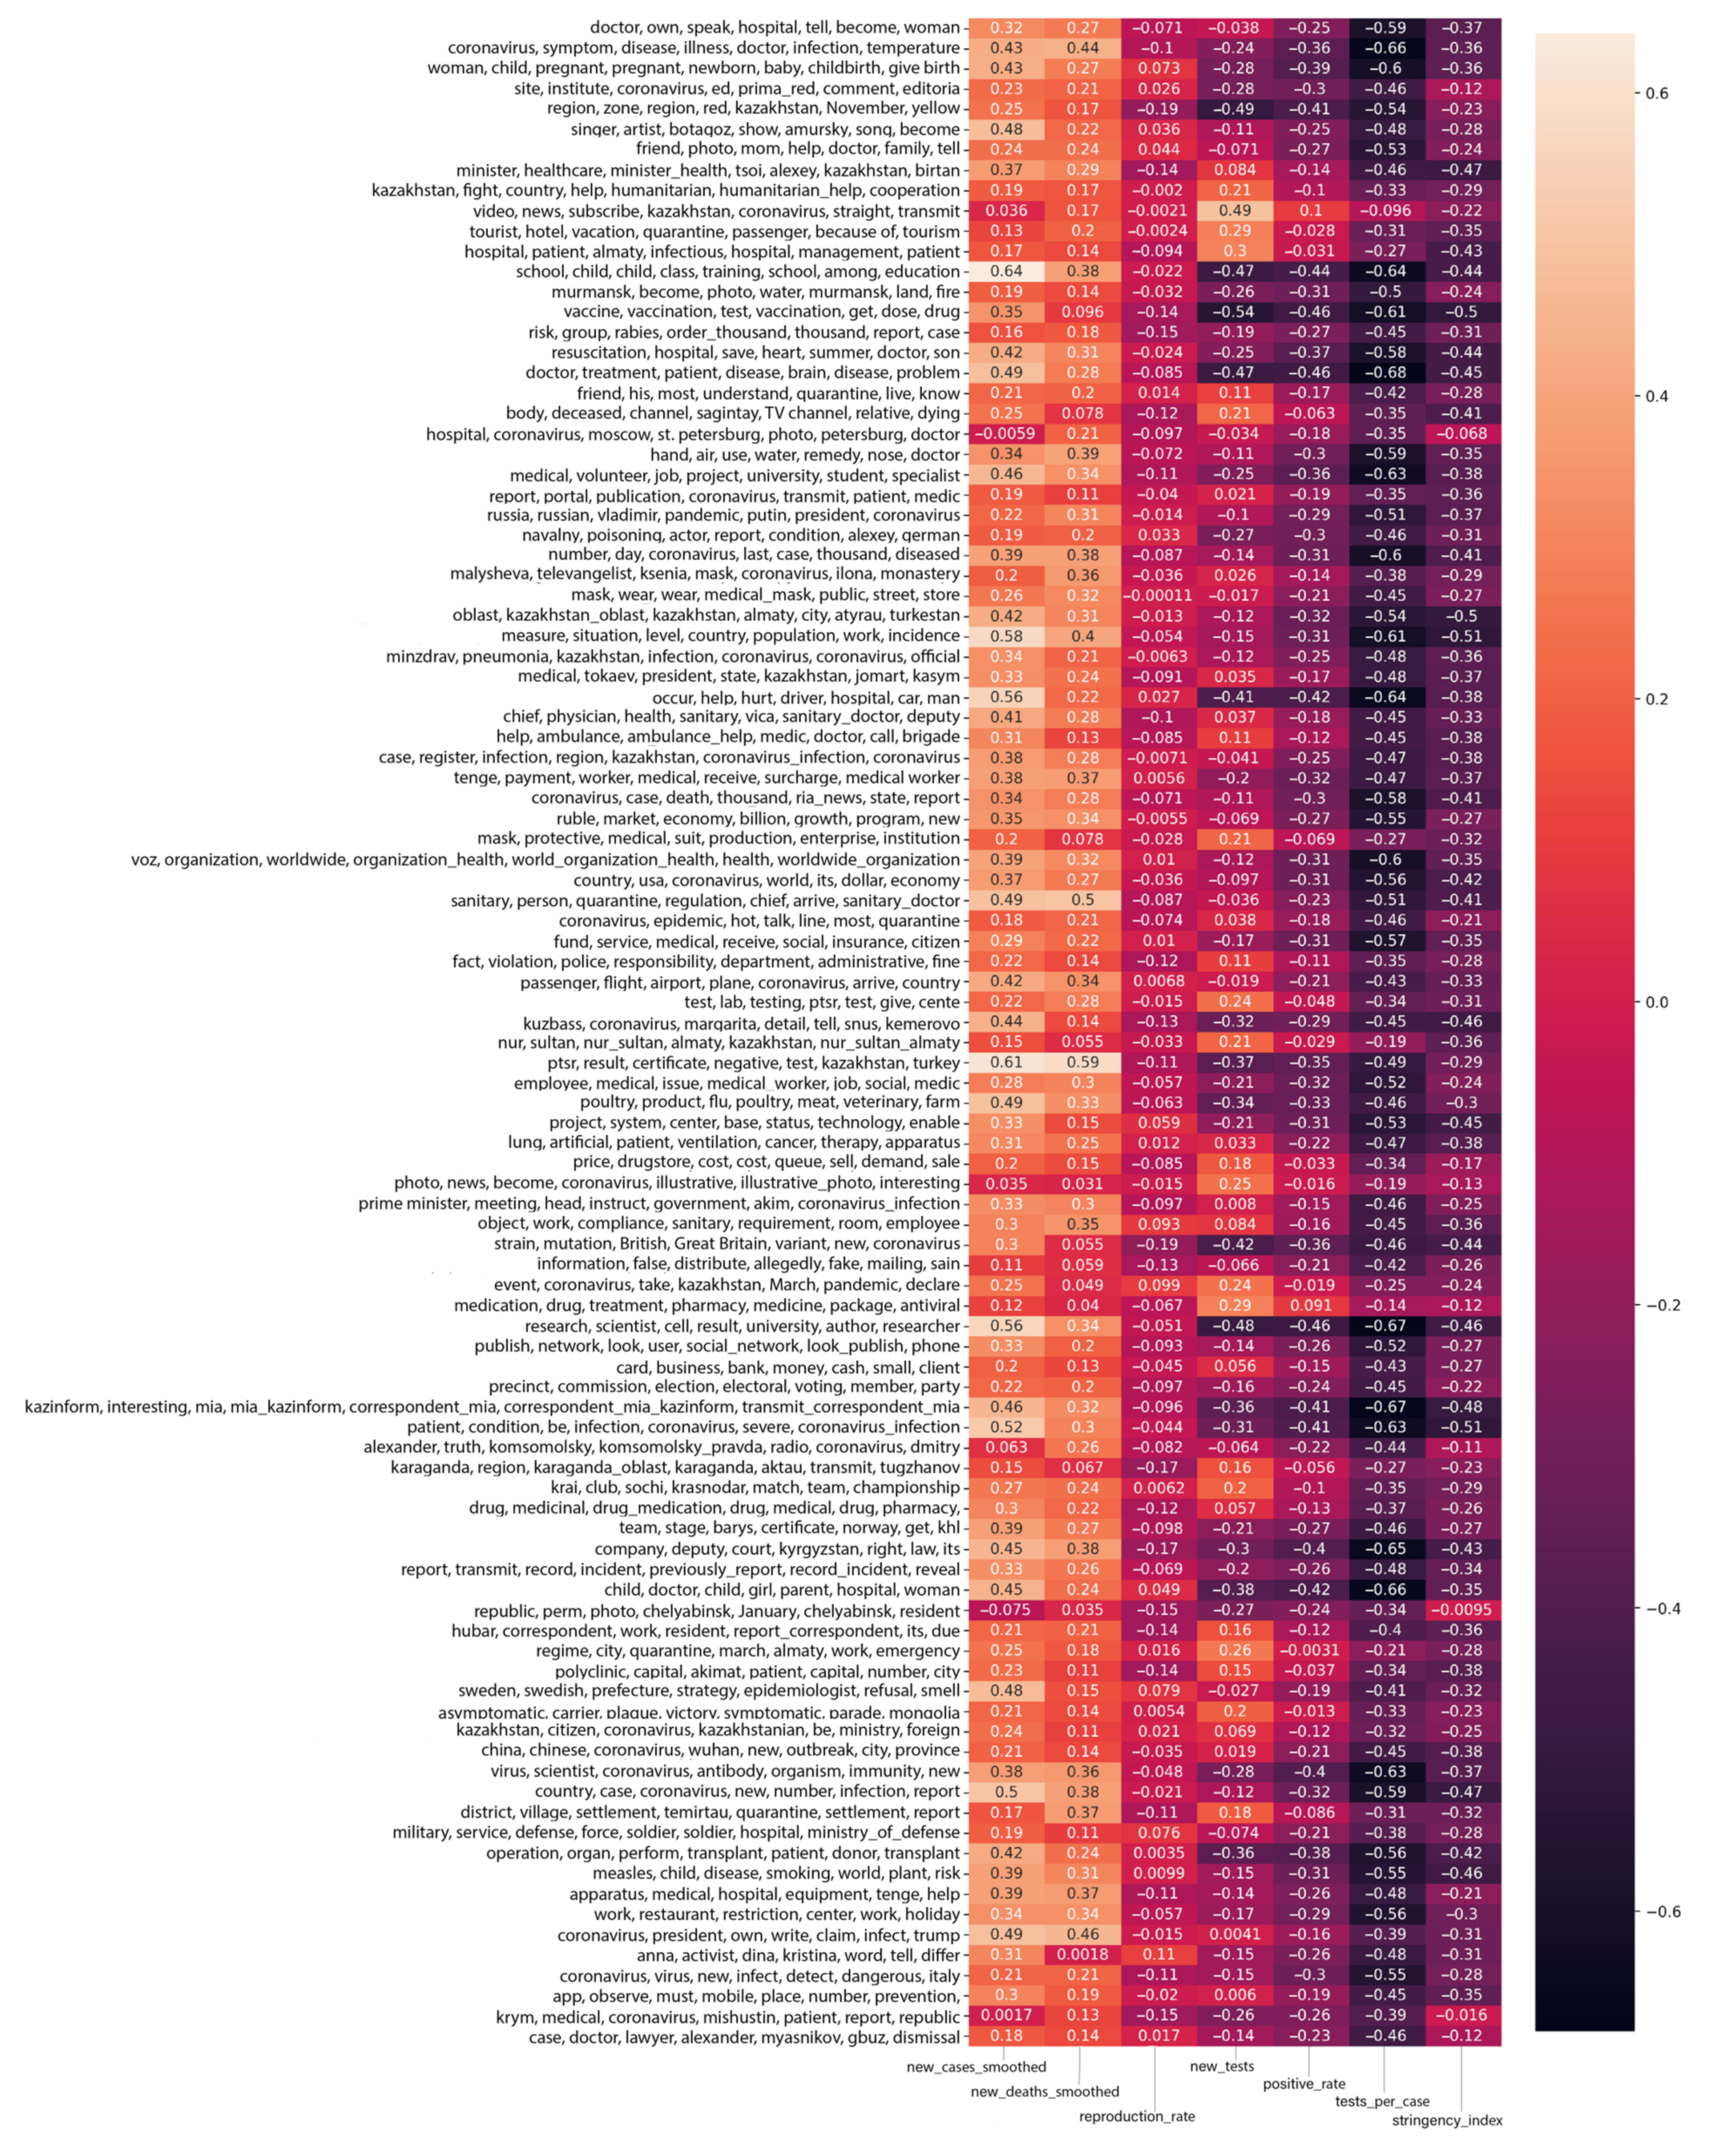
- Overall, the correlation in early 2022 between publication activity and epidemiological indicators fell compared to the first half of 2021. The maximum correlation in 2021 was as high as 0.8, whereas in 2022, it did not exceed 0.6–0.65.
- Compared to the previous study, the correlation with the search queries related to the coverage of the economic crisis, remote work, microcredit, etc., has increased. Particularly evident is the increase in the correlation with the Stringency index, especially in view of the recent abrupt changes in (removing of) quarantine restrictions. At the same time, the correlation with issues related to health care, vaccination, etc., has decreased. This may suggest that the public has become more concerned about pragmatic issues related to quarantine restrictions than health issues themselves.
- In general, the correlation with relative indicators, such as reproduction rate and tests per case, has increased. These indicators more objectively reflect the epidemiological situation, compared to absolute indicators (for example, the number of new cases without the number of tests is essentially a useless indicator). This is a positive indicator that the media has become more reflective to the epidemiological situation in the country compared to the initial period of the pandemic.
5. Conclusions
Author Contributions
Funding
Institutional Review Board Statement
Informed Consent Statement
Data Availability Statement
Conflicts of Interest
Appendix A


Appendix B
References
- Atun, R. Transitioning Health Systems for multimorbidity. Lancet 2015, 386, 721–722. [Google Scholar] [CrossRef]
- Orlov, E.M.; Sokolova, O.N. The category of efficiency in the health care system. Fundam. Res. 2010, 4, 70–75. [Google Scholar]
- Ball-Rokeach, S.J.; DeFleur, M.L. A dependency model of mass-media effects. Commun. Res. 1976, 3, 3–21. [Google Scholar] [CrossRef]
- Zhanabekova, A.; Darzhanova, A.; Tleulesova, A.; Slamgazhy, A.; Toleu, A.; Kislova, A.; Urpekova, A.; Klimchenko, A.; Zhusipbek, G.; Urazova, D.; et al. Kazakhstan and COVID-19: Media, Culture, Politics. Representative Office Friedrich Ebert Foundation in Kazakhstan; DELUXE Printery: Almaty, Kazakhstan, 2021; ISBN 978-601-06-7442-4. [Google Scholar]
- Giri, S.P.; Maurya, A.K. A neglected reality of mass media during COVID-19: Effect of pandemic news on individual’s positive and negative emotion and psychological resilience. Personal. Individ. Differ. 2021, 180, 110962. [Google Scholar] [CrossRef] [PubMed]
- Aslam, F.; Awan, T.M.; Syed, J.H.; Kashif, A.; Parveen, M. Sentiments and emotions evoked by news headlines of coronavirus disease (COVID-19) outbreak. Humanit. Soc. Sci. Commun. 2020, 7, 23. [Google Scholar] [CrossRef]
- Hamidein, Z.; Hatami, J.; Rezapour, T. How people emotionally respond to the news on COVID-19: An online survey. Basic Clin. Neurosci. J. 2020, 11, 171–178. [Google Scholar] [CrossRef]
- Kemp, S. Global Digital Insights. Available online: http://www.datareportal.com/ (accessed on 16 October 2020).
- Mukhamediev, R.I.; Symagulov, A.; Kuchin, Y.; Yakunin, K.; Yelis, M. From classical machine learning to Deep Neural Networks: A simplified scientometric review. Appl. Sci. 2021, 11, 5541. [Google Scholar] [CrossRef]
- Miotto, R.; Wang, F.; Wang, S.; Jiang, X.; Dudley, J.T. Deep Learning for Healthcare: Review, opportunities and challenges. Brief. Bioinform. 2017, 19, 1236–1246. [Google Scholar] [CrossRef]
- Tizhoosh, H.R.; Pantanowitz, L. Artificial intelligence and digital pathology: Challenges and opportunities. J. Pathol. Inform. 2018, 9, 38. [Google Scholar] [CrossRef]
- Mukhamediev, R.I.; Popova, Y.; Kuchin, Y.; Zaitseva, E.; Kalimoldayev, A.; Symagulov, A.; Levashenko, V.; Abdoldina, F.; Gopejenko, V.; Yakunin, K.; et al. Review of Artificial Intelligence and Machine Learning Technologies: Classification, Restrictions, Opportunities and Challenges. Mathematics 2022, 10, 2552. [Google Scholar] [CrossRef]
- The Socio-Economic Impact of AI in Healthcare. October 2020. Available online: https://www.medtecheurope.org/wp-content/uploads/2020/10/mte-ai_impact-in-healthcare_oct2020_report.pdf (accessed on 10 September 2021).
- Pulido, C.M.; Villarejo-Carballido, B.; Redondo-Sama, G.; Gómez, A. COVID-19 infodemic: More retweets for science-based information on coronavirus than for false information. Int. Sociol. 2020, 35, 377–392. [Google Scholar] [CrossRef] [Green Version]
- Gao, J.; Zheng, P.; Jia, Y.; Chen, H.; Mao, Y.; Chen, S.; Wang, Y.; Fu, H.; Dai, J. Mental health problems and social media exposure during COVID-19 outbreak. PLoS ONE 2020, 15, e0231924. [Google Scholar]
- Li, S.; Wang, Y.; Xue, J.; Zhao, N.; Zhu, T. The impact of COVID-19 epidemic declaration on psychological consequences: A study on active weibo users. Int. J. Environ. Res. Public Heal. 2020, 17, 2032. [Google Scholar] [CrossRef]
- Tsao, S.-F.; Chen, H.; Tisseverasinghe, T.; Yang, Y.; Li, L.; Butt, Z.A. What social media told us in the time of COVID-19: A scoping review. Lancet Digit. Health 2021, 3, e175–e194. [Google Scholar] [CrossRef]
- Bou-Karroum, L.; El-Jardali, F.; Hemadi, N.; Faraj, Y.; Ojha, U.; Shahrour, M.; Darzi, A.; Ali, M.; Doumit, C.; Langlois, E.V.; et al. AbouHaidar, G.H.; Akl, E.A. Using media to impact health policy-making: An integrative systematic review. Implement. Sci. 2017, 12, 1–14. [Google Scholar] [CrossRef]
- Rosella, L.C.; Wilson, K.; Crowcroft, N.S.; Chu, A.; Upshur, R.; Willison, D.; Deeks, S.L.; Schwartz, B.; Tustin, J.; Sider, D.; et al. Pandemic H1N1 in Canada and the use of evidence in developing public health policies–A policy analysis. Soc. Sci. Med. 2013, 83, 1–9. [Google Scholar] [CrossRef]
- Bennett, W.L.; Lawrence, R.G.; Livingston, S. When the Press Fails; University of Chicago Press: Chicago, IL, USA, 2007. [Google Scholar]
- Al-Jefri, M.; Evans, R.; Lee, J.; Ghezzi, P. Automatic identification of information quality metrics in health news stories. Front. Public Health 2020, 8, 515347. [Google Scholar] [CrossRef]
- Mashechkin, I.; Petrovsky, M.; Tsarev, D. Methods for Calculating the Relevance of Text Fragments Based on Thematic Models in the Automatic Annotation Problem. Comput. Methods Program. 2013, 14, 91–102. [Google Scholar]
- Parhomenko, P.A.; Grigorev, A.A.; Astrakhantsev, N.A. A survey and an experimental comparison of methods for text clustering: Application to scientific articles. Proc. Inst. Syst. Program. RAS 2017, 29, 161–200. [Google Scholar] [CrossRef]
- Dieng, A.B.; Ruiz, F.J.; Blei, D.M. Topic modeling in embedding spaces. Trans. Assoc. Comput. Linguist. 2020, 8, 439–453. [Google Scholar] [CrossRef]
- Blei, D.; Ng, A.; Jordan, M. Latent Dirichlet Allocation. J. Mach. Learn. Res. 2003, 3, 993–1022. [Google Scholar]
- Vorontsov, K.; Frei, O.; Apishev, M.; Romov, P.; Dudarenko, M. BigARTM: Open Source Library for Regularized Multimodal Topic Modeling of Large Collections. In Proceedings of the International Conference on Analysis of Images, Social Networks and Texts, Yekaterinburg, Russia, 9–11 April 2015; pp. 370–381. [Google Scholar]
- Mukhamediev, R.I.; Yakunin, K.; Mussabayev, R.; Buldybayev, T.; Kuchin, Y.; Murzakhmetov, S.; Yelis, M. Classification of negative information on socially significant topics in mass media. Symmetry 2020, 12, 1945. [Google Scholar] [CrossRef]
- Yakunin, K.; Kalimoldayev, M.; Mukhamediev, R.I.; Mussabayev, R.; Barakhnin, V.; Kuchin, Y.; Murzakhmetov, S.; Buldybayev, T.; Ospanova, U.; Yelis, M.; et al. KazNewsDataset: Single Country Overall Digital Mass Media Publication Corpus. Data 2021, 6, 31. [Google Scholar] [CrossRef]
- Jelodar, H.; Wang, Y.; Yuan, C.; Feng, X.; Jiang, X.; Li, Y.; Zhao, L. Latent dirichlet allocation (LDA) and topic modeling: Models, applications, a survey. Multimed. Tools Appl. 2018, 78, 15169–15211. [Google Scholar] [CrossRef] [Green Version]
- Yakunin, K.; Mukhamediev, R.I.; Zaitseva, E.; Levashenko, V.; Yelis, M.; Symagulov, A.; Kuchin, Y.; Muhamedijeva, E.; Aubakirov, M.; Gopejenko, V. Mass media as a mirror of the COVID-19 pandemic. Computation 2021, 9, 140. [Google Scholar] [CrossRef]
- Dong, E.; Du, H.; Gardner, L. An interactive web-based dashboard to track COVID-19 in Real time. Lancet Infect. Dis. 2020, 20, 533–534. [Google Scholar] [CrossRef]
- Yakunin, K. Media Monitoring System. Available online: https://github.com/KindYAK/NLPMonitor (accessed on 8 August 2022).
- Yakunin, K. Airflow DAGs for NLPMonitor. Available online: https://github.com/kindyak/nlpmonitor-dags (accessed on 8 August 2022).
- Marutho, D.; Hendra Handaka, S.; Wijaya, E. Muljono The determination of cluster number at K-mean using elbow method and purity evaluation on Headline news. In Proceedings of the 2018 International Seminar on Application for Technology of Information and Communication, Semarang, Indonesia, 21–22 September 2018. [Google Scholar]


Publisher’s Note: MDPI stays neutral with regard to jurisdictional claims in published maps and institutional affiliations. |
© 2022 by the authors. Licensee MDPI, Basel, Switzerland. This article is an open access article distributed under the terms and conditions of the Creative Commons Attribution (CC BY) license (https://creativecommons.org/licenses/by/4.0/).
Share and Cite
Yakunin, K.; Mukhamediev, R.I.; Yelis, M.; Kuchin, Y.; Symagulov, A.; Levashenko, V.; Zaitseva, E.; Aubakirov, M.; Yunicheva, N.; Muhamedijeva, E.; et al. Analysis of the Correlation between Mass-Media Publication Activity and COVID-19 Epidemiological Situation in Early 2022. Information 2022, 13, 434. https://doi.org/10.3390/info13090434
Yakunin K, Mukhamediev RI, Yelis M, Kuchin Y, Symagulov A, Levashenko V, Zaitseva E, Aubakirov M, Yunicheva N, Muhamedijeva E, et al. Analysis of the Correlation between Mass-Media Publication Activity and COVID-19 Epidemiological Situation in Early 2022. Information. 2022; 13(9):434. https://doi.org/10.3390/info13090434
Chicago/Turabian StyleYakunin, Kirill, Ravil I. Mukhamediev, Marina Yelis, Yan Kuchin, Adilkhan Symagulov, Vitaly Levashenko, Elena Zaitseva, Margulan Aubakirov, Nadiya Yunicheva, Elena Muhamedijeva, and et al. 2022. "Analysis of the Correlation between Mass-Media Publication Activity and COVID-19 Epidemiological Situation in Early 2022" Information 13, no. 9: 434. https://doi.org/10.3390/info13090434
APA StyleYakunin, K., Mukhamediev, R. I., Yelis, M., Kuchin, Y., Symagulov, A., Levashenko, V., Zaitseva, E., Aubakirov, M., Yunicheva, N., Muhamedijeva, E., Gopejenko, V., & Popova, Y. (2022). Analysis of the Correlation between Mass-Media Publication Activity and COVID-19 Epidemiological Situation in Early 2022. Information, 13(9), 434. https://doi.org/10.3390/info13090434