
Q4EDA: A Novel Strategy for Textual Information Retrieval Based on User Interactions with Visual Representations of Time Series


Abstract
:1. Introduction
- A conversion technique to transform visual selection queries into valid and stable search queries usable in general-purpose search engines;
- A strategy to expand the converted search query to better retrieve related text documents and provide suggestion ranking lists with data related to the visual selection query;
- An exploratory data analysis application example that uses Q4EDA in practice to provide means to find more (textual) information related to an observed pattern compared to the standard manual keyword-based queries.
2. Related Work
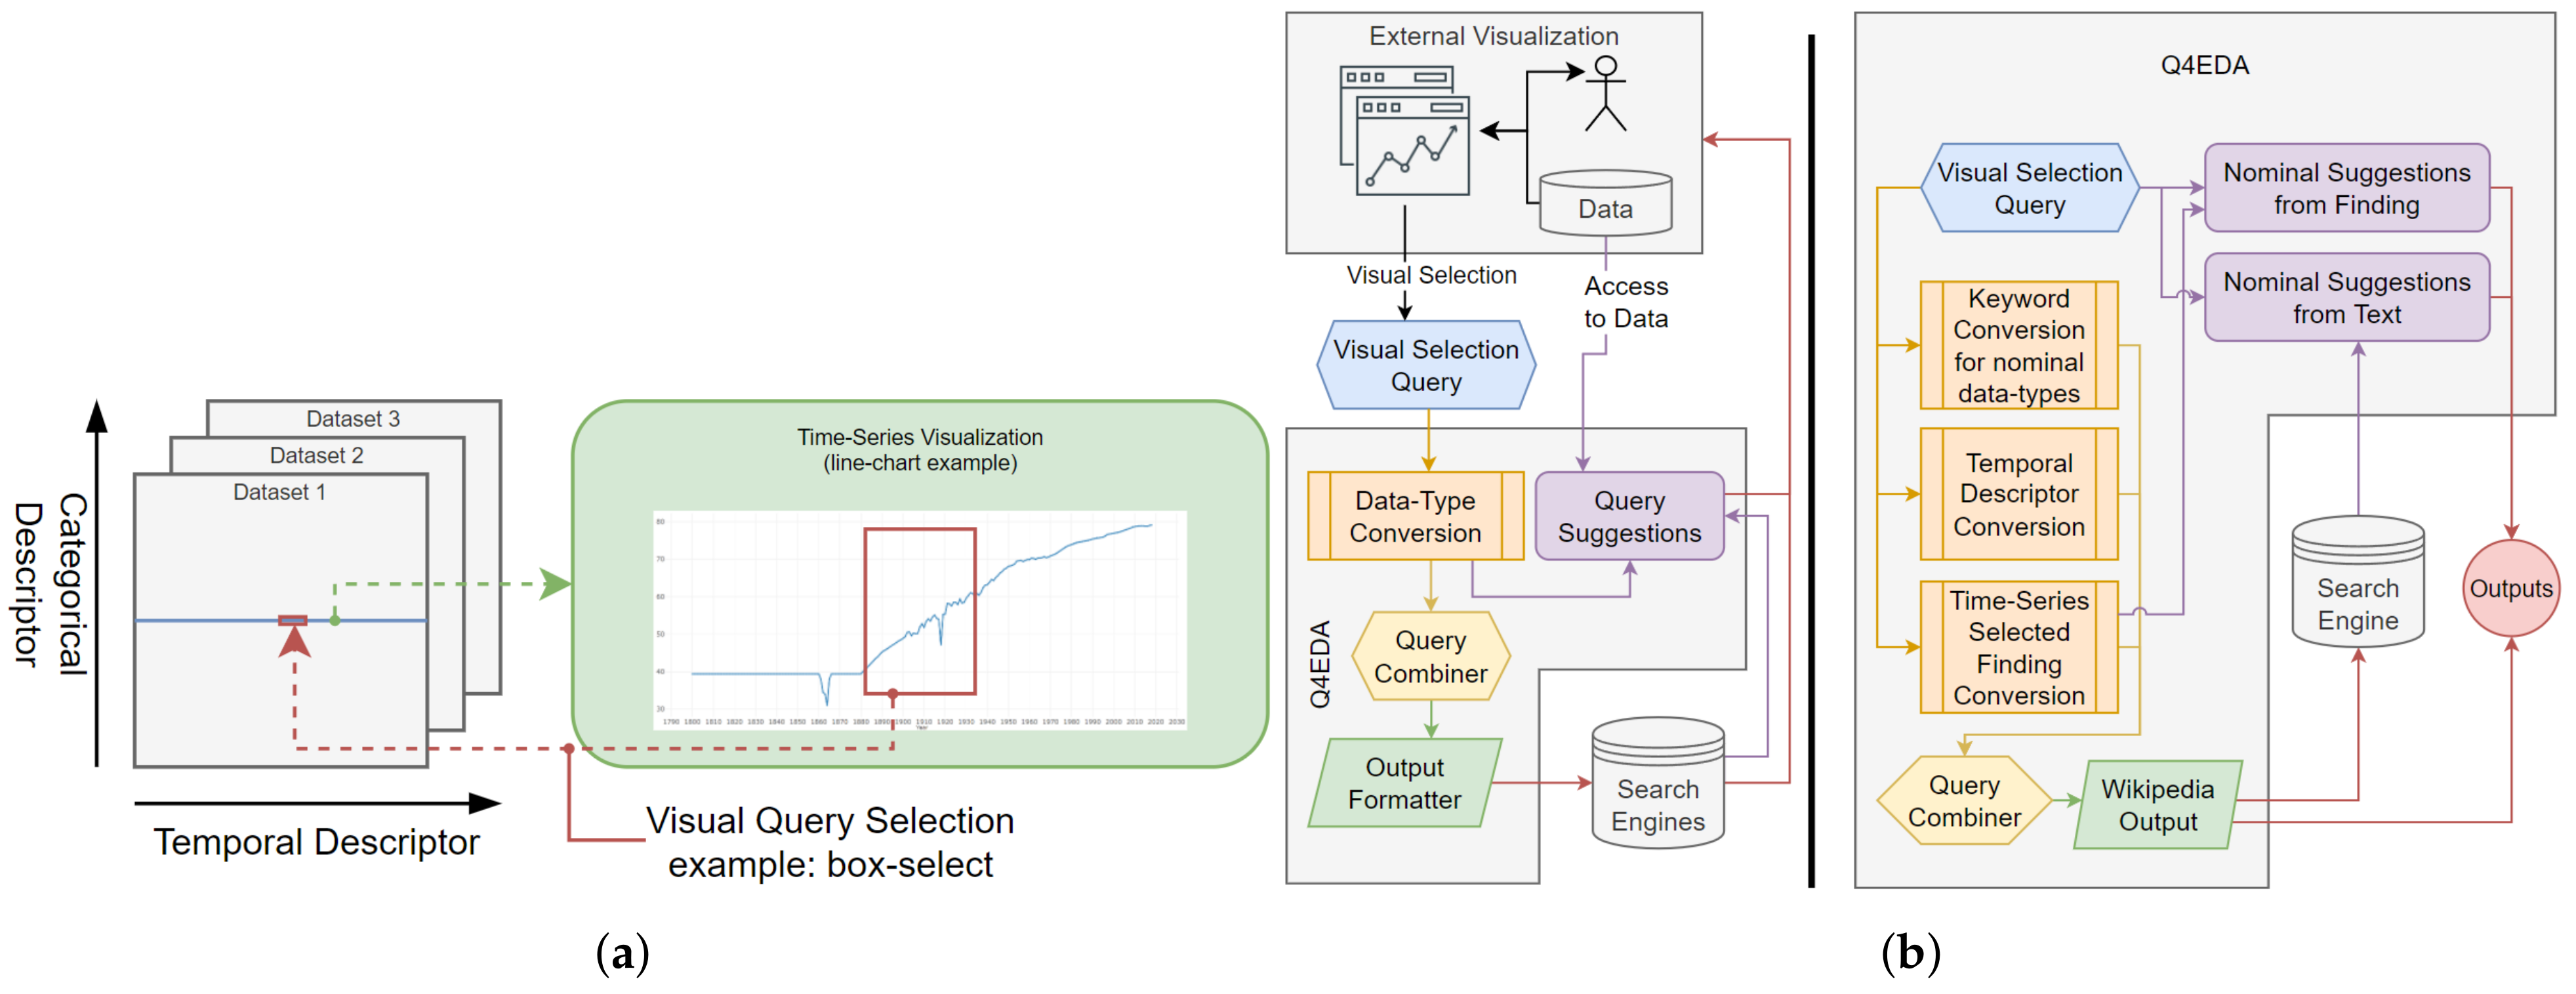
3. Q4EDA
3.1. Overview
3.2. Design Requirements
- R1—
- Visual Query Conversion. Q4EDA must provide a valid SQ given a VQ that provides: (a) output correctness—the information returned from the targeted SEs should be related to the user’s VQ [1]; and (b) output stability—the results should not vary too much given slight variations on the VQ since slight variations of user interaction (selection) are expected to happen in practice [41];
- R2—
- Information Retrieval. Q4EDA should follow existing approaches to enhance the retrieved results, including: (a) query expansion—the converted SQ should be expanded [42] with terms to broaden the query results to better allow for related information to be found; and (b) query suggestion—suggestions [18] should be provided to provide users with information of interest.
3.3. Q4EDA Definitions
3.4. Query Conversion
- 〈sub-expression〉 ::= 〈or〉 | 〈and〉 | 〈required〉 | 〈term〉
- 〈or〉 ::= ‘(’ 〈sub-expression〉 { ‘|’ 〈sub-expression〉 }+ ’)’
- 〈and〉 ::= ‘(’ 〈sub-expression〉 { ‘&’ 〈sub-expression〉 }+ ’)’
- 〈required〉 ::= ‘"’ 〈sub-expression〉 ‘"’
- 〈term〉 ::= [〈negative-factor〉] 〈inner-term〉 [〈weight-factor〉]
- 〈inner-term〉 ::= ‘(’ 〈spaced-term〉 ‘)’ | 〈word〉
- 〈spaced-term〉 ::= 〈spaced-term〉 ‘ ’ 〈word〉 | 〈word〉
- 〈word〉 ::= { 〈lower-case-letter〉 }+
- 〈weight-factor〉 ::= superscript ? 〈weight-factor〉
- 〈negative-factor〉 ::= ‘-’,
3.4.1. Keyword Conversion
3.4.2. Country Keyword Conversion
3.4.3. Temporal Descriptor Conversion
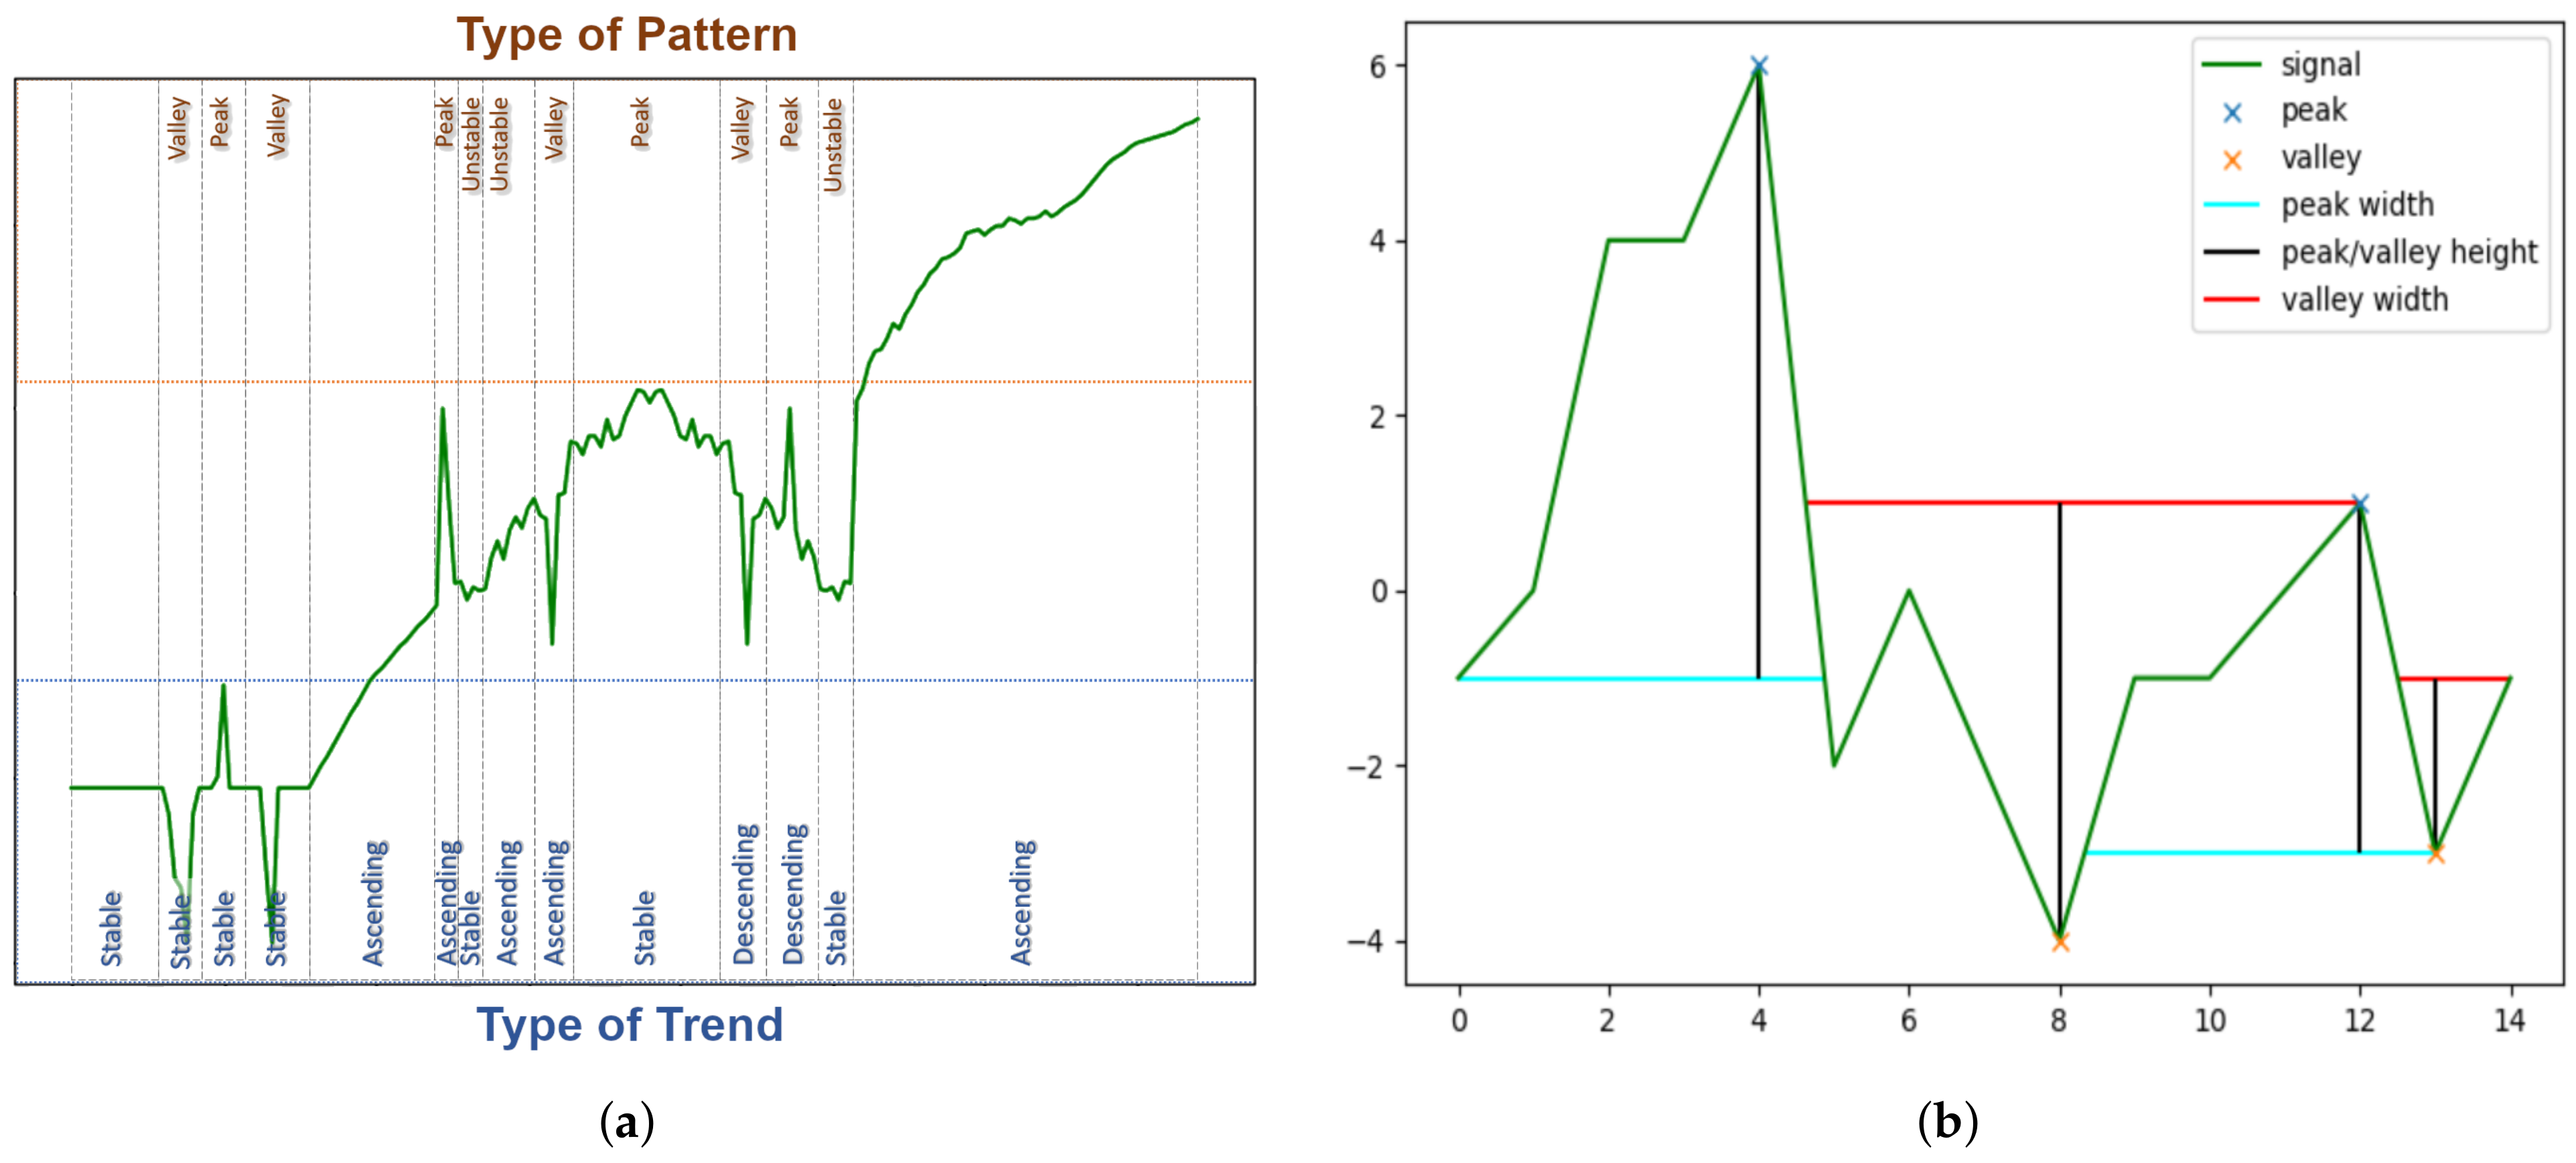
3.4.4. Time-Series’ Selected Finding Conversion
3.5. Query Combiner and Output Formatter
| bnf | Inner Example | Elasticsearch Equivalent |
| weight-factor | superscript | ∧ |
| negative-factor | − | N/A |
| and | & | + |
| required | “spaced term” | +(spaced term) |
| spaced-term | some words | “some words” |
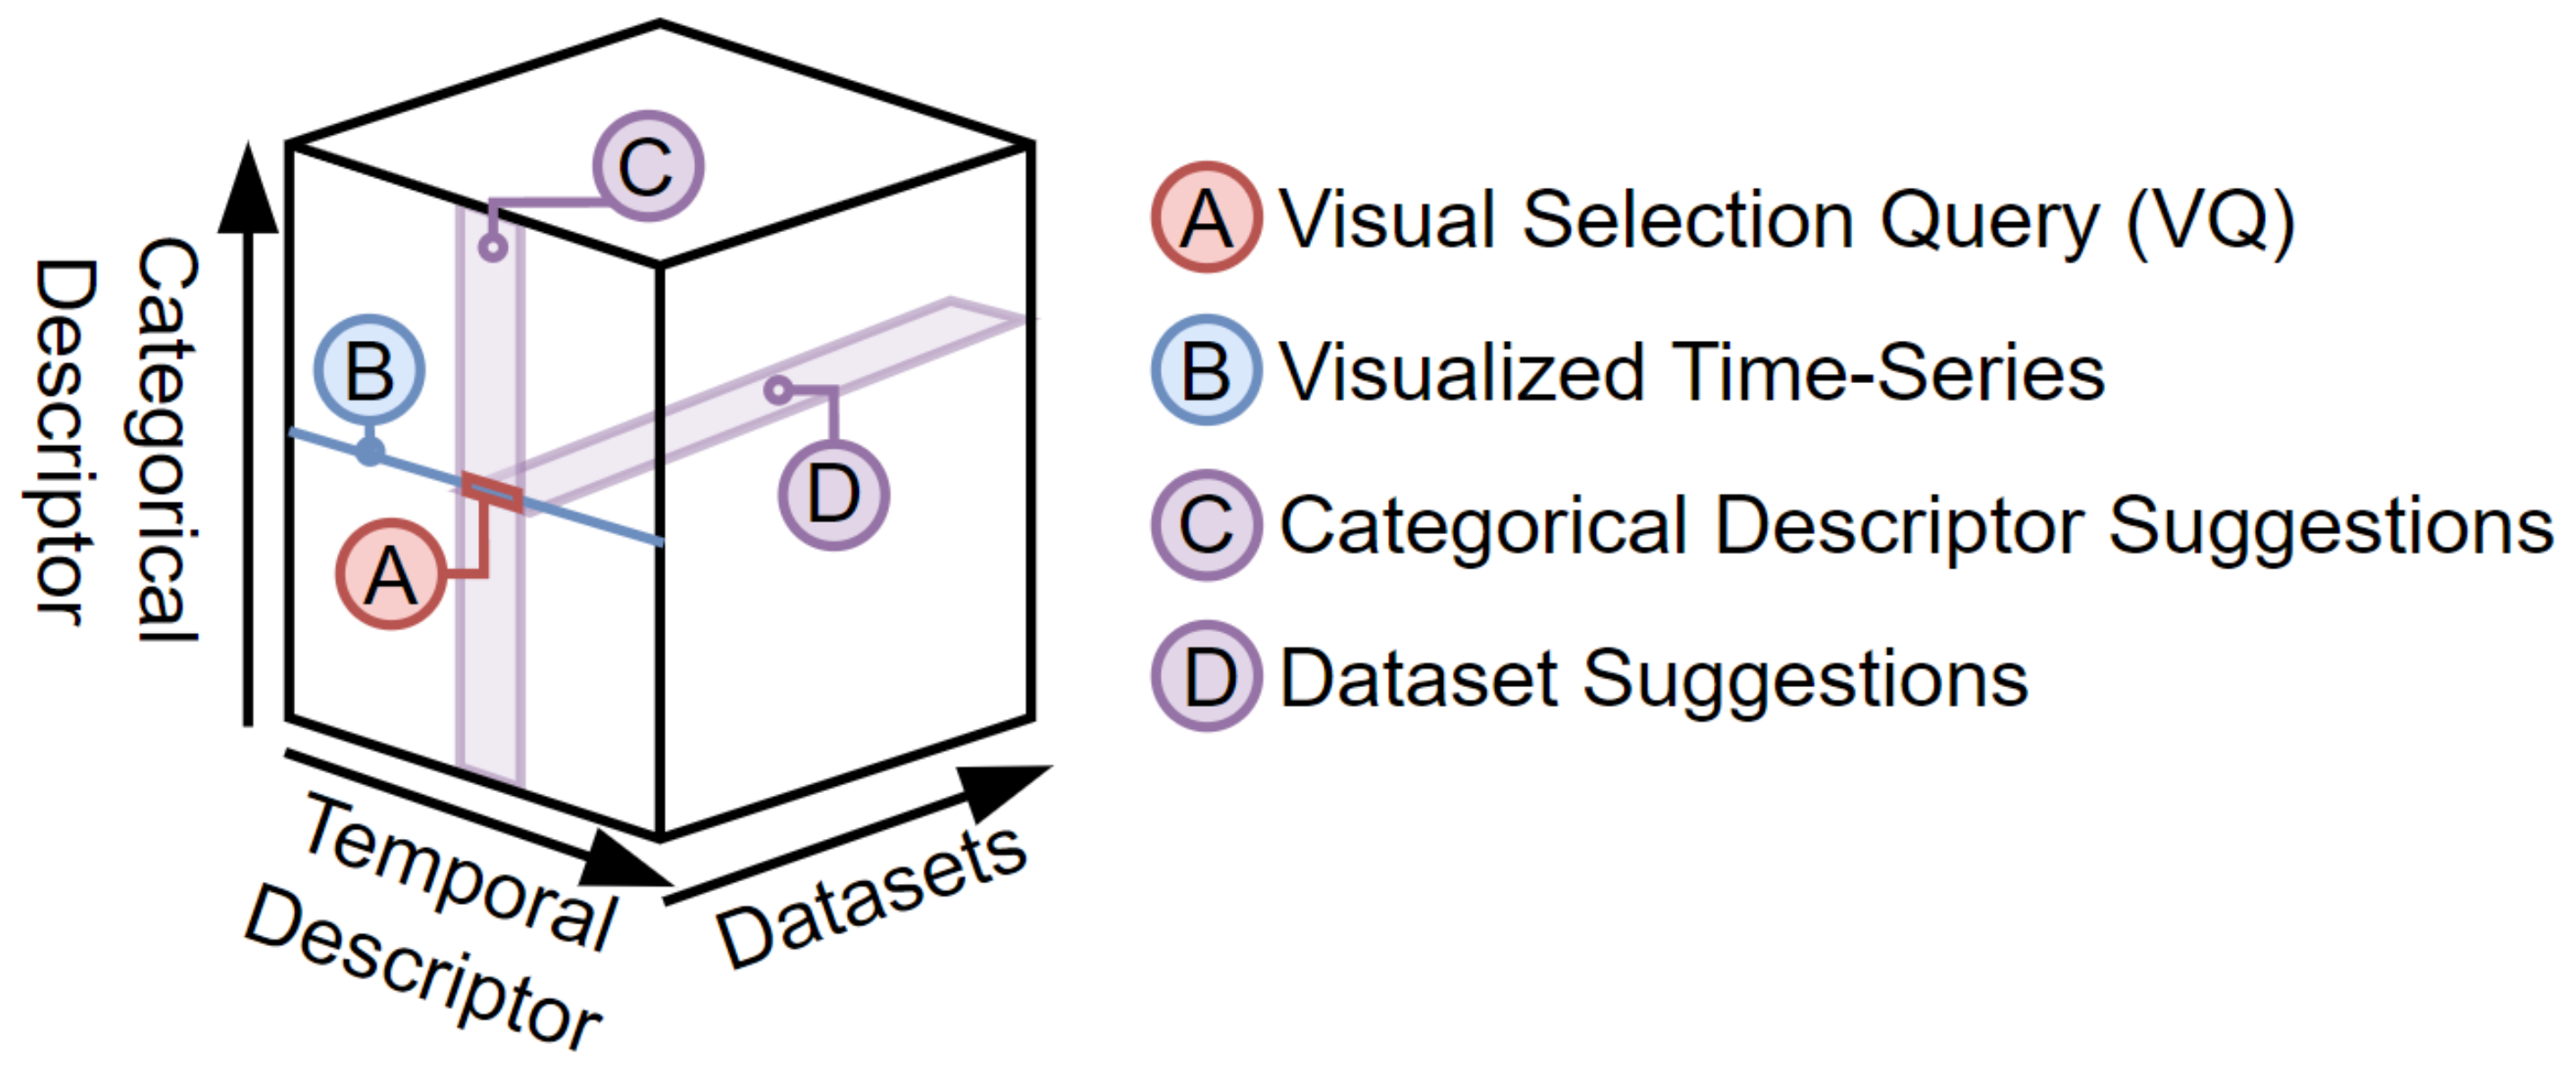
3.6. Query Suggestion
3.6.1. Nominal Suggestions from Text
3.6.2. Nominal Suggestions from Pattern
4. Use-Cases and Results
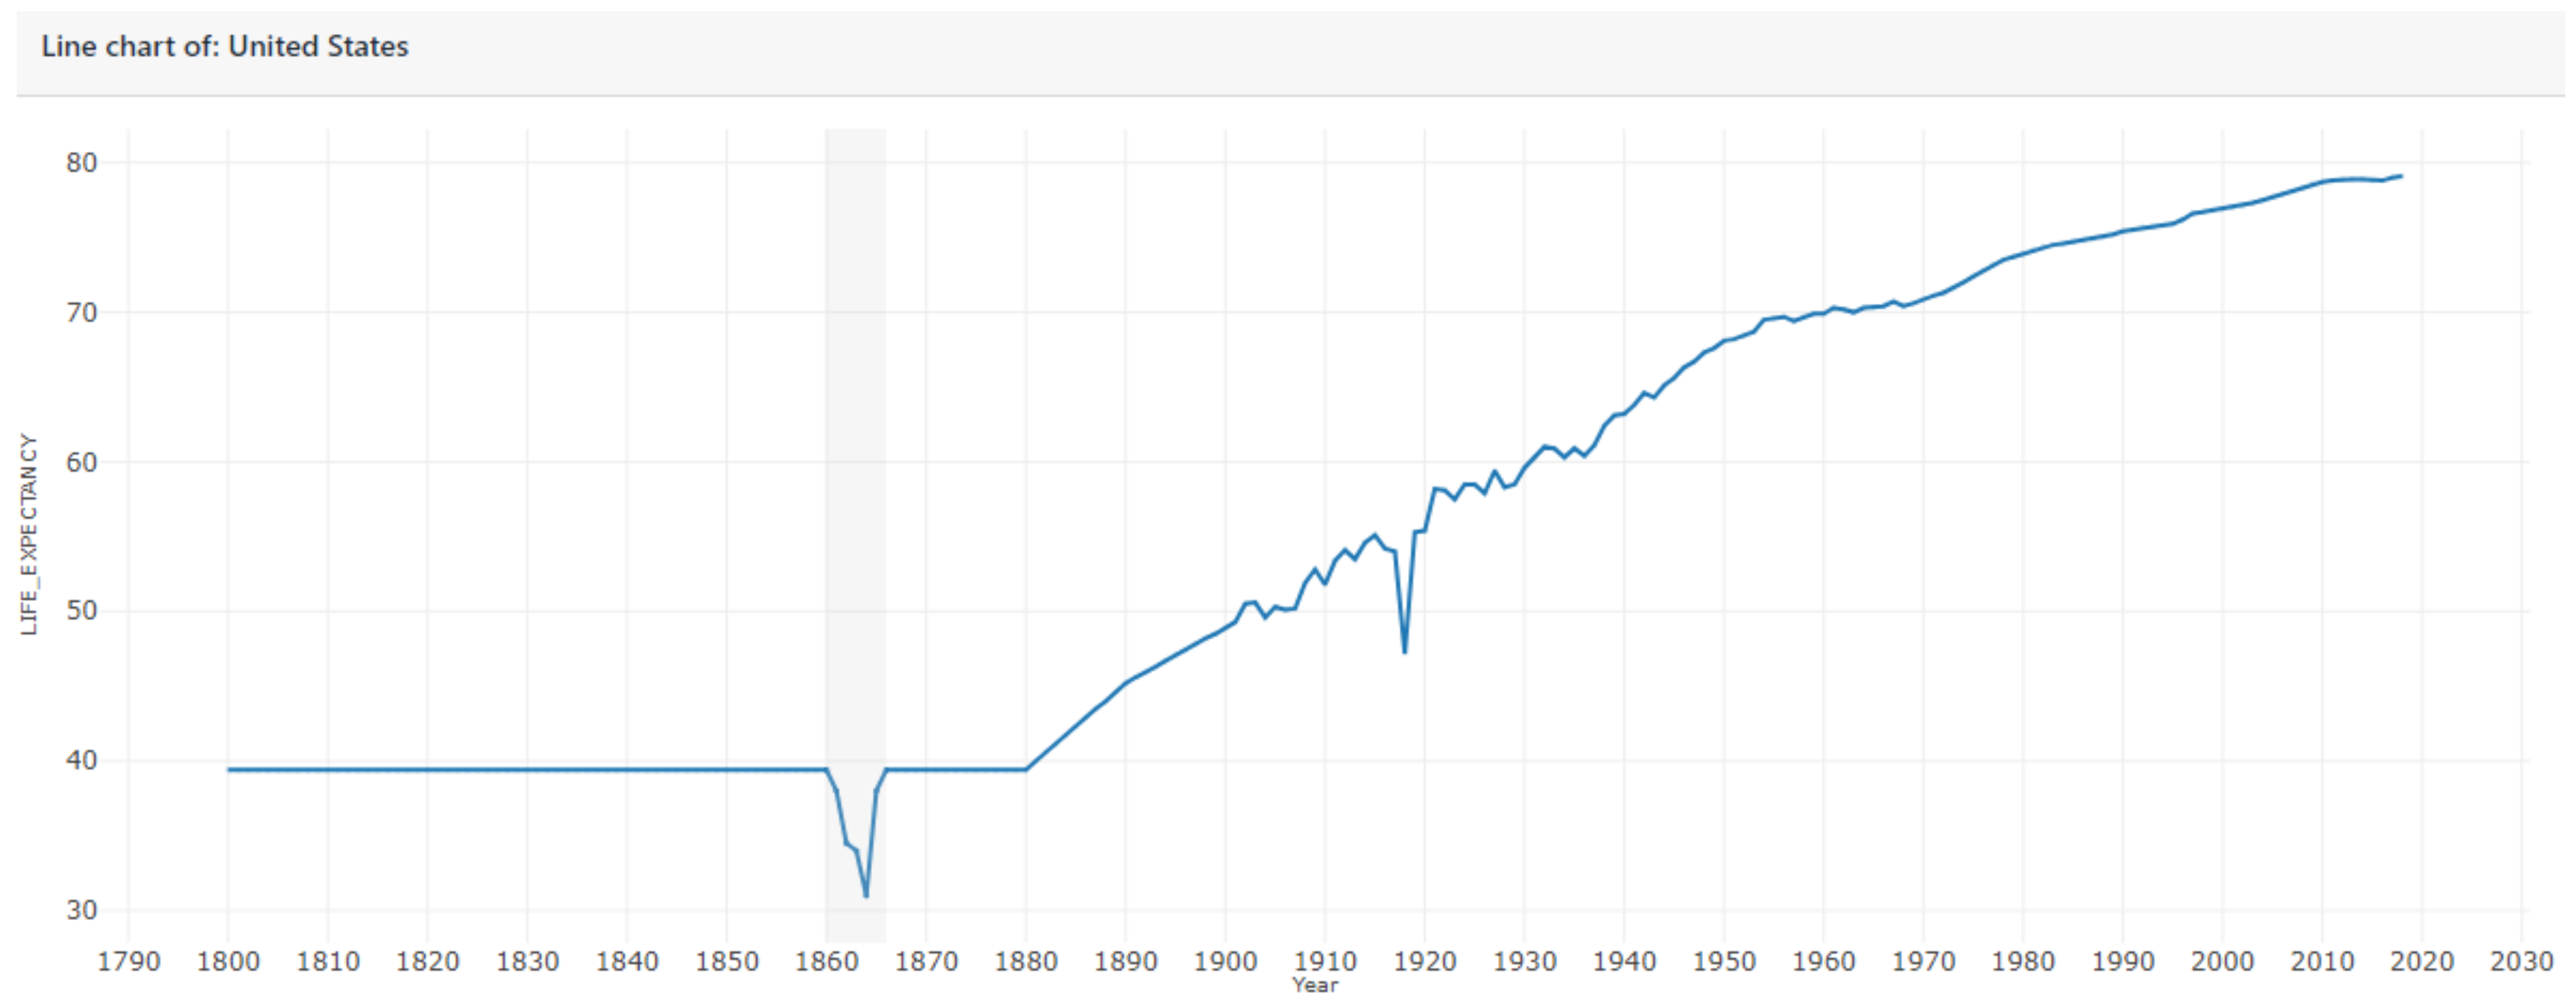
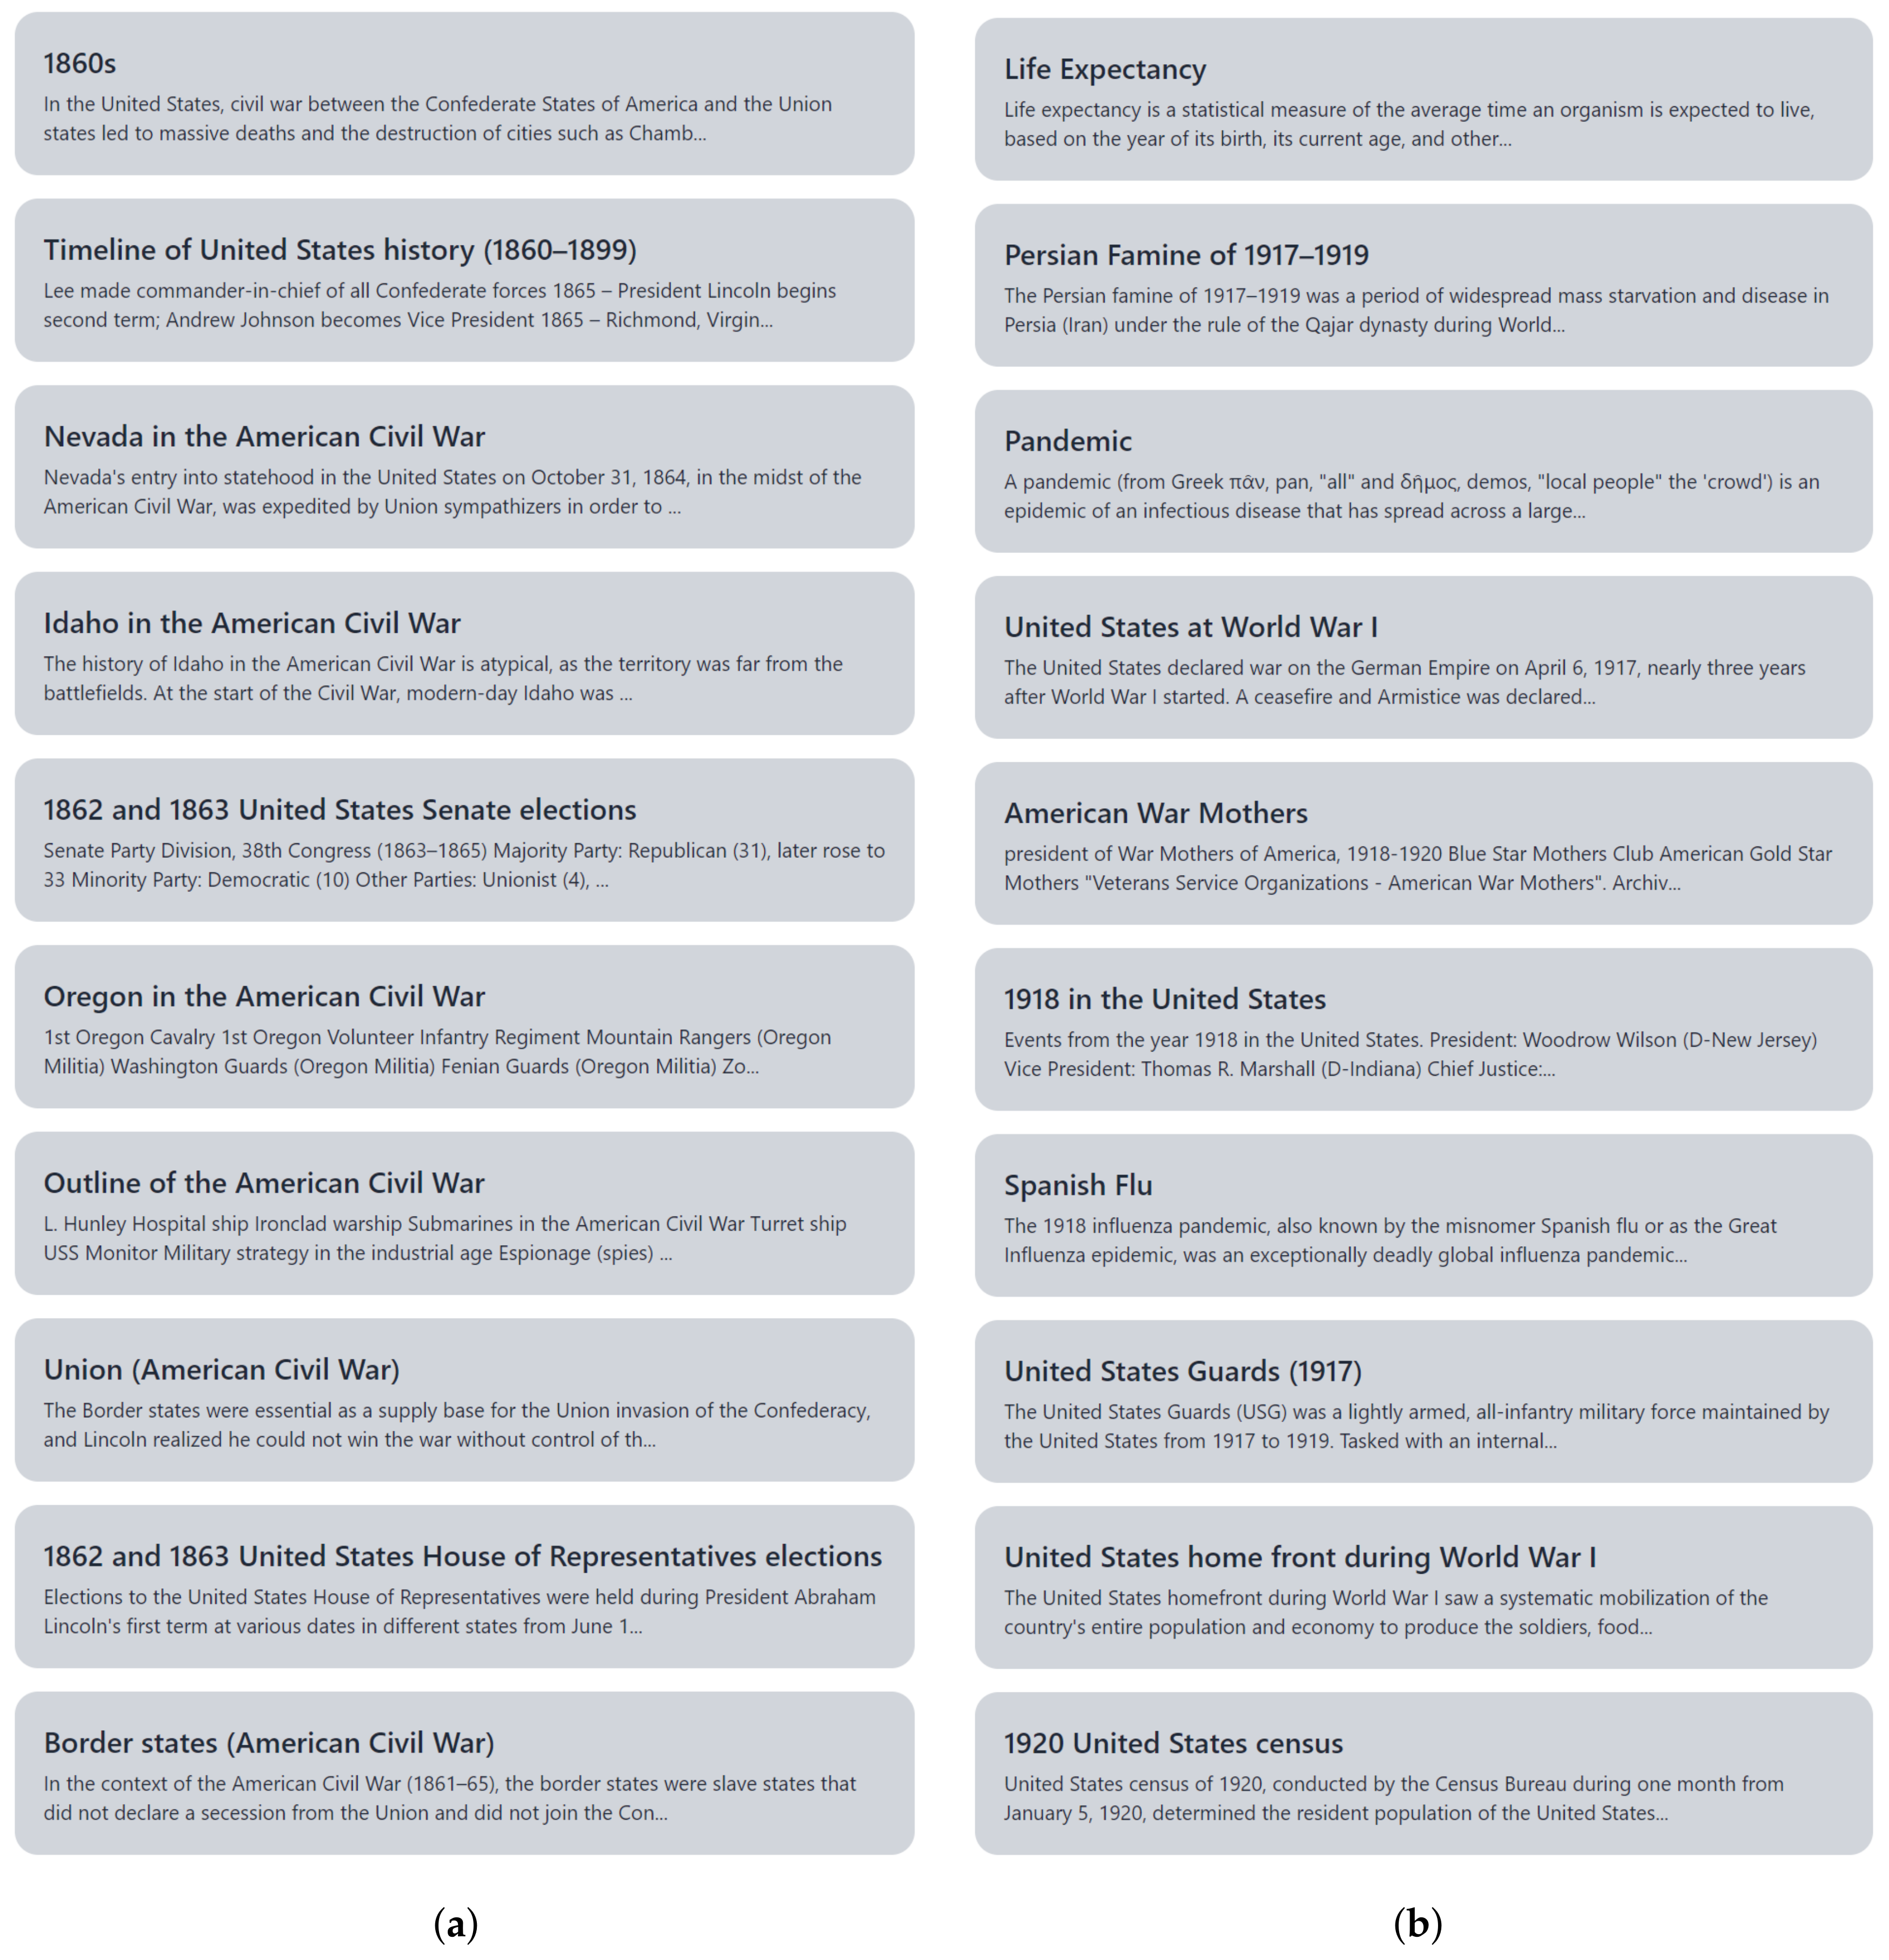
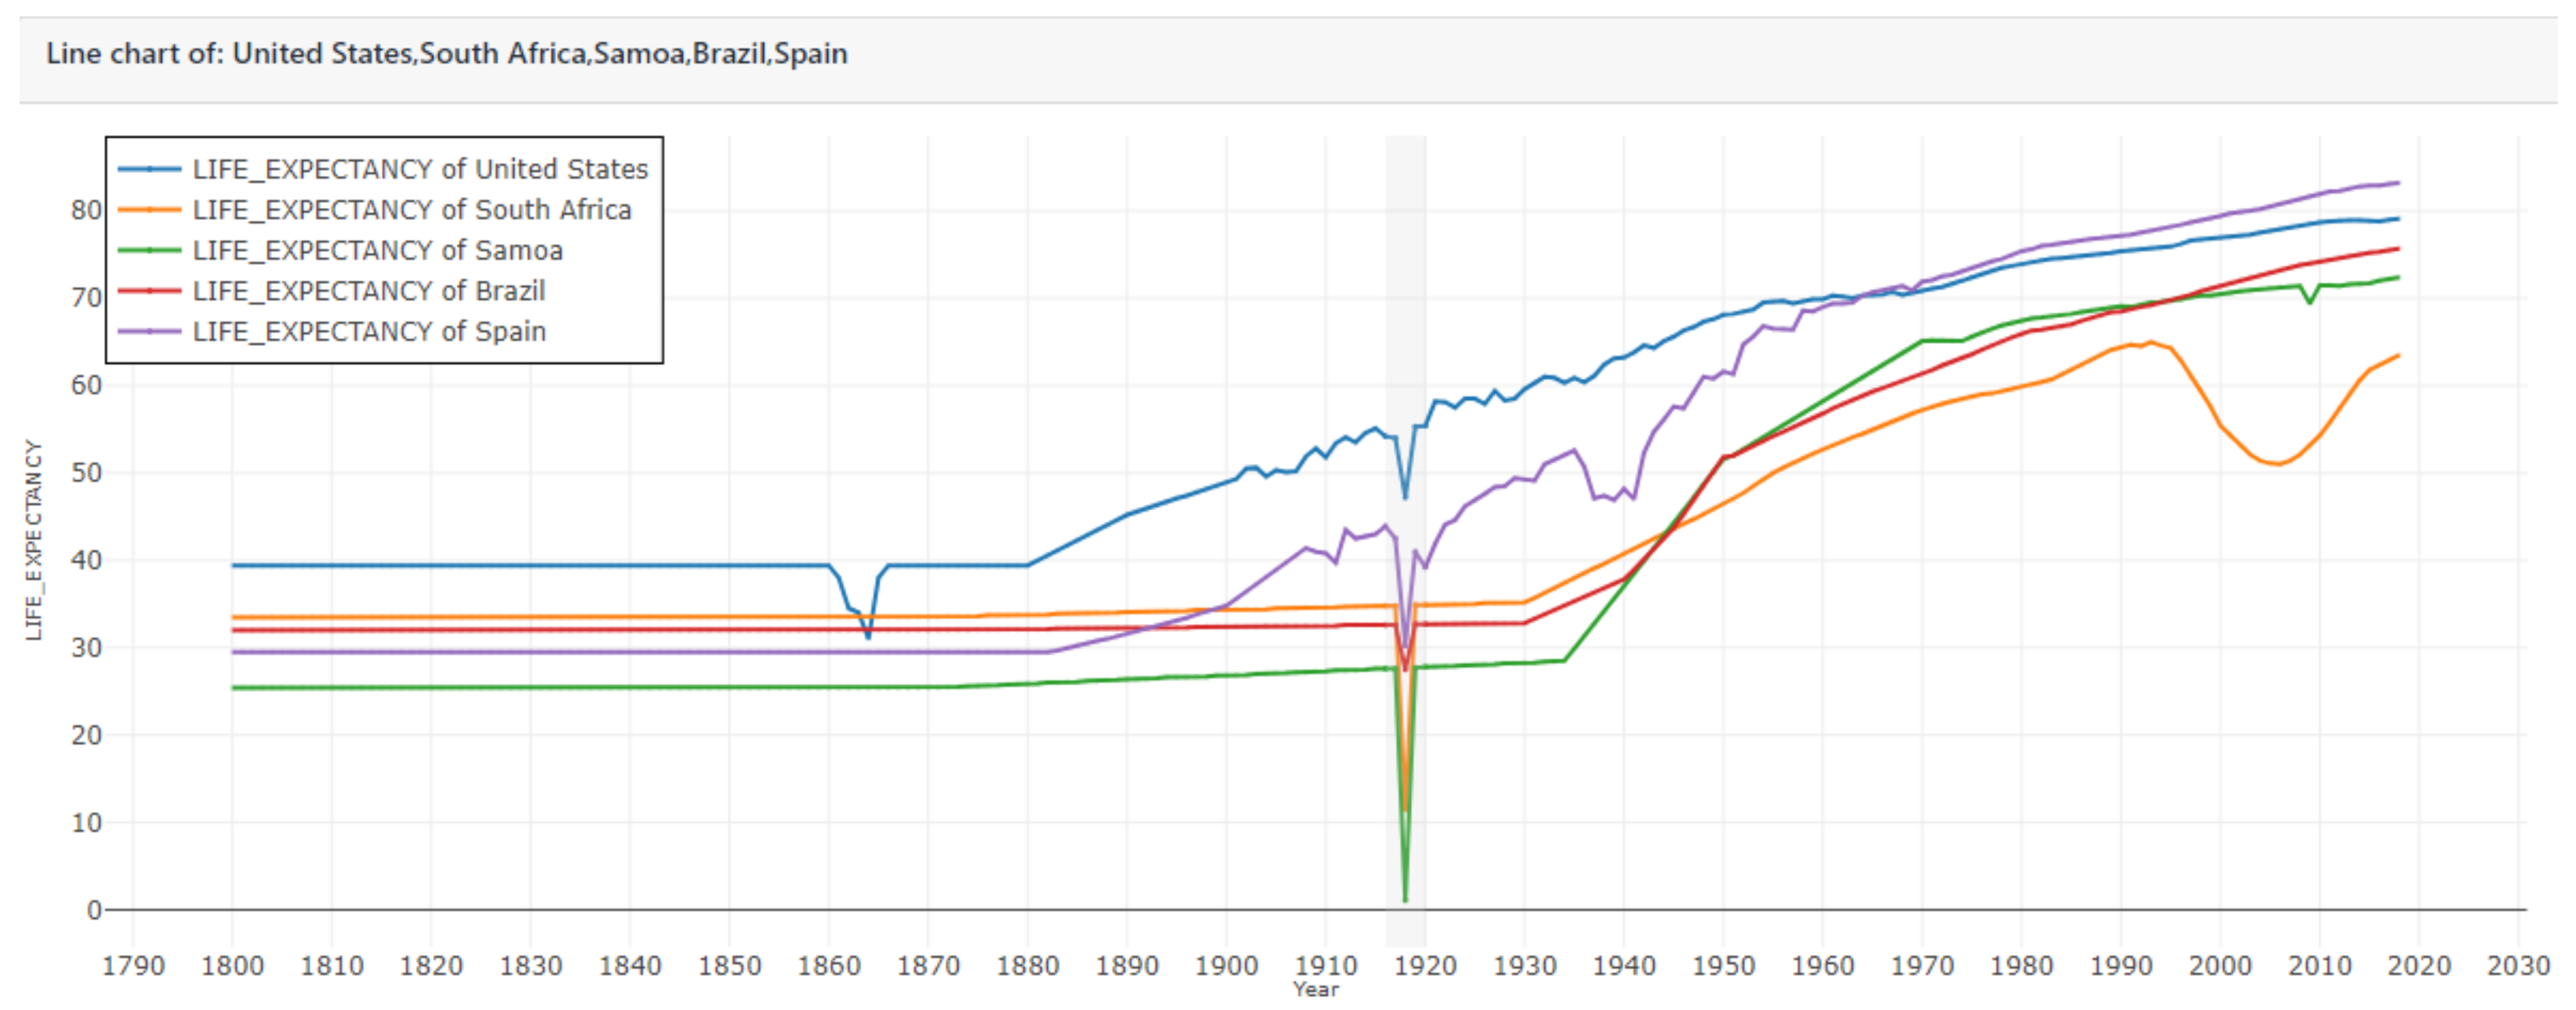
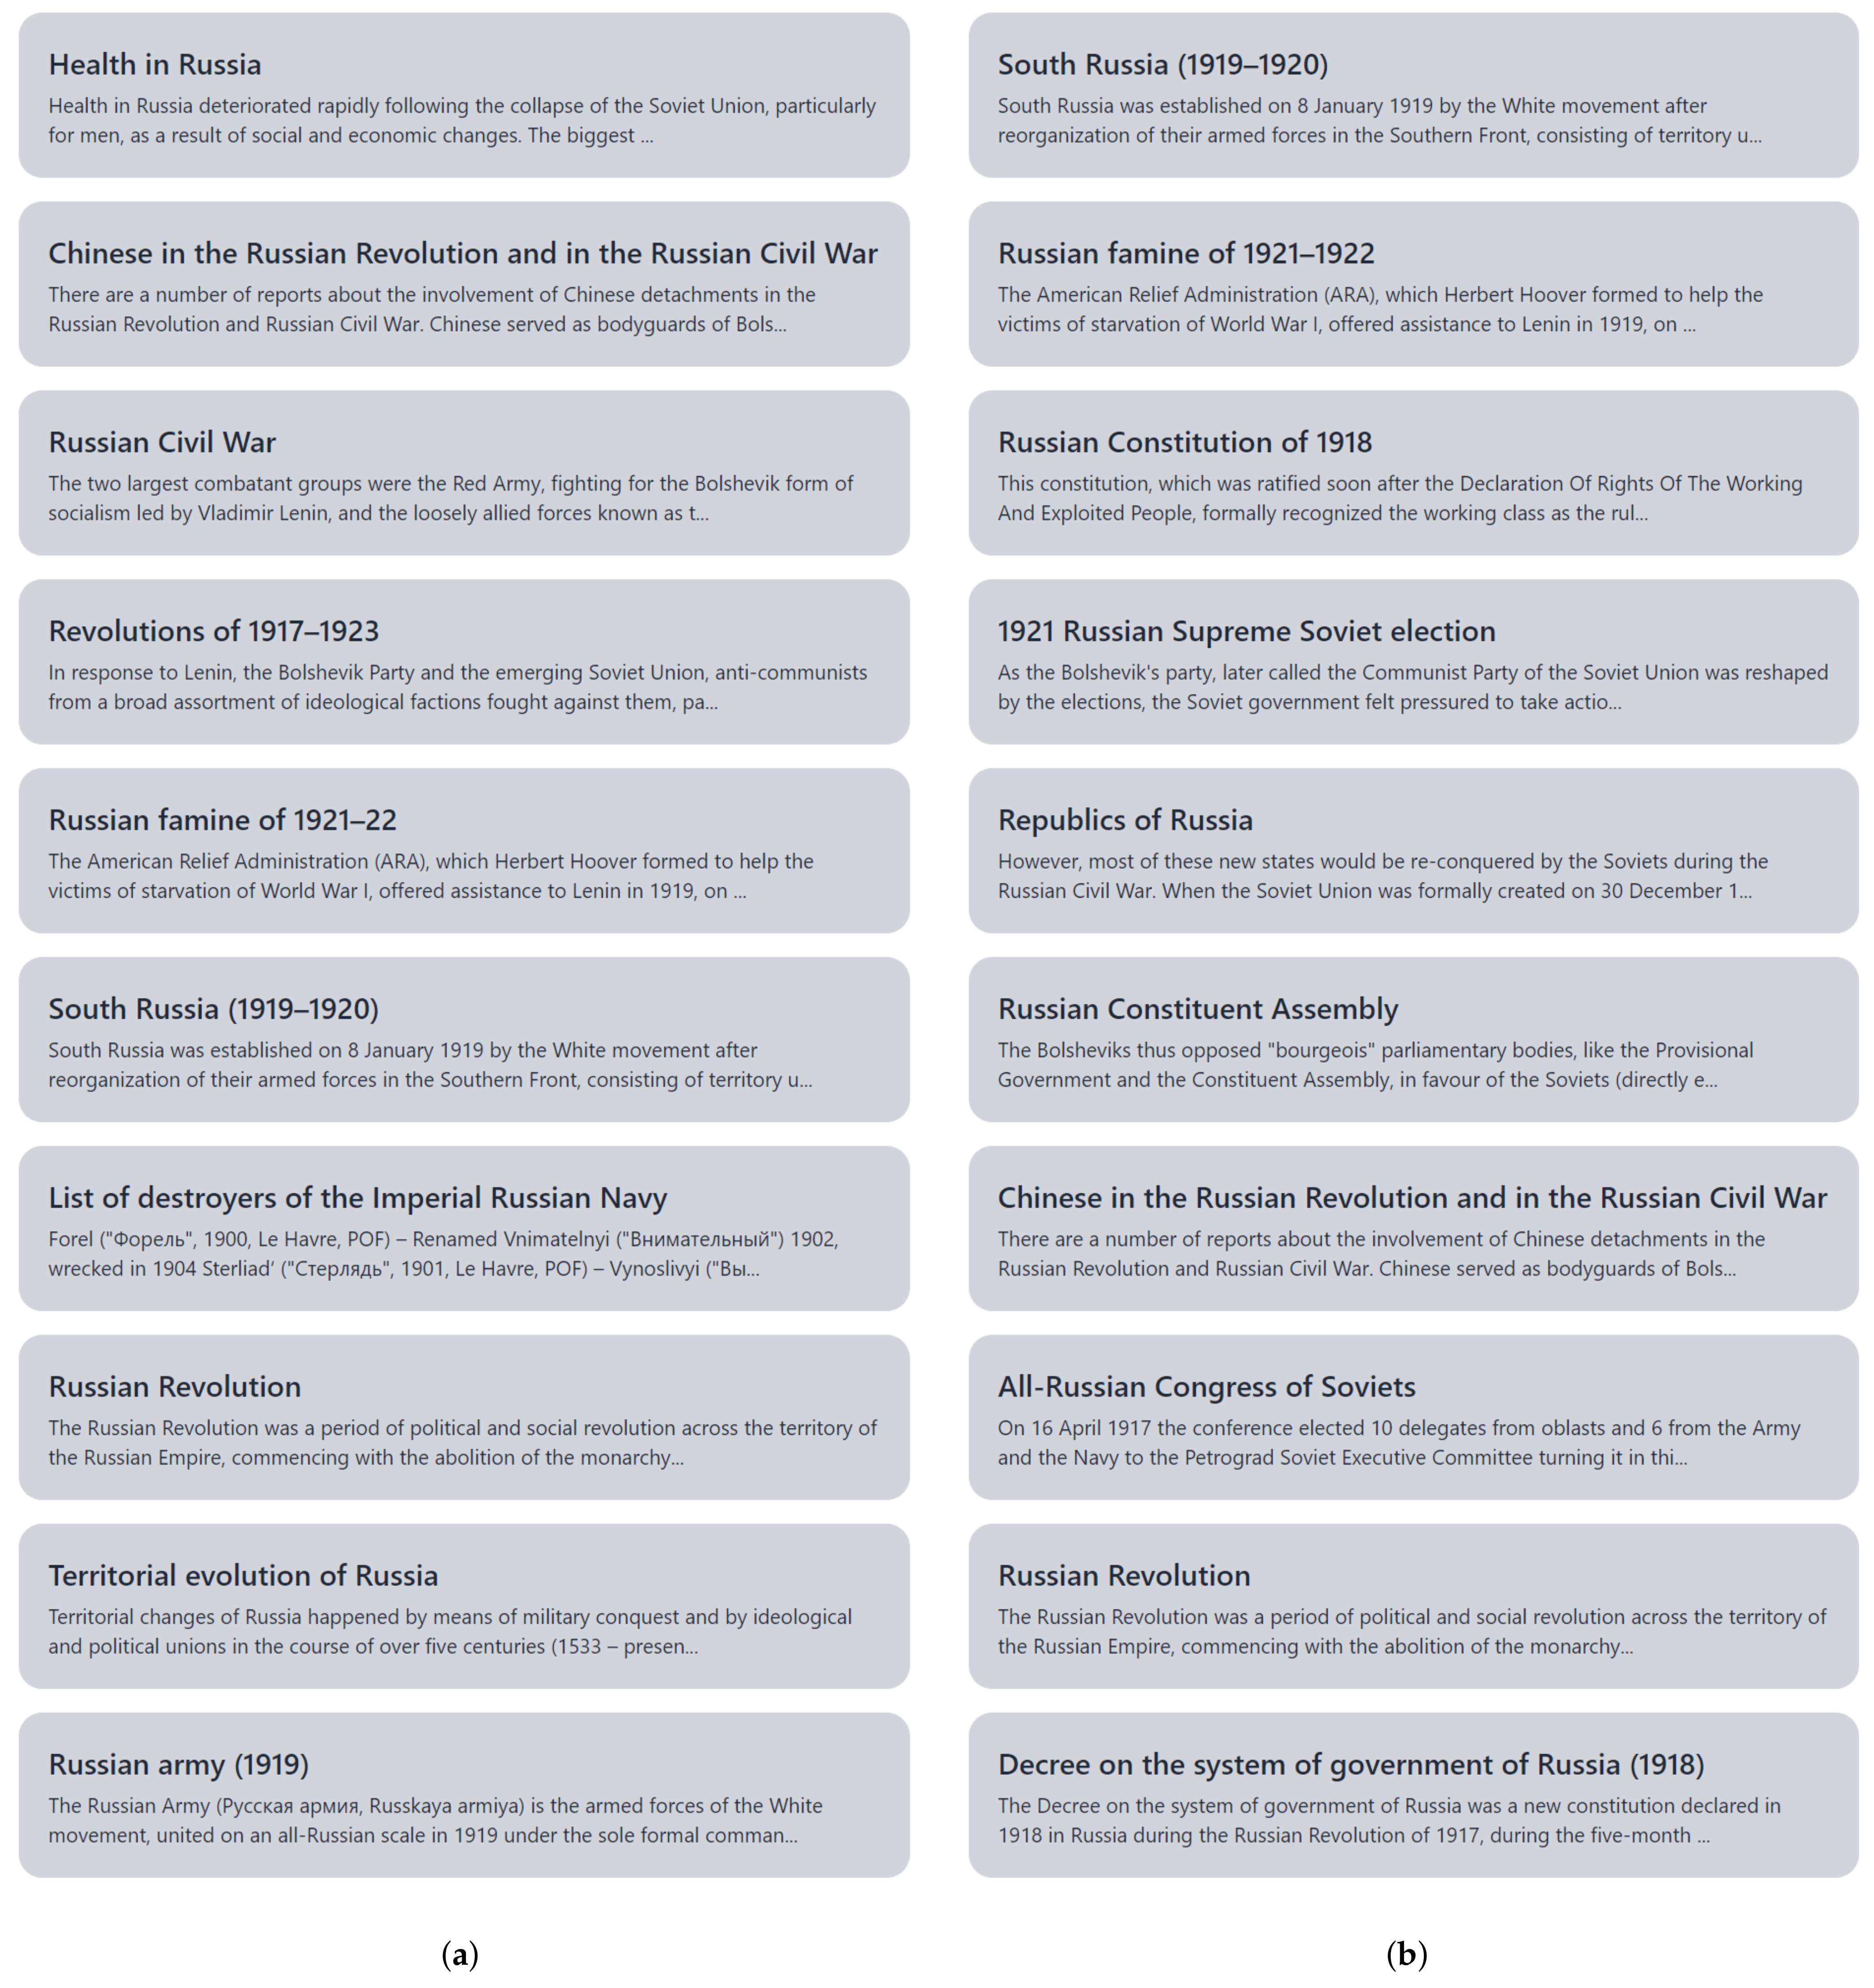
4.1. UNData Line Charts and Wikipedia
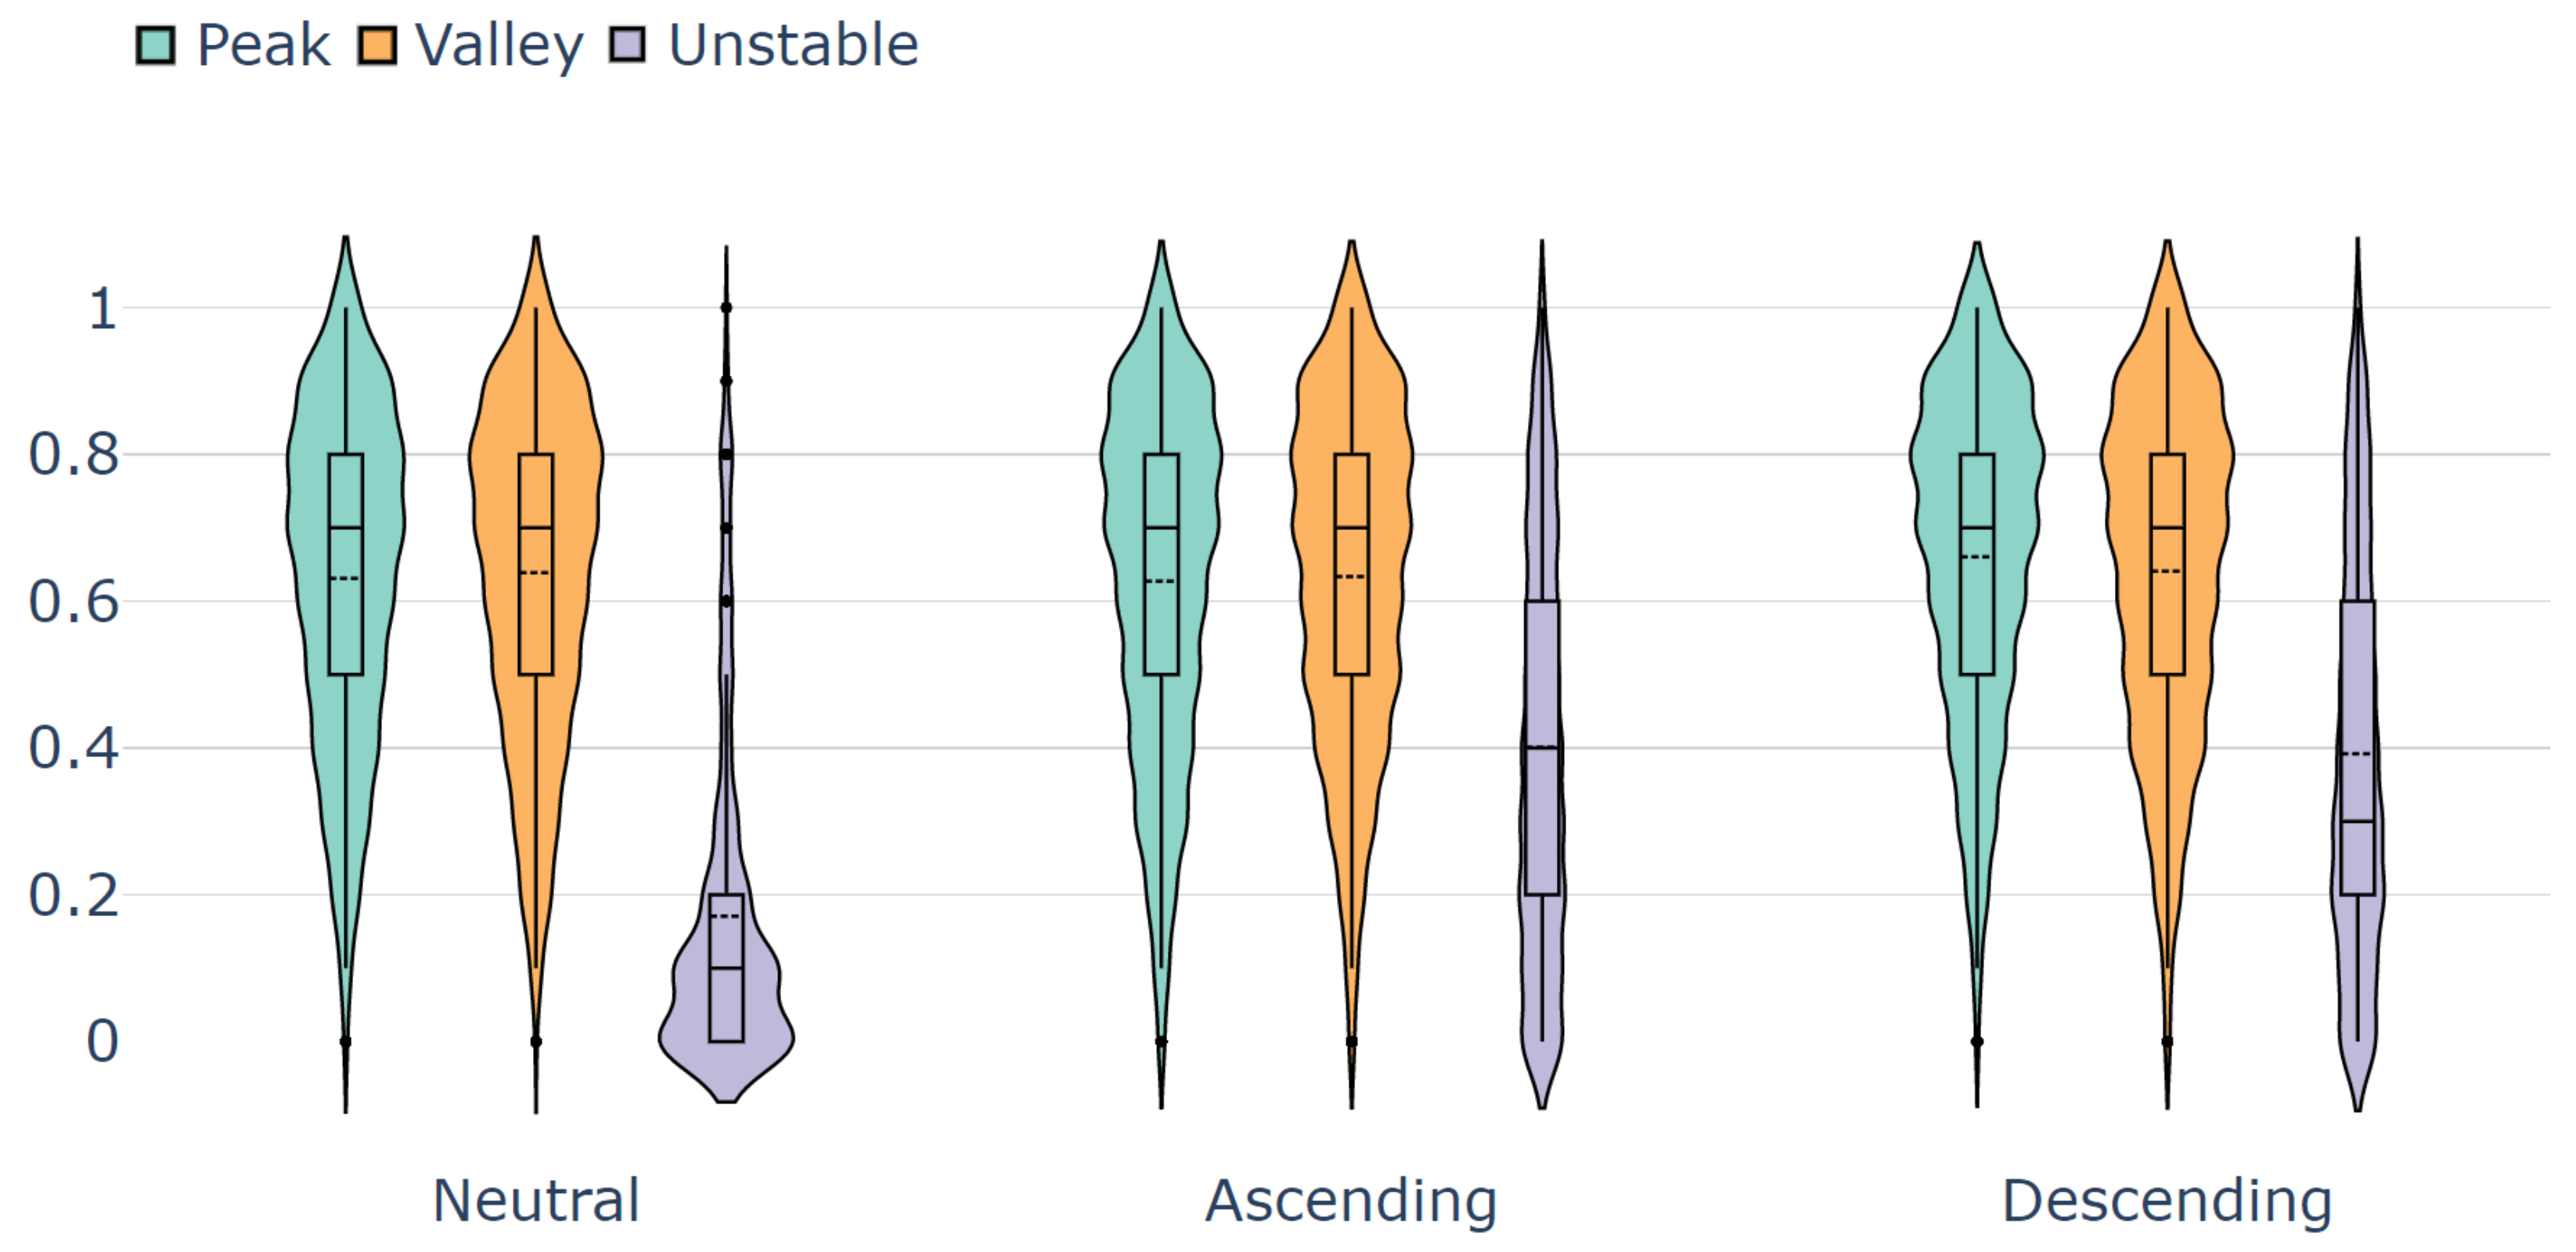
4.2. Inner Query Stability Evaluation
5. User Evaluation
: There is no difference in the amount of correct information related to a given pattern of interest a user can find using the proposed visual query conversion and manually querying the target search engine.
: There is no difference in the amount of correct information related to a given pattern of interest a user who was confident in their answer can find using the proposed visual query conversion and manually querying the target search engine.
6. Discussions and Limitations
7. Conclusions
Author Contributions
Funding
Institutional Review Board Statement
Informed Consent Statement
Data Availability Statement
Acknowledgments
Conflicts of Interest
Abbreviations
| SE | Search Engine |
| SQ | Search Query |
| VA | Visual Analytics |
| EDA | Exploratory Data Analysis |
References
- Croft, W.B.; Metzler, D.; Strohman, T. Search Engines: Information Retrieval in Practice; Addison-Wesley Reading: Boston, MA, USA, 2010; Volume 520. [Google Scholar]
- What Is a Search Query? (Definition)—Seo Glossary. Available online: https://growhackscale.com/glossary/search-queries (accessed on 6 February 2020).
- Google Search. Available online: https://www.google.com/ (accessed on 6 February 2020).
- Wikipedia—The Free Encyclopedia. Available online: https://en.wikipedia.org/wiki/Main_Page (accessed on 6 May 2022).
- United Nations Datasets. Available online: https://data.un.org/ (accessed on 6 February 2020).
- Rosling, H. Data—Gapminder.org. Available online: https://www.gapminder.org/ (accessed on 6 February 2020).
- Sarma, A. Hans Rosling brought data to life, showed our misconceptions about the world. Skept. Inq. 2017, 41, 9–10. [Google Scholar]
- Kammerer, Y.; Bohnacker, M. Children’s web search with Google: The effectiveness of natural language queries. In Proceedings of the 11th International Conference on Interaction Design and Children, Bremen, Germany, 12–15 June 2012; pp. 184–187. [Google Scholar]
- Reilly, M.; Thompson, S. Reverse image lookup: Assessing digital library users and reuses. J. Web Librariansh. 2017, 11, 56–68. [Google Scholar] [CrossRef]
- Cafarella, M.J.; Etzioni, O. A search engine for natural language applications. In Proceedings of the 14th International Conference on World Wide Web, Chiba, Japan, 10–14 May 2005; pp. 442–452. [Google Scholar]
- Hullman, J.; Diakopoulos, N.; Adar, E. Contextifier: Automatic generation of annotated stock visualizations. In Proceedings of the SIGCHI Conference on Human Factors in Computing Systems, Paris, France, 27 April–2 May 2013; pp. 2707–2716. [Google Scholar]
- Badam, S.K.; Liu, Z.; Elmqvist, N. Elastic documents: Coupling text and tables through contextual visualizations for enhanced document reading. IEEE Trans. Vis. Comput. Graph. 2018, 25, 661–671. [Google Scholar] [CrossRef] [PubMed]
- Yu, B.; Silva, C.T. FlowSense: A Natural Language Interface for Visual Data Exploration within a Dataflow System. IEEE Trans. Vis. Comput. Graph. 2020, 26, 1–11. [Google Scholar] [CrossRef]
- Kraska, T. Northstar: An interactive data science system. Proc. VLDB Endow. 2018, 11, 2150–2164. [Google Scholar] [CrossRef]
- Zhou, Z.; Wen, X.; Wang, Y.; Gotz, D. Modeling and Leveraging Analytic Focus During Exploratory Visual Analysis. arXiv 2021, arXiv:2101.08856. [Google Scholar]
- Borland, D.; Wang, W.; Zhang, J.; Shrestha, J.; Gotz, D. Selection bias tracking and detailed subset comparison for high-dimensional data. IEEE Trans. Vis. Comput. Graph. 2019, 26, 429–439. [Google Scholar] [CrossRef]
- Borland, D.; Zhang, J.; Kaul, S.; Gotz, D. Selection-Bias-Corrected Visualization via Dynamic Reweighting. IEEE Trans. Vis. Comput. Graph. 2020, 27, 1481–1491. [Google Scholar] [CrossRef]
- Ooi, J.; Ma, X.; Qin, H.; Liew, S.C. A survey of query expansion, query suggestion and query refinement techniques. In Proceedings of the 2015 4th International Conference on Software Engineering and Computer Systems (ICSECS), Kuantan, Malaysia, 19–21 August 2015; pp. 112–117. [Google Scholar]
- Yi, P.; Choi, B.; Bhowmick, S.S.; Xu, J. AutoG: A visual query autocompletion framework for graph databases. VLDB J. 2017, 26, 347–372. [Google Scholar] [CrossRef]
- Zhang, L.; Stoffel, A.; Behrisch, M.; Mittelstadt, S.; Schreck, T.; Pompl, R.; Weber, S.; Last, H.; Keim, D. Visual analytics for the big data era—A comparative review of state-of-the-art commercial systems. In Proceedings of the 2012 IEEE Conference on Visual Analytics Science and Technology (VAST), Seattle, WA, USA, 14–19 October 2012; pp. 173–182. [Google Scholar]
- Srinivasan, A.; Drucker, S.M.; Endert, A.; Stasko, J. Augmenting visualizations with interactive data facts to facilitate interpretation and communication. IEEE Trans. Vis. Comput. Graph. 2018, 25, 672–681. [Google Scholar] [CrossRef]
- Suh, A.; Jiang, Y.; Mosca, A.; Wu, E.; Chang, R. A Grammar for Hypothesis-Driven Visual Analysis. arXiv 2022, arXiv:2204.14267. [Google Scholar]
- Cui, W.; Zhang, X.; Wang, Y.; Huang, H.; Chen, B.; Fang, L.; Zhang, H.; Lou, J.G.; Zhang, D. Text-to-Viz: Automatic Generation of Infographics from Proportion-Related Natural Language Statements. IEEE Trans. Vis. Comput. Graph. 2019, 26, 906–916. [Google Scholar] [CrossRef]
- Lin, A.Y.; Ford, J.; Adar, E.; Hecht, B. VizByWiki: Mining data visualizations from the web to enrich news articles. In Proceedings of the 2018 World Wide Web Conference, Lyon, France, 23–27 April 2018; pp. 873–882. [Google Scholar]
- Bryan, C.; Ma, K.L.; Woodring, J. Temporal summary images: An approach to narrative visualization via interactive annotation generation and placement. IEEE Trans. Vis. Comput. Graph. 2016, 23, 511–520. [Google Scholar] [CrossRef]
- Tang, B.; Han, S.; Yiu, M.L.; Ding, R.; Zhang, D. Extracting top-k insights from multi-dimensional data. In Proceedings of the 2017 ACM International Conference on Management of Data, Chicago, IL, USA, 14–19 May 2017; pp. 1509–1524. [Google Scholar]
- Ding, R.; Han, S.; Xu, Y.; Zhang, H.; Zhang, D. Quickinsights: Quick and automatic discovery of insights from multi-dimensional data. In Proceedings of the 2019 International Conference on Management of Data, Amsterdam, The Netherlands, 30 June–5 July 2019; pp. 317–332. [Google Scholar]
- Kwon, B.C.; Stoffel, F.; Jäckle, D.; Lee, B.; Keim, D. Visjockey: Enriching data stories through orchestrated interactive visualization. In Proceedings of the Poster Compendium of the Computation+ Journalism Symposium, New York, NY, USA, 24–25 October 2014; Volume 3, p. 3. [Google Scholar]
- Luo, Y.; Qin, X.; Tang, N.; Li, G.; Wang, X. Deepeye: Creating good data visualizations by keyword search. In Proceedings of the 2018 International Conference on Management of Data, Houston, TX, USA, 10–15 June 2018; pp. 1733–1736. [Google Scholar]
- Metoyer, R.; Zhi, Q.; Janczuk, B.; Scheirer, W. Coupling story to visualization: Using textual analysis as a bridge between data and interpretation. In Proceedings of the 23rd International Conference on Intelligent User Interfaces, Tokyo, Japan, 7–11 March 2018; pp. 503–507. [Google Scholar]
- Hoque, E.; Setlur, V.; Tory, M.; Dykeman, I. Applying pragmatics principles for interaction with visual analytics. IEEE Trans. Vis. Comput. Graph. 2017, 24, 309–318. [Google Scholar] [CrossRef]
- Kim, D.H.; Hoque, E.; Agrawala, M. Answering questions about charts and generating visual explanations. In Proceedings of the CHI Conference on Human Factors in Computing Systems, Honolulu, HI, USA, 25–30 April 2020; pp. 1–13. [Google Scholar]
- Kafle, K.; Shrestha, R.; Cohen, S.; Price, B.; Kanan, C. Answering questions about data visualizations using efficient bimodal fusion. In Proceedings of the IEEE/CVF Winter Conference on Applications of Computer Vision, Snowmass Village, CO, USA, 1–5 March 2020; pp. 1498–1507. [Google Scholar]
- Yu, J.; Zhu, Z.; Wang, Y.; Zhang, W.; Hu, Y.; Tan, J. Cross-modal knowledge reasoning for knowledge-based visual question answering. Pattern Recognit. 2020, 108, 107563. [Google Scholar] [CrossRef]
- Kim, D.H.; Hoque, E.; Kim, J.; Agrawala, M. Facilitating document reading by linking text and tables. In Proceedings of the 31st Annual ACM Symposium on User Interface Software and Technology, Berlin, Germany, 14–17 October 2018; pp. 423–434. [Google Scholar]
- Srinivasan, A.; Stasko, J. Orko: Facilitating multimodal interaction for visual exploration and analysis of networks. IEEE Trans. Vis. Comput. Graph. 2017, 24, 511–521. [Google Scholar] [CrossRef]
- Yu, J.; Zhang, W.; Lu, Y.; Qin, Z.; Hu, Y.; Tan, J.; Wu, Q. Reasoning on the relation: Enhancing visual representation for visual question answering and cross-modal retrieval. IEEE Trans. Multimedia. 2020, 22, 3196–3209. [Google Scholar] [CrossRef]
- Dhelim, S.; Ning, H.; Aung, N. ComPath: User interest mining in heterogeneous signed social networks for Internet of people. IEEE Internet Things J. 2020, 8, 7024–7035. [Google Scholar] [CrossRef]
- Mogadala, A.; Kalimuthu, M.; Klakow, D. Trends in integration of vision and language research: A survey of tasks, datasets, and methods. arXiv 2019, arXiv:1907.09358. [Google Scholar] [CrossRef]
- Zhang, J.; Deng, B.; Li, X. Concept based query expansion using wordnet. In Proceedings of the 2009 International e-Conference on Advanced Science and Technology, Daejeon, Korea, 7–9 March 2009; pp. 52–55. [Google Scholar]
- Carpineto, C.; Romano, G. A survey of automatic query expansion in information retrieval. ACM Comput. Surv. 2012, 44, 1–50. [Google Scholar] [CrossRef]
- Azad, H.K.; Deepak, A. Query expansion techniques for information retrieval: A survey. Inf. Process. Manag. 2019, 56, 1698–1735. [Google Scholar] [CrossRef]
- Dahir, S.; El Qadi, A. A query expansion method based on topic modeling and DBpedia features. Int. J. Inf. Manag. Data Insights 2021, 1, 100043. [Google Scholar] [CrossRef]
- Hoeber, O.; Yang, X.D.; Yao, Y. Visualization support for interactive query refinement. In Proceedings of the 2005 IEEE/WIC/ACM International Conference on Web Intelligence (WI’05), Compiegne, France, 19–22 September 2005; pp. 657–665. [Google Scholar]
- Khazaei, T.; Hoeber, O. Supporting academic search tasks through citation visualization and exploration. Int. J. Digit. Libr. 2017, 18, 59–72. [Google Scholar] [CrossRef]
- Scells, H.; Zuccon, G. Searchrefiner: A query visualisation and understanding tool for systematic reviews. In Proceedings of the 27th ACM International Conference on Information and Knowledge Management, Torino, Italy, 22–26 October 2018; pp. 1939–1942. [Google Scholar]
- Russell-Rose, T.; Gooch, P. 2dSearch: A visual approach to search strategy formulation. In Proceedings of the Design of Experimental Search and Information REtrieval Systems (DESIRES 2018), Bertinoro, Italy, 28–31 August 2018. [Google Scholar]
- Curry, E. Dataspaces: Fundamentals, Principles, and Techniques. In Real-Time Linked Dataspaces; Springer: Berlin/Heidelberg, Germany, 2020; pp. 45–62. [Google Scholar]
- Franklin, M.; Halevy, A.; Maier, D. From databases to dataspaces: A new abstraction for information management. ACM Sigmod Rec. 2005, 34, 27–33. [Google Scholar] [CrossRef]
- Balalau, O.; Galhardas, H.; Manolescu, I.; Merabti, T.; You, J.; Youssef, Y. Graph integration of structured, semistructured and unstructured data for data journalism. arXiv 2020, arXiv:2007.12488. [Google Scholar]
- Martinez-Gil, J. Automated knowledge base management: A survey. Comput. Sci. Rev. 2015, 18, 1–9. [Google Scholar] [CrossRef]
- Auer, S.; Bizer, C.; Kobilarov, G.; Lehmann, J.; Cyganiak, R.; Ives, Z. Dbpedia: A nucleus for a web of open data. In The Semantic Web; Springer: Berlin/Heidelberg, Germany, 2007; pp. 722–735. [Google Scholar]
- Golshan, B.; Halevy, A.; Mihaila, G.; Tan, W.C. Data integration: After the teenage years. In Proceedings of the 36th ACM SIGMOD-SIGACT-SIGAI Symposium on Principles of Database Systems, Raleigh, NC, USA, 14–19 May 2017; pp. 101–106. [Google Scholar]
- Mountantonakis, M.; Tzitzikas, Y. Large-scale semantic integration of linked data: A survey. ACM Comput. Surv. 2019, 52, 1–40. [Google Scholar] [CrossRef]
- Arya, A.; Kuchhal, V.; Gulati, K. Survey on Data Deduplication Techniques for Securing Data in Cloud Computing Environment. Smart Sustain. Intell. Syst. 2021, 443–459. [Google Scholar] [CrossRef]
- Christophides, V.; Efthymiou, V.; Palpanas, T.; Papadakis, G.; Stefanidis, K. End-to-end entity resolution for big data: A survey. arXiv 2019, arXiv:1905.06397. [Google Scholar]
- Gröger, C.; Schwarz, H.; Mitschang, B. The deep data warehouse: Link-based integration and enrichment of warehouse data and unstructured content. In Proceedings of the 2014 IEEE 18th International Enterprise Distributed Object Computing Conference, Ulm, Germany, 1–5 September 2014; pp. 210–217. [Google Scholar]
- Roy, P.; Mohania, M.; Bamba, B.; Raman, S. Towards automatic association of relevant unstructured content with structured query results. In Proceedings of the 14th ACM International Conference on Information and Knowledge Management, Bremen, Germany, 31 October–5 November 2005; pp. 405–412. [Google Scholar]
- Rosling, H. Gapminder—USA’s Life Expectancy Line-Chart. Available online: tinyurl.com/gapminderlinechart (accessed on 6 February 2020).
- Gabbert, E. Keywords vs. Search Queries: What’s the Difference? Available online: https://www.wordstream.com/blog/ws/2011/05/25/keywords-vs-search-queries (accessed on 6 February 2020).
- Everett, N. Loading Wikipedia’s Search Index for Testing. 2016. Available online: https://www.elastic.co/blog/loading-wikipedia (accessed on 6 February 2020).
- Team, E.D. Simple Query String Query. 2018. Available online: https://www.elastic.co/guide/en/elasticsearch/reference/current/query-dsl-simple-query-string-query.html (accessed on 15 February 2020).
- Feynman, R. Ebnf: A Notation to Describe Syntax. 2016. Available online: http://www.ics.uci.edu/~pattis/misc/ebnf2.pdf (accessed on 6 May 2022).
- Pennington, J.; Socher, R.; Manning, C.D. Glove: Global vectors for word representation. In Proceedings of the 2014 Conference on Empirical Methods in Natural Language Processing (EMNLP), Doha, Qatar, 25–29 October 2014; pp. 1532–1543. [Google Scholar]
- Rehurek, R.; Sojka, P. Gensim–Python Framework for Vector Space Modelling; NLP Centre, Faculty of Informatics, Masaryk University: Brno, Czech Republic, 2011; Volume 3. [Google Scholar]
- Loper, E.; Bird, S. NLTK: The natural language toolkit. arXiv 2002, arXiv:cs/0205028. [Google Scholar]
- Fellbaum, C. WordNet. In Theory and Applications of Ontology: Computer Applications; Springer: Berlin/Heidelberg, Germany, 2010; pp. 231–243. [Google Scholar]
- Bhogal, J.; MacFarlane, A.; Smith, P. A review of ontology based query expansion. Inf. Process. Manag. 2007, 43, 866–886. [Google Scholar] [CrossRef]
- Rosling, H. Geography Related Dataset from Gapminder. 2018. Available online: https://www.gapminder.org/data/geo/ (accessed on 6 February 2020).
- Brockwell, P.J.; Davis, R.A. Introduction to Time Series and Forecasting; Springer: Berlin/Heidelberg, Germany, 2016. [Google Scholar]
- Virtanen, P.; Gommers, R.; Oliphant, T.E.; Haberland, M.; Reddy, T.; Cournapeau, D.; Burovski, E.; Peterson, P.; Weckesser, W.; Bright, J.; et al. SciPy 1.0: Fundamental algorithms for scientific computing in Python. Nat. Methods 2020, 17, 261–272. [Google Scholar] [CrossRef] [PubMed]
- Yang, C.; He, Z.; Yu, W. Comparison of public peak detection algorithms for MALDI mass spectrometry data analysis. BMC Bioinform. 2009, 10, 4. [Google Scholar] [CrossRef]
- Lashkari, A.H.; Mahdavi, F.; Ghomi, V. A boolean model in information retrieval for search engines. In Proceedings of the 2009 International Conference on Information Management and Engineering, Kuala Lumpur, Malaysia, 3–5 April 2009; pp. 385–389. [Google Scholar]
- Team, W. Wikimedia Downloads. 2020. Available online: https://dumps.wikimedia.org/other/cirrussearch/ (accessed on 15 February 2020).
- Keogh, E.; Ratanamahatana, C.A. Exact indexing of dynamic time warping. Knowl. Inf. Syst. 2005, 7, 358–386. [Google Scholar] [CrossRef]
- M ü ller, M. Dynamic time warping. In Information Retrieval for Music and Motion; Springer: Berlin/Heidelberg, Germany, 2007; pp. 69–84. [Google Scholar]
- Memon, A.; Banerjee, I.; Nagarajan, A. What test oracle should I use for effective GUI testing? In Proceedings of the 18th IEEE International Conference on Automated Software Engineering, Montreal, QC, Canada, 6–10 October; 2003; pp. 164–173. [Google Scholar]
- Blei, D.M.; Ng, A.Y.; Jordan, M.I. Latent dirichlet allocation. J. Mach. Learn. Res. 2003, 3, 993–1022. [Google Scholar]
- Reimers, N.; Gurevych, I. Sentence-BERT: Sentence Embeddings using Siamese BERT-Networks. In Proceedings of the 2019 Conference on Empirical Methods in Natural Language Processing. Association for Computational Linguistics, Hong Kong, China, 3–7 November 2019. [Google Scholar]
- Rosling, H. Gapminder—Life Expectancy vs Income Bubble-Chart. Available online: https://tinyurl.com/gapminderbubblechart (accessed on 6 May 2022).

Publisher’s Note: MDPI stays neutral with regard to jurisdictional claims in published maps and institutional affiliations. |
© 2022 by the authors. Licensee MDPI, Basel, Switzerland. This article is an open access article distributed under the terms and conditions of the Creative Commons Attribution (CC BY) license (https://creativecommons.org/licenses/by/4.0/).
Share and Cite
Christino, L.; Ferreira, M.D.; Paulovich, F.V. Q4EDA: A Novel Strategy for Textual Information Retrieval Based on User Interactions with Visual Representations of Time Series. Information 2022, 13, 368. https://doi.org/10.3390/info13080368
Christino L, Ferreira MD, Paulovich FV. Q4EDA: A Novel Strategy for Textual Information Retrieval Based on User Interactions with Visual Representations of Time Series. Information. 2022; 13(8):368. https://doi.org/10.3390/info13080368
Chicago/Turabian StyleChristino, Leonardo, Martha D. Ferreira, and Fernando V. Paulovich. 2022. "Q4EDA: A Novel Strategy for Textual Information Retrieval Based on User Interactions with Visual Representations of Time Series" Information 13, no. 8: 368. https://doi.org/10.3390/info13080368
APA StyleChristino, L., Ferreira, M. D., & Paulovich, F. V. (2022). Q4EDA: A Novel Strategy for Textual Information Retrieval Based on User Interactions with Visual Representations of Time Series. Information, 13(8), 368. https://doi.org/10.3390/info13080368