Article

Text Classification Using Intuitionistic Fuzzy Set Measures—An Evaluation Study

by
George K. Sidiropoulos
,
Nikolaos Diamianos
,
Kyriakos D. Apostolidis
and
George A. Papakostas
*
MLV Research Group, Department of Computer Science, International Hellenic University, 65404 Kavala, Greece
*
Author to whom correspondence should be addressed.
Information 2022, 13(5), 235; https://doi.org/10.3390/info13050235
Submission received: 3 April 2022 / Revised: 1 May 2022 / Accepted: 3 May 2022 / Published: 5 May 2022

Abstract

:
A very important task of Natural Language Processing is text categorization (or text classification), which aims to automatically classify a document into categories. This kind of task includes numerous applications, such as sentiment analysis, language or intent detection, heavily used by social-/brand-monitoring tools, customer service, and the voice of customer, among others. Since the introduction of Fuzzy Set theory, its application has been tested in many fields, from bioinformatics to industrial and commercial use, as well as in cases with vague, incomplete, or imprecise data, highlighting its importance and usefulness in the fields. The most important aspect of the application of Fuzzy Set theory is the measures employed to calculate how similar or dissimilar two samples in a dataset are. In this study, we evaluate the performance of 43 similarity and 19 distance measures in the task of text document classification, using the widely used BBC News and BBC Sports benchmark datasets. Their performance is optimized through hyperparameter optimization techniques and evaluated via a leave-one-out cross-validation technique, presenting their performance using the accuracy, precision, recall, and F1-score metrics.

1. Introduction

Text classification is one of the most important tasks of Natural Language Processing (NLP) and Machine Learning (ML). The role of text classification (or text categorization) is to classify a document into predefined categories automatically. Texts contain much information that can be crucial for businesses; however, the manual extraction of such information can be very difficult and time consuming. For this reason, companies use text classifiers in order to manage the vast plethora of free texts in an effective way.
Text classification has experienced great interest in the literature, with methodologies focusing on various aspects of the classification and analysis process. One of the most important aims in the field is sentiment analysis [1,2], which determines if a text has a positive, negative, or neutral meaning. Other approaches aim to detect the language the text is written in [3,4] or even its intention, especially in customer conversations where they aim to understand the customer’s purposes [5]. All these applications are mainly used in social media monitoring, brand monitoring, customer service, and the voice of the customer. Another common and important application of text classification is topic labeling, which aims to find the topic of a free text. A significant implementation of topic labeling is the organization or recommendation of articles according to their purposes [6].
The most common algorithms for text classification use machine learning and deep learning methods, which present very good results. Naive Bayes (NB), Support Vector Machine (SVM), and K-Nearest Neighbor (KNN) are some of the most-used classifiers in machine learning for text classification. In deep learning, Convolutional Neural Networks (CNNs) and Recurrent Neural Networks (RNNs) are the most types of networks used to classify documents.
A very fitting mathematical theory for these kinds of problems is Fuzzy Set (FS) theory. FS theory, in contrast to classical set theory which assesses the belongingness of an element to a set in binary terms, allows for gradual assessments. Zadeh [7] proposed the theory of FSs in 1965 which introduced the degree of membership. FSs have become very useful, and their application has been considered in many real-world problems in order to deal with vague information. One of the most successful applications of Fuzzy Sets in the industrial and commercial field was achieved with fuzzy controllers [1]. Furthermore, they are widely used in problems with incomplete and imprecise information such as bioinformatics [8]. Another crucial application of FSs is the automobile industry using Mamdani’s approach. Later, in 1986, Atanassov [9] introduced Intuitionistic Fuzzy Sets (IFSs), which are an improved version of FSs as they are able to solve more complex problems, introducing the non-membership function.
The application of FS theory in pattern recognition, medical diagnosis, image segmentation, or classification in general, has been considered and employed for many years now, and it is enabled by the use of Intuitionistic Fuzzy measures. Those measures aim to calculate the distance or similarity between the fuzzy patterns of a class and that of a new sample to determine to which the class it belongs. For this reason, the literature has focused extensively to develop such mathematical measures, which can be used to calculate the distance between patterns as best as possible, maximizing the distance between samples of different classes and minimizing it on similar samples. Moreover, FSs have the advantage of being able to handle uncertainties, which is a very common drawback of many approaches. Taking into account the important requirements of text classification combined with the usefulness of FS theory, the need to evaluate the existing IFS measures for their application in text document classification is required. For this purpose, in this work, we use a framework for text classification that was proposed by [10], with the aim of evaluating the application of IFS theory for text classification and the different IFS measures that have been proposed in the last 30 years, as well as to highlight the important aspects of the application of FS theory in the specific domain.
This paper contributes to the thorough study of text classification using Fuzzy Sets, with several different distance and similarity measures being tested on two famous text classification datasets. Moreover, the effectiveness of using FSs and IFSs for the specific problem is highlighted through a detailed comparison of the measures, using the framework mentioned above, as well as comparing their application with other, conventional, machine learning models.
The rest of the paper is organized as follows. Section 2 provides the related works on text classification using FS theory. Section 3 presents some information about Fuzzy and Intuitionistic Fuzzy Sets, along with the datasets, tools and evaluation protocol used to conduct the experiments. Section 4 shows the results obtained, and Section 5 discusses the results and compares them to those of conventional machine learning models. Finally, Section 6 concludes the paper.

2. Related Work

The theory of FS was proposed in 1965 by Zadeh [7] in order to deal with a large number of functional problems. In fact, FSs are the sweeping form of classical sets, which were carried out, basically, in control systems, as early as the 1980s. FSs allow to gradually assess if an element belongs to a set via a membership function, which values the belongingness in the real unit interval [ 0 ,   1 ] . This number reflects the degree of association of the element with a given set, with 0 meaning it does not belong to the set, whereas 1 means that it completely belongs to the set. This degree of association is called the membership value, and the non-association of a number in a set can be described by a value called the non-membership value, represented by 1 minus the membership value of the number.
A very common application of FSs is feature selection for text classification, where the incorporation of the fuzziness and fuzzy logic in feature selection has shown improvements. A. Z. Bushra et al. [11] presented a feature selection methodology aiming to improve the existing issue of selecting overlapping features.
Fuzzy Sets and similarity measures have been exploited for text classification with good results [12]. Fuzzy Sets have been used in a Similarity-Based Concept Mining Model [13] for text categorization into pre-defined category groups. They have also been used for dimensionality reduction of the feature vector in the process of feature clustering in text classification [14]. Y. Jiang et. al [15] proposed a method that classified multi-labeled text using fuzzy similarity and K-Nearest Neighbors (KNNs), which showed very competitive results compared to other methods, avoiding the high computational cost of a KNN using a fuzzy similarity measure to group the patterns into clusters. Moreover, IFSs and similarity measures have been used for text categorization, yielding good results [10]. The proposed framework exploits statistical methods to represent a document as an IFS, “learning” then its IFS patterns. Szmidt and Kacprzyk [16] proposed another text classification algorithm, using IFSs, highlighting their importance for text classification due to their robustness in imbalanced classes.
More recently, the literature has shifted towards combining the theory of fuzzy logic and Fuzzy Sets with machine learning, especially Convolutional Neural Networks (CNNs), as they have shown great success in Natural Language Processing problems. For example, M. Bounabi et al. [17] exploited fuzzy logic and improved the performance of ML models such as Naive Bayes, Support Vector Machines, and Random Forest classifiers. On the other hand, B. Behera [18] combined a Fuzzy-Rough-Set-based robust nearest neighbors algorithm with a CNN-based feature extraction method, for text document classification and feature extraction, showing important improvements compared to other approaches and models. Moreover, S. Puri [19] presented two systems for text classification, called the Concept-Based Mining Model using a Threshold and the Fuzzy Similarity-based Concept Mining Model using Feature Clustering. These models perform the processes of cutting off, feature extraction, and feature selection during the preprocessing steps, showing high feature reduction and classification accuracy rates.

3. Materials and Methods

3.1. Important Definitions

Here, we describe the definitions of Fuzzy Sets and Intuitionistic Fuzzy Sets, as well as the definitions and constraints of a distance and similarity measure when applied in Fuzzy Set theory.

3.1.1. Fuzzy Sets

A Fuzzy Set A in a universe of discourse X is defined, according to FS theory [7], as a set of ordered pairs:
A = { ( x , μ A ( x ) ) / x ϵ X }
where the function μ A : X [ 0 ,   1 ] defines the degree of membership of the element x ϵ X .

3.1.2. Intuitionistic Fuzzy Sets

Similarly, an Intuitionistic Fuzzy Set A in X is defined as follows [9]:
A = { x , μ A ( x ) ) , ν A ( x ) / x ϵ X }
where the function ν A : X [ 0 ,   1 ] defines the degree of non-membership of an element x ϵ X , such that
0 μ A ( x ) + ν A ( x ) 1 , x ϵ X
An important extension to IFS theory is the introduction of the hesitation (or hesitancy) degree of an element x belonging to a set A, defined as follows:
π A ( x ) = 1 μ A ( x ) ν A ( x )
It is obvious from Equations (3) and (4) that 0 π A ( x ) 1 , x ϵ X . It should also be noted that in the case of FSs, an element’s hesitation degree is π A ( x ) = 0 , x ϵ X , which can be described as a particular case of an IFS.

3.1.3. Distance Measure

A distance measure describes how different elements of a set are, and its definition is described as follows.
Definition 1.
A distance d in a nonempty set A is a real function  d : A × A [ 0 ,   + )  that satisfies the following conditions,  x , y , z ϵ A  [20]:
 C1
d ( x , y ) = 0 x = y  (coincidence);
 C2
d ( x , y ) = d ( y , x )  (symmetry);
 C3
d ( x , z ) + d ( z , y ) d ( x , y )  (triangle inequality).
A very simple function to measure the distance between two FSs A and B is the Euclidean distance [21]:
e 1 ( A , B ) = i = 1 n ( μ A ( x i ) μ B ( x i ) ) 2
The above Equation (5) was extended for application in IFSs to incorporate the non-membership values ν ( . ) [22]:
e 2 ( A , B ) = 1 2 i = 1 N ( μ A ( x i ) μ B ( x i ) ) 2 + ( ν A ( x i ) ν B ( x i ) ) 2
as well as the incorporation of the hesitation degrees [23]:
e 3 ( A , B ) = 1 2 i = 1 N ( μ A ( x i ) μ B ( x i ) ) 2 + ( ν A ( x i ) ν B ( x i ) ) 2 + ( π A ( x i ) π B ( x i ) ) 2

3.1.4. Similarity Measure

A similarity measure is defined as follows:
Definition 2.
A similarity S in a nonempty set A is a real function  S : A × A [ 0 , 1 ]  that satisfies the following conditions,  x , y , z ϵ A  [24,25,26]:
 C1
S ( x , y ) = 1  if and only if  x = y  (coincidence);
 C2
S ( x , y ) = S ( y , x )  (symmetry);
 C3
i f x y z , then  S ( x , z ) S ( x , y )  and  S ( x , z ) S ( y , z )  (triangle inequality).
The first similarity measure was proposed by S. M. Chen [27]:
S ( A , B ) = 1 N i = 1 N 1 | S A ( x i ) S B ( x i ) | 2
where S k ( x i ) = μ k ( x i ) ν k ( x i ) , k = { A , B } .

3.2. Evaluation Protocol

The protocol followed in our study was proposed by P. Intarapaiboon [10]. This protocol performs a pattern learning process, where the IFS patterns of each class of document are learned. Using those learned patterns, any new document can be classified by extracting its IFS patterns. The classification process is performed by finding the class in which the IFS patterns have the lowest distance or highest similarity with the new document.
Figure 1 shows the preprocessing step of the protocol, which includes the document preprocessing and the IFS pattern learning. In this step, the raw documents are cleaned, converted into a bag-of-words vector, and then, transformed into the IFS-based representation. Lastly, the IFS-based representation is used to calculate the IFS patterns of each class of document (called pattern learning).
At the testing step, a test document d i is converted into the IFS representation, and the class C k with the closest pattern to the test document is selected as the document’s class. The closest pattern is determined by using a distance or similarity measure.

3.2.1. Bag-of-Words Representation

This type of representation is the most widely used method for representing a text document as numbers in NLP. Based on this process, a text document is represented by the frequency of occurrence of each word. For a bag-of-words to be formulated, it requires a vocabulary of the known words (the words to be included) or the usage of a threshold value to cut off words with low frequency. Thus, a document’s d i bag-of-words vector V for h words can be represented as follows:
V = ( n i , 1 , n i , 2 , n i , 3 , , n i , h )
where n is the number of occurrences of each word of the vocabulary.

3.2.2. IFS Representation

To transform a bag-of-words representation of a document d i into an IFS-based representation, the following steps were followed (as proposed by [10]). Let us define
z i , j = n i , j m e a n j s t d j
where n i , j is the number of occurrences of word j in d i and m e a n j and s t d j are the mean and standard deviation of occurrences of word j in all documents of each class.
Thus, to calculate the membership and non-membership values of d i , a weighted sigmoid function is used:
μ i , j = r j 1 + e z i , j
ν i , j = r j * 1 + e z i , j
where r j and r j * are weights ϵ [ 0 ,   1 ] . The hesitation degree is then calculated using Equation (4).

3.2.3. IFS Pattern Learning

Lastly, for the pattern learning step, the IFS pattern of class C k is denoted by P k , is defined by:
P k = { ( μ ˜ k , ν ˜ k ) }
where μ ˜ k and ν ˜ k are the average values of the membership and non-membership values of all the documents belonging to class C k .

3.2.4. Document Classification

A document’s class is determined according to how dissimilar (for distances) or similar (for similarities) its patterns are to the class patterns calculated in the previous step. To calculate a new document’s IFS representation, the m e a n j and s t d j values calculated during the class pattern learning step are used.
Therefore, to determine a new document’s d n class C , the following equations can be used to classify a test document:
C = a r g min C k { D i s t ( P k , I F S d n ) }
C = a r g max C k { S i m ( P k , I F S d n ) }
where D i s t and S i m are the Distance and Similarity measures, respectively between the IFSs, P k are the class patterns calculated during the IFS pattern learning step for class C k , and I F S d n is the IFS representation of the new document d n .

3.3. Experimental Setup

3.3.1. Distance and Similarity Measures
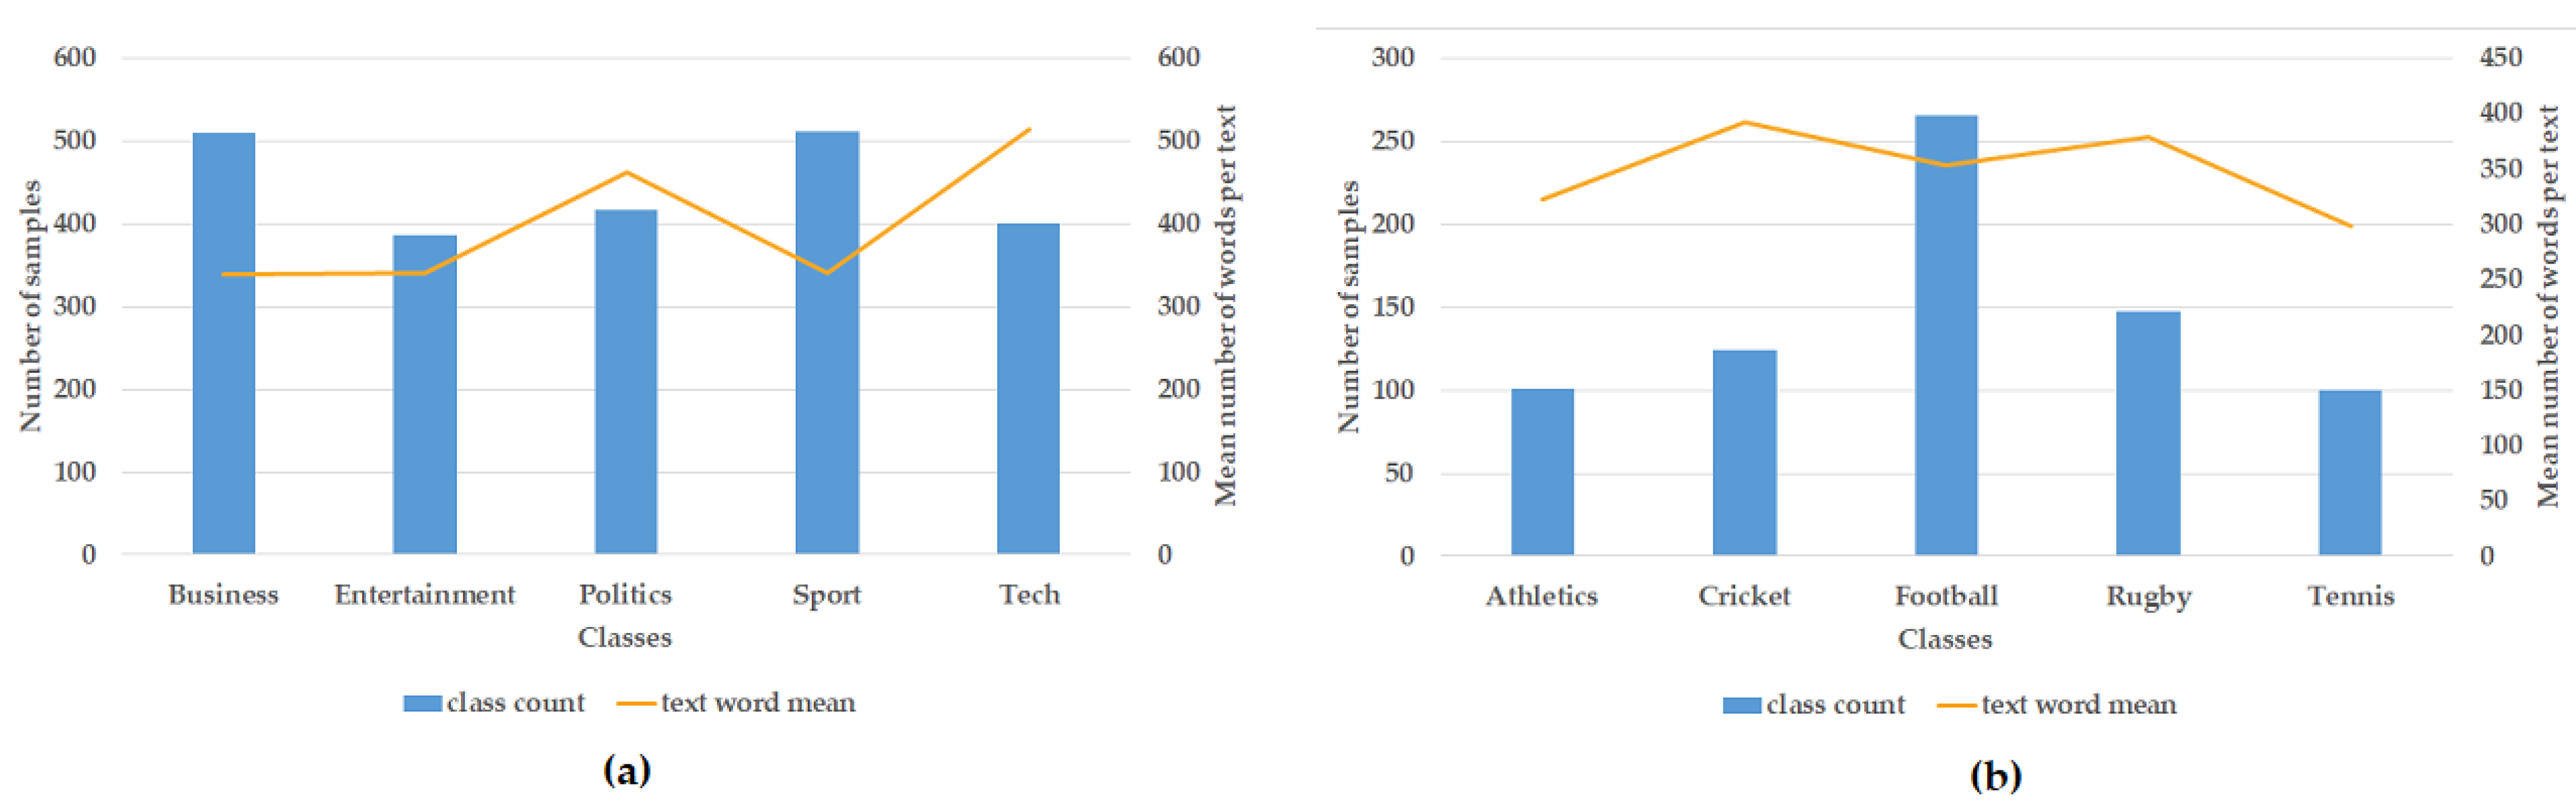
In this study, we evaluated the performance of 43 similarity measures and 19 distance measures, all provided by the fsmpy Python library [28]. Table 1 and Table 2 show the names of the authors that proposed the corresponding measure in the first column, the parameters (other than the two Intuitionistic Fuzzy Sets A and B and the type of similarity) that are required by the functions to calculate the corresponding measure, and in the third column, the name of the proposed function that the authors used in the original study to mathematically describe it. As two of the measure d h proposed by [22,29] have the same name, the latter one was renamed to d h 2 . Furthermore, all the mathematical expressions of the measures are presented in Appendix A.
At this point, it should be mentioned that not all of the measures available in the fsmpy library were compared in this study. A total of 27 measures were not included as their implementations are not trustworthy enough, failing to pass the required tests by the library. Specifically, the rest of the measures proposed by [32] ( S h p ), [43] (namely, L 3 , L 4 , L 6 , N 4 , N 5 , and N 7 ), [37] ( S n e w 1 ) [42] (namely, S ˜ 11 , S ˜ 19 , S ˜ 14 , S ˜ 18 , S ˜ 13 , S ˜ 15 , S ˜ 13 , S ˜ 15 , S ˜ 11 c , S ˜ 19 c , S ˜ 14 c , S ˜ 18 c , S ˜ 2 c , S ˜ 6 c , S ˜ 13 c , S ˜ 15 c ), [49] ( S F ) and [27] (T) were not included.
It is worth mentioning that in order to optimize the performance of the measures, a hyperparameter optimization technique was employed using both the fsmpy and Scikit-Optimize libraries. For the optimization process, we employed the Bayesian optimization technique, which, contrary to the Grid Search optimization technique, does not try out all the parameter values, but only a fixed number of parameter settings from specified distributions. The performance of each parameter combination was tested over a 10-fold cross-validation technique, with the best one being selected according to the highest F1-score metric. It should be noted that the weights parameter was set to w e i g h t s = 1 / n , where n is the number of elements in the set.

3.3.2. Datasets

The datasets that were used in our experiments are presented and described below:
  • BBC News: This consists of 2225 articles belonging to 5 topic areas (business, entertainment, politics, sports, and tech) from 2004 and 2005, with a total of 9635 words [50].
  • BBC Sports: Similar to the previous one, it contains 737 articles from 5 areas, namely athletics, cricket, football, rugby, and tennis, having a total of 4613 words [50].
Figure 2 shows, for each dataset, the number of samples for each class, along with the mean number of words of the sample texts. More specifically, as shown in Figure 2a, the classes in the BBC News dataset have a balanced distribution of samples, with 386 entertainment-type and 511 sports-type documents. The classes have a balanced word count as well, with the texts belonging to the class business having a mean word count of 339 (the lowest) and tech having 513 (the highest).
For the BBC Sports case though, the distribution of the samples is not as balanced. As shown in Figure 2b, the football class has the highest number of samples (265), with the rest of the classes having 100–150 samples On the other hand, the mean number of words per text is balanced across all classes, with the tennis class having a mean word count of 298 (lowest) and cricket having 391 (highest).

3.3.3. Data Preparation

The data preparation step consisted of the following steps:
  • Documents’ conversion to bag-of-words;
  • Word-by-word preprocessing:
    (a)
    Remove escape characters;
    (b)
    Convert to lower case;
    (c)
    Lemmatize word.
  • Cut-off words with a document frequency lower than a 0.01 frequency.
It is worth noting that lemmatization is the process of converting variations of a word to its base form, for example: “does”, “doing”, and “did” were converted to “do” and “am” and “are” and “is” to “be”. For this process, the Scikit-learn [51] and Natural Language Toolkit [52] libraries were used. Moreover, the chosen by trial and error cut-off frequency resulted in the BBC News dataset containing a bag-of-words of 2540 words and BBC Sports 2396 words.

3.3.4. Performance Evaluation

The performance of each measure was evaluated using the accuracy, precision, recall, and F1-score metrics, as well as the Degree of Confidence (DoC) proposed by A.G. Hatzimichailidis et al. [53]. To calculate the Degree of Confidence metric, the fsmpy library was used and the Scikit-learn library for the rest of the metrics. These metrics are widely used in classification studies to evaluate the performance of an algorithm or model, with the DoC being used in the literature on FS theory.
More specifically, the DoC measures the confidence at which the measure can recognize a specific sample belonging to a specific pattern. As a result, higher values of the DoC show that the measure has more confidence when predicting a sample’s class. Moreover, to calculate the precision, recall, and F1-score, we used their “macro” average, calculating the metrics for each label and finding their unweighted mean.

4. Results

In our study, we evaluated the performance of 43 similarity measures and 19 distance measures, in the classification of text documents of two different datasets. The experiments were conducted using the Python programming language along with the Scikit-learn and fsmpy libraries. Moreover, we examined the performance of each parameter group by following a grid search technique for r j and r j * , by selecting five linearly spaced values over the interval [ 0.1 ,   1 ] . Specifically, the r j and r j * values that were tested were the following: { 0.1 ,   0.325 ,   0.55 ,   0.775 ,   1 }
After finding the best parameters of each measure, along with their best membership and non-membership weights, we validated their performance on each dataset by employing a leave-one-out cross-validation technique. In this validation technique, a single sample is considered for testing in each fold.
Table 3, Table 4, Table 5 and Table 6 show the performance of the similarity and distance measures on each dataset. Each table shows the name of the measure as mentioned in the corresponding study that introduced it, the best parameters (where applied) obtained from the hyperparameter optimization, the best membership and non-membership weights obtained, the accuracy, precision, recall, and F1-score performance metrics, and the mean DoC of the measure.
Specifically, Table 3 and Table 4 show the performance of the similarity and distance measures on the BBC News dataset and Table 5 and Table 6 their performance on the BBC Sports dataset.

5. Discussion

In general, the application of the evaluation protocol proposed by [10] shows very good classification performance, in most of the similarity or distance measures. First of all, the most important aspect of such an approach for text classification is that it requires no training process. As a result, the performance is not affected by any imbalanced class distribution, with the presented study highlighting this advantage. As shown in Figure 2, the class distribution in the BBC Sports dataset is imbalanced, which would result in an overfitting towards one of the classes if a machine learning model were applied.
Secondly, the results highlight the importance of which IFS measure is used for this type of classification problem. Although most of the measures performed above 90% in accuracy and F1-score, there were a few that performed very poorly.
Thirdly, similarity measures showed very poor prediction confidence, with the distance measure (on the contrary) showing very confident predictions. Despite that, they performed (on average) better than the distance measures, although with a very small difference. Thus, the experimental results showed that the distance should be preferred, as it had high classification performance with very good confidence.
Lastly, by comparing the types of similarities, it can be observed that there was no change in the performance, showing that there was no significant difference between them. This can be highlighted more when taking into account the best parameters obtained from the hyperparameter optimization process, where measures of the same type had the same best parameters, as well as membership and non-membership weights.
Below, we discuss the results obtained for each dataset in more detail.

5.1. BBC News Results

It is obvious that the results obtained from different similarity measures, as well as distance measures were quite similar. Starting with the results obtained from the similarity measures, the ones that performed the best were from W.L. Hung and M.S. Yang [35] with 94.83% accuracy, 94.67% precision, 94.62% recall, and 94.63% F1-score. The next-best-performing measure was by J. Ye [39] with 91.70% and Y. Song, X. Wang, L. Lei, and A. Xue [44] with a 94.56% F1-score. Despite the best performance regarding those metrics, their DoC was not the highest as S p k 2 had the highest DoC despite having much lower performance. There were, though, quite a few measures that performed below 50%, with the worst performance being at 49.17% accuracy, 39.46% precision, 47.68% recall, 37.84% F1-score, and 0 DoC by S w 2 . Therefore, these types of measures are not well suited for document classification, as they fail to capture those important similarities between the Intuitionistic Fuzzy Sets of the documents and classes. Moreover, the measures’ performance regarding the DoC showed that there were no large differences between the similarities calculated for the chosen classes compared to the other classes. This shows that, despite the very good performance of some measures (or even all of them), they were not that confident for their prediction.
As for the distance measures, the best-performing one was that of I.K. Vlachos and G.D. Sergiadis [48] with 94.25% accuracy, 94.10% precision, 93.98% recall, and 94.02% F1-score, followed by all the Euclidean-based distances, specifically d e , d n e , d I F S 1 , l I F S 1 , l h , d 1 , d e h , and e e h with 93.17% accuracy, 93.19% precision, 92.76% recall, and 92.86% F1-score. In contrast with the DoC of the similarities, the distances seemed to be more confident about their prediction, with D I F S having the highest confidence of 5.5846, showing large distances between the different classes.

5.2. BBC Sports Results

In the case of the BBC Sports dataset, similar ranking results were obtained, but with better performance. Regarding the similarity measures, the measure proposed by J. Ye [39] performed the best with 96.47% accuracy, 96.99% precision, 96.71% recall, 96.84% F1-score, and 0.0023 DoC, followed by the measures proposed by W.L. Hung and M.S. Yang [35] with 96.47% accuracy, 96.69% precision, 96.78% recall, and 96.72% F1-score. The most confident measure was again S p k 2 , despite performing much worse than C I F S .
As for the distance measures, the one proposed by I.K. Vlachos and G.D. Sergiadis [48] performed the best, with 95.39% accuracy, 97.07% precision, 95.02% recall, 95.94% F1-score, and 3.6342 DoC, followed by the same Euclidean-based measures, as in the previous dataset, with 93.62% accuracy, 96.32% precision, 92.69% recall, and 94.28% F1-score. Similarly, the distances showed higher confidence about their predictions, highlighting that the distances between the classes were larger.

5.3. Comparison with Standard Machine Learning Approaches

To better assess the application of the evaluation protocol, as well as the IFS measures included in the study, we compared the best results obtained for each case with standard ML models on the same datasets. For the comparison, we employed the Decision Tree (DT) and K-Nearest Neighbors (KNN) ML models. Both models were trained on the same datasets, by following the same data preparation, performance evaluation, and hyperparameter optimization processes. Table 7 shows the results obtained from the evaluation of the aforementioned models, along with the results from the best performing similarity and distance measures in both datasets.
The results obtained from the conventional ML models highlight the advantages of the IFS-based classification approaches and IFS measures in general. The first advantage is the better performance of the IFS-based approach on both datasets, showing an improvement of 12% on the BBC News dataset and 10% on the BBC Sports dataset. The best-performing ML model, according to the F1-score metric, on both datasets was the KNN classifier with an 82.79% and 89.16% F1-score, respectively. The Decision Tree model performed at about the same, with 81.61% accuracy, 81.85% precision, 81.04% recall, and 81.31% F1-score, a small difference compared to the KNN.
The second advantage of the IFS-based text classification is that it does not include any training process, by-passing the issue of class imbalance and overfitting on the class with the most samples. This is a very important characteristic, as datasets tend to be very imbalanced, with many methodologies being proposed to tackle this issue. The overfitting of the model (and lack thereof on the S p c ) can be observed in Figure 3, where the confusion matrices are shown during the validation of both. In the first case of the DT (Figure 3a), the model overfitted towards the football class, falsely predicting samples of other classes. On the other hand, the S p c (Figure 3b) similarity (or the evaluation protocol in general) was not affected by the class imbalance.

6. Conclusions

In this study, we evaluated the performance of 62 Intuitionistic Fuzzy Set measures on the same base towards classifying texts from two datasets, for the first time in the literature. Their performance was evaluated by following the protocol proposed by P. Intarapaiboon [10], where the documents are represented as Intuitionistic Fuzzy Sets by firstly converting the texts into bag-of-words representations. Then, by using a sigmoid function to calculate the membership and non-membership values of the documents (and the classes), given the membership and non-membership weights, the IFS representation and patterns were obtained. Moreover, we optimized the performance of each measure separately, by finding the combination of parameter values and membership and non-membership weights that yielded the best results in a 10-fold cross-validation technique. Their performance was then validated by employing the leave-one-out cross-validation technique.
The results obtained highlight a number of important findings. Firstly, although the functions are different, in the case of text document classification, their performance was not significantly different, as the results obtained for the different measures were the same in most cases. This can be attributed to the fact that some studies aim to overcome the drawbacks of previous measures, such as the measure proposed by H.B. Mitchell [25], who revised the measure proposed by L. Dengfeng and C. Chuntian [24]. Secondly, Hamming-based distance measures had an F1-score lower than 50%, which shows that the problem of text classification is not as simple as calculating the absolute difference between two sets. Thirdly, the similarities maintained a very low degree of confidence during their predictions, which shows that the resulting class patterns were very similar. Moreover, the DoC requires similarities to be converted to distances via the formula 1 S . As a result, in combination with the definition of the similarities where S : A × A [ 0 ,   1 ] , it is obvious that their confidence will be much lower compared to distances, whose definition “allows” them to have much higher values d : A × A [ 0 ,   + ) . Lastly, different parameters had different effects on each measure, for example in the case of S p e , for different values of the parameter a, the performance remained almost the same during the hyperparameter optimization technique, with an std of 0.7%, while L 5 had an std of 9% for different values of p.
Despite the wide range of different similarity measures included in the study, there were some measures that were not included. For instance, the similarity measure proposed by Z. Xu [54], which was also included in [10], was not evaluated in the study. Additionally, the types of measures evaluated in our study (distances and similarities) are the first ones that have been proposed and employed for problems such as pattern recognition, medical diagnosis, image segmentation, or classification in general. For this reason, our analysis and evaluation were focused on those. In the future, some other types of measures have to be analyzed in the same manner, such as divergence, correlation, inclusion, and others.

Author Contributions

Conceptualization, G.K.S. and G.A.P.; methodology, G.K.S., N.D. and K.D.A.; software, G.K.S., N.D. and K.D.A.; validation, G.K.S., N.D. and K.D.A.; investigation, G.K.S., N.D. and K.D.A.; resources, G.K.S., N.D. and K.D.A.; data curation, G.K.S., N.D. and K.D.A.; writing—original draft preparation, G.K.S. and K.D.A.; writing—review and editing, G.K.S. and G.A.P.; visualization, G.K.S.; supervision, G.A.P.; project administration, G.A.P. All authors have read and agreed to the published version of the manuscript.

Funding

This research received no external funding.

Informed Consent Statement

Not applicable.

Data Availability Statement

Not applicable.

Acknowledgments

This work was supported by the MPhil program “Advanced Technologies in Informatics and Computers”, hosted by the Department of Computer Science, International Hellenic University, Greece.

Conflicts of Interest

The authors declare no conflict of interest.

Appendix A

Table A1, Table A2 and Table A3 show the mathematical expressions of the similarity measures and Table A4 all the distance measures presented in our study. To simplify the expressions below, we use the following notations:
μ = μ A ( i ) , ν = ν A ( i ) , π = π A ( i ) , m = μ B ( i ) , n = ν B ( i ) , p = π B ( i ) , Δ μ = μ m , Δ ν = ν n , Δ π = π p = i = 1 N
with i ϵ { 1 , 2 , , N } being the n t h membership, non-membership, or hesitation degree of the set and w i being the weight of x i ϵ X = { x 1 , x 2 , , x N } , with 0 w i 1 .
Table A1. Mathematical expressions of the reviewed similarity measures I.
Similarity MeasureExpression
S e w i 1 ( μ ν ) ( m n ) 2 / w i
M H w i 1 | a Δ μ + b Δ ν c ( Δ μ + Δ ν ) | a b / w i
where a , b , c 0
S d p 1 1 N ρ | ( μ + 1 ν ) ( m + 1 n ) | ρ ρ
where 0 ρ +
S e p 1 1 N ρ | Δ μ | + | Δ ν | 2 ρ ρ
S s p 1 1 N ρ ( ϕ s 1 ( i ) + ϕ s 2 ( i ) ) ρ ρ
where ϕ s 1 ( i ) = | m A 1 ( i ) m B 1 ( i ) | / 2 , ϕ s 2 ( i ) = | m A 2 ( i ) m B 2 ( i ) | / 2 ,
m k 1 ( i ) = ( μ k ( i ) + m k ( i ) ) / 2 , m k 2 ( i ) = ( m k ( i ) + 1 ν k ( i ) ) / 2 , m k ( i ) = ( μ k ( i ) + 1 ν k ( i ) ) / 2
S m o d 1 2 S d p μ , m + S d p 1 ν , 1 n
S c 1 d H ( A , B ) 1 + d H ( A , B )
S e e d h ( A , B ) e 1 1 e 1
S l 1 d H ( A , B )
T 1 w i a | Δ μ | ρ + b | Δ ν | ρ + c | Δ π | ρ ρ
where 1 < p < + , a , b , c ϵ [ 0 , 1 ] and a + b + c = 1
S 1 1 2 N ( | δ A δ B | + | α A α B | )
where δ k = μ k + ( 1 μ k ν k ) μ k , α k = ν k + ( 1 μ k ν k ) ν k , with k = { A , B }
S p c 2 ρ L p ( A , B ) 2 ρ ( 1 + L p ( A , B ) )
where L p = 1 N ( | Δ μ | ρ + | Δ ν | ) ρ
S p e e L p ( A , B ) e 2 ρ 1 e 2 ρ
S p l 2 ρ L p ( A , B ) 2 ρ
Table A2. Mathematical expressions of the reviewed similarity measures II.
Similarity MeasureExpression
S g w p 1 w i | Δ μ | + | Δ ν | + | Δ π | 2 ρ ρ
where 0 ρ +
S n e w 2 1 1 exp 1 1 2 | μ m | + | ν n | 1 e n
S p k 1 m i n ( μ , m ) + m i n ( ν , n ) m a x ( μ , m ) + m a x ( ν , n )
S p k 2 1 1 2 m a x i ( | Δ μ | ) + m a x i ( | Δ ν | )
S p k 3 1 ( | Δ μ | + | Δ ν | ) ( | μ + m | + | ν , n | )
S w 1 1 N m i n ( μ , m ) + m i n ( ν , n ) m a x ( μ , m ) + m a x ( ν , n )
S w 2 1 N 1 1 N ( | Δ μ | + | Δ ν | )
S a c U ( a ) J a ( A , B ) ( 1 + J a ( A , B ) ) U ( a )
where U ( a ) = ln 2 a = 1 1 a 1 1 1 2 a 1 a 1 , a > 0 ,
J a ( A , B ) = 1 N j a ( A i , B i ) ,
j a ( A , B ) = 1 a 1 T A B μ a T A B ν a T A B π a a 1 , a > 0 1 2 L A B μ L A B ν L A B π a = 1
T A B q a = q A + q B 2 a 1 2 ( q A a + q B a )
L A B q = ( q A + q B ) l n q A + q B 2 q A ln q A q B ln q B , with q = { μ , ν , π }
S a e e J a ( A , B ) e U ( a ) 1 e U ( a )
S a l U ( a ) J a ( A , B ) U ( a )
C I F S 1 N + p μ A 2 ( i ) + ν A 2 ( i ) μ B 2 ( i ) + ν B 2 ( i )
S I F S 1 3 ( C I F S + C I F S * + C I F S * * )
where C I F S * = 1 N ϕ A ϕ B + ν n ϕ A 2 ν 2 ϕ B 2 n 2 , C I F S * * = 1 N ( 1 μ ) ( 1 m ) + ( 1 ν ) ( 1 n ) ( 1 μ ) 2 + ( 1 ν ) 2 ( 1 m ) 2 + ( 1 n ) 2
with ϕ k = 1 + μ k ν k 2
S n e w , p 1 w i ( | Δ μ | ) ρ ρ w i ( | Δ ν | ) ρ ρ
where w i 0 , ρ 1
S ˜ 1 N + ( T ( μ , m ) + T ( ν , n ) ν A ν B N + m a x { ( μ m ) , ( ν p ) }
T λ ( x , y ) = m i n ( x , y ) i f λ = 0 x y i f λ = 1 m a x ( 0 , x + y 1 ) i f λ = log λ ( 1 + ( λ x 1 ) ( λ y 1 ) λ 1 ) o t h e r w i s e
S ˜ 5 N + ( T ( μ , m ) + T ( ν , n ) ν A ν B ) n μ + m T ( μ , m ) T ( ν , n ) }
S ˜ 2 2 N + ( 2 T ( μ , m ) + 2 T ( ν , n ) μ m ν n ) 2 N + ( T ( μ , m ) + T ( ν , n ) ) m i n { ( μ + p , ( m + ν ) }
S ˜ 6 2 N + ( 2 T ( μ , m ) + 2 T ( ν , n ) μ m ν n ) 2 N
S ˜ 2 ( μ + m + ν + n 2 T ( μ , n ) 2 T ( m , ν ) ) N ( T ( μ , n ) + T ( m , ν ) ) + m a x { ( μ + n ) , ( m + ν ) }
S ˜ 6 ( μ + m + ν + n 2 T ( μ , n ) 2 T ( m , ν ) ) 2 N
S ˜ 1 c N + ( T ( μ , m ) + T ( ν , n ) μ m N m i n { ( μ , ν ) , ( m , n ) }
S ˜ 5 c N + ( T ( μ , m ) + T ( ν , n ) ν n N ( ν + n T ( μ , m ) T ( ν , n ) )
Table A3. Mathematical expressions of the reviewed similarity measures III.
Similarity MeasureExpression
L 5 1 Δ μ + Δ ν μ m + ν n ρ N ρ
N 6 1 Δ μ + Δ ν 2 ρ N ρ
F 5 e 2 ( Δ μ ) ρ N ρ ( Δ ν ) ρ N ρ 1 e 2 1
F 6 1 ( Δ μ ) ρ N ρ u + ( Δ ν ) ρ N ρ v 2 , ( u , v > 0 )
F 7 1 sin π 3.14 2 ( Δ μ ) ρ N ρ + sin π 3.14 2 ( Δ ν ) ρ N ρ 2
S W Y 1 2 w i μ m + 2 ν n + π p + ( 1 ν ) ( 1 n )
S C C L w i 1 | 2 ( μ m ) ( ν n ) | 3 1 π + p 2 | 2 ( ν n ) ( μ m ) | 3 π + p 2
W I F S S s w i ( μ m ) + ( ν n ) ( μ 2 m 2 ) + ( ν n ) 2 w i
Table A4. Mathematical expressions of the reviewed distance measures.
Distance MeasureExpression
d e 1 2 i = 1 n Δ μ 2 + Δ ν 2
d h 1 2 i = 1 n | Δ μ | + | Δ ν |
d n e 1 2 n i = 1 n Δ μ 2 + Δ ν 2
d n h 1 2 n i = 1 n | Δ μ | + | Δ ν |
d I F S 1 1 2 i = 1 n Δ μ 2 + Δ ν 2 + Δ π 2
e I F S 1 1 2 i = 1 n [ | Δ μ | + | Δ ν | + | Δ π | ]
l I F S 1 1 2 n i = 1 n Δ μ 2 + Δ ν 2 + Δ π 2
q I F S 1 1 2 n i = 1 n | Δ μ | + | Δ ν | + | Δ π |
d h 2 max { | Δ μ | , | Δ ν | }
e h 1 N max { | Δ μ | , | Δ ν | }
l h max { Δ μ 2 , Δ ν 2 }
q h 1 N max { Δ μ 2 , Δ ν 2 }
d 1 i = 1 n w i | Δ μ | + | Δ ν | 4 + max { | Δ μ | , | Δ ν | } 2 / i = 1 n w i
d 2 p 1 n ρ i = 1 n | Δ μ | + | Δ ν | 2 ρ ρ
d e h i = 1 n max { | Δ μ | , | Δ ν | , | Δ π | }
l e h 1 N i = 1 n max { | Δ μ | , | Δ ν | , | Δ π | }
l e h max { Δ μ 2 , Δ ν 2 , Δ π 2 }
q e h 1 N max { Δ μ 2 , Δ ν 2 , Δ π 2 }
D I F S I I F S ( A , B ) + I I F S ( B , A ) , where I I F S ( A , B ) = μ ln μ 1 2 ( μ + m ) + ν ln ν 1 2 ( ν + n )

References

  1. Pang, B.; Lee, L. Opinion Mining and Sentiment Analysis. Found. Trends Inf. Retr. 2008, 2, 1–135. [Google Scholar] [CrossRef] [Green Version]
  2. Liu, B. Sentiment Analysis and Opinion Mining. 2012. Available online: https://www.cs.uic.edu/liub/FBS/SentimentAnalysis-and-OpinionMining.pdf (accessed on 14 March 2022).
  3. Řehůřek, R.; Kolkus, M. Language Identification on the Web: Extending the Dictionary Method; Springer: Berlin/Heidelberg, Germany, 2009; pp. 357–368. [Google Scholar] [CrossRef]
  4. Cai, W.; Cai, D.; Huang, S.; Li, M. Utterance-Level End-to-End Language Identification Using Attention-Based CNN-BLSTM. 2019. Available online: https://arxiv.org/abs/1902.07374 (accessed on 14 March 2022).
  5. Brenes, D.J.; Gayo-Avello, D.; Pérez-González, K. Survey and Evaluation of Query Intent Detection Methods. In Proceedings of the 2009 Workshop on Web Search Click Data WSCD ’09, Barcelona, Spain, 9–11 February 2009; Association for Computing Machinery: New York, NY, USA, 2009; pp. 1–7. [Google Scholar] [CrossRef] [Green Version]
  6. Wang, C.; Blei, D.M. Collaborative Topic Modeling for Recommending Scientific Articles; ACM Press: New York, NY, USA, 2011; p. 448. [Google Scholar] [CrossRef]
  7. Zadeh, L. Fuzzy sets. Inf. Control. 1965, 8, 338–353. [Google Scholar] [CrossRef] [Green Version]
  8. Małysiak-Mrozek, B. Uncertainty, imprecision, and many-valued logics in protein bioinformatics. Math. Biosci. 2019, 309, 143–162. [Google Scholar] [CrossRef] [PubMed]
  9. Atanassov, K.T. Intuitionistic Fuzzy Sets. Fuzzy Sets Syst. 1986, 20, 87–96. [Google Scholar] [CrossRef]
  10. Intarapaiboon, P. A Framework for Text Classification Using Intuitionistic Fuzzy Sets; Springer: Berlin/Heidelberg, Germany, 2019; pp. 737–746. [Google Scholar] [CrossRef]
  11. Abbasi, B.Z.; Hussain, S.; Faisal, M.I. An Automated Text Classification Method: Using Improved Fuzzy Set Approach for Feature Selection; IEEE: Islamabad, Pakistan, 2019; p. 5. [Google Scholar]
  12. Widyantoro, D.H.; Yen, J. A Fuzzy Similarity Approach in Text Classification Task. 1998. Available online: https://www.researchgate.net/publication/3845652_A_fuzzy_similarity_approach_in_text_classification_task (accessed on 14 March 2022).
  13. Puri, S. A Fuzzy Similarity Based Concept Mining Model for Text Classification. 2012. Available online: https://arxiv.org/ftp/arxiv/papers/1204/1204.2061.pdf (accessed on 14 March 2022).
  14. Jiang, J.Y.; Liou, R.J.; Lee, S.J. A fuzzy self-constructing feature clustering algorithm for text classification. IEEE Trans. Knowl. Data Eng. 2011, 23, 335–349. [Google Scholar] [CrossRef]
  15. Jiang, J.Y.; Tsai, S.C.; Lee, S.J. Expert Systems with Applications FSKNN: Multi-label text categorization based on fuzzy similarity and k nearest neighbors q. Expert Syst. Appl. 2012, 39, 2813–2821. [Google Scholar] [CrossRef]
  16. Szmidt, E.; Kacprzyk, J. Using Intuitionistic Fuzzy Sets in Text Categorization. In Artificial Intelligence and Soft Computing–ICAISC 2008; Springer: Berlin/Heidelberg, Germany, 2008; pp. 351–362. [Google Scholar] [CrossRef]
  17. Bounabi, M.; Moutaouakil, K.E.; Satori, K. Text Classification Using Fuzzy TF-IDF and Machine Learning Models; ACM: Rabar, Morocco, 2019; p. 6. [Google Scholar]
  18. Behera, B. Text Document Classification Using Fuzzy Rough Set Based on Robust Nearest Neighbor (FRS-RNN). Soft Comput. 2021, 25, 9915–9923. [Google Scholar] [CrossRef]
  19. Puri, S. Efficient Fuzzy Similarity-Based Text Classification with SVM and Feature Reduction. In Proceedings of the Congress on Intelligent Systems, New Delhi, India, 5–6 September 2020; Sharma, H., Saraswat, M., Yadav, A., Kim, J.H., Bansal, J.C., Eds.; Springer: Singapore, 2020; pp. 341–356. [Google Scholar]
  20. Wang, W.; Xin, X. Distance measure between Intuitionistic Fuzzy Sets. Pattern Recognit. Lett. 2005, 26, 2063–2069. [Google Scholar] [CrossRef]
  21. Kacprzyk, J. Multistage Fuzzy Control: A Prescriptive Approach, 1st ed.; John Wiley & Sons, Inc.: Hoboken, NJ, USA, 1997. [Google Scholar]
  22. Atanassov, K.T. Intuitionistic Fuzzy Sets. In Studies in Fuzziness and Soft Computing; Physica-Verlag HD Fuzzy Sets and Systems: Berlin/Heidelberg, Germany, 1999; Volume 35. [Google Scholar] [CrossRef]
  23. Szmidt, E.; Kacprzyk, J. Distances between Intuitionistic Fuzzy Sets. Fuzzy Sets Syst. 2000, 114, 505–518. [Google Scholar] [CrossRef]
  24. Li, D.; Cheng, C. New Similarity Measures of Intuitionistic Fuzzy Sets and Application to Pattern Recognitions. Pattern Recognit. Lett. 2002, 23, 221–225. [Google Scholar] [CrossRef]
  25. Mitchell, H. On the Dengfeng–Chuntian Similarity Measure and Its Application to Pattern Recognition. Pattern Recognit. Lett. 2003, 24, 3101–3104. [Google Scholar] [CrossRef]
  26. Hung, W.L.; Yang, M.S. Similarity Measures of Intuitionistic Fuzzy Sets Based on Hausdorff Distance. Pattern Recognit. Lett. 2004, 25, 1603–1611. [Google Scholar] [CrossRef]
  27. Chen, S.M. Measures of similarity between vague sets. Fuzzy Sets Syst. 1995, 74, 217–223. [Google Scholar] [CrossRef]
  28. Sidiropoulos, G.K.; Apostolidis, K.D.; Damianos, N.; Papakostas, G.A. Fsmpy: A Fuzzy Set Measures Python Library. Information 2022, 13, 64. [Google Scholar] [CrossRef]
  29. Grzegorzewski, P. Distances between Intuitionistic Fuzzy Sets and/or Interval-Valued Fuzzy Sets Based on the Hausdorff Metric. Fuzzy Sets Syst. 2004, 148, 319–328. [Google Scholar] [CrossRef]
  30. Chen, S.-M. Similarity Measures between Vague Sets and between Elements. IEEE Trans. Syst. Man Cybern. Part Cybern. 1997, 27, 153–158. [Google Scholar] [CrossRef]
  31. Hong, D.H.; Kim, C. A Note on Similarity Measures between Vague Sets and between Elements. Inf. Sci. 1999, 115, 83–96. [Google Scholar] [CrossRef]
  32. Liang, Z.; Shi, P. Similarity Measures on Intuitionistic Fuzzy Sets. Pattern Recognit. Lett. 2003, 24, 2687–2693. [Google Scholar] [CrossRef]
  33. Liu, H.W. New Similarity Measures between Intuitionistic Fuzzy Sets and between Elements. Math. Comput. Model. 2005, 42, 61–70. [Google Scholar] [CrossRef]
  34. Zhang, C.; Fu, H. Similarity Measures on Three Kinds of Fuzzy Sets. Pattern Recognit. Lett. 2006, 27, 1307–1317. [Google Scholar] [CrossRef]
  35. Hung, W.L.; Yang, M.S. Similarity Measures of Intuitionistic Fuzzy Sets Based on Lp Metric. Int. J. Approx. Reason. 2007, 46, 120–136. [Google Scholar] [CrossRef] [Green Version]
  36. Park, J.H.; Park, J.S.; Kwun, Y.C.; Lim, K.M. New Similarity Measures on Intuitionistic Fuzzy Sets. In Fuzzy Information and Engineering; Cao, B.Y., Ed.; Springer: Berlin/Heidelberg, Germany, 2007; Volume 40, pp. 22–30. [Google Scholar] [CrossRef]
  37. Hung, W.L.; Yang, M.S. On Similarity Measures between Intuitionistic Fuzzy Sets. Int. J. Intell. Syst. 2008, 23, 364–383. [Google Scholar] [CrossRef]
  38. Hung, W.L.; Yang, M.S. On the J-divergence of Intuitionistic Fuzzy Sets with Its Application to Pattern Recognition. Inf. Sci. 2008, 178, 1641–1650. [Google Scholar] [CrossRef]
  39. Ye, J. Cosine Similarity Measures for Intuitionistic Fuzzy Sets and Their Applications. Math. Comput. Model. 2011, 53, 91–97. [Google Scholar] [CrossRef]
  40. Hwang, C.M.; Yang, M.S. Modified Cosine Similarity Measure between Intuitionistic Fuzzy Sets. In Artificial Intelligence and Computational Intelligence; Lei, J., Wang, F., Deng, H., Miao, D., Eds.; Springer: Berlin/Heidelberg, Germany, 2012; Volume 7530, pp. 285–293. [Google Scholar]
  41. Julian, P.; Hung, K.C.; Lin, S.J. On the Mitchell Similarity Measure and Its Application to Pattern Recognition. Pattern Recognit. Lett. 2012, 33, 1219–1223. [Google Scholar] [CrossRef]
  42. Iancu, I. Intuitionistic Fuzzy Similarity Measures Based on Frank T-Norms Family. Pattern Recognit. Lett. 2014, 42, 128–136. [Google Scholar] [CrossRef]
  43. Deng, G.; Jiang, Y.; Fu, J. Monotonic Similarity Measures between Intuitionistic Fuzzy Sets and Their Relationship with Entropy and Inclusion Measure. Inf. Sci. 2015, 316, 348–369. [Google Scholar] [CrossRef]
  44. Song, Y.; Wang, X.; Lei, L.; Xue, A. A Novel Similarity Measure on Intuitionistic Fuzzy Sets with Its Applications. Appl. Intell. 2015, 42, 252–261. [Google Scholar] [CrossRef]
  45. Chen, S.M.; Cheng, S.H.; Lan, T.C. A Novel Similarity Measure between Intuitionistic Fuzzy Sets Based on the Centroid Points of Transformed Fuzzy Numbers with Applications to Pattern Recognition. Inf. Sci. 2016, 343–344, 15–40. [Google Scholar] [CrossRef]
  46. Muthukumar, P.; Sai Sundara Krishnan, G. A Similarity Measure of Intuitionistic Fuzzy Soft Sets and Its Application in Medical Diagnosis. Appl. Soft Comput. 2016, 41, 148–156. [Google Scholar] [CrossRef]
  47. Yang, Y.; Chiclana, F. Consistency of 2D and 3D Distances of Intuitionistic Fuzzy Sets. Expert Syst. Appl. 2012, 39, 8665–8670. [Google Scholar] [CrossRef]
  48. Vlachos, I.K.; Sergiadis, G.D. Intuitionistic Fuzzy Information–Applications to Pattern Recognition. Pattern Recognit. Lett. 2007, 28, 197–206. [Google Scholar] [CrossRef]
  49. Nguyen, H. A Novel Similarity/Dissimilarity Measure for Intuitionistic Fuzzy Sets and Its Application in Pattern Recognition. Expert Syst. Appl. 2016, 45, 97–107. [Google Scholar] [CrossRef]
  50. Greene, D.; Cunningham, P. Practical Solutions to the Problem of Diagonal Dominance in Kernel Document Clustering. In Proceedings of the 23rd International Conference on Machine Learning (ICML’06), Pittsburgh, PA, USA, 25–29 June 2006; pp. 377–384. [Google Scholar]
  51. Pedregosa, F.; Varoquaux, G.; Gramfort, A.; Michel, V.; Thirion, B.; Grisel, O.; Blondel, M.; Müller, A.; Nothman, J.; Louppe, G. Scikit-Learn: Machine Learning in Python. Available online: https://arxiv.org/abs/1201.0490 (accessed on 11 August 2021).
  52. Bird, S.; Klein, E.; Loper, E. Natural Language Processing with Python, 1st ed.; O’Reilly: Newton, MA, USA, 2009. [Google Scholar]
  53. Hatzimichailidis, A.; Papakostas, G.; Kaburlasos, V. A novel distance measure of Intuitionistic Fuzzy Sets and its application to pattern recognition problems. Int. J. Intell. Syst. 2012, 27, 396–409. [Google Scholar] [CrossRef]
  54. Xu, Z. Some Similarity Measures of Intuitionistic Fuzzy Sets and Their Applications to Multiple Attribute Decision Making. Fuzzy Optim. Decis. Mak. 2007, 6, 109–121. [Google Scholar] [CrossRef]
Figure 1. Document learning protocol used in this study.
Information 13 00235 g001
Figure 2. Class distribution and mean of word count per sample text for (a) BBC News and (b) BBC Sports datasets.
Information 13 00235 g002
Figure 3. Confusion matrices of (a) Decision Tree and (b) S p c during the validation process.
Information 13 00235 g003
Table 1. Similarity measures evaluated in the study and provided by the fsmpy library.
Authors NamesParametersMeasure NameReference
S. M. Chenweights, a, b, c S e [30]
D.H. Hong, C. Kimweights, a, b, c M H [31]
L. Dengfeng, C. Chuntianp, weights S d p [24]
Z. Liang, P. Ship, weights S e p , S s p [32]
H.B. Mitchellp, weights S m o d [25]
W.L. Hung, M.S. Yangweights S c , S e , S l [26]
H.W. Liup, weights, a, b, cT[33]
C. Zhang, H. Fu-S[34]
W.L. Hung, M.S. Yanga S p c , S p e , S p l [35]
S. Park, Y.C. Kwun, K.M. Limp, weights S g w p [36]
W.L. Hung, M.S. Yang- S n e w 2 , S p k 1 , S p k 2 , S p k 3 , S w 1 , S w 2 [37]
W.L. Hung, M.S. Yangp S a c , S a e , S a l [38]
J. Yeweights C I F S [39]
C.M. Hwang, M.S. Yang- S I F S [40]
P. Julian, K.C. Hung, S. Linp, weights S n e w , p [41]
I. Ianculamda S ˜ 1 , S ˜ 5 , S ˜ 2 , S ˜ 6 , S ˜ 2 , S ˜ 6 , S ˜ 1 c , S ˜ 5 c [42]
G. Deng, Y. Jiang, J. Fuweights, p, u, v L 5 , N 6 , F 5 , F 6 , F 7 [43]
Y. Song, X. Wang, L. Lei, A. Xueweights S W Y [44]
S.M. Chen, S. Cheng, T.C. Lanweights S C C L [45]
P. Muthukumar, G.S.S. Krishnanweights W I F S S s [46]
Table 2. Distance measures evaluated in the study and provided by the fsmpy library.
Authors NamesParametersMeasure NameReference
K.T. Atanassov- d e , d h , d n e , d n h [22]
E. Szmidt, A. Kacprzyk- d I F S 1 , e I F S 1 , l I F S 1 , q I F S 1 [23]
P. Grzegorzewski- d h 2 , e h , l h , q h [29]
W. Wang, X. Xinweights, p d 1 , d 2 p [20]
Y. Yang, F. Chiclana- d e h , l e h , e e h , q e h [47]
I.K. Vlachos, G.D. Sergiadis- D I F S [48]
Table 3. Performance of distance measures on BBC News dataset.
Distance
Measures
ParametersWeights
( r j 1 , r j 1 * )
Accuracy
%
Precision
%
Recall
%
F1
%
DoC
d e -( 0.1 , 0.1 )93.1793.1992.7692.860.0903
d h -( 0.1 , 0.1 )49.6661.0448.1838.513.9711
d n e -( 0.1 , 0.1 )93.1793.1992.7692.860.0018
d n h -( 0.1 , 0.1 )49.6661.0448.1838.510.0016
d I F S 1 -( 0.1 , 0.1 )93.1793.1992.7692.860.0903
e I F S 1 -( 0.1 , 0.1 )49.6661.0448.1838.513.9711
l I F S 1 -( 0.1 , 0.1 )93.1793.1992.7692.860.0018
q I F S 1 -( 0.1 , 0.1 )49.6661.0448.1838.510.0016
d h p = 7.00 ( 0.1 , 0.1 )49.6661.0448.1838.510.0016
e h p = 7.00 ( 0.1 , 0.1 )88.9490.4588.9888.630.0031
l h -( 0.1 , 0.1 )93.1793.1992.7692.860.0903
q h -( 0.1 , 0.1 )49.6661.0448.1838.513.9711
d 1 -( 0.1 , 0.1 )93.1793.1992.7692.860.0018
d 2 p -( 0.1 , 0.1 )49.6661.0448.1838.510.0016
d e h -( 0.1 , 0.1 )93.1793.1992.7692.860.0903
l e h -( 0.1 , 0.1 )49.6661.0448.1838.513.9711
e e h -( 0.1 , 0.1 )93.1793.1992.7692.860.0018
q e h -( 0.1 , 0.1 )49.6661.0448.1838.510.0016
D I F S -( 0.1 , 1.0 )94.2594.1093.9894.025.5846
Table 4. Performance of similarity measure on BBC News dataset.
Similarity
Measures
ParametersWeights
( r j 1 , r j 1 * )
Accuracy
%
Precision
%
Recall
%
F1
%
DoC
S e a = 6.00 ,
b = 4.00 ,
c = 7.00
( 0.1 , 0.1 )49.6661.0448.1838.510.0016
M H a = 6.00 ,
b = 4.00 ,
c = 7.00
( 0.1 , 0.1 )49.6661.0448.1838.510.0016
S d p p = 7.00 ( 0.1 , 0.1 )93.1793.1992.7692.860.0018
S e p p = 7.00 ( 0.1 , 0.1 )93.1793.1992.7692.860.0018
S s p p = 7.00 ( 0.1 , 0.1 )93.1793.1992.7692.860.0018
S m o d p = 7.00 ( 0.1 , 0.1 )93.1793.1992.7692.860.0018
S c -( 0.1 , 0.1 )49.6661.0448.1838.510.0016
S e -( 0.1 , 0.1 )49.6661.0448.1838.510.0025
S l -( 0.1 , 0.1 )49.6661.0448.1838.510.0031
T a = 0.34 ,
b = 0.47 ,
c = 0.42 ,
p = 9.00
( 0.1 , 0.1 )93.1793.1992.7692.860.0018
S-( 0.1 , 1.0 )50.6561.2149.0539.490.0091
S p c a = 6.00 ( 1.0 , 0.1 )94.8394.6794.6294.630.0019
S p e a = 6.00 ( 1.0 , 0.1 )94.8394.6794.6294.630.0021
S p l a = 6.00 ( 1.0 , 0.1 )94.8394.6794.6294.630.0022
S g w p p = 7.00 ( 0.1 , 0.1 )93.1793.1992.7692.860.0025
S n e w 2 -( 0.1 , 0.1 )49.6661.0448.1838.510.0023
S p k 1 -( 1.0 , 0.1 )50.4760.8648.939.260.0293
S p k 2 -( 1.0 , 0.1 )75.0677.7574.9974.560.0418
S p k 3 -( 1.0 , 0.1 )50.4760.8648.939.260.0157
S w 1 -( 0.1 , 0.1 )49.6661.0448.1838.510.0017
S w 2 -( 0.1 , 0.1 )49.1739.4647.6837.840
S a c p = 7.00 ( 0.1 , 0.1 )49.6661.0448.1838.510.0026
S a e p = 7.00 ( 0.1 , 0.1 )49.6661.0448.1838.510.0033
S a l a = 6.00 ,
b = 4.00 ,
c = 7.00
( 0.1 , 0.1 )49.6661.0448.1838.510.0016
C I F S -( 0.1 , 0.325 )94.7494.6794.5794.560.0033
S I F S -( 0.55 , 0.325 )93.7193.4493.4793.440.0019
S n e w , p p = 7.00 ( 0.325 , 0.1 )93.1793.1992.7692.860.0040
S ˜ 1 -( 0.1 , 1.0 )71.9180.4073.0173.030.0097
S ˜ 5 -( 1.0 , 0.1 )59.7875.6860.6061.300.0112
S ˜ 2 -( 0.55 , 0.1 )75.5584.6974.1073.140.0007
S ˜ 6 -( 0.1 , 0.55 )91.6992.2091.8491.490.0006
S ˜ 2 -( 1.0 , 1.0 )55.3358.7756.5155.420.0091
S ˜ 6 -( 0.775 , 0.325 )93.4893.3693.4593.290.0012
S ˜ 1 c -( 1.0 , 0.325 )64.976.3565.7166.390.0056
S ˜ 5 c -( 0.1 , 0.1 )90.2591.1189.7289.720
L 5 p = 7.00 ,
u = 4.43 ,
v = 7.22
( 0.775 , 0.55 )94.2994.2494.0994.100.0289
N 6 p = 7.00 ,
u = 4.43 ,
v = 7.22
( 0.1 , 0.1 )93.1793.1992.7692.860.0018
F 5 p = 7.00 ,
u = 4.43 ,
v = 7.22
( 0.1 , 0.1 )93.1793.1992.7692.860.0006
F 6 p = 7.00 ,
u = 4.43 ,
v = 7.22
( 0.1 , 0.1 )93.1793.1992.7692.860
F 7 p = 7.00 ,
u = 4.43 ,
v = 7.22
( 0.1 , 0.1 )93.1793.1992.7692.860.0028
S W Y -( 0.1 , 0.325 )94.4794.2694.2394.240.0005
S C C L -( 0.1 , 1.0 )49.9360.9848.4238.740.0083
W I F S S s -( 1.0 , 0.1 )65.7581.8863.8659.920.0285
Table 5. Performance of similarity measure on BBC Sports dataset.
Similarity
Measures
ParametersWeights
( r j 1 , r j 1 * )
Accuracy
%
Precision
%
Recall
%
F1
%
DoC
S e a = 6.00 ,
b = 4.00 ,
c = 7.00
( 0.1 , 0.1 )25.1083.0733.9025.500.0014
M H a = 6.00 ,
b = 4.00 ,
c = 7.00
( 0.1 , 0.1 )25.1083.0733.9025.500.0014
S d p p = 7.00 ( 0.1 , 0.1 )96.3496.5496.4796.480.0028
S e p p = 7.00 ( 0.1 , 0.1 )96.3496.5496.4796.480.0028
S s p p = 7.00 ( 0.1 , 0.1 )96.3496.5496.4796.480.0028
S m o d p = 7.00 ( 0.1 , 0.1 )96.3496.5496.4796.480.0028
S c -( 0.1 , 0.1 )25.1083.0733.9025.500.0014
S e -( 0.1 , 0.1 )25.1083.0733.9025.500.0023
S l -( 0.1 , 0.1 )25.1083.0733.9025.500.0028
T a = 0.34 ,
b = 0.47 ,
c = 0.42 ,
p = 9.00
( 0.1 , 0.1 )96.3496.5496.4796.480.0028
S-( 0.1 , 1.0 )28.4983.1936.3629.310.0081
S p c a = 6.00 ( 0.1 , 0.1 )96.4796.6996.7896.720
S p e a = 6.00 ( 0.1 , 0.1 )96.4796.6996.7896.720
S p l a = 6.00 ( 0.1 , 0.1 )96.4796.6996.7896.720
S g w p p = 7.00 ( 0.1 , 0.1 )96.3496.5496.4796.480.0045
S n e w 2 -( 0.1 , 0.1 )25.1083.0733.9025.500.0021
S p k 1 -( 0.775 , 0.1 )26.4683.1235.3827.440.0269
S p k 2 -( 0.775 , 0.325 )79.6581.5177.7378.790.0489
S p k 3 -( 0.775 , 0.1 )26.4683.1235.3827.440.0144
S w 1 -( 0.1 , 0.1 )25.1083.0733.9025.500.002
S w 2 -( 0.1 , 0.1 )24.4281.0433.4424.170
S a c p = 7.00 ( 0.1 , 0.1 )25.1083.0733.9025.500.0024
S a e p = 7.00 ( 0.1 , 0.1 )25.1083.0733.9025.500.003
S a l a = 6.00 ,
b = 4.00 ,
c = 7.00
( 0.1 , 0.1 )25.1083.0733.9025.500.0014
C I F S -( 0.1 , 0.55 )96.4796.9996.7196.840.0023
S I F S -( 1.0 , 0.775 )95.9396.5496.1196.310.0067
S n e w , p p = 7.00 ( 0.325 , 0.1 )96.3496.5496.4796.480.0064
S ˜ 1 -( 0.1 , 1.0 )69.6176.8672.6871.010.0072
S ˜ 5 -( 1.0 , 0.1 )50.4778.0254.8354.770.0096
S ˜ 2 -( 0.775 , 0.1 )82.3686.9587.8384.910.0012
S ˜ 6 -( 0.1 , 0.55 )94.4493.8995.6394.610.0006
S ˜ 2 -( 1.0 , 1.0 )40.3058.8147.3643.410.0072
S ˜ 6 -( 1.0 , 0.1 )94.3093.7195.6194.500.0018
S ˜ 1 c -( 1.0 , 0.325 )63.5073.4266.4065.260.004
S ˜ 5 c -( 0.1 , 0.1 )90.0989.4191.9589.840
L 5 p = 7.00 ,
u = 4.43 ,
v = 7.22
( 1.0 , 0.775 )96.2096.4696.3496.370.0371
N 6 p = 7.00 ,
u = 4.43 ,
v = 7.22
( 0.1 , 0.1 )96.3496.5496.4796.480.0028
F 5 p = 7.00 ,
u = 4.43 ,
v = 7.22
( 0.1 , 0.1 )96.3496.5496.4796.480.0009
F 6 p = 7.00 ,
u = 4.43 ,
v = 7.22
( 1.0 , 0.775 )96.2096.3696.4096.350
F 7 p = 7.00 ,
u = 4.43 ,
v = 7.22
( 0.1 , 0.1 )96.3496.5496.4796.480.0045
S W Y -( 0.1 , 0.325 )95.9397.3395.6496.420.0006
S C C L -( 0.1 , 1.0 )25.7883.0934.4026.220.0075
W I F S S s -( 1.0 , 0.1 )62.8284.0465.5364.820.0261
Table 6. Performance of distance measures on BBC Sports dataset.
Distance
Measures
ParametersWeights
( r j 1 , r j 1 * )
Accuracy
%
Precision
%
Recall
%
F1
%
DoC
d e -( 0.1 , 0.1 )93.6296.3292.7994.280.1001
d h -( 0.1 , 0.1 )25.183.0733.925.53.423
d n e -( 0.1 , 0.1 )93.6296.3292.7994.280.002
d n h -( 0.1 , 0.1 )25.183.0733.925.50.0014
d I F S 1 -( 0.1 , 0.1 )93.6296.3292.7994.280.1001
e I F S 1 -( 0.1 , 0.1 )25.183.0733.925.53.423
l I F S 1 -( 0.1 , 0.1 )93.6296.3292.7994.280.002
q I F S 1 -( 0.1 , 0.1 )25.183.0733.925.50.0014
d h p = 7.00 ( 0.1 , 0.1 )25.183.0733.925.50.0014
e h p = 7.00 ( 0.1 , 0.1 )95.6695.5496.1595.770.0034
l h -( 0.1 , 0.1 )93.6296.3292.7994.280.1001
q h -( 0.1 , 0.1 )25.183.0733.925.53.423
d 1 -( 0.1 , 0.1 )93.6296.3292.7994.280.002
d 2 p -( 0.1 , 0.1 )25.183.0733.925.50.0014
d e h -( 0.1 , 0.1 )93.6296.3292.7994.280.1001
l e h -( 0.1 , 0.1 )25.183.0733.925.53.423
e e h -( 0.1 , 0.1 )93.6296.3292.7994.280.002
q e h -( 0.1 , 0.1 )25.183.0733.925.50.0014
D I F S -( 0.1 , 0.55 )95.3997.0795.0295.943.6342
Table 7. Performance of the ML models and the best-performing IFS measures on both datasets.
BBC NewsBBC Sports
Model/
Measure
Accuracy
(%)
Precision
(%)
Recall
(%)
F1
(%)
Accuracy
(%)
Precision
(%)
Recall
(%)
F1
(%)
Decision Tree81.6181.8581.0481.3188.1988.1487.8787.96
KNN82.6986.4781.6382.7988.4692.9687.4289.16
S p c 94.8394.6794.6294.6396.4796.6996.7896.72
C I F S 94.7494.6794.5794.5696.4796.9996.7196.84
D I F S 94.2594.1093.9894.0295.3997.0795.0295.94
Publisher’s Note: MDPI stays neutral with regard to jurisdictional claims in published maps and institutional affiliations.

