2. Related Work
In 2017, Aditya Kapoor published a report on customer retention and churn in the American telecommunications market [
2]. A study was reported that indicated a 1.9% churn rate in the top four operators (AT&T, Verizon, T-Mobile, Sprint). These operators cover 100 million customers. On average, churn occurred at 19 months. It said that the normal lifespan of a customer is 52 months, so the lost revenue in each churn case was estimated to be more than USD 1100 (from USD 34 × 33 months). The author describes the modeling of a predictive system for churn based on a repository of around 100,000 records and 150 attributes. Data include information on phone calls (quantity, duration, for the last 3 and 6 months), contractual information, details about data consumption, and the client’s socioeconomic profile. With a
Filter approach, 20 features were selected. Data were divided between training and test sets, with sizes 70% and 30%, respectively. Through the Azure platform, classification models were created with logistic regression (LR), boosting, random forest [
3], neural networks and support vector machine (SVM). Assessment results were not reported. The author mentions the optimization of models through the search for a threshold oriented towards profit maximization.
In April 2018, a
datascience.com publication from Sowmya Vivek [
4] described the use of the linear discriminant analysis (LDA) algorithm for predicting churn with customer data from a telecommunications company, with special focus on service-related factors. Using the LDA as a segmentation mechanism, the work seeks to divide customers between churn and nonchurn groups. A multivariate analysis of variance (MANOVA) was performed, and the relative importance of each independent variable was studied. The reported accuracy for the base prediction model is 85.67%, but with a low sensitivity of 12.7%. After some tests to balance the indicators, the threshold used was 0.16, which allowed stabilizing both accuracy and sensitivity measures at 74%.
In [
5], the authors addressed the challenge of computational efficiency of data mining approaches over large scale data, using spark and caret tools for a churn prediction task on a telecommunication dataset. In both spark and caret, a random forest classifier model was trained with equal data partitioning and tuning parameters. The results showed that the classifier’s operation in spark was more efficient when compared to caret (50.25 s vs. 847.20 s execution time), and in both cases the accuracy was approximately 80%.
In 2016, Dalvi et al. proposed a model for churn prediction for telecommunication companies [
6]. A statistical survival analysis tool was proposed to predict churn, and it was based on a comparison between decision trees and logistic regression. R programming was chosen to build the prediction model. The evaluation process was planned, but the results were not presented.
A 2020 master’s thesis from Christian Jensen [
7] sought to answer which features best explained the reason behind telecom customer churn and which machine-learning algorithms best solve the task of data mining. The author sought to test some existing models on new data that contain both demographic and expenses variables. The best model only predicted 67.6% of the cases correctly.
In the financial area in 2018, Erdem Kaya et al. investigated spatiotemporal patterns and entropy in financial decisions, and the relationship they can have with churn [
8]. Inspired by computationally based works in the area of social sciences, the authors designed a predictive model sensitive not only to temporal and spatial aspects, but also to behavioral aspects of how consumers spend money. Data included demographic information, credit card transactions or bank transfers arranged in two sets, A and B. Set A had about 45 million transactions relating to 100,000 customers. Set B had about 22 million transactions relating to 60,000 customers. Set B was extracted from the same source, but had more specific criteria: customers with 10 or more credit card transactions where 60% or more of the transactions were associated with POS equipment from the bank that provided the data. Because there was an imbalance between classes, the evaluation of the models was made with the AUC measure, with an eight-fold cross-validation method. For the various models trained with random forest, reported AUC values were between 0.513 and 0.79.
Amuda and Adeyemo studied the use of a multilayer perceptron to predict customer churn for the financial domain [
9]. In this study, the authors developed a model to reduce manual feature engineering. The dataset came from a Nigerian financial institution related to 50,000 customers and included 42 attributes. A total of 80 percent of the dataset was used for training, 10 percent was used for testing, and the remaining 10 percent was used for model validation. Two artificial neural network software solutions were used: Python (dropout and L2 regularization techniques for overfitting) and Neuro Solution Infinity software. Both obtained comparable performance, with accuracy rates of 97.53% and 97.4% with 0.89 and 0.85, respectively, for AUC.
In 2017, Robert Aman developed a study to identify relevant parameters to the strength of the relationship with customers in a software-as-a-service company in Stockholm in the digital marketing business for B2B [
10]. The author describes the application of statistical processes and data mining techniques to software usage survey data. Monitoring tools collected detailed data on product usage/consumption by users for each client company. Data were treated with ANOVA (
https://statistics.laerd.com/statistical-guides/one-way-anova-statistical-guide.php, accessed on 2 March 2022) analysis techniques, linear regression and logistic regression. The model for classification of customer status was evaluated in terms of accuracy, with the best variant obtaining 0.745 on this indicator. The results show different patterns of software usage between customers who remain active and cases where there is abandonment, with greater use of software generally associated with a greater propensity to remain as a customer. It is also mentioned that the product usage value perceived by the customer explains or is associated with the strength of the bond with the client. If this bond is weak, there is a greater chance of abandonment.
In [
11], churn analysis was performed on data from a software-as-a-service company selling an advanced cloud-based business phone system. Oversampling, undersampling, and time series cross-validation methods were tried to diminish the impact of the imbalanced data. Logistic regression and random forest models were used to both predict and explain churn. The author reported that the resulting model was more useful to explain churn than to predict it.
Tsai and Lu [
12] applied back propagation artificial neural networks (ANN) and also hybrid models by combining back propagation artificial neural networks and self-organizing map techniques for churn prediction. In the hybrid models, the technique started with a data reduction task by filtering out unrepresentative training data and then using the remaining representative data to create the prediction model based on the second technique. The assessment result indicated that the ANN + ANN hybrid models performed better than the baseline ANN models over the five testing subsets, having accuracy values between 90% and 94%.
The authors of [
13] proposed a cloud-based
extract–transform–load (ETL) framework for data fusion and aggregation with applications in churn prediction, service outage prediction, fraud detection and actionable information for a timely recommendation system. The authors described a use case for a customer churn prediction problem for a video-streaming service operating in the Canadian market. The dataset for this prediction use case include demographic and personal data (e.g., number of avatars, account age, number of profiles, number of children profiles, payment history, account type, etc.), customer surveys data and dynamic data from user interactions logs. The distribution between classes was highly unbalanced: 200,000 subscribers, of which about 10% churned. Decision trees, random forest, extra trees, AdaBoost and XGBoost algorithms were used in the churn classification. The evaluation results showed 97% for accuracy and 98% AUC.
Using data about B2C e-commerce customers’ shopping behaviors, [
14] described a churn prediction approach based on the combination of k-means for customer segmentation and SVM for prediction. The method divided customers into three categories (core groups/clusters) according to their shopping behaviors, and then predictions were made for these customer types. Support vector machine and logistic regression were compared. The authors wanted to evaluate the effectiveness of customer segmentation and its effect on the predictive model. The imbalance between the number of nonchurn (580) and churn (7576) customers was remedied with oversampling with SMOTE, a minority oversampling technique. The results showed that the accuracy of the SVM predictor was higher than that of the logistic regression predictor and also that the prediction performance improved when customer segmentation was applied. After customer segmentation, accuracy, recall and precision results for the SVM model were 0.9156, 0.9721 and 0.861; those of the LR model were 0.9066, 0.9498 and 0.8533, respectively.
3. Materials and Methods
This section describes our churn prediction solution, starting with some grounding concepts. Then the approach to model churn, and the details of the system architecture and its software components are examined.
3.2. Data and Churn Modeling
In machine learning, classification aims to predict the category of an item from a model based on one or more numeric or categorical input variables that are referred to as predictive attributes or features. Given a subscription characterized by data about the subscriber, the aim is to classify between a case of imminent abandonment and its opposite, a low risk of abandonment. In a binary classification task, we have the churn and nonchurn classes. Additionally, machine-learning algorithms may even debit the estimated probability for the observed data to fall into each class. Thus, a high probability for the churn class means a high risk of losing the customer.
Prediction success depends largely on the quality and adequacy of the chosen data [
15]. As with supervised learning, models will be trained with a set of instances, each described by a set of attributes or features from known cases. When fitting the model, one of these features corresponds to the class to be predicted (churn; nonchurn). In our work, each classifier training instance describes, for a given moment in time, a subscription to a service. The minimum set of instance features includes:
Customer data: sociodemographic, customer type (business, private, academic), if the customer has other active subscriptions and whether the customer has abandoned any subscription in the last 30 days. Customer identity is never used. Data are accessed in a context of consent, which is managed by the CSP;
Service data: service type and provider;
Contractual and subscription usage data: date subscription start/activation date, loyalty commitment end date, billing cycle, promotion benefit, number of purchased licenses, number of licenses in use, subscription status (active, suspended, canceled), number of days in which there are subscription records, number of days the subscription was active, if it is within some loyalty program, number of days until the end of loyalty, number of days after the end of loyalty, number of days after subscription start, average number of activation days after loyalty for the subscribed service, existence of a reduction in the number of licenses used in the last 20 and in the last 5 days and billing data;
Target variable: churn or nonchurn. This attribute is the key concept to model, where the notion of time is very important. This attribute will take the value churn if within 5 days following the time of observation (that is, the date to which the instance refers) the subscription is not active. Otherwise its value is nonchurn.
Our data source is managed by University of Évora’s partner company in this work. We obtained access to a subset of the CBAR data after anonymization and only for specific use within this project’s scope.
In preprocessing, categorical data variables are transformed with the one-hot encoding method, with a new column of data containing a binary numeric value for each label in the original domain. Some examples that receive this encoding are the columns billing type and cycle, service type, customer type, country and status.
The dataset built to support the predictive system contains 196,977 instances, corresponding to different points in time of 26,418 service subscriptions. We emphasize that an instance represents the status of a subscription on a certain day, and there may be several instances for the same subscription. The churn class has 62,193 (31%) instances, while the nonchurn has 134,784 (69%) instances.
Two tools were used in our churn modeling experiences: KNIME (
https://www.knime.com/, accessed on 15 December 2021) [
16] an open source analytics platform allowing visual workflows and Scikit-learn (
https://scikit-learn.org/, accessed on 15 December 2021) [
17], an open source machine-learning library. To manage, explore and visualize the data, we used a web-based interactive data analytics tool, Apache Zeppelin (
https://zeppelin.apache.org/, accessed on 15 December 2021). This allowed for collaborative work, where different user profiles can query different data subsets and possibly through different permissions and distinct query languages such as SQL or Python.
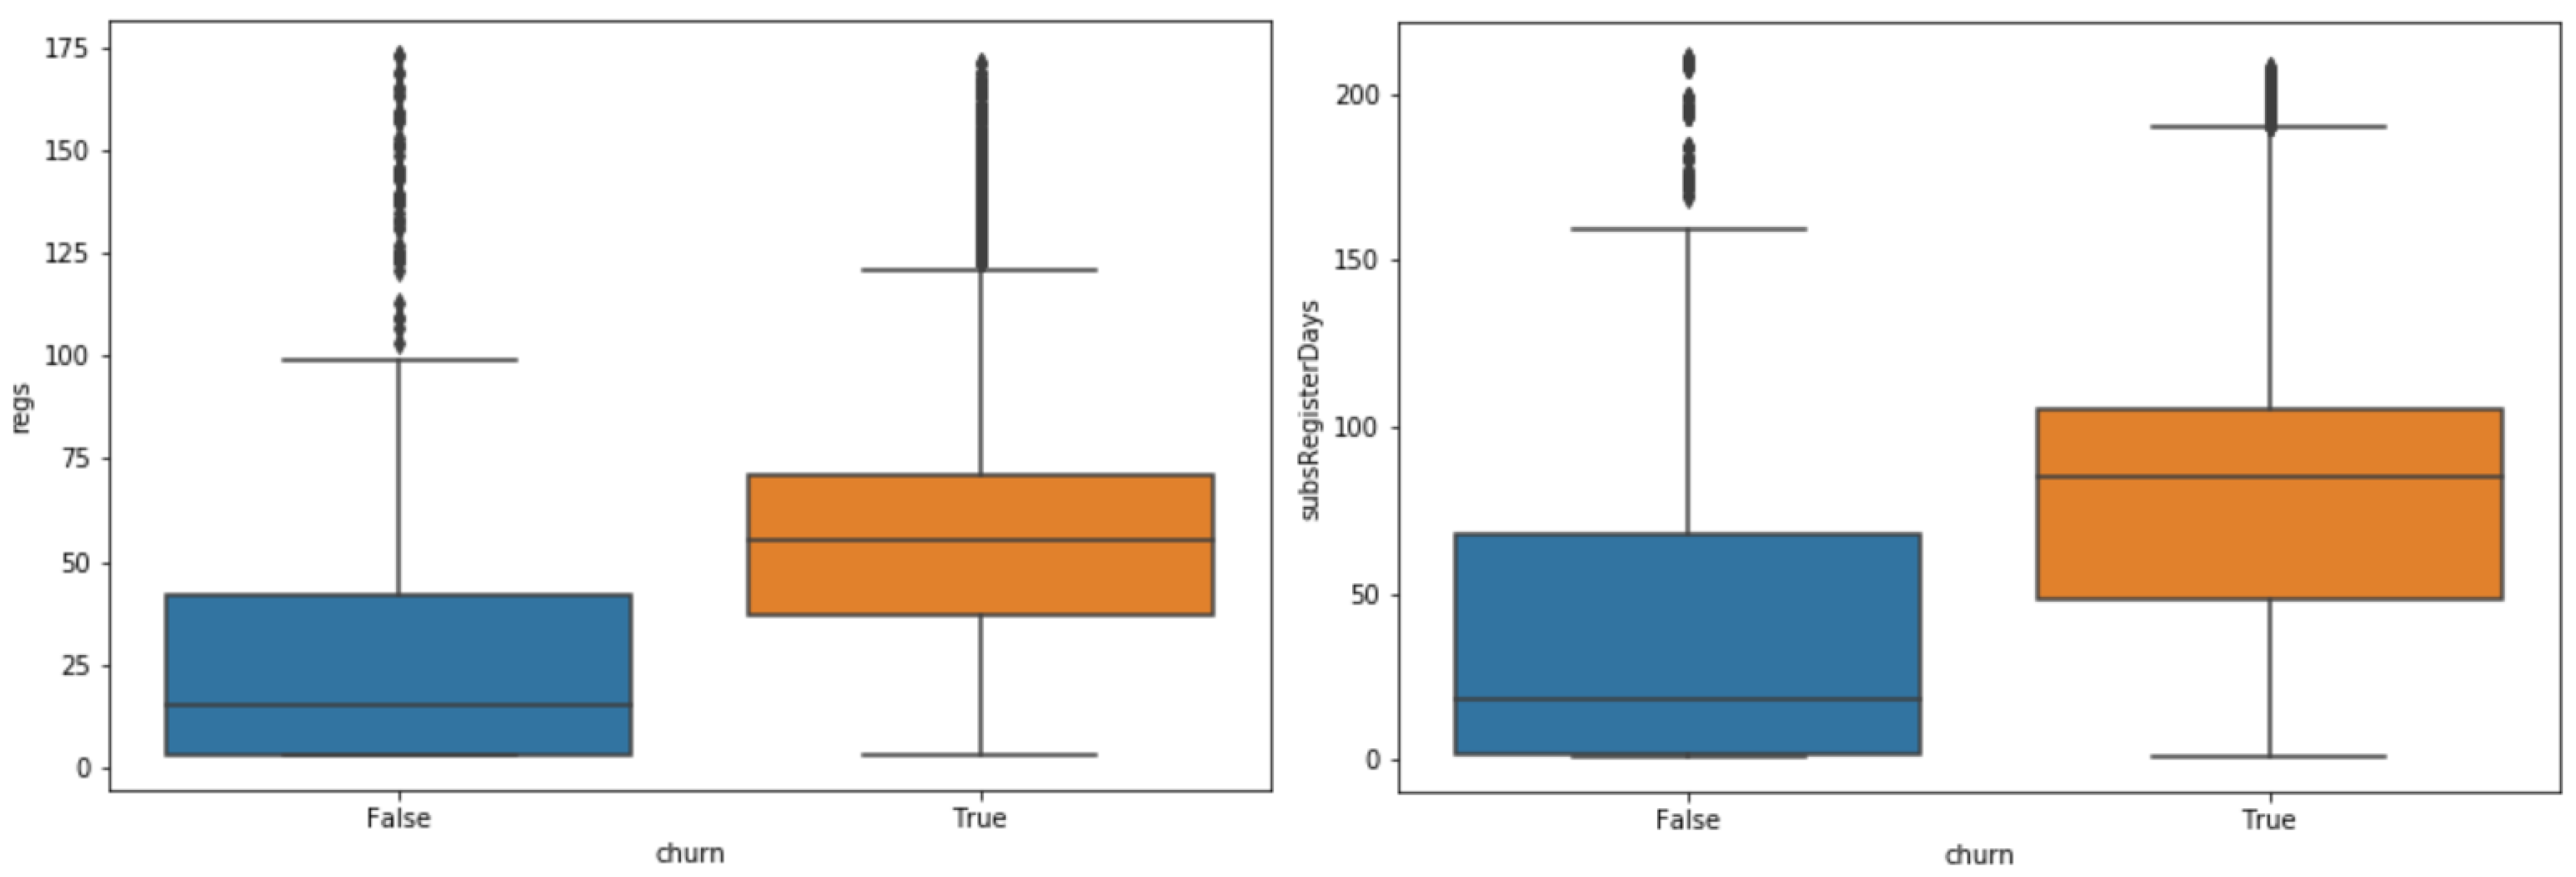
Figure 1 shows two boxplots with the distribution of values per class for two features: the number of subscription records and the number of days in those records time spans. In addition, from our exploratory data analysis, the matrix in
Figure 2 exhibits the Pearson product–moment correlation coefficient for each pair of data variables. In each table cell, the color ranges from dark red to dark blue (strong negative correlation to strong positive correlation). On the main diagonal, we see a variable’s correlation with itself, therefore having the blue color. The correlation between each feature and the target label is represented in the last row. We can see that churn has a positive correlation with the variable for warnings on quantity reduction; has a negative correlation with the variable is_recently_active_and_having_quant; and has no correlation with recent discontinuity of active state (warnings_c3active_discontinuity).
In addition to the correlation coefficient between variables, their respective statistical significance was also analyzed.
Table 1 shows the
p-value (probability describing how likely the data could have occurred by random chance) for some columns. Usually, a
p-value higher than 0.05 means the case is not statistically significant. Thus, we find that the strong negative correlation between active state and churn (−0.929) is not significant. On the other hand, it was observed that the positive correlation that the target variable has with days after the end of loyalty period, canceled or suspended state or the warnings on quantity reduction is statistically significant.
3.4. CSCP Architecture
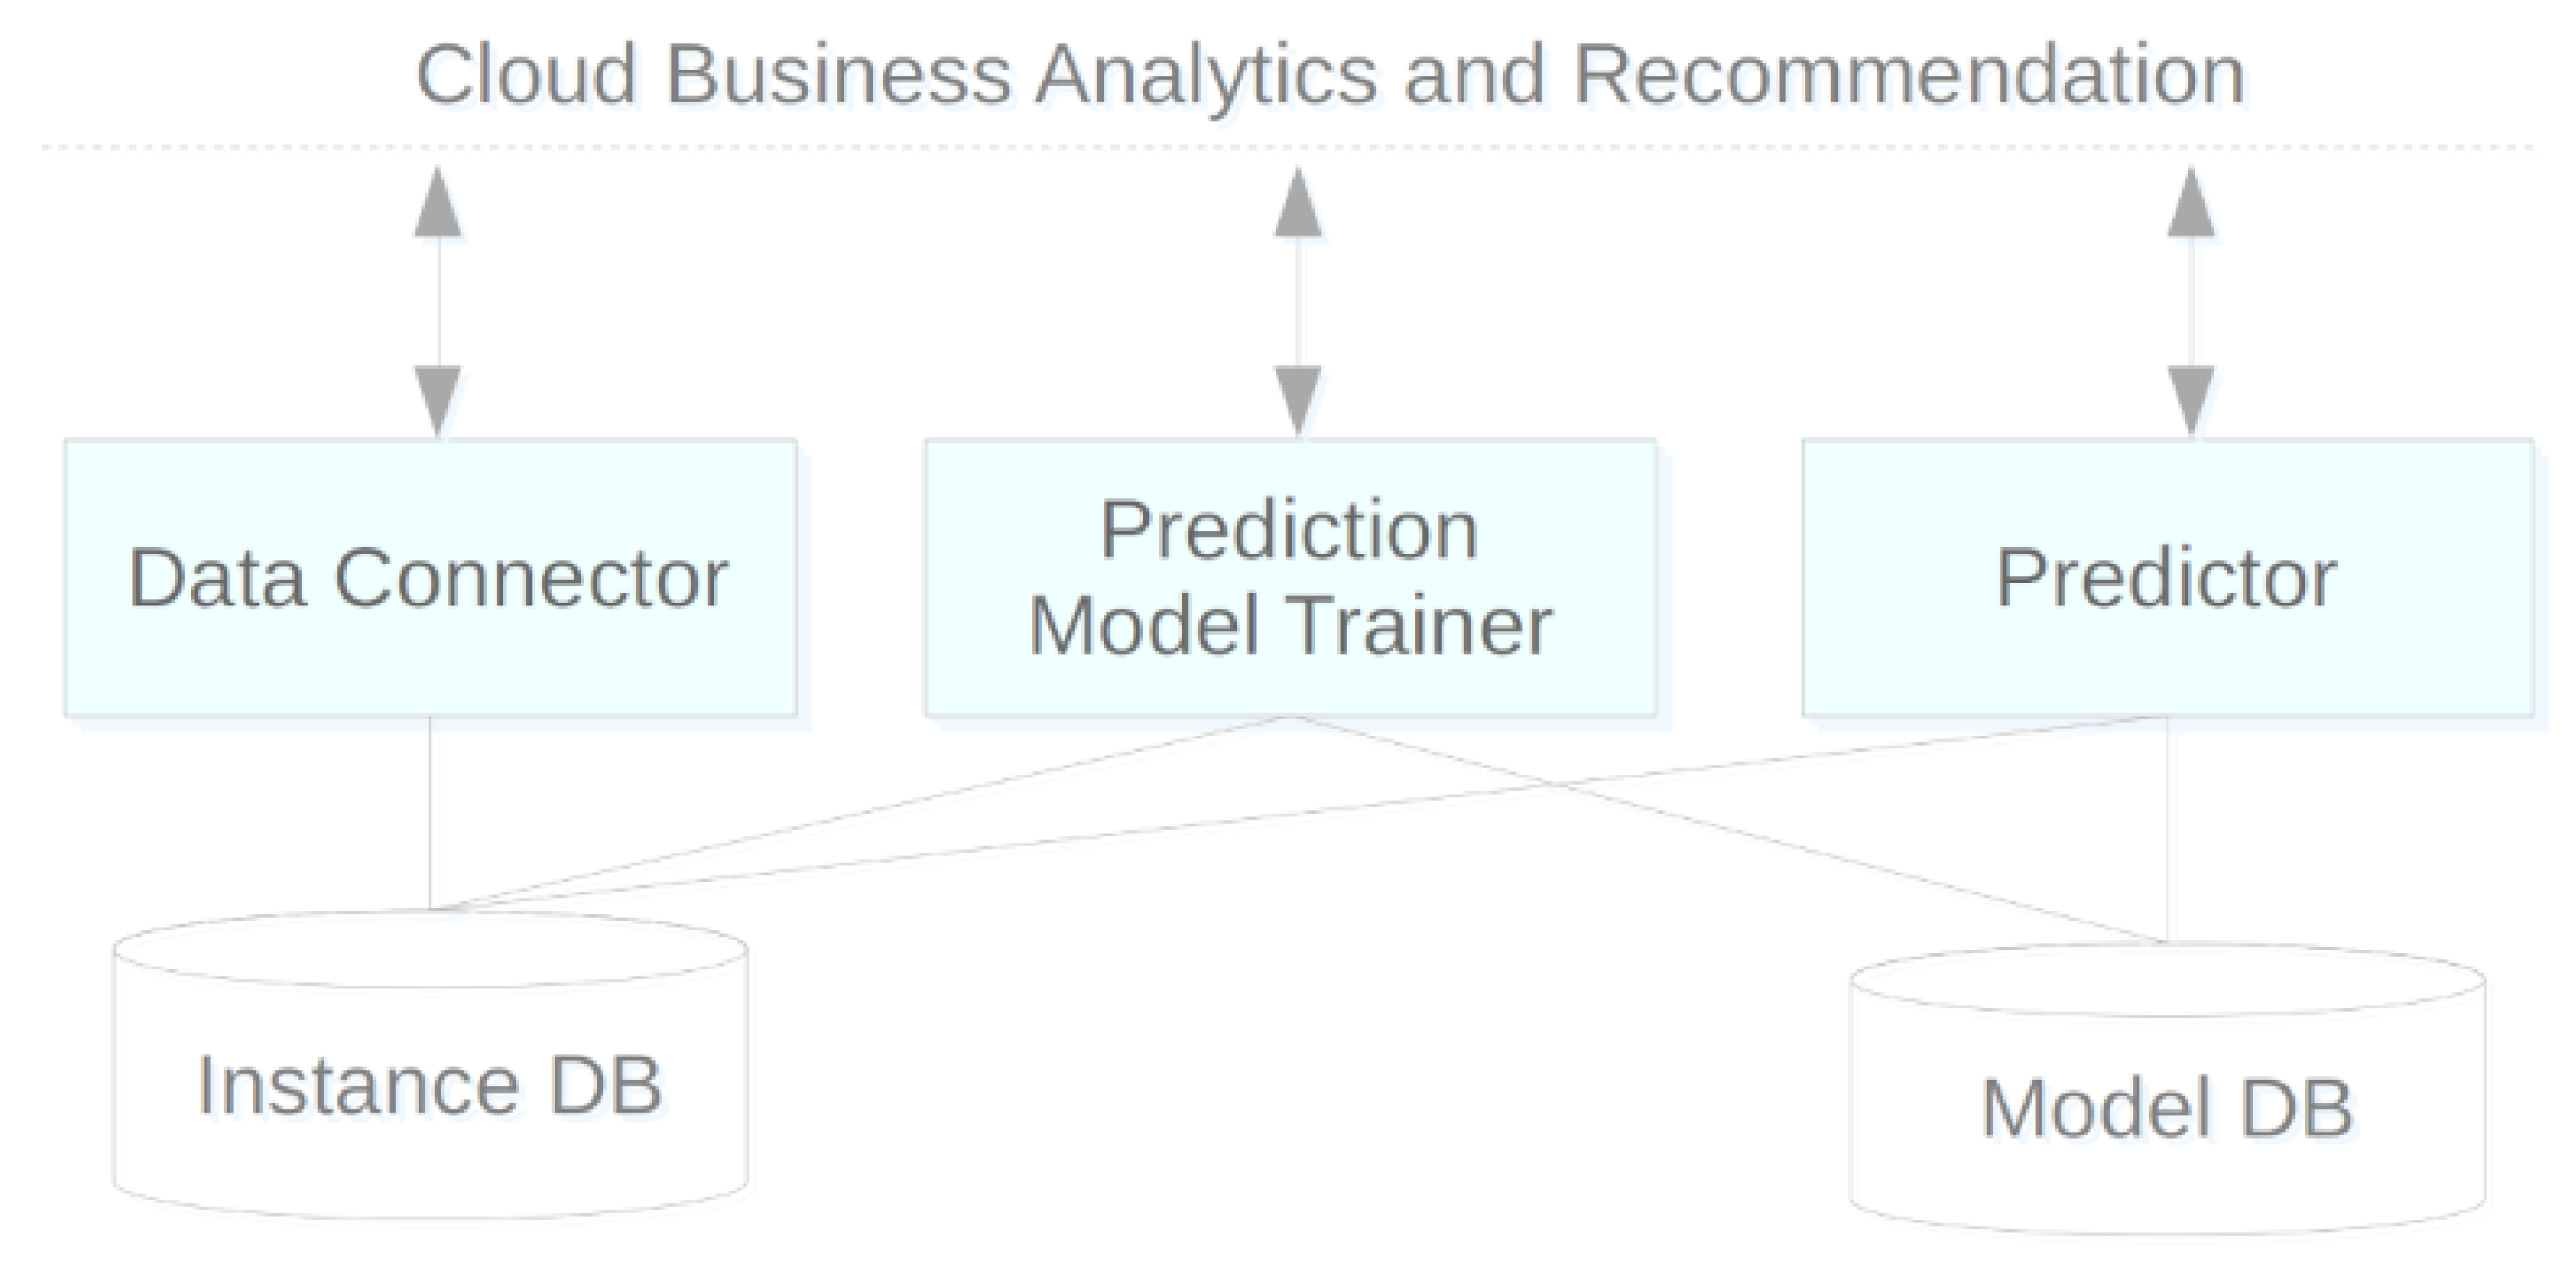
Figure 3 shows an overview of the system components and how they interconnect. The dashed horizontal line on top represents the boundary between our system and CBAR. The CSCP solution involves five components: three computing-oriented applications (represented in rectangles) and two repository-type applications (at the bottom of the figure). This modular organization makes it easy to make changes or improvements to a module while maintaining the API without harming the system.
The data connector module is, as the name suggests, a connector between CSCP and CBAR repositories and other data sources. Its function is the acquisition of key data about customers and services and processing this data to feed an instance repository. Data transformation can include cleaning and conversion procedures, data reduction, such as discretizing an attribute value and filling in new calculated fields. Data are loaded from CBAR analytics tables and directed to the local Instance DB module. Data retrieval can be triggered on-demand to update the features of an instance of the subscription for which a prediction is requested or as a preload anticipating the update of required instances for a model or prediction.
The instance DB module is a repository to support the training of predictive models with data on service subscriptions and their respective customers and details of consumption, access, costs and type of payment. Each record, considered an instance, characterizes the essentials about a subscription to feed machine-learning algorithms. This module was implemented on top of a common relational database in Azure SQL.
The
prediction model trainer component is a predictive model generator, parameterized for a given type of objective and algorithm. The purpose of the model may be classification or regression, and the employed modeling process was described in
Section 3.2. The
CSCP system has a continuous operating cycle from model generation to its implementation and use. Then monitoring detects when it will be necessary to retrain the model for the prediction to keep up with new data and trends. After years of operation, if the data history grows so large that it makes training difficult,
Subsampling will be used, truncating the oldest part of this data and giving priority to the most current behavior patterns.
These models that are gradually built are all kept in the model DB, where they will be loaded from by predictor. Storing the various versions of a predictive model allows future maintenance operations such as comparing models, or revoking a modem by automatically replacing it with a previous consistent version.
The model DB component is a repository of predictive models. Adjusting or training a model can be time-consuming. Storing these models allows for more flexible management, making the deployment of a previous model easier without the need to repeat the training. It also allows for the combined use of multiple models. This module also includes a repository with the history of predictions answered by each model, which can be used as a temporary cache.
Finally, the predictor module is, as the name implies, a predictive engine. It is currently used only for the churn probability prediction operation regarding a subscription, but in the near future, we may estimate propensity for UpSell in scenarios where a customer makes full use of a certain service plan. In each request, the module uses a previously trained model for this purpose and loads the data that characterizes the subscription and its context detail, and outputs the predicted churn risk.
Optionally, and for efficiency reasons, predictions for a broad set of subscriptions can be scheduled for early processing, with the results kept in cache for immediate response on later requests. This cache has a validity period of 2 days and contains the subscription and model identifiers, the output prediction and a timestamp.
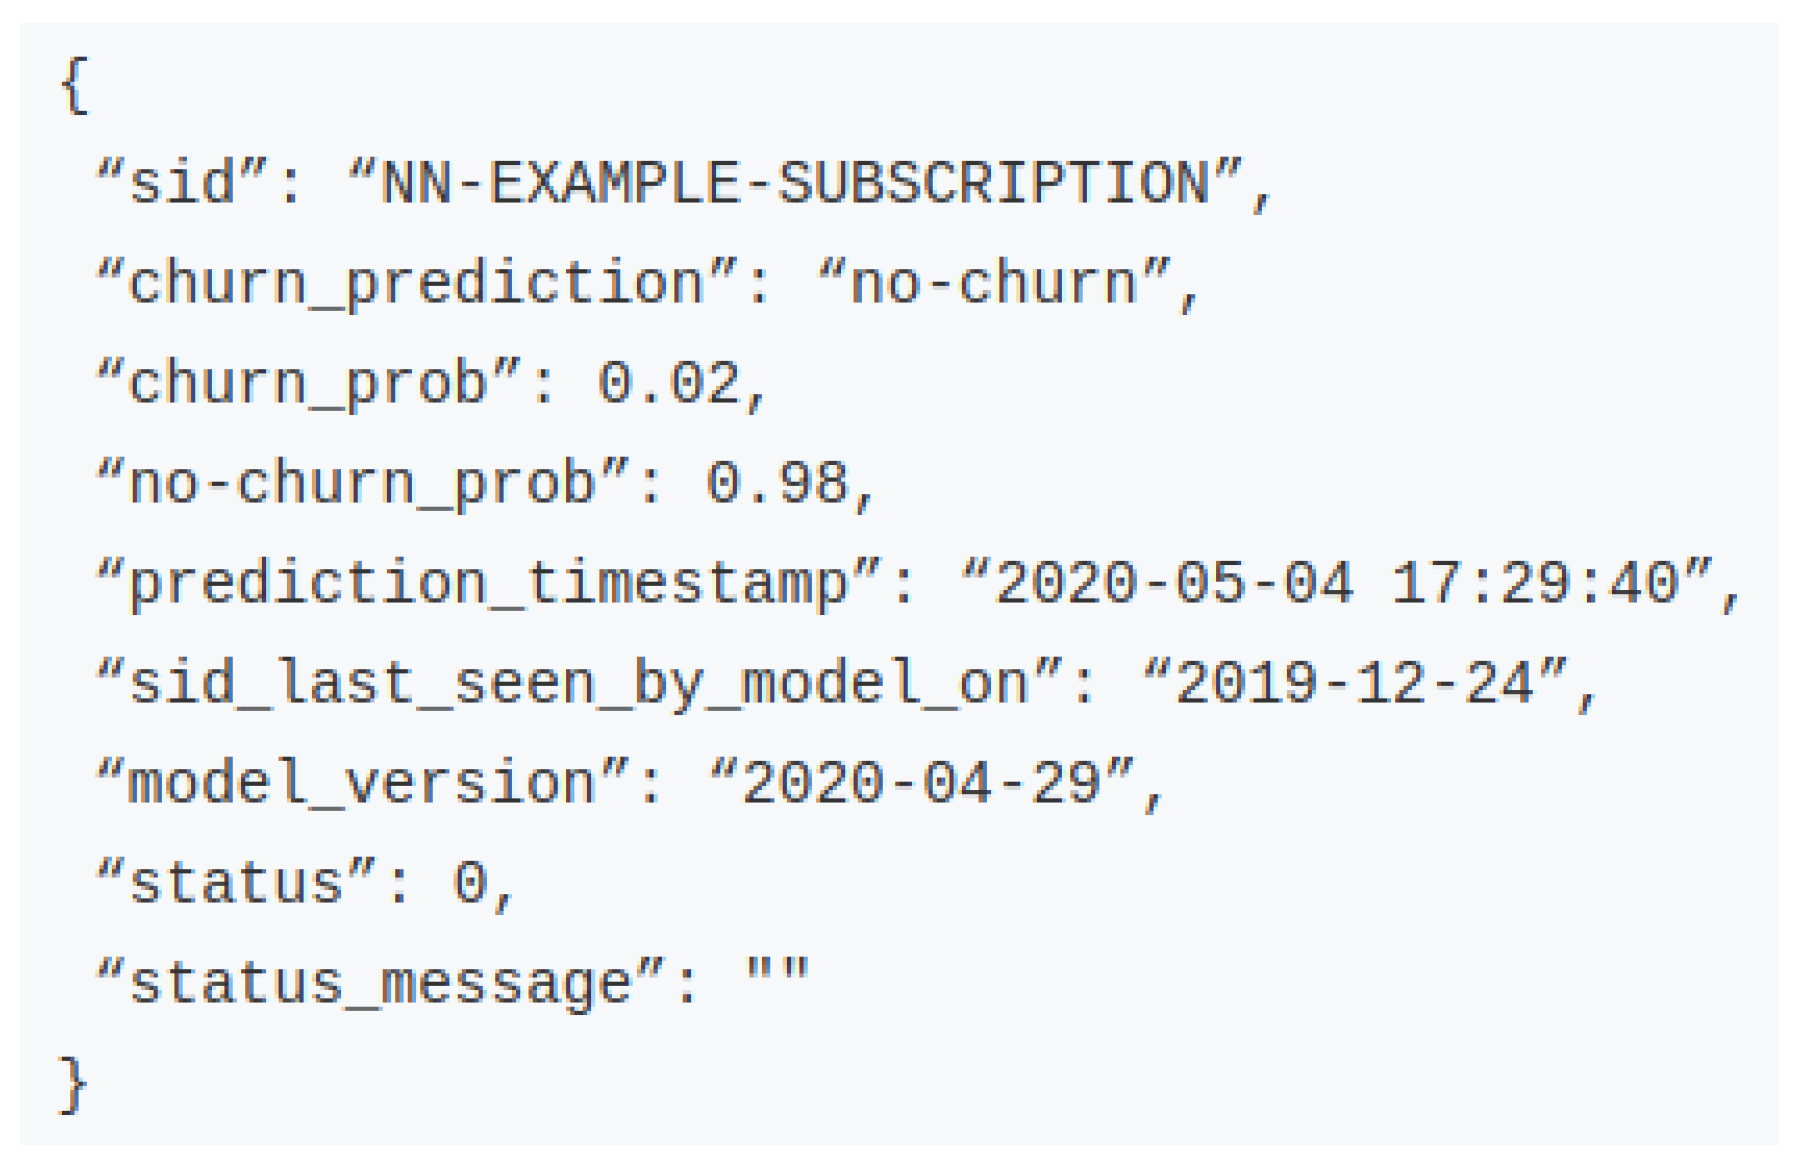
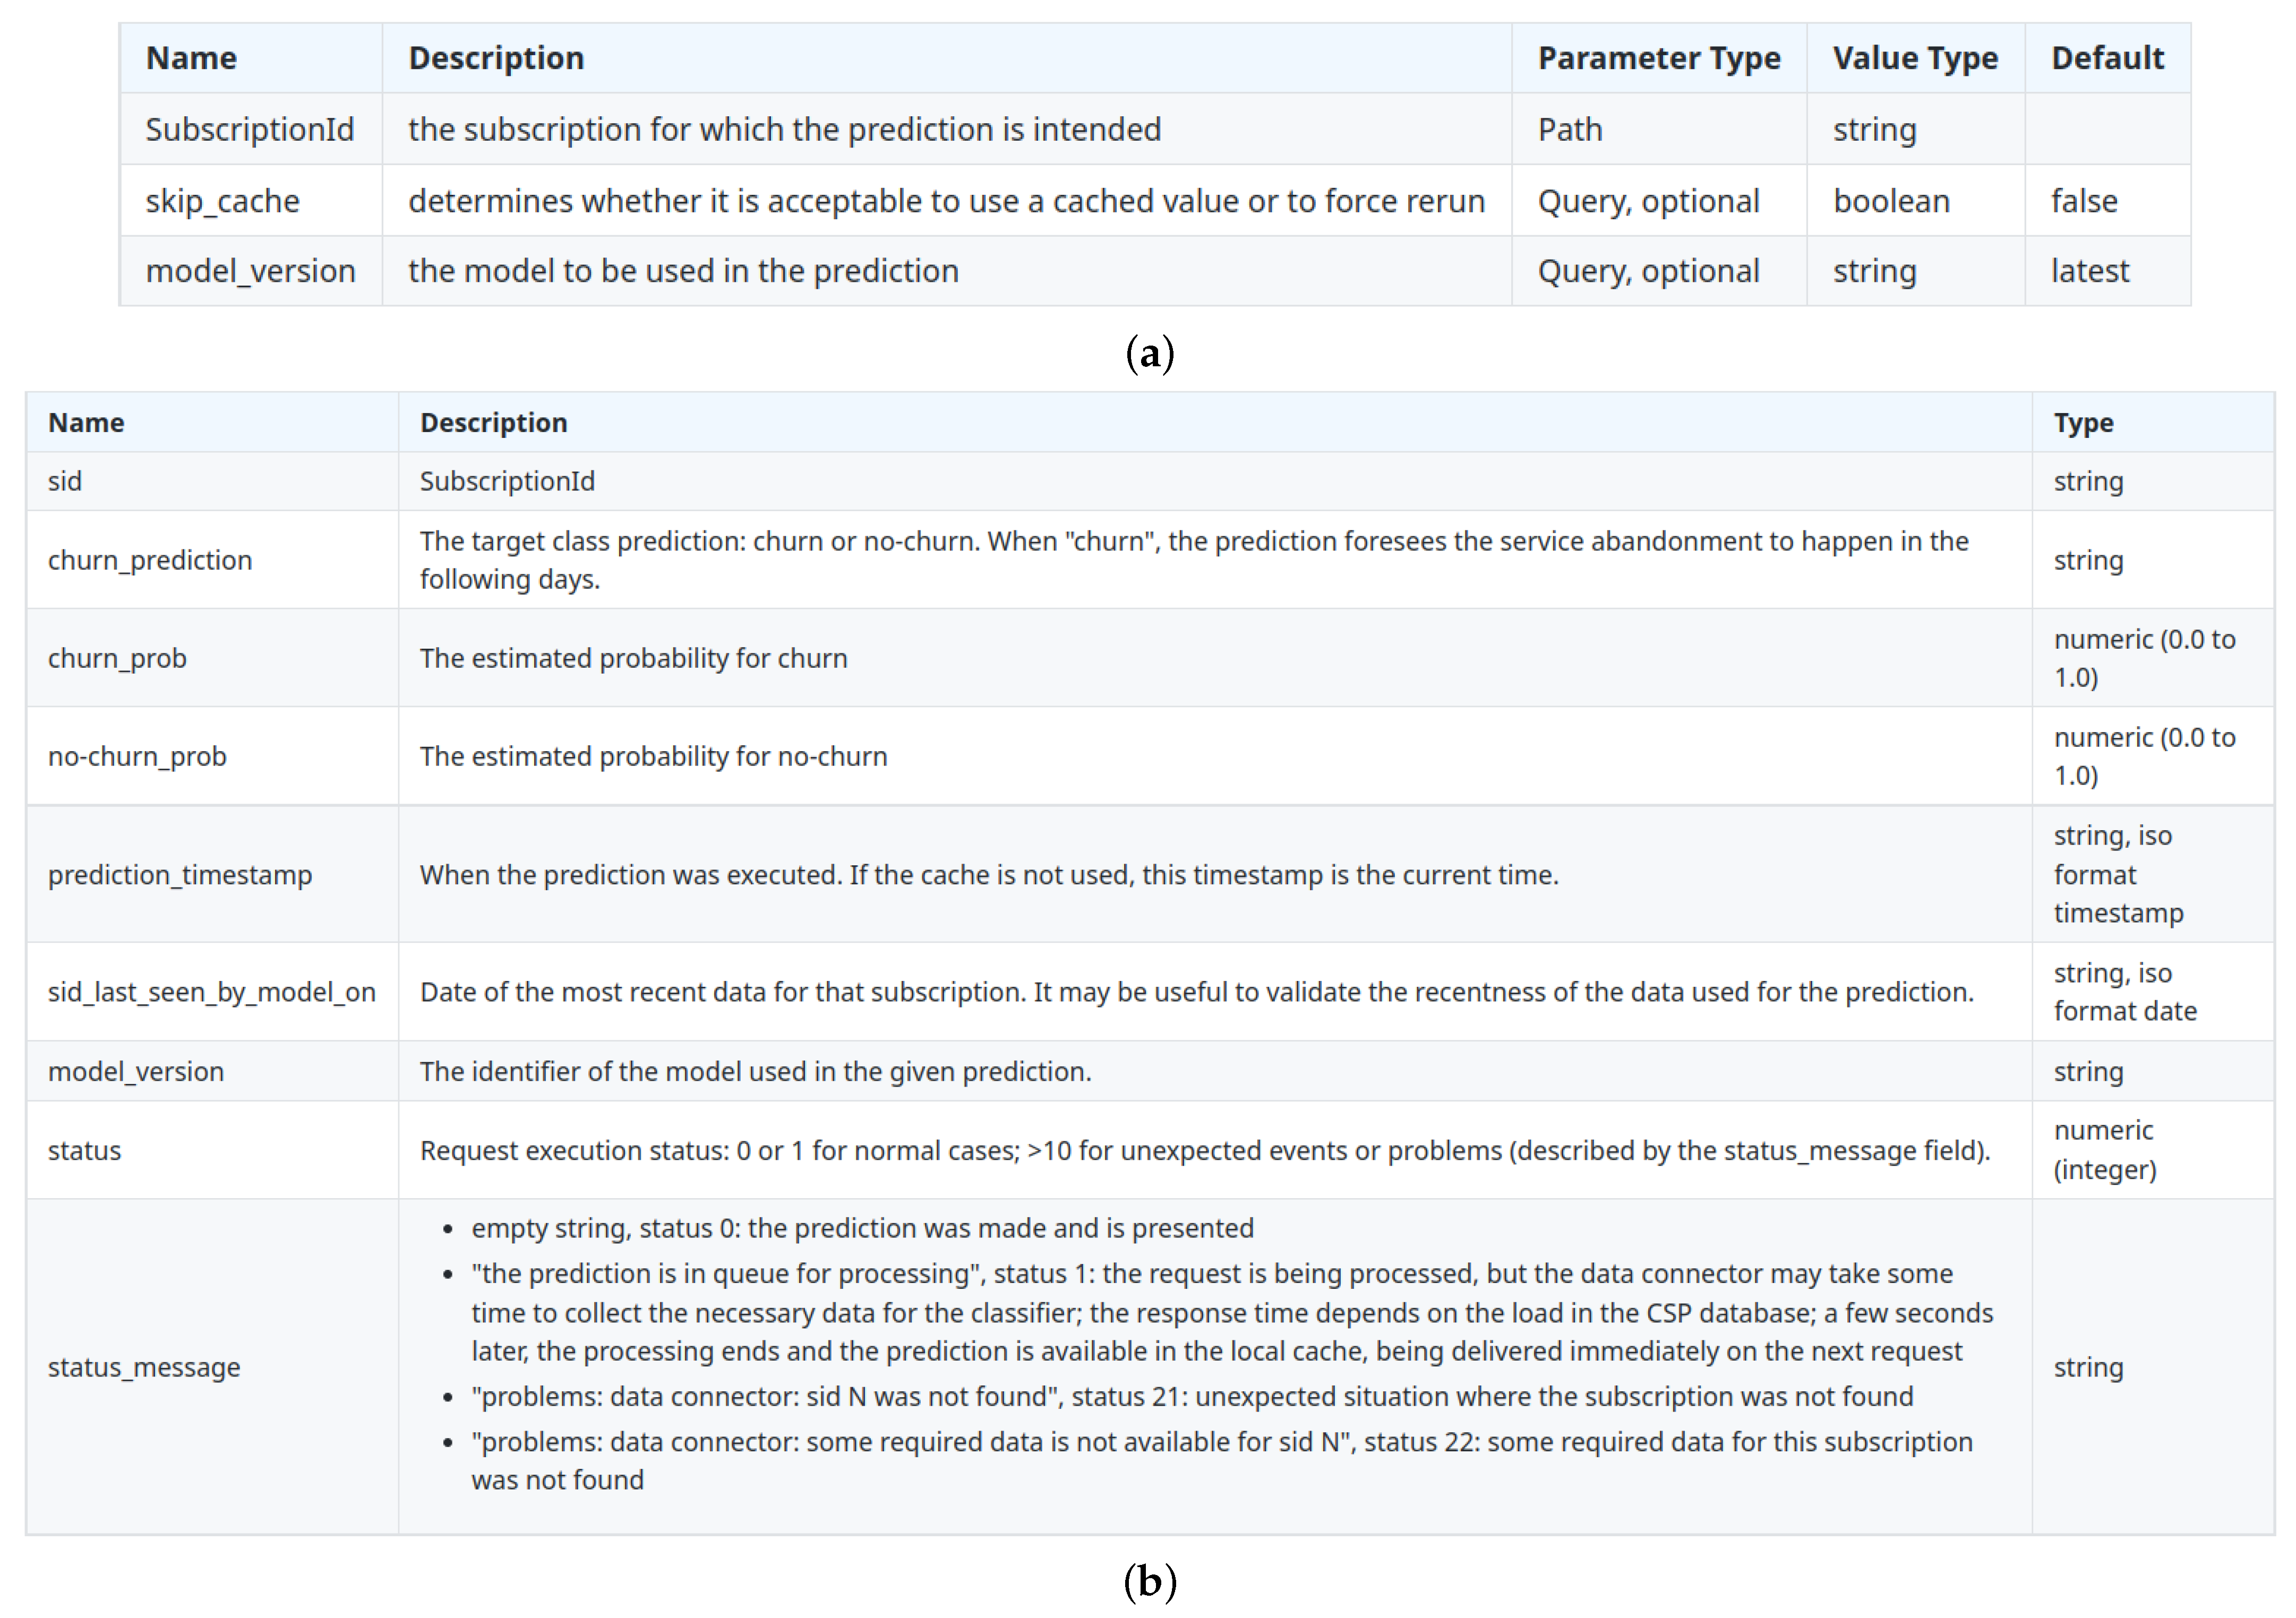
A RESTful web service was implemented for the churn risk prediction, whose requests identify the subscription and may include optional parameters about the cache or the model version to employ, as listed in
Figure 4a. Then, the system chooses the most appropriate predictive model (or models), feeds it with the features that describe the subscription on that date and returns the result in a JSON format, such as the example of
Figure 5. Each field description can be found in
Figure 4b.
5. Discussion
The tests with neural networks in Scikit-learn always gave us lower results than MLP with RPROP in KNIME. Regardless, both ensemble experiments led to better results, whether in accuracy, AUC, or F-Measure metrics. The random forest classifier in its best variant (64 estimators) obtained the best result in the development phase as shown in
Table 2, with an accuracy of 0.988 and a high F-Measure in both classes, 0.989 for the nonchurn class and 0.975 for instances of the minority class.
We noticed a close performance between the two emsemble methods in all evaluation metrics, as shown in the three tables. In both algorithms, during the model development stage, there was a slight improvement when we increased the number of estimators from 32 to 64.
When assessing the models on the testing set, once again, the random forest classifier had the best performance, as shown in
Table 3 and
Table 4. In general, models trained with the training set only perform slightly below what they did in the development phase. However, considering
Table 4, with extended training, they already recover their performance. This fact, and comparing the testing accuracy against the training accuracy, leads us to believe that with this dataset the model adjustment did not result in overfit.
The time needed to adjust the model was also analyzed, and the train was faster with random forest setup variants. The MLP models took longer to adjust.
In the data analysis, we found that part of the stronger correlations between input variables and the target label were not statistically significant. Given the high accuracy and F-Measure results, we also question whether there might be a bias in this dataset’s instances generation process through several snapshots for each subscription context over time, and therefore, there might be some similar (or correlated) instances.
We are waiting for some CSCP usage history to find out if this current dataset and the models based on it allow us to generalize different out-of-sample data patterns. At this stage of work, considering both the prediction performance and the required time for model adjustment, random forest in Scikit-learn emerged as the most promising solution, and it was chosen for CSCP service.
It is difficult to make a fair direct comparison between predictor models based on different datasets. Nevertheless, establishing a comparison between this work and [
13], we note that the type of data involved is similar, (including the use of calculated features, such as the number of days after the subscription start), as is the type of classifiers chosen for the predictive model (ensembles, including random forest). In both works’ classifiers, evaluation obtained similar values, not differing more than 1% in accuracy or AUC; however, in [
13] the F-Measure result is higher for the minority class (churn), while for us this metric has the best result for the nonchurn class. Other examples of high accuracy rates had already been reported on churn prediction, such as in [
9] for the financial area, where neural networks were used in a Python implementation, among others. We also found that random forest is often used for churn risk classification, as reported in [
2,
5,
8,
10,
11,
13].


