Article

Making Informed Decisions to Improve Restaurant Image Using a Hybrid MADM Approach: A Case of Fast-Food Restaurants in an Island of East Malaysia

by
Anath Rau Krishnan
1,
Rizal Hamid
1,*,
Ronia Yeap Siew Lin
2,
Geoffrey Harvey Tanakinjal
1 and
Balan Rathakrishnan
3
1
Labuan Faculty of International Finance, Universiti Malaysia Sabah, Labuan 87000, Malaysia
2
Maxfluids (M) Sdn. Bhd, Merinding Garden, Jalan OKK Daud, Labuan 87000, Malaysia
3
Faculty of Psychology and Education, Universiti Malaysia Sabah, Kota Kinabalu 88400, Malaysia
*
Author to whom correspondence should be addressed.
Information 2022, 13(5), 219; https://doi.org/10.3390/info13050219
Submission received: 22 March 2022 / Accepted: 31 March 2022 / Published: 22 April 2022
(This article belongs to the Special Issue Evaluating Methods and Decision Making)

Abstract

:
Restaurant image refers to an immediate perception that pops up in a customer’s mind when the name of a restaurant is mentioned. Therefore, it is crucial for restaurants, including fast-food restaurants (FFRs), to evaluate and sustain a positive restaurant image. However, evaluating and improving a restaurant’s image is challenging, since it counts in multiple service attributes associated with various degrees of unknown priority. Even so, the existing literature is yet to outspread the usage of an appropriate multi-attribute decision-making (MADM)-based approach to specifically evaluate the image of FFRs. Therefore, this research aimed at employing such an approach to evaluate the image of four FFRs on an island in East Malaysia, using various people, processes, and physical evidence attributes. Firstly, an initial list of FFR image attributes was elicited from the available literature. This initial list was then further validated through a two-round Delphi survey involving a panel of ten experts. A questionnaire was then designed based on the finalized attributes, and data collected from a sample of 251 respondents were analyzed using the compromised-analytical hierarchy process (C-AHP) method. The C-AHP results suggest that the strategies to improve an FFR’s image should primarily incorporate the following six attributes: hospitality, employees’ problem-solving skills, employees’ knowledge, food taste, physical cleanliness, and service response time. The FFR at the top of the ranking has the highest performance scores over these same six attributes. Surprisingly, employees’ appearance and restaurant exterior were reported as the two least important image attributes. This research is the first to demonstrate the application of a hybrid MADM-based approach to uncover the weights of FFR image attributes and rank those FFRs by computing their aggregated image scores.

1. Introduction

In today’s highly materialistic lifestyle, a significant change can even be observed in urban Malaysians’ food consumption practices [1]. Due to the hectic lifestyle routine, most people no longer have sufficient time to cook and eat at home; thus, they prefer to dine at the nearby fast-food restaurants (FFRs) [2,3,4].
FFRs usually prepare and serve orders quickly; therefore, these restaurants are also sometimes known as quick-service restaurants [5]. The menus in FFRs are normally prepared using standardized methods or ingredients to maintain consistent taste quality [6]. Lim et al. [7] further claimed that the types of food that FFRs offer typically exist in a wide assortment: pizza, chicken grills, hamburgers, etc. In short, an FFR can be defined as a type of restaurant that primarily aims at preparing a varied range of food using consistent procedures and serving them to customers within the quickest possible duration.
In the context of Malaysia, Rashid et al. [8] claimed that the rising personal income and urbanization among Malaysia’s population had increased their liking of fast-food items. It is also interesting to find that the increasing number of dual-earner couples in Malaysian families also caused them to opt for fast food. This is because such couples may have constrained time to prepare meals and dine at home [9].
Malaysians’ increased desire to dine at FFRs is also further supported by a report released by ACNielsen Online Consumer Survey in 2004. A summary of the report is available in [10]. The report disclosed Malaysia as the second-highest country in the context of fast-food consumption, after Hong Kong. The report was made based on ten countries such as the Philippines, Singapore, Thailand, and India. It is also claimed that a significant change in people’s eating preference is also influenced by the increasing number of young people who dislike the traditional way of cooking and have a better acceptance of the concept of fast food. A similar situation is also indicated by Figure 1 [11], which presents the results of a survey conducted by the Statista Research Department to analyze the frequency of Malaysian eating at FFRs in any given week. The statistics were resulted based on the sample data collected from 24,912 Malaysian adults. It clearly shows that the frequency of Malaysians eating at FFRs, or in other words, their preference over fast food, is gradually increasing across time. For instance, the percentage of those eating one to three times a week has increased from 36.05% in 2016 to 38.95% in 2018. In fact, the rate of those who do not consume food at FFRs has reduced from 1.68% in 2016 to 0.75% in 2018.
It is undeniable that the increasing demand and preferences of urban Malaysians for fast food have led to the mushrooming of new FFRs across the nation, particularly in developing areas. Despite the growing popularity of FFRs as a preference, the novel coronavirus has dramatically impacted the industry. Since the World Health Organization (WHO) declared a pandemic in March 2019, many FFRs have struggled to operate under the new standard operating procedures (SOP). The new SOPs forced the operators, kitchen workers, and service staff to adopt new roles and approaches. However, implementing these approaches and requirements may have an inverse effect on the customers. For instance, de Freitas and Stedefeldt [12] imply that the imposed procedures may contribute towards consumers’ forming a sense of social isolation. Likewise, Hakim et al. [13] also indicate that consumers’ perception of risk increased during the pandemic and influenced the consumers’ trust towards the operators. Of note, the crisis caused by COVID-19 has inevitably changed consumers’ perception of the FFRs. As a result, many of these FFRs are employing all the possible ways to attract and retain their customers [14]. A similar scenario is seen in Labuan, Malaysia.
Labuan, an island that is gazetted as one of the federal territories of Malaysia, had its first well-established brand of FFR back in 1994 when Kentucky Fried Chicken holdings decided to open their new branch on the island. Currently, there exist another three well-known FFR brands running their businesses on the island.
Based on certain online websites, it is interesting to discover that the public holds varying opinions and perceptions about the FFRs in Labuan Island. While some have applauded these FRRs for their excellent service, some have expressed their dissatisfaction by commenting on the prices, parking facilities, waiting time, to name a few. Such reports made in media or online pages may affect their image and their financial performance [15]. To sum up, there is still some space for improvement that these FFRs can consider to polish their image from the locals’ perspective.

1.1. Literature and Motivation of the Research

With a population of less than 100,000 people available on the island [16], it is a challenging undertaking for the management of each FFR in Labuan Island to compete in such a limited marketplace, and to magnetize the maximum possible number of potential customers to their restaurants. There are many marketing concepts or ideas that these FFRs could utilize to attract more customers [17]. However, this research is merely interested in exploring how the FFRs in Labuan Island can develop their competitive advantage by systematically evaluating and improving their corporate image, i.e., restaurant image.
It has been reported in many studies that corporate image plays a notable role in determining the survival of a firm, especially in a challenging business environment which usually becomes tougher over time [18,19]. The definition of the corporate image varies from one research to another. For example, LeBlanc and Nguyen [20] defined a corporate image as the result of an aggregate process by which customers compare and contrast various attributes of firms. Meanwhile, Keller [21] specified the corporate image as a firm’s perception held in customers’ minds. Andreassen and Lindestad [22] and van Rekom [23] further spelled out a corporate image as the people’s impressions, ideas, feelings, and beliefs about a firm, which is usually formed after customers’ experiences and communication. In short, a corporate image is the public’s perception that arises by mentioning a firm’s name.
Although scholars have their ways of defining corporate image, the majority of them do agree that a firm’s image does affect the customer’s decision whether to purchase and consume services or products offered by the specific firm [24,25,26,27,28]. Han and Jeong [29] and Lin and Lu [30] claimed that an impressive corporate image might increase the trust and loyalty in repurchasing the products and services offered by a firm.
Apart from promoting repurchasing, corporate image is also proven to be associated with customer satisfaction. Lai et al. [31] stated that customer satisfaction has no direct influence on the corporate image, but rather an indirect impact from the corporate image or an intermediate between firm image and loyalty. Meanwhile, Kandampully and Suhartanto [32], and Patterson and Spreng [33] reported that the corporate image could point out the firm’s quality, which significantly impacts customers’ perception of value and satisfaction.
Additionally, it appears that the term ‘corporate image’ could vary according to the context of research; scholars have tailored the term to match with the background of their research. For example, LeBlanc and Nguyen [20] used the term ‘hotel image’ to address the corporate image of a hotel. Likewise, Yang et al. used the term ‘airline image’ for an aviation industry-related study [34]. On the other hand, Dennis et al. [35] used the term ‘store image’ to indicate the corporate image of a store. Similarly, since the background of this research relates to the restaurant industry, the term ‘corporate image’ is substituted with ‘restaurant image’. There are also many studies relating to the restaurant industry that have used these two terms interchangeably [36,37].
In the context of a restaurant setting, according to Ryu et al. [38], every restaurant owner should attempt to form a unique image that distinguishes them from their competitors. A positive restaurant image, which indicates the quality of dining service for customers, is proven to have a strong association with increasing repetitive or loyal customers. They may also voluntarily involve in positive word-of-mouth marketing. In a similar vein, Otengei et al. [27] regarded restaurant image as one of the principal interpreters of loyalty towards a restaurant.
The most recent studies suggest that consumers’ evaluation of the FFRs image is negatively affected by the pandemic. According to Hakim et al. [13], most consumers would project an image of anxiety and feel threatened when visiting a restaurant. The study further indicates that the perception of risks towards restaurants directly influences consumers’ behavioral responses and sense of trust. On the same note, Al-Marzouqi and ben Yahia [39] use the behavioral inhibition system theory and suggest that consumers would place safety as the prime indicator for a restaurant during the pandemic. The restaurants’ sanitary measures help to mitigate consumers’ level of concern.
It is important to note that few past studies used the marketing mix attributes to evaluate the image of a brand or an organization [40,41,42]. Those studies have proven the significance of specific marketing mix attributes in characterizing image. However, it was surprising to discover that none of those studies is linked to the restaurant industry.
The marketing mix is a mixture of attributes that a business organization can consider to develop the appropriate strategies to achieve its marketing goals in the target market. The traditional marketing mix concept concentrates on four attributes: product, price, place, and promotion, i.e., 4Ps [43]. However, Booms and Bitner [44] introduced the 7Ps model by adding three more Ps: people, physical evidence, and process (3Ps), to have a more inclusive model for a service-oriented organization.
The broad application of 4Ps and 7Ps models can be observed via numerous past studies. However, interestingly, some studies have only applied the extended 3Ps to evaluate certain business aspects. For instance, Sarker [45] used the 3Ps model to evaluate the influence of people, process, and physical evidence on the telecom industry brand image. He used the 3Ps model with the justification that 3Ps have a greater effect on the customers than the traditional 4Ps, especially when the product is a service [46]. In another research, Das [47] investigated the determinants of customer satisfaction on retail banking services based on the same three attributes, i.e., 3Ps.
Even so, the application of the 3Ps model is yet to be extended to the context of restaurant image. Thus, there is a need in the literature to further evaluate and better understand the influence of 3Ps attributes on the image of an FFR.
On the other hand, the FFR image evaluation studies with fresh quantitative methods appear to be limited too. Most of the existing studies, e.g., [48,49,50], used dimension reduction methods (e.g., factor analysis) to understand the actual dimensions of the image attributes. Sadly, such methods do not provide some important additional information (e.g., the weights of the attributes) that could enable the key players to make better-informed decisions on improving the FFR image. Although the regression analysis method has previously been used to examine such weights, unfortunately, it does not integrate customers’ subjective preferences on the attributes while determining the weights [51].
Additionally, the existing literature works have not proposed a systematic FFR image evaluation approach that can simultaneously reveal the FFR image attribute weights and rank the FFRs involved according to their overall image score. It is important for any FFRs to rank their performance against various business aspects, including corporate image, since it will help the FFRs identify the principal competitors in the market [52] and facilitate them to design a more relevant business continuity plan.
In reality, many multiple-attribute decision-making (MADM) methods have been used to scientifically rank the performance of restaurants or other elements related to the restaurant business. For instance, Xue et al. [53] used the Method for Order Preference by Similarity to Ideal Solution (TOPSIS) to identify the performance of four FFRs in China based on customer satisfaction. On the other hand, Siew et al. [54] applied the analytical hierarchy process (AHP) method to rank the performance of five Korean restaurants in Semarang, Indonesia based on six service attributes. Meanwhile, Yildiz and Yildiz [55] evaluated the ranking of three restaurants in terms of the quality of service they provided using the combination of AHP and TOPSIS. However, the survey on past literature shows there exists no research which has considered MADM to rank the performance of FFRs based on their overall image.
On the whole, there is a need to evaluate the image of FFRs in Labuan Island based on the 3Ps model using a proper MADM approach so that the FFRs can simultaneously (a) compare their actual image in the marketplace from the public’s viewpoint and (b) develop the best possible strategies to enhance their image based on some convincing numerical evidence.

1.2. Contribution Statements

From the literature perspective, this research has three significant merits. First of all, the research has proposed an alternate set of restaurant attributes that can be used to evaluate the image of FFRs. The attributes were identified from the marketing mix perspective. Although the additional 3Ps are claimed to have more effect on the customers than the traditional 4Ps, the specific application of the 3Ps model is still rare [46]. No research has explored the potential application of the 3Ps model in evaluating the image of FFRs. Moreover, not too many studies presented a comprehensive set of attributes to model FFR image. For instance, the work carried out by Ryu et al. [38] has overlooked a few key image attributes such as the restaurant exterior, price worthiness, and hospitable employees. Therefore, this research has introduced a different yet inclusive FFR image evaluation hierarchical model that comprises three main attributes, i.e., people, process, and physical environment, and 17 sub-attributes.
Secondly, the research has proposed a novel hybrid MADM-based approach, which helps to uncover the actual weight of each FFR image attribute and identifies the relative ranking of the FFRs under investigation by computing their aggregated image scores. To be specific, the proposed evaluation approach was primarily developed by incorporating the Delphi and C-AHP method. C-AHP was chosen instead of the classical AHP because it has the ability to avoid the unacceptable degree of inconsistency that sometimes present across the values in a pairwise comparison matrix [56]. It has to be emphasized that this is the first research that has proposed the usage of C-AHP to restaurant image evaluation problems. Note that various MADM methods have been considered in restaurant-related studies, e.g., [57,58,59], but not to evaluate the image of FFRs.
Thirdly, this research can be regarded as one of the endeavors to diversify the use of different quantitative methods in FFR-related studies, which is seemingly limited to date. Most of the existing studies used the dimension reduction method or regression analysis to evaluate the restaurant image, e.g., [48,49,50]. In contrast, this research presented an alternative approach to evaluating the FFR image, mainly by employing the idea of MADM.
Meanwhile, from the managerial perspective, the research has two important contributions. Firstly, by identifying the relative image score of each FFR in Labuan, these FFRs are then expected to effectively comprehend their actual position in the marketplace from their customers’ perspective. Moreover, based on the ranking presented in this research, the FFRs may understand their urgency to develop the right strategies to improve their image.
Secondly, based on the computed relative weightage of the image attributes, some feasible strategies were proposed to improve the overall image of the involved FFRs. Fundamentally, the suggested strategies are sending a clear signal to the involved FFRs that they should put more effort at improving their performance over the following six most dominant sub-attributes if they want to maintain a positive image in the customers’ minds: hospitality, employees’ problem-solving skills, employees’ knowledge, food taste, physical cleanliness, and service response time. It is also interesting to discover that employees’ appearance and restaurant exterior do not play a major role in improving the FFR image.
The remainder of this paper is organized as follows. Section 2 explains the methodology of the research work. Section 3 reports the results. Section 4 discusses the major findings of the study. Section 5 concludes the limitations of the research and the potential future works.

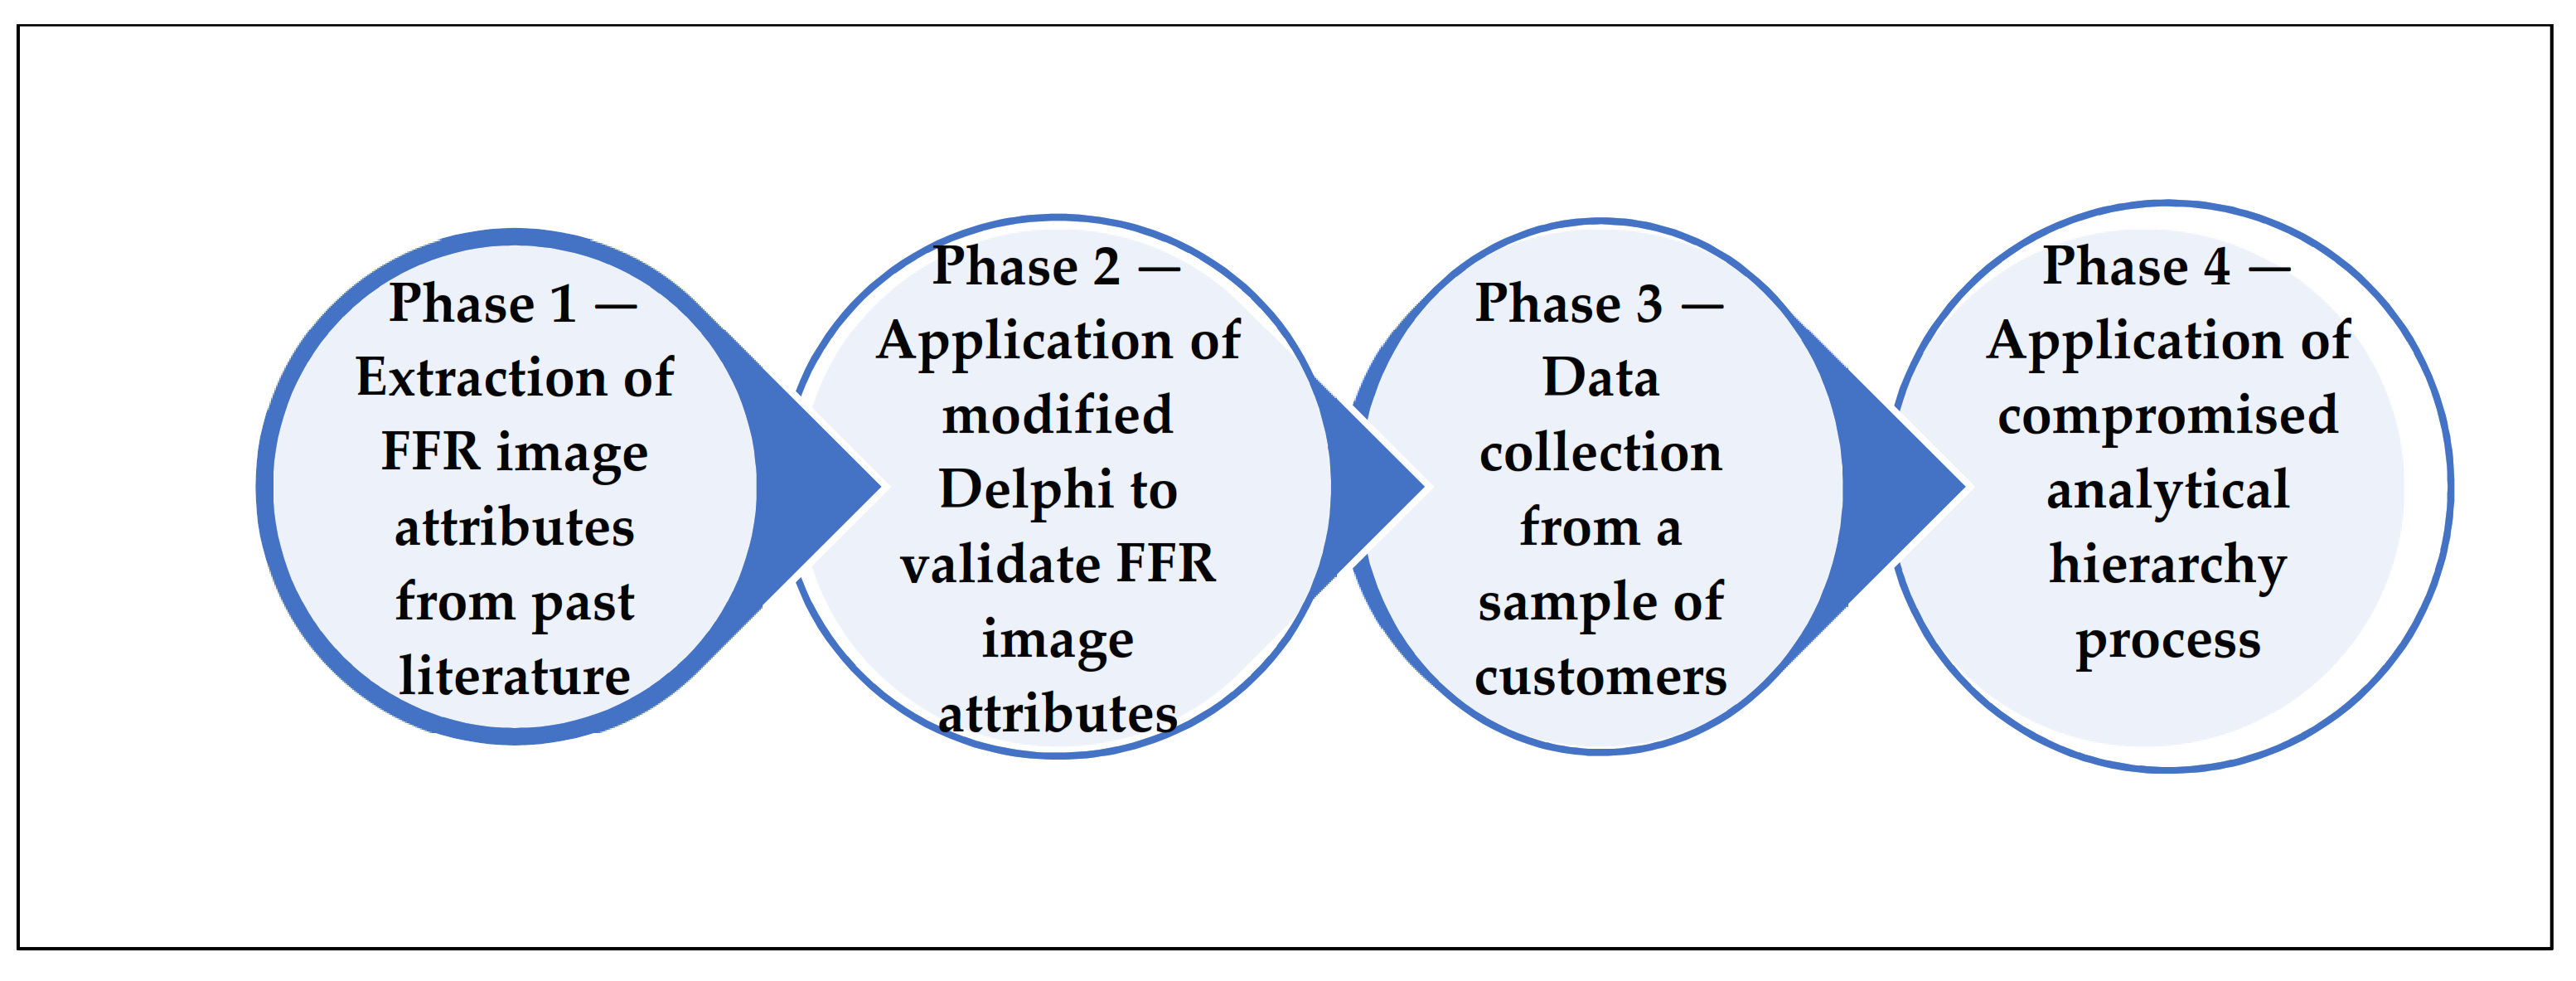
2. Research Methodology

The methodology of this research can be summarized into four main phases, as portrayed by Figure 2. Further details on the purpose and execution of each phase are explained in the following sections.

2.1. Phase 1—Extraction of FFR Image Attributes from Past Literature

In phase 1, a review of relevant past studies was carried out to identify some key attributes that were used to characterize restaurant image. As discussed in Section 1, these attributes were then classified based on the three service-oriented marketing mix attributes, namely people, process, and physical evidence attributes. These attributes were used as the base to initiate further analysis. We classified the attributes by comparing them with the definition of the people, process, and physical evidence. These definitions were extracted from past literature, but we adapted them according to the context of this study, i.e., FFR. The following definitions are used for the classification purpose [60,61]:
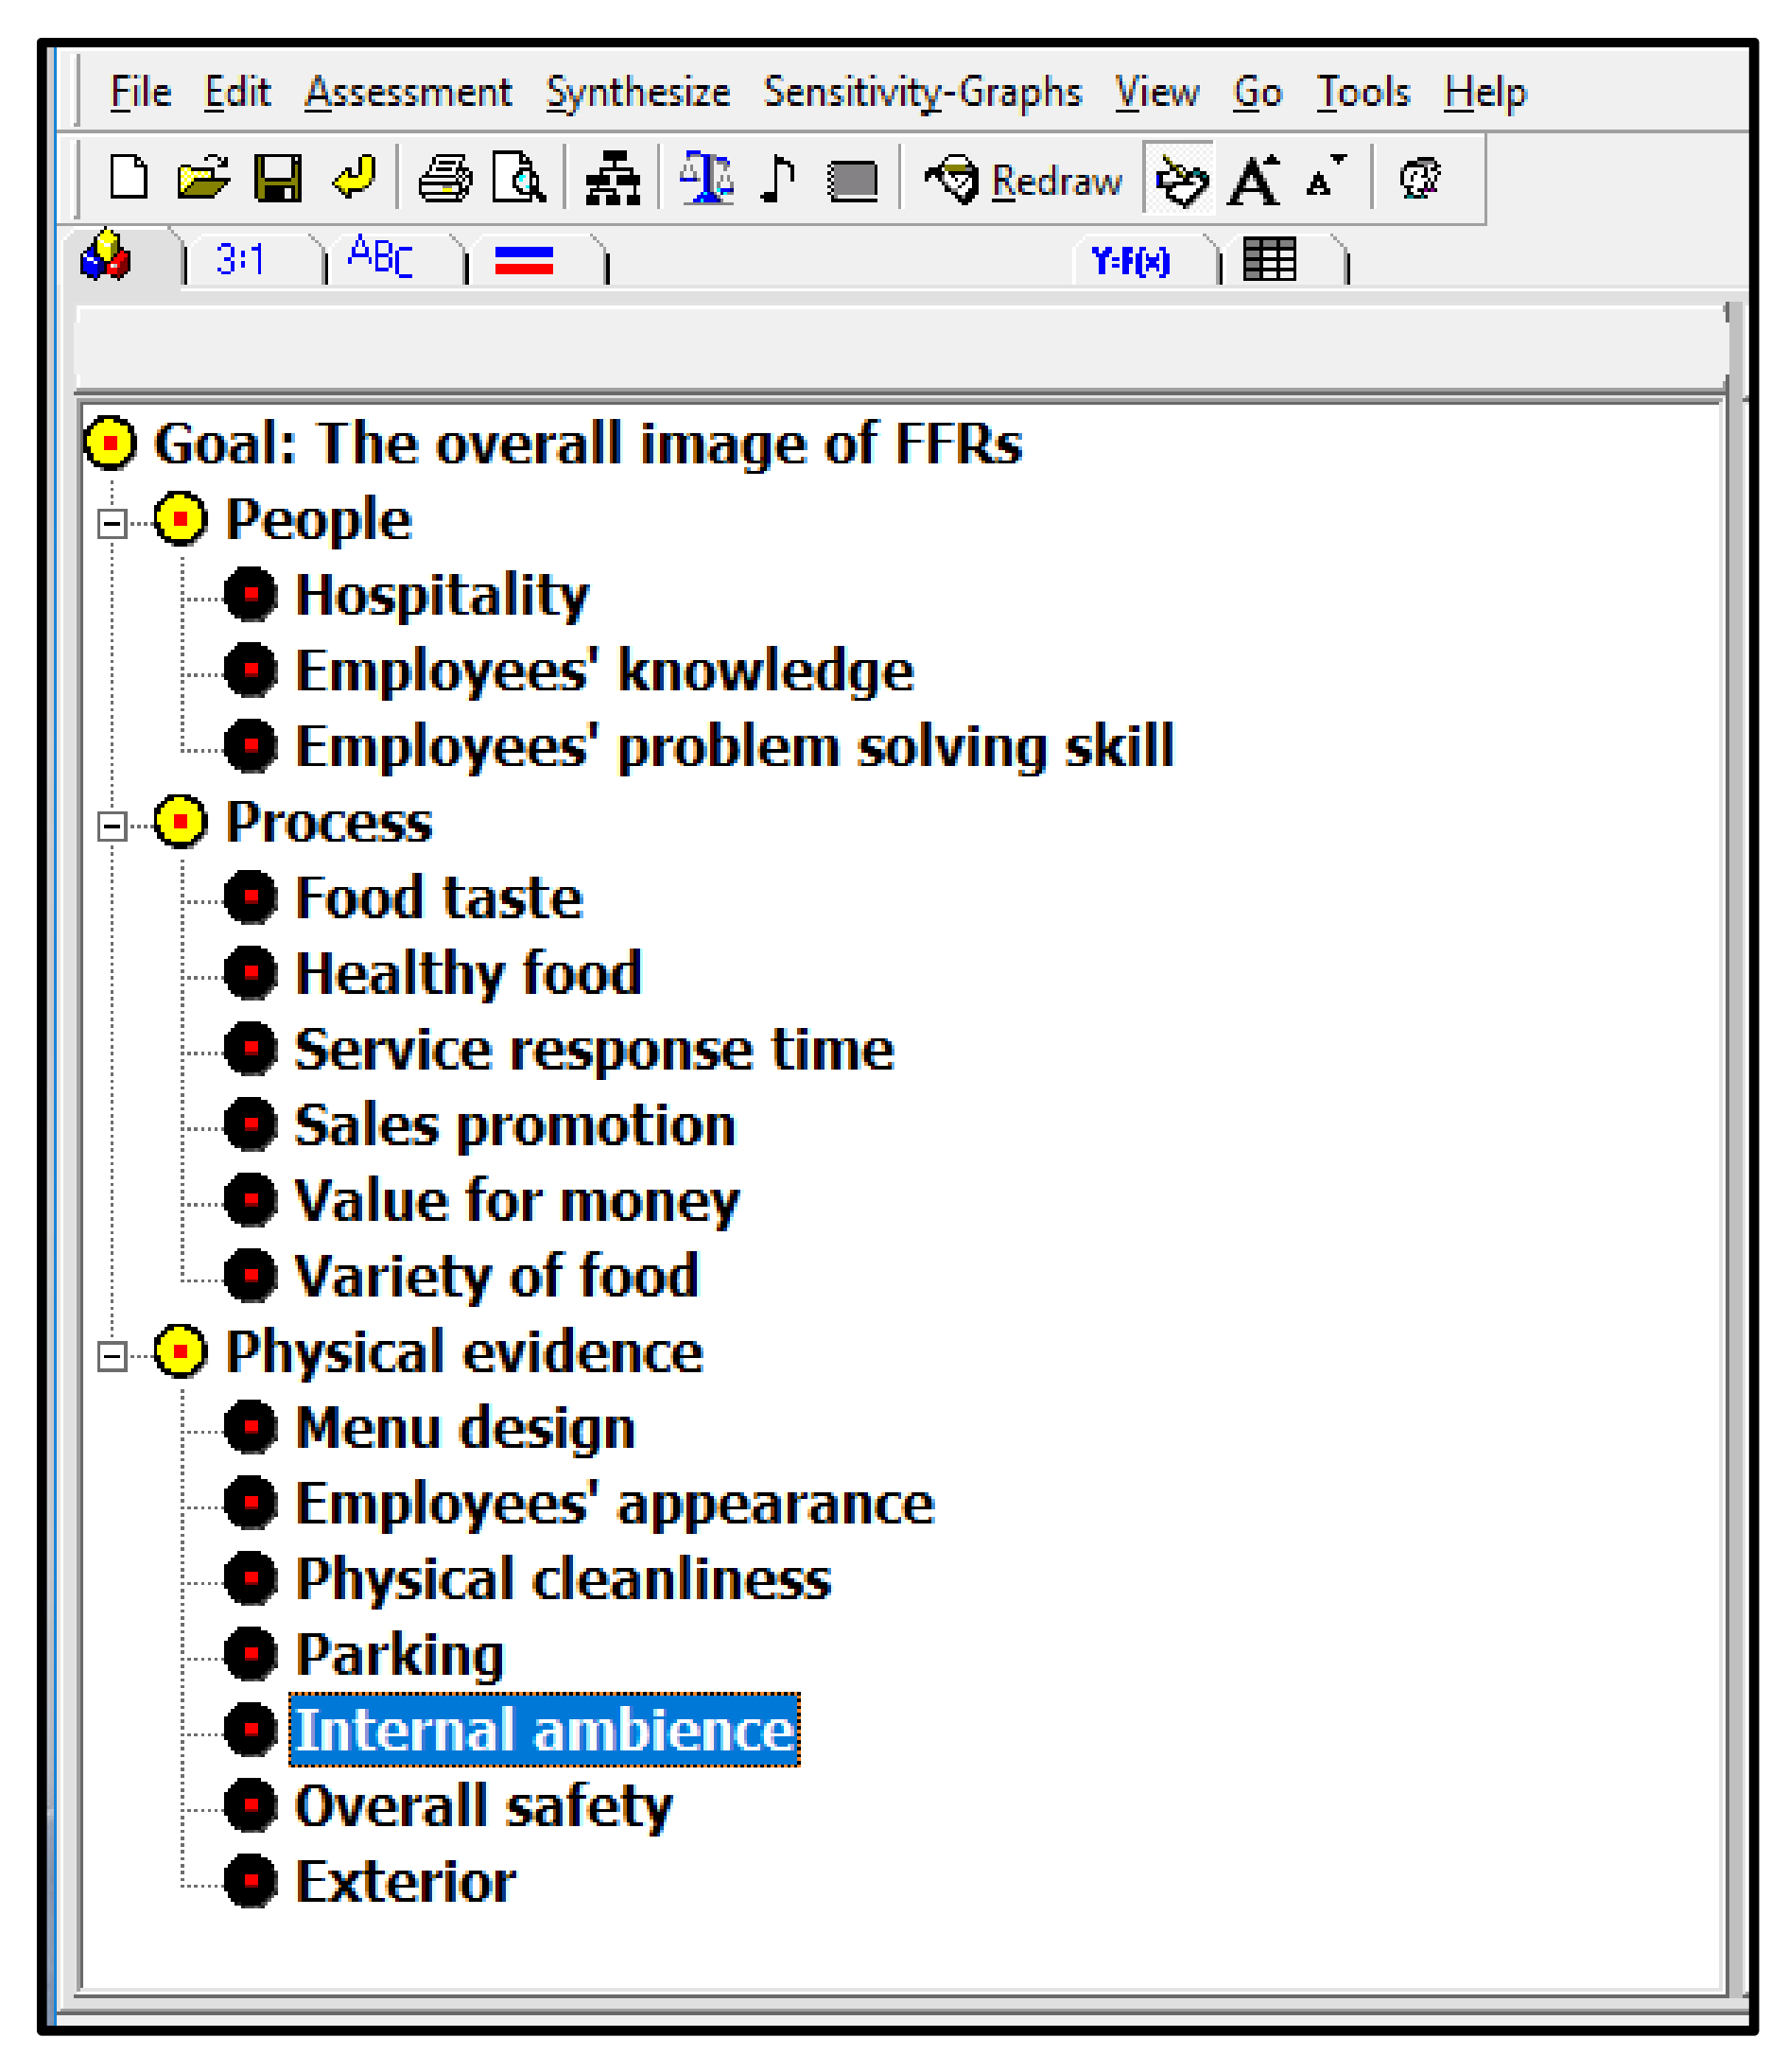
  • People—refers to how the FFR employees serve, perform, and interact with the customers.
  • Process—encapsulates all forms of methods involved right from receiving, preparing, and serving food orders to the customers, including promotional methods.
  • Physical evidence—refers to the tangible features at the exterior or interior of an FFR that the customers can quickly notice.

2.2. Phase 2—Application of Modified Delphi to Validate FFR Image Attributes

The Delphi method is known as one of the practical ways of achieving consensus on a particular matter through several rounds of discussion or assessment involving a group of experts whose identities are kept anonymous to each other [62,63,64].
In the traditional Delphi method, the survey is usually commenced by circulating an arrangement of open-ended questions to the panel of experts [65]. The individual responses from each expert are then summarized by the moderator and reported back to the experts during the next round of the survey [66]. At this stage, the experts are permitted to revise their initial responses by considering the answers provided by others. Still, the sources of reactions, or to be exact, the identity of the experts, are kept anonymous to minimize biased opinions [67]. This procedure is repeated until the desired level of steadiness in the responses is achieved [68].
Unlike the traditional version, which begins with an arrangement of open-ended style of questions, the modified version of the Delphi survey [69] is commenced with a set of carefully chosen attributes. This initial set of attributes is usually extracted by reviewing the past literature or interviewing a small cluster of experts [70]. Undeniably, the modified version of the method is gaining better acceptance among the researchers since it improves the response rate and provides a solid basis to embark the survey, as compared to the traditional method [71].
In phase 2, a modified Delphi method, as suggested by Wang et al. [72], was used to validate the list of attributes (main and sub-attributes) identified via the literature review. A group of experts that comprised ten experienced supervisors/managers from FFR industry was formed before commencing the survey. The panel was made up of supervisors/managers who have been working in local FFRs for more than three years.
Instead of approaching the customers, the FFR supervisors/managers were chosen for the Delphi survey on the following grounds. Firstly, these supervisors/managers do hold a good degree of knowledge about the customers’ actual needs and attitudes. Additionally, they are expected to know better about the advantages and disadvantages of their FFR with respect to their competitors. More importantly, these supervisors/managers could be the customers of other FFRs. Thus, their feedback can encapsulate the viewpoint of both industry experts and customers. In short, they can cross-check the attributes from a broader and deeper perspective than the customers.
The Delphi survey in this research was divided into two rounds. The survey is fixed with two rounds because three rounds or more could lead to the issue of research fatigue and panelist dropout [73]. Moreover, many recent studies have delivered reliable outcomes by maintaining two rounds of survey, e.g., [74,75].
In the first round, the experts were asked to indicate the importance carried by each attribute over the image of FFRs, based on a five-point Likert scale, where 1 and 5 denote “unimportant” and “important”, respectively. At the same time, the experts were encouraged to notify if any crucial attributes were absent from the provided list, supported with some acceptable reasons.
A new list of attributes was then formed by: (a) eliminating the attributes with the mean rating below 3.50 or the coefficient of variation (CV) value above 20%, and (b) adding the newly suggested attributes. This new list was then used as the input for the second assessment round, where the same mean and CV rule was used to finalize the attributes. We established this decision rule by unifying the suggestions raised in two separate Delphi studies conducted by Barry et al. [76] and Shah and Kalaian [77], respectively. While Barry et al. suggested that a consensus point in the Delphi survey would be achieved when the mean of the attribute is more than 3.5, Shah and Kalaian proposed that it would also be achieved when the CV value is less than 20%.

2.3. Phase 3—Data Collection from a Sample of Customers

The target population of this research was the residents of Labuan who have visited all the four FFRs under the investigation. In other words, the data were collected from a sample of residents of Labuan Island, who had the experience of dining at all the four FFRs. For confidentiality, the actual FFR names are not disclosed herein. We instead relabeled them as FFR A, FFR B, FFR C, and FFR D.

2.3.1. Sampling Approach and Caution Measure

This research used a non-probability sampling method known as convenience sampling in selecting the respondents. It is considered one of the weakest sampling approaches, but it still appears as one appropriate choice for this research as it deals with an infinite and non-static target population. However, the sampling procedure used in this research did not allow all interested individuals to participate in the survey. A screening question was used to determine whether the person has been to all the four FFRs under consideration in recent times. They were only permitted to answer the questionnaire if and only if they had visited all the FFRs. Otherwise, the respondents could end up providing ‘fake’ evaluations or responses for the FFRs that they have not visited before. In short, a cautious measure was taken to minimize biases in the final results.

2.3.2. The Instrument for Data Collection and Pre-Testing

A questionnaire developed based on the main and sub-attributes finalized in phase 3 was used as the instrument for the data collection. It was not necessary to further analyze the content validity of the questionnaire since it was developed based on the attributes finalized by the experts in the field through the Delphi survey. However, the questionnaire was pre-tested with a sample of 30 respondents, who came from various age groups (e.g., university students, working adults, and senior citizens) to identify and rectify any confusing terms or sentence structure errors therein. The questionnaire was only used for the real data collection once it was revised according to the received during the pre-testing. The question was structured into four main sections. Section A aimed at collecting some crucial demographic information of the respondents, whereas the following sections required them to:
  • rate the importance of each main attribute with respect to the image of an FFR based on a nine-point Likert scale (Section B),
  • rate the importance of each sub-attribute with respect to its main attribute based on a nine-point Likert scale (Section C), and
  • rate the performance of each FFR under evaluation with respect to each sub-attribute based on a nine-point Likert scale (Section D).

2.3.3. Mode of Data Collection

The data were collected through the online platform. To be precise, the questionnaire was developed using Google Forms and was circulated via some well-known Labuan-based Facebook groups. These groups are membered mainly by Labuan residents coming from various demographic backgrounds. Therefore, it was predicted that responses collected through these social media groups could represent the perceptions of overall Labuan dwellers (i.e., target population) well. The questionnaire was distributed via the selected online platform due to the following reasons [78,79]: (a) it helps to reach various groups of respondents, (b) it is less time consuming, (c) it saves cost, (d) it is convenient for sending responses, and (e) it allows the respondents remain anonymous.

2.3.4. Sample Size

A few rules can be used to decide the adequate sample size for conducting a meaningful empirical analysis. For instance, Sekaran and Bougie [80] stated that data collected from the sample of 30 to less than 500 are suitable for most of the research. In this research, the survey was carried out until 251 fully completed questionnaires were returned. In short, the sample size of this research was within the range suggested by Sekaran and Bougie [80].
Note that the data collected from the customers are used for C-AHP analysis. One key advantage of any version of AHP analysis is that it does not require a huge sample size to deliver sound and statistically robust results [81,82]. Likewise, a first-ever study investigating the ideal sample size for an AHP analysis reported that a sample size as small as 19 is acceptable to run a valid analysis [83]. Some researchers also argue that since AHP is based on the responses from individuals familiar with the subject of investigation, the responses from a small group of individuals are then sufficient to represent the whole population [84,85]. AHP’s broad application in many real problems can also be attributed to its compatibility with a small sample size. With all these arguments, we can conclude that the data collected for our study from 251 respondents were more than appropriate to conduct a meaningful C-AHP analysis.

2.4. Application of Compromised Analytical Hierarchy Process

The AHP method was originally introduced by Saaty [86]. It was developed based on the theory of ratio-scale measures introduced by psychophysicist Stevens [87]. It is a MADM method which has popularly been used to rank a finite set of alternatives that are characterized by multi-level decision attributes, e.g., main and sub-attributes. The method, which works based on pairwise comparisons, is also suitable for group decision-making [88].
However, in this research, a modified AHP method, namely the compromised AHP (C-AHP), was applied to rank the FFRs based on their aggregated image score. In original AHP, the evaluators are normally required to compare the elements involved pairwise, where the preferences are expressed by adhering to Saaty’s 1/9–9 linear scale, as summarized in Table 1. However, in this modified version of AHP, the type of data provided by the experts was different from the original AHP. To be precise, the experts had simply been requested to rate their preference based on a nine-point Likert scale, instead of making pairwise comparisons using the common Saaty’s AHP scale.
The ratings from each expert were then transformed into proper pairwise matrices by adhering to a particular set of rules, as expressed in (1). Nazri et al. [56] proved that the CR-value of the pairwise comparison matrices, derived using (1), would always be lesser than the threshold value of 0.10. In other words, using this data acquisition method, one should not worry about the presence of undesirable inconsistencies in the experts’ judgments. It is worth mentioning that the switch of Saaty’s scale with the nine-point Likert scale in C-AHP has helped simplify the usual data collection process further. The said simplification can be observed in the following two aspects:
  • Type of input data required: in C-AHP analysis, the type of input data required, i.e., preference ratings, were able to be quickly offered by the respondents, mainly because they were not required to compare all the possible pairs of elements. Note that in the original AHP, the type of data needed, i.e., pairwise preference ratings, is not easy to provide since some may keep bothering about the consistency of their judgment while comparing the elements.
  • The amount of input data required: in original AHP, to develop a comparison matrix involving n elements, n n 1 / 2 amount of input data is required from a respondent. However, for the case of C-AHP, only n amount of data were needed.
Following were the exact steps executed in processing the collected survey responses using C-AHP:
  • Step 1—The ratings provided by each respondent via the questionnaire were converted into proper pairwise matrices using Equation (1). In exact, firstly, the ratings from Section B were utilized to derive the pairwise matrix comparing the main attributes vs. the image of an FFR. Meanwhile, the ratings from Section C were converted to pairwise matrices comparing sub-attributes vs. their respective main attribute. Finally, the ratings from Section C were converted to pairwise matrices comparing sub-attributes vs. their respective main attribute. Table 2 illustrates better how the ratings from one of our experts in Section B of the questionnaire were converted into a complete pairwise comparison matrix using (1). Equation (2) is the general form of a pairwise matrix. Note that one important feature of a pairwise matrix is that if an element i compared to j is a i j , then the value of j compared to i should be the reciprocal of a i j i.e., a i j = 1 / a i j .
    L e t   b = r i r j I f   b > 0 ,   t h e n   a i j = b + 1 I f   b = 0 ,   t h e n   a i j = 1 I f   b < 0 ,   t h e n   a i j = 1 / ( b + 1 ) , w h e r e r i = p r e f e r e n c e   r a t i n g   o f   e l e m e n t   i r j = p r e f e r e n c e   r a t i n g   o f   e l e m e n t   j b = t h e d i f f e r e n c e b e t w e e n p r e f e r e n c e r a t i n g o f e l e m e n t   i a n d j a i j = r e l a t i v e   p r e f e r e n c e   o f   i   w h e n   c o m p a r e d   t o   j
    1 a 12 a 1 n a 21 1 a 2 n a n 1 a n 2 1 , w h e r e n = t o t a l e l e m e n t s t o c o m p a r e
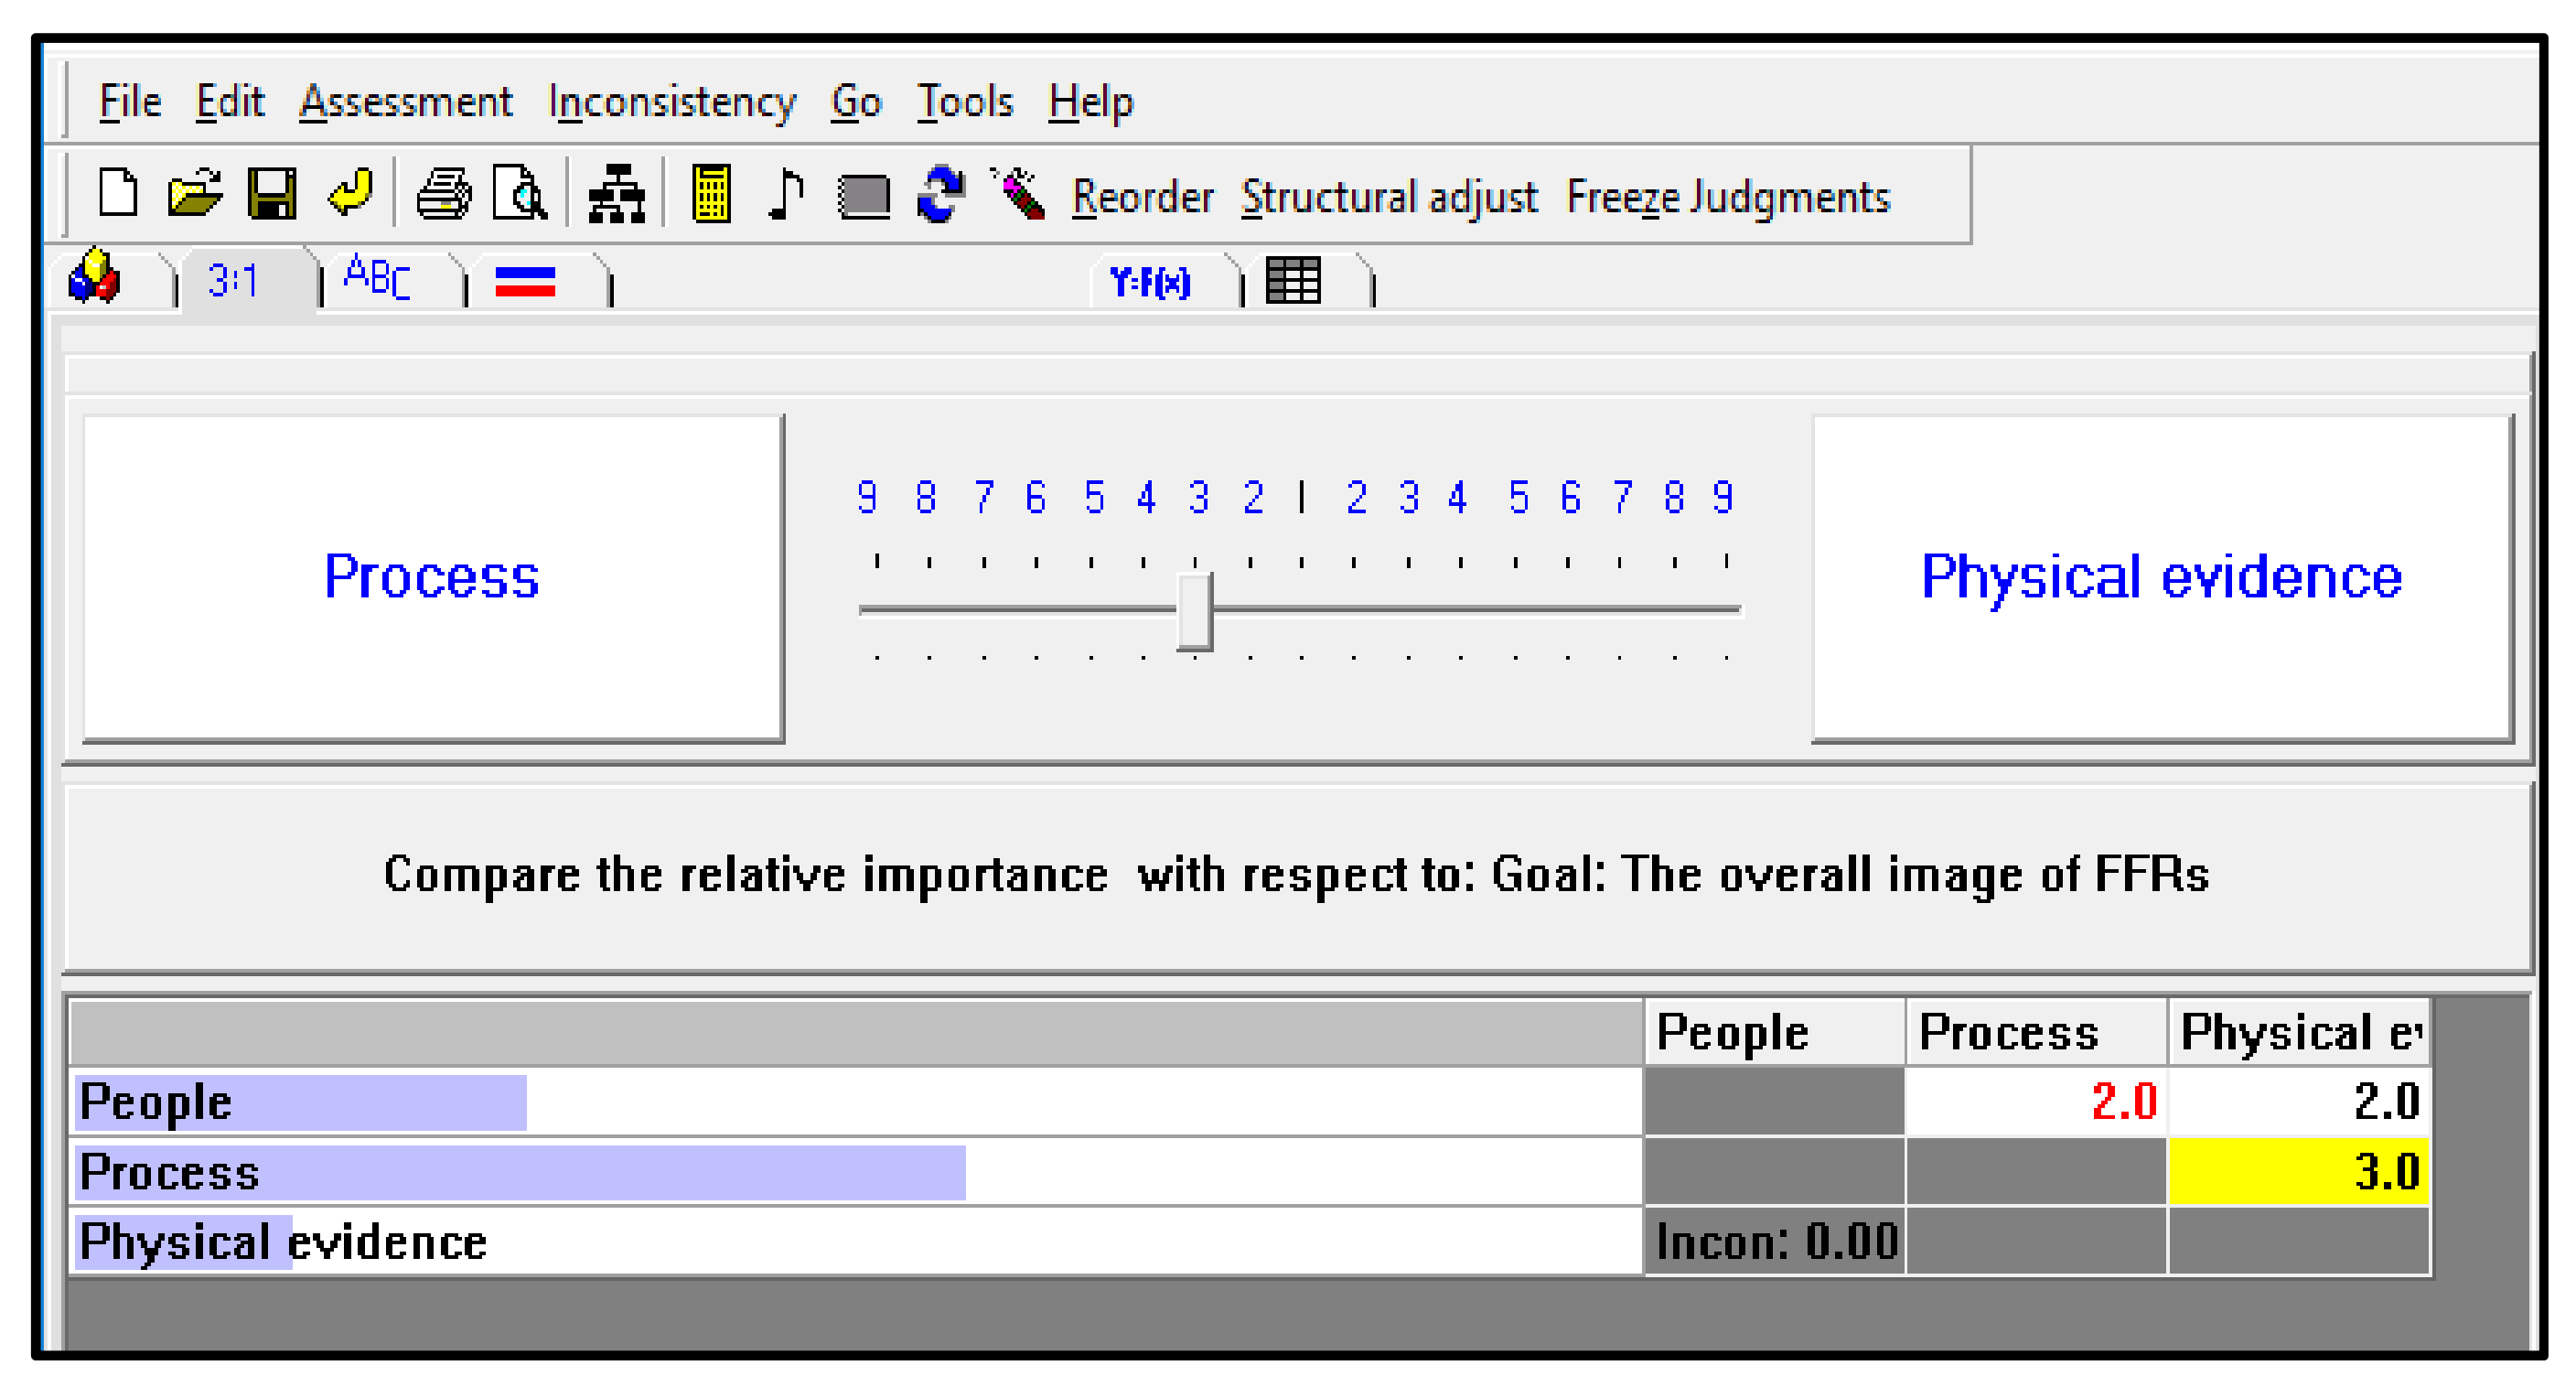
  • Step 2—The pairwise matrices resulting from each respondent were then recorded into the Expert Choice system [89], a piece of software specially designed to perform AHP analysis to calculate the local weight of main attributes (local weight of a main attribute refers to its relative importance in determining the overall image of a FFR), the local weight of sub-attributes (local weight of a sub-attribute refers to its relative importance with respect to its main attribute) and performance scores (performance scores refer to the performance of an FFR with respect to all the sub-attributes) of each FFR. Figure 3 is the screenshot displaying the hierarchical model of the problem at hand, as recorded in the Expert Choice environment; Figure 4 is the section in the system where the pairwise comparison values were recorded.
  • Step 3—Step 1 and 2 were repeated based on the responses from each respondent.
  • Step 4—The final local weight of main attributes, the local weight of sub-attributes, and performance scores of each FFR were determined by averaging the results from every respondent.
  • Step 5—The aggregated image score of each FFR was computed by synthesizing the global weights (global weight of a sub-attribute indicates its overall importance in the entire decision system) of sub-attributes and performance scores of the FFR using the weighted average Equation (2), where the global weight of a sub-attribute is determined by multiplying its local weight with the local weight of the respective main attribute. The FFRs were then ranked based on these aggregated image scores, divided by subheadings. It should provide a concise and precise description of the experimental results, their interpretation, as well as the experimental conclusions that can be drawn.

2.5. Design of the Proposed Hybrid MADM Method

Although a few previous studies have applied the classical AHP or the hybrid of classical Delphi and classical AHP in restaurant-related problems, these methods still carry some drawbacks. As such, we carried out a simple comparison to uncover the advantages and disadvantages of these methods against our proposed method based on five different criteria. The summary of the comparison is presented in Table 3. The comparison indicates that the proposed method holds an advantage over each criterion, making it a worthy contribution to the existing literature. In short, the following are main five reasons that triggered us to propose this unique combination of modified Delphi and C-AHP:
  • The inclusion of modified Delphi allows us to integrate feedback from experts with different experience levels; thus, a well-agreed set of FFR image attributes can be determined.
  • The modified Delphi survey supports us to reach a quicker consensus on the FFR image attributes since the survey begins with closed-ended questions (not open-ended questions).
  • C-AHP helps us sidestep an unacceptable degree of inconsistency in a pairwise comparison matrix, thus avoiding the possible wastage of time and resources used for data collection.
  • C-AHP requires fewer input data from the respondents than the classical AHP (see Section 2.4 for more details).
  • The type of input data required by C-AHP can be provided more quickly since the respondents do not have to worry much about the issue of inconsistent comparisons (see Section 2.4 for more details).

3. Results

This section reports and discusses the outcome resulting from each phase specified in Section 2.

3.1. Identification of FFR Image Attributes through Literature and Delphi Survey

Table 4 shows the initial list of sub-attributes identified from past literature and classified according to the three main attributes: people, process, and physical evidence. Three sub-attributes that were detected to have strong relevancy were classified under the people attribute, five under the process attribute, and seven under the physical evidence attribute. Table 4 also shows the description of every sub-attribute together with sources where the sub-attributes were elicited from.
It is important to mention that after the first round of Delphi, none of the attributes listed in Table 4 were discarded as they fall within the retention points (mean > 3.50 and CV < 20%). Instead, two new sub-attributes, namely variety of food and operation time, were included under the process attribute after considering the suggestions from some of the experts who think those attributes are relevant to the research. The additional justifications for their inclusion are as follows:
  • Variety of food
    Sulek and Hensley [90] revealed that offering a wide range of food would help to increase customer satisfaction and directly increase customer retention. They also mentioned that improving the readily available menu (e.g., adding seasonal fruits) will be a good add-up. Above all, Jin et al. [91] reported that offering various menu options such as a healthy food option or vegetarian foods will help satisfy the customers’ food needs, and the image of the restaurants will ultimately be improved. Hence, as suggested by the experts involved in the Delphi survey, the food variety was considered one of the process sub-attributes.
  • Operation time
    Kara et al. [92] mentioned that the business hour of a restaurant is one of the factors that could affect customers’ decision on going to the place. For example, if someone is working till a late hour, they will prefer to find a 24 h operating restaurant for dining purposes [93]. More importantly, based on the research conducted by Wong and Yu [94], it can be claimed that late closing hours can influence the image of a restaurant due to the significant change in the people’s lifestyle who may have to dine at late night. Therefore, as suggested by the experts, the operating time was noted as one of the process sub-attributes.
Table 5 depicts the final set of attributes that were finalized right after the second round of the Delphi survey, together with their mean and CV values. The mean ratings that range between 4.00 to 5.00 and the CV values that range between 10% to 19% signify the experts’ strong consensus over the suitability of the main and sub-attributes in measuring the image of FFRs.

3.2. Demographic Characteristics of Respondents

Regarding the survey involving customers, 259 completed questionnaires were received online, but 8 questionnaires had to be discarded due to respondent duplication. Therefore, only the data collected from 251 respondents were considered for this research. Of the total respondents, 148 (59%) were female, and 103 (41%) were male. In terms of employment status, 163 of them (64.9%) were full-time workers, 52 (20.7%) were students, 16 (6.4%) were housewives, 8 (3.2%) were unemployed, 6 (2.4%) were self-employed, and the remaining 6 (2.4%) of them were part-time workers. Next, in terms of age range, 209 of the respondents (83.3%) were between 21 and 40 years old, 23 (9.2%) were between 41 to 60 years old, 17 (6.8%) were aged below 20 years old, and 2 (0.8%) were above 60 years old.
Meanwhile, for the question of “On last month, how many times did you dine at fast-food restaurants?”, 119 of the respondents (47.4%) claimed that they dined more than two times, 68 (27.1%) dined twice, and 56 (22.3%) dined once. Only eight (3.2%) of the respondents claimed that they did not dine at all at any of the FFRs over the last one month. To conclude, almost all the respondents (96.7%) can be considered as customers who had recent experience dining at the FFRs on the island; thus, the bias in the final results is expected to be minimal.

3.3. Results of C-AHP

The data collected from customers were then used to perform C-AHP. In this section, the results of C-AHP are discussed based in the following order: (a) the relative weights of the main attributes and sub-attributes, (b) the performance scores of the FFRs with respect to each sub-attribute, (c) the overall image score of FFR and their final ranking, and (d) possible strategies for improvement according to the global weights of sub-attributes.

3.3.1. The Weights of Main and Sub-Attributes

The tree map in Figure 5 summarizes the weights of main and sub-attributes. In terms of the influence held by each main attribute towards the overall image of FFRs, the results in Figure 5 indicate that the people, process, and physical evidence attributes carry weights of 0.330, 0.348, and 0.322, respectively. This clearly indicates that the process attribute has a slightly better influence than people, and people has a somewhat impactful than physical evidence. However, the weights indicate that the significances held by all the three main attributes towards an FFR’s image are relatively close to each other. It appears that none of the main attributes has significant different local weight. Thus, it can be simplified that, on average, all these three main attributes have an equal effect on the image of FFRs.
The results further point out hospitality, with the local weight of 0.357, as the most important determinant of the people attribute. Meanwhile, the taste of food, with the local weight of 0.174, is identified as the main determinant of the process attribute. On the other hand, physical cleanliness, which has a relative local weight of 0.184, is pointed out as the most crucial determinant of the physical evidence attribute. Note that there are two types of sub-attribute weight present in Figure 5: (a) local weights colored in green, and (b) global weights colored in red.

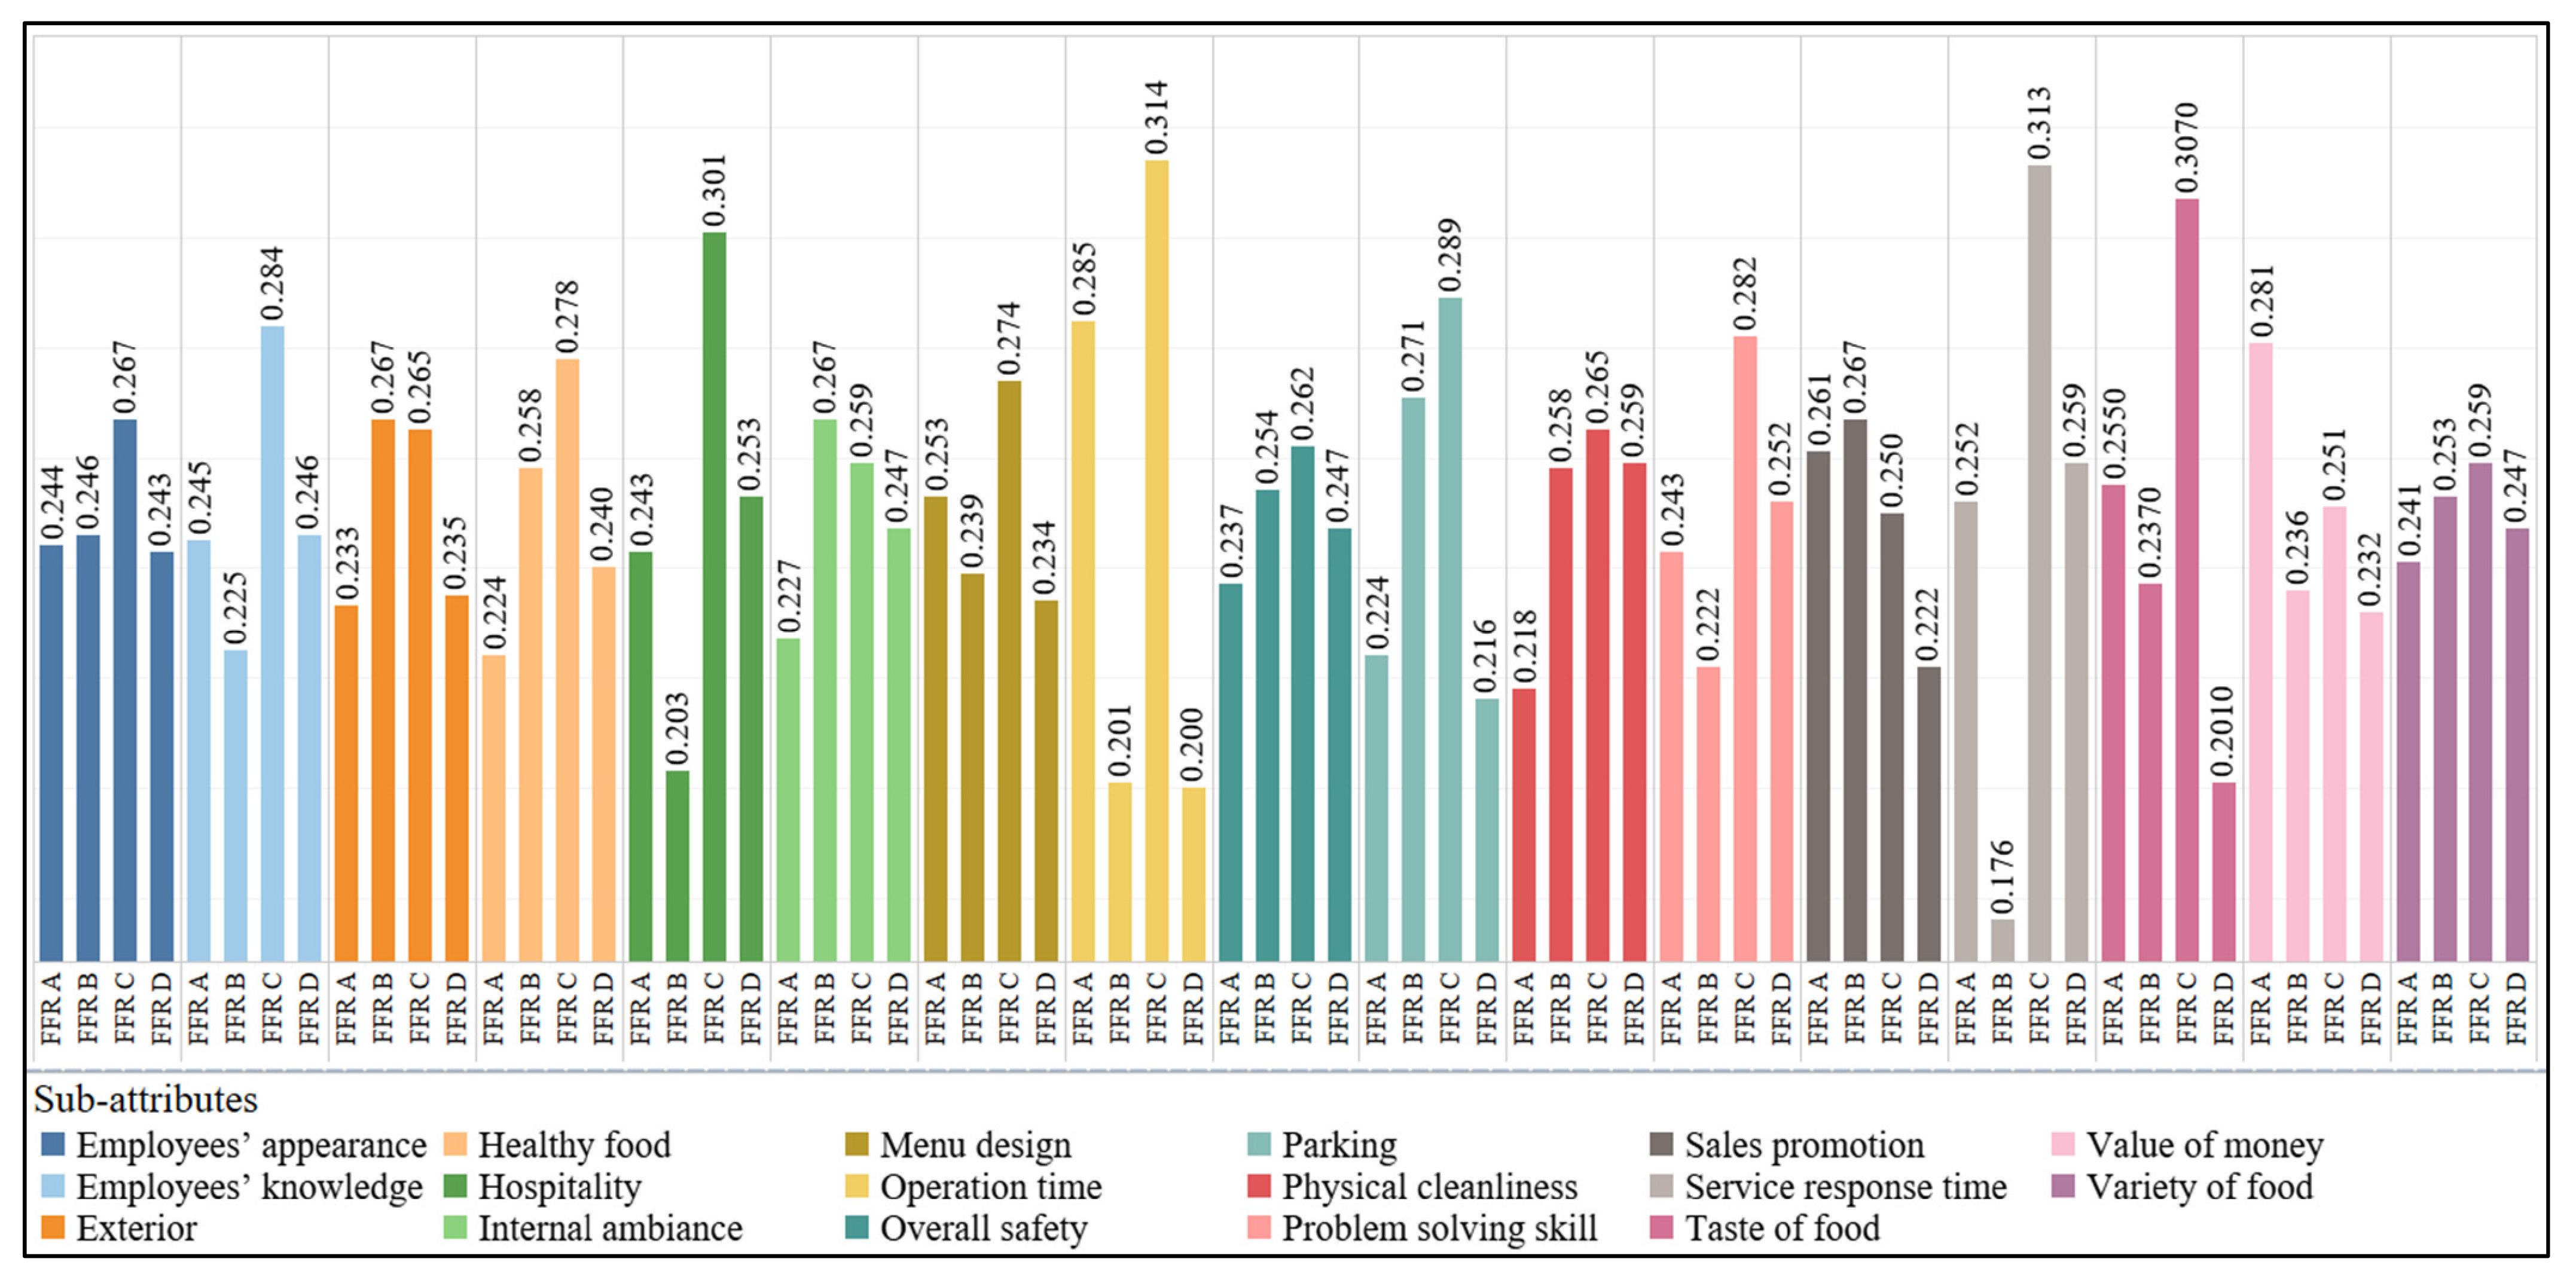
3.3.2. Performance Scores of FFRs

Figure 6 summarizes the performance scores of every FFR across all the 17 sub-attributes. The detailed discussion on these performance scores is presented hereafter:
  • FFRs vs. hospitality
Figure 6 clearly shows that FFR C, with a score of 0.301, has the friendliest staff compared to other FFRs, especially FFR B, which has the lowest hospitality score (0.203). A further observation was made using the “mystery customer” method to better comprehend the reason for this result. Mystery customers observe or test the services delivered by business organizations and provide instantaneous feedback about the quality of the services [114,115,116]. It was found that, unlike FFR B, FFR C staff never failed to invitingly welcome or greet their customers, irrespective of any situation, including when the restaurant was fully packed.
  • FFRs vs. employees’ knowledge
Figure 6 shows that FFR C, with a relative score of 0.284, has the best informative employees, followed by FFR D (0.246), FFR A (0.245), and FFR B (0.225). Further observation using the mystery customers method also reveals that every FFR C employee can provide precise yet speedy information about food, beverages, deals, and discounts. Most of their employees have information at their fingertips and are ready to answer customers’ queries without referring to others. However, a slightly different scenario was observed for the rest of the FFRs, where the employees sometimes had to ask for their colleagues’ help prior to clarifying the customer’s doubts.
  • FFRs vs. employees’ problem-solving skills
In the context of employees’ problem-solving skills, based on Figure 6, it is evident that FFR C has gained the highest score (0.282), followed by FFR D (0.252), FFR A (0.243), and FFR B (0.222). This shows that customers believe that the FFR C employees are more responsive to the requests or complaints made by the customers, which appears to be accurate based on further observation using the mystery customers method. Additionally, the employees of the FFR seem to have better experience in quickly dealing with unexpected situations occurring within the restaurant environment.
  • FFRs vs. taste of food
The process involved in food preparation or cooking may influence the perception of customers about the taste of the food ordered. Standardized cooking procedures typically help maintain the consistency of the taste of the food offered. This could be one reason why FFR C has gained the highest taste score (0.307) compared to the others (refer to Figure 6). Since FFR C adheres to highly standardized food preparation procedures, customers can expect a consistent taste whenever the same food item is purchased. In other words, it can be concluded that FFR C customers are generally satisfied with the food purchased at the restaurant, since the food taste has never failed to meet their expectations [90].
On the other hand, FFR B has the lowest relative taste score, which is 0.222. A causal survey with some selected customers reveals that sometimes the items (e.g., pizzas) ordered are overcooked, or the toppings of the food are not consistent with the requests made. These circumstances may affect the customer’s perception of the food taste in FFR B.
  • FFRs vs. healthy food
Based on Figure 6, again, FFR C, with a relative score of 0.278, is identified as the best FFR that offers healthy menus. On the contrary, FFR A, with a score of 0.224, is considered the poorest one. Note that the main menu of FFR A, i.e., fried chicken, is usually associated with high fat and oil content than that of FFR C. They should thus minimize the number of unhealthy elements in the food items by relooking at their food preparation procedures.
  • FFRs vs. service response time
Figure 6 shows that FFR C (0.313) obtained the best score in terms of service response time, followed by FFR D (0.259) and FFR A (0.252). The score of FFR B (0.176) is drastically lower than the other three FRRs. Unlike the other FFRs, the main items offered by FFR B, i.e., pizzas, are usually prepared and baked upon the request made by the customers. Preparing the ingredients for the pizzas and baking them consumes some time. This causes the waiting time of customers in FFR B to be somewhat longer; thus, it was not surprising that FFR B obtained the lowest score in terms of response time.
  • FFRs vs. sales promotion
Based on Figure 6, in the context of sales promotion, FFR B tops the list with a relative score of 0.267, and FFR A was a close second with a score of 0.261. These two FFRs, with close scores, never fail to offer various attractive sales promotions to their potential customers. In reality, both FFRs offer some permanent sales promotions throughout the year. For instance, FFR B offers the “take away” promotion where customers may purchase pizzas for as low as RM5 per pizza. Meanwhile, FFR A offers discounts for certain categories of meals if they are bought during lunch and dinner hours.
On the other hand, the results also indicate FFR D as the lowest-performing restaurant in terms of sales promotion (0.222). Most of the time, FFR D only distributes its discount coupons to existing customers. Thus, new customers are not aware of the sales promotions offered by the restaurant. It is suggested that FFR D use better platforms (e.g., social media) to circulate information about their sales promotions to attract more customers.
  • FFRs vs. value for money
Value for money refers to the worthiness of the price paid for the products or services received by the customers. In respect to this context, the results in Figure 6 show that FFR A stands in the first ranking, with the score of 0.281, as it is known for offering value for money meals, compared to the other three restaurants. For instance, by purchasing a simple combo set at FFR A, the customer can receive a complete meal that comes with a large piece of chicken, a burger, a cup of whipped potato, a cup of coleslaw, and a medium-sized drink. The scores of the last two restaurants in the ranking, FFR B and FFR D, which are close, indicate that the prices determined by the restaurants are slightly expensive. These restaurants should consider readjusting their prices or improving their food quality so that customers would have a better sense of satisfaction after dining [117].
  • FFRs vs. food variety
A good FFR should offer a wide array of food to fulfil the preference of customers with various demographic backgrounds. As such, the results in Figure 6 show FFR C, with a score of 0.259, as the best restaurant in the context of food assortment. Indeed, FFR C has its own Happy Meal to satisfy kids, Filet-O-Fish for catering seafood lovers, porridge to accommodate senior citizens, and more importantly, it offers a variety of burgers and fried chicken that youngsters generally prefer. It is not surprising to see FFR A with a relatively lower score than the other three FRRs (0.241), because most of the menu items offered by the restaurant are only chicken-based.
  • FFRs vs. operation time
Restaurant operation time is also a crucial restaurant selection criterion, especially for early birds and night owls. According to the results in Figure 6, it can be concluded that FFR C and FFR A appear at the top of the list, since these restaurants operate 24 h. FFR C (0.314) has a slightly better score than FFR A (0.285), possibly because the restaurant offers breakfast items as early as 4 am. Meanwhile, it is logical to point out that FFR B and FFR D have similar low scores (i.e., 0.201 and 0.200, respectively), as they only operate 12 h per day.
  • FFRs vs. menu design
A proper menu design helps customers to decide on the food that meets their desire. In terms of menu design, FFR C recorded the highest relative score, which is 0.274 (refer to Figure 6). This is because all of its menu items are well-displayed on an electronic screen above the counters, thus enabling customers to easily make their choice. Although FFR A has a similar approach of displaying its menu, its score (0.253) is relatively lower than FFR C, probably because the menu display on the screen changes too quickly (i.e., every few seconds). Therefore, customers may not be able to read over the complete information of each menu item before making an order.
On the other hand, as expected, FFR B and FFR D are at the third and fourth position, respectively, mainly because they still adhere to the conventional way of displaying their menus. The menus are only available in traditional booklet form. Their menu designs or displays are not as attractive or informative as the former two restaurants.
  • FFRs vs. employees’ appearance
With respect to this aspect, the results in Figure 6 indicate that all the FFRs under investigation have similar performance, except for FFR C, which has a relatively higher score, i.e., 0.267. Unlike the other three restaurants, the management of FFR C pays better attention to ensuring that their employees, especially the front-line employees, keep themselves presentable by wearing neat and clean uniforms.
  • FFRs vs. physical cleanliness
It is generally known that restaurant image and cleanliness correlate to one another. Restaurants typically do not compromise any cleanliness-related issue, as they are aware of its importance. When a restaurant is clean, customers feel more comfortable eating there. Otherwise, they avoid eating at the restaurant, worrying about risking themselves with unwanted illnesses. On this note, the seriousness of the FFRs under evaluation in maintaining cleanliness is evident through the comparable scores obtained, except for FFR A, which has a slightly lower score, i.e., 0.218. Further observation on FFR A reveals that the restaurant needs to improve its usual practice of disposing leftover food.
  • FFRs vs. parking
The availability of parking spaces determines a person’s dining spot. Since FFR C is located at Labuan Airport which comes with many parking spaces, it achieved the highest score (0.289) with respect to this sub-attribute (refer to Figure 6). The second highest score was obtained by FFR B (0.271), since it is located in a large shopping premise that comes with spacious indoor parking lots. FFR A and FFR D are located in the middle of the town; thus, it is troublesome for the customer to find empty parking lots around these restaurants, especially during office or lunch hours. Hence, they fall to the third and fourth ranking, with a score of 0.244 and 0.216, respectively.
  • FFRs vs. internal ambiance
In the context of internal ambiance, based on Figure 6, it is evident that FFR B has the highest relative score (0.259), followed by FFR C (0.259), FFR D (0.247), and FFR A (0.227). During the research period, we realized that FFR A’s interior looked shabby and dull; hence, the lowest score. It is also logical to see FFR B having the highest score, since the interior of the restaurant was recently renovated. Generally, the interior furnishings and decor tend to be worn out over time. Therefore, a makeover from time to time plays a key role in maintaining a pleasurable internal ambiance for customers.
  • FFRs vs. overall safety
Figure 6 reports the relative scores of the FFRs in terms of safety. As expected, FFR C earned the highest relative score (i.e., 0.262), mainly because it is located at the Labuan Airport, where the availability of safety features and security personnel are essential. On the other hand, FFR A obtained the lowest relative score (i.e., 0.237), since the outer surrounding of FFR A tends to be very dark and may trigger an insecure feeling to customers, thus reducing their chances to dine at the restaurant, especially after midnight.
  • FFRs vs. exterior
The external appearance may potentially influence a customer’s perception of a restaurant, even before they dine at the restaurant. Figure 6 shows that FFR B attains the highest relative score, since the management has recently completed renovating the entire design of the restaurant. The fresh and attractive external appearance of the restaurant has helped FFR B to gain the highest score. Meanwhile, FFR D and FFR A have recorded the lowest two scores, 0.235 and 0.233, respectively, since customers believe that the outdoor appearance of these two restaurants is not so welcoming or impressive.

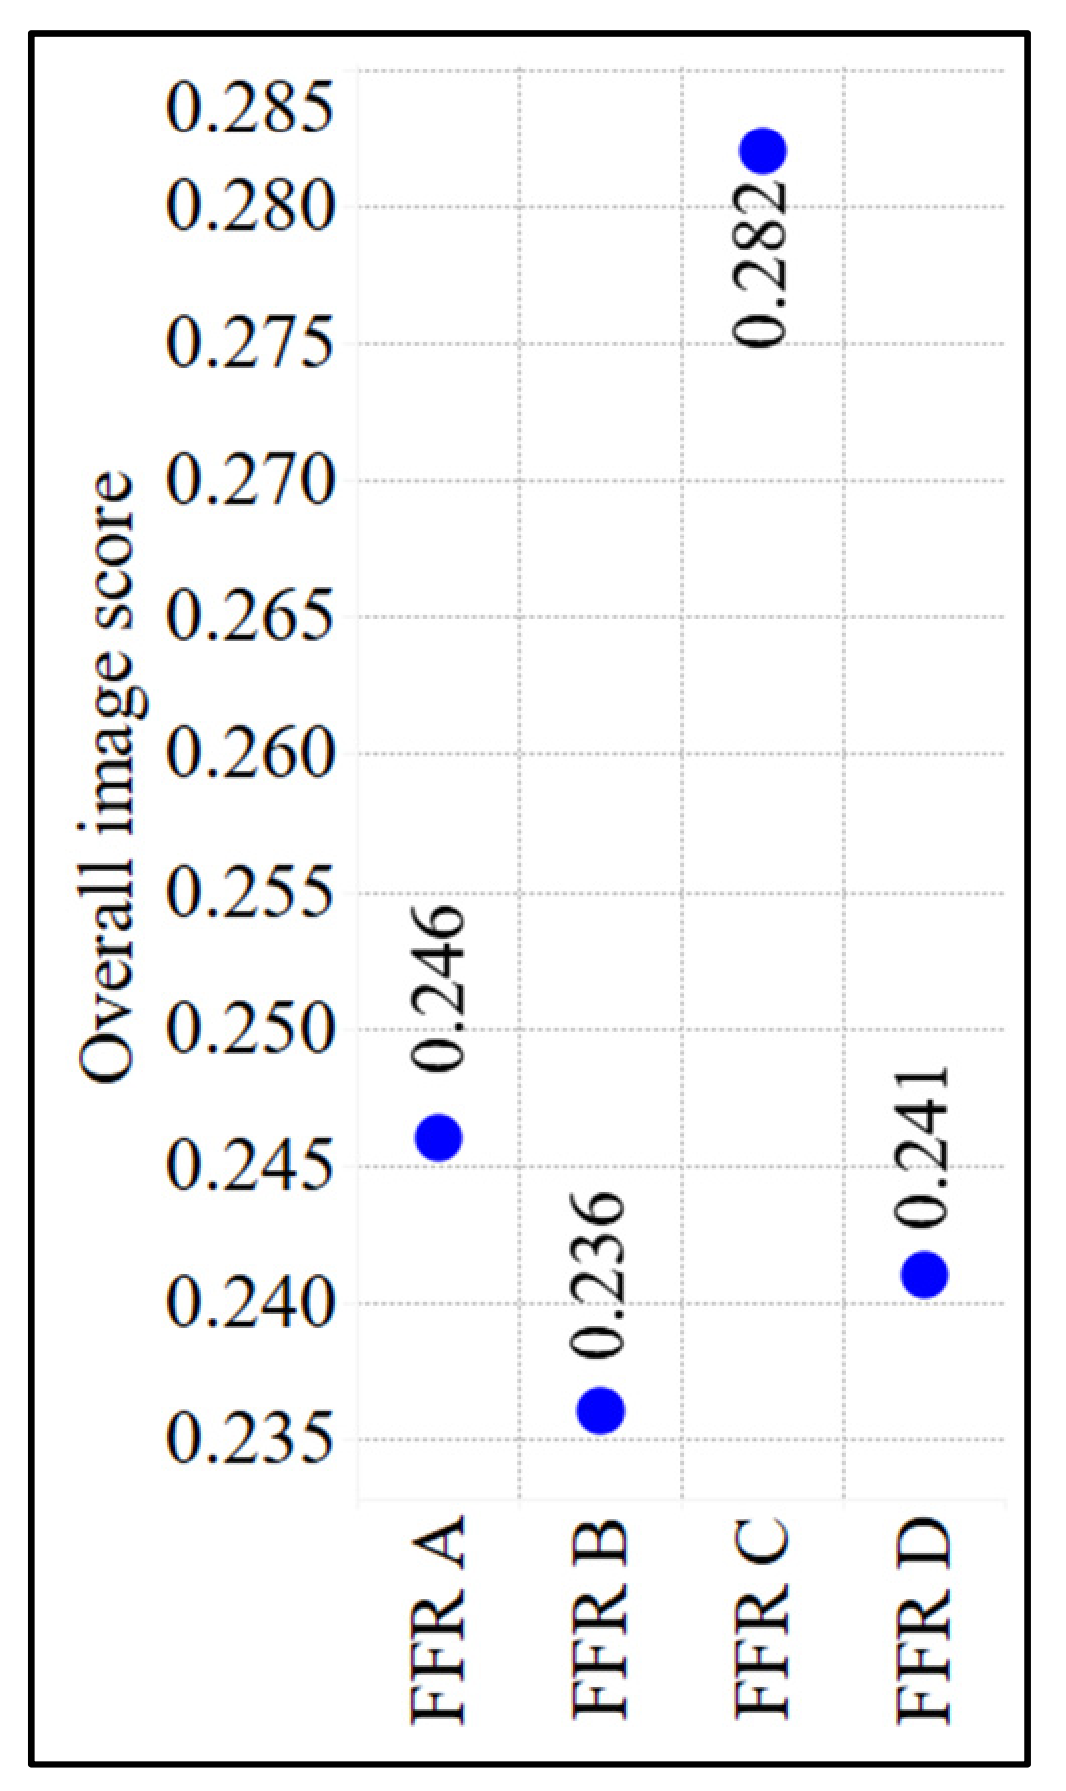
3.3.3. Overall Image Scores and Ranking of FFRs

Figure 7 reports the final aggregated image score of each FFR under investigation. Based on the results, it can be concluded that FFR C has the best overall image from the customers’ perspective, with an aggregated score of 0.282. Meanwhile, the overall image score earned by FFR A, FFR D, and FFR B is 0.246, 0.241, and 0.236, respectively, and these scores certainly appear to be very close to each other. This indicates that there is no major difference in the customers’ perception of these three restaurants. However, it can be claimed that FFR C has successfully created its uniqueness as it tops the list with a distinct relative score. FFR C excels way better than the other three FFRs because, comparatively, it has the best performance to the six most influential sub-attributes, namely hospitality, employees’ knowledge, employees’ problem-solving skills, cleanliness, service response time, and food taste.

4. Discussion

4.1. Discussion on the Dominant and Non-Dominant Sub-Attributes

The median global weight of the sub-attributes is 0.051. In total, there are six sub-attributes with the global weight exceeding the median value. To simplify, they can be labelled as the six most dominant elements of the overall FFR image (refer to the values in blues in Figure 5 for the rank of the sub-attributes). With a global weight of 0.118, hospitality is identified as the most important sub-attribute with respect to the overall image of FFRs. In line with this result, plenty of studies related to food service industries have emphasized employees’ attitude and friendliness as salient factors that influence customers’ assessment of their dining experience [118,119]. Komaki et al. [120] claimed that the FFR staff, especially those who are working in the front line, should amicably interact with the customers. They believe that friendliness can be reflected by two distinct behaviors: smiling and talking.
Meanwhile, the employees’ problem-solving skill, with a global weight of 0.116, is identified as the second most influential sub-attribute of FFR image. Indeed, it is believed that the employees’ problem-solving skills could affect the service quality [121], and subsequently the image of an FFR. In fact, Wu and Mohi [122] point out problem-solving skills as one imperative service component of FFR. They considered problem-solving skills as the employees’ ability to adequately respond to the problems faced by the customers or complaints made by them.
On the other hand, employees’ knowledge is reported as the third major sub-attribute of FRR image. It has a relative global weight of 0.101. Namin [123] remarked that FFRs must provide their employees with proper training so that they can communicate effectively with the customers and offer the details they ask for. Employees should ensure the information such as menus, ingredients, beverages, available payment methods, discounts, and deals are at their fingertips. Namin [123] also mentioned that knowledgeable staff might help increase the reliability of an FFR.
The fourth crucial sub-attribute is the taste of food. It has 0.060 weightage towards the overall image of FFRs. The importance of this sub-attribute has also been reported in several related studies. For instance, Stewart and Tinsley [124] claimed that the consumption frequency of a particular food, especially among working young adults, is determined by its taste. Similarly, Glanz et al. [125] discovered that Americans reconsider the taste of the food before purchasing and consuming them. In short, it is generally accepted that the taste of the food can largely influence people’s perception of an FFR; thus, it affects the consumers’ decision to repurchase at the FFRs. More significantly, in a study involving Boroujerd City’s restaurants, Koshki et al. [126] have empirically proven that the quality (i.e., taste) of food positively affects the mental image of a restaurant.
With a global weight of 0.052, physical cleanliness is identified as the fifth weighty sub-attribute in the overall system. Interestingly, parallel to the findings of this research, Pettijohn et al. [127] identified cleanliness as one attribute of FFR, which is far more significant than variety of food. In addition to this, Dhurup et al. [48] classified physical cleanliness as a key image attribute that has a strong predictive relationship with customer satisfaction.
The sixth most influential sub-attribute in the system is the service response time. The computed global weight of the sub-attribute is 0.052. It is not surprising to witness service response time as one of the top six image sub-attributes. Moreover, FFRs are usually linked to their quick or express services, which is why customers prefer to dine at FFRs [52,128]. It is thus very crucial for the hospitality industries, including FFRs, to maintain an adequate service response time, probably by redesigning their food ordering and delivery operations [129].
It is somewhat unexpected to find out employees’ appearance and exterior of the FFRs as the two least important sub-attributes; this is because there are quite a number of studies which have accentuated the importance of these sub-attributes in influencing the customers’ perception over restaurants, e.g., [130,131,132]. At the same time, there are also works that have yielded results similar to this research. For instance, a survey conducted by Yüksel and Yüksel [133] reported employees’ appearance as the least considered restaurant attribute by the tourist in Turkey as compared to other employee-related attributes. Meanwhile, Marinkovic et al. [113] discovered the exterior as one of the least important aspects that does not deliver much impact on the image of ethnic restaurants in Serbia.

4.2. Discussion on Possible Strategies for Improving FFR Image

Collectively, around 51% (0.118 + 0.116 + 0.101 + 0.060 + 0.059 + 0.052 = 0.506 ~ 51%) of a FFR’s overall image is characterized by the six most dominant sub-attributes. On a logical basis, FFRs should allocate greater attention to enhancing their performance with respect to these six sub-attributes if they wish to improve their overall image significantly from the public’s perspective. Table 6 summarizes some of the possible strategies that could be considered by the involved FFRs for real implementation towards improving their performance with respect to the six dominant sub-attributes. Some of these strategies were derived based on the suggestions made in past literature.
The results also offer essential support and credence for the concept of 3Ps (i.e., people, process, and physical evidence). Note that the six dominant sub-attributes reported in the present study are made up of three “people” attributes, two “process” attributes, and one “physical evidence” attribute. It appears that consumers tend to place high expectations on engagement and human factors in the FFRs. From the strategic perspective, providing continuous training would be necessary to educate and enable the staff to deliver high-quality service in the FFRs. Similarly, considering that the FFRs used in the present study were also based on the franchise, operators need to consistently maintain a standard, efficient service process. Strategically, consumers would expect all the FFRs to project similar service process images.

5. Limitations and Recommendations

This research has two limitations that future researchers can possibly address. The first limitation concerns the interrelationships among the main and sub-attributes of the FFR image. With the help of C-AHP, this research has successfully measured the weight of the FFR image attributes; however, the research did not take any additional effort to discover the existing interrelationships between the image attributes. Indeed, knowing more about these interrelationships could lead to the formulation of more specific, workable improvement strategies. Therefore, future research may consider using any appropriate interaction modelling methods such as DEMATEL to uncover and better understand the actual interrelationships of these image attributes.
The second limitation relates to the generalization of the research findings. Since the geographical scope of the research is narrowed to Labuan Island, the data were merely collected based on a sample of customers residing in the island. As such, the findings of this research are only pertinent to the FFRs in the island. It is not rational to generalize the findings, especially the weights of image attributes, to all FFRs across the nation. Moreover, people’s preferences may change significantly from one region (e.g., state and district) to another due to distinct demographic and cultural differences in the population. Thus, future research should collect data from a larger and more representative sample of respondents, so that the results could benefit any FFRs operating across the nation.

Author Contributions

Conceptualization, A.R.K., R.H. and R.Y.S.L.; methodology, A.R.K. and R.Y.S.L.; software, R.Y.S.L.; validation, A.R.K. and R.H.; formal analysis, A.R.K. and R.H.; investigation, R.Y.S.L.; resources, A.R.K.; data curation, R.Y.S.L.; writing—original draft preparation, A.R.K. and R.Y.S.L.; writing—review and editing, R.H., G.H.T. and B.R.; visualization, A.R.K.; supervision, R.H.; funding acquisition, A.R.K. All authors have read and agreed to the published version of the manuscript.

Funding

This research was funded by Ministry of Higher Education (Malaysia), RACER/1/2019/STG06/UMS//1.

Institutional Review Board Statement

Not applicable.

Informed Consent Statement

Not applicable.

Data Availability Statement

Figure 1: The frequency of Malaysians consuming food at FFRs in any given week, Figure 5: Tree map showing the weights of main and sub-attributes, Figure 6: Performance scores of FFRs, Figure 7: Overall image score of each FFR. Available online at https://public.tableau.com/views/FFRImage/Figure1?:language=en-US&:display_count=n&:origin=viz_share_link (accessed on 4 February 2022).

Acknowledgments

Thanks to Engku Muhamamd Nazri for reviewing and providing important comments to improve the paper further.

Conflicts of Interest

The authors declare no conflict of interest.

References

  1. Habib, F.Q.; Dardak, R.A.; Zakaria, S. Consumers’ preference and consumption towards fast food: Evidences from Malaysia. Bus. Manag. Q. Rev. (BMQR) 2011, 2, 14–27. [Google Scholar]
  2. Nezakati, H.; Kuan, Y.L.; Asgari, O. Factors influencing customer loyalty towards fast food restaurants. In Proceedings of the International Conference on Sociality and Economics Development, Kuala Lumpur, Malaysia, 5–6 June 2011; Volume 10, pp. 12–16. [Google Scholar]
  3. Shaharudin, M.R.; Mansor, S.W.; Elias, S.J. Food quality attributes among Malaysia’s fast food customer. Int. Bus. Manag. 2011, 2, 198–208. [Google Scholar]
  4. Xiao, A.; Yang, S.; Iqbal, Q. Factors affecting purchase intentions in generation Y: An empirical evidence from fast food industry in Malaysia. Adm. Sci. 2018, 9, 4. [Google Scholar] [CrossRef] [Green Version]
  5. Singam, G.D.; Karunagaran, P.; Pandiyan, T.S.D.; Subramanian, T.; Govindan, S. Creative advertising impact on customer acceptance of fast food restaurant. Acad. Res. Int. 2014, 5, 308. [Google Scholar]
  6. Freeman, A. Fast food: Oppression through poor nutrition. Calif. L. Rev. 2007, 95, 2221. [Google Scholar]
  7. Lim, Y.S.; Tan, C.H.; Tan, N.L. The trend of healthy fast food: How Malaysian’generation Y makes the purchase decision. Aust. J. Basic Appl. Sci. 2013, 7, 631–638. [Google Scholar]
  8. Rashid, I.; Abdullah, M.F.S.; Yusuf, B.; Shaari, M.S. Impact of service and food quality on customer satisfaction among generation Y for the fast food restaurant in Malaysia. Int. J. Inf. Bus. Manag. 2016, 8, 51–67. [Google Scholar] [CrossRef]
  9. Quoquab, F.; Sadom, N.Z.M.; Mohammad, J. Driving customer loyalty in the Malaysian fast food industry: The role of halal logo, trust and perceived reputation. J. Islamic Mark. 2019, 11, 1367–1387. [Google Scholar] [CrossRef]
  10. Naveed, R.T.; Ali, M. Factors of Customer Relationship Management Affecting on Customers Satisfaction at Fast Food Industry in Malaysia. Int. J. Res. 2016, 3, 32–41. [Google Scholar]
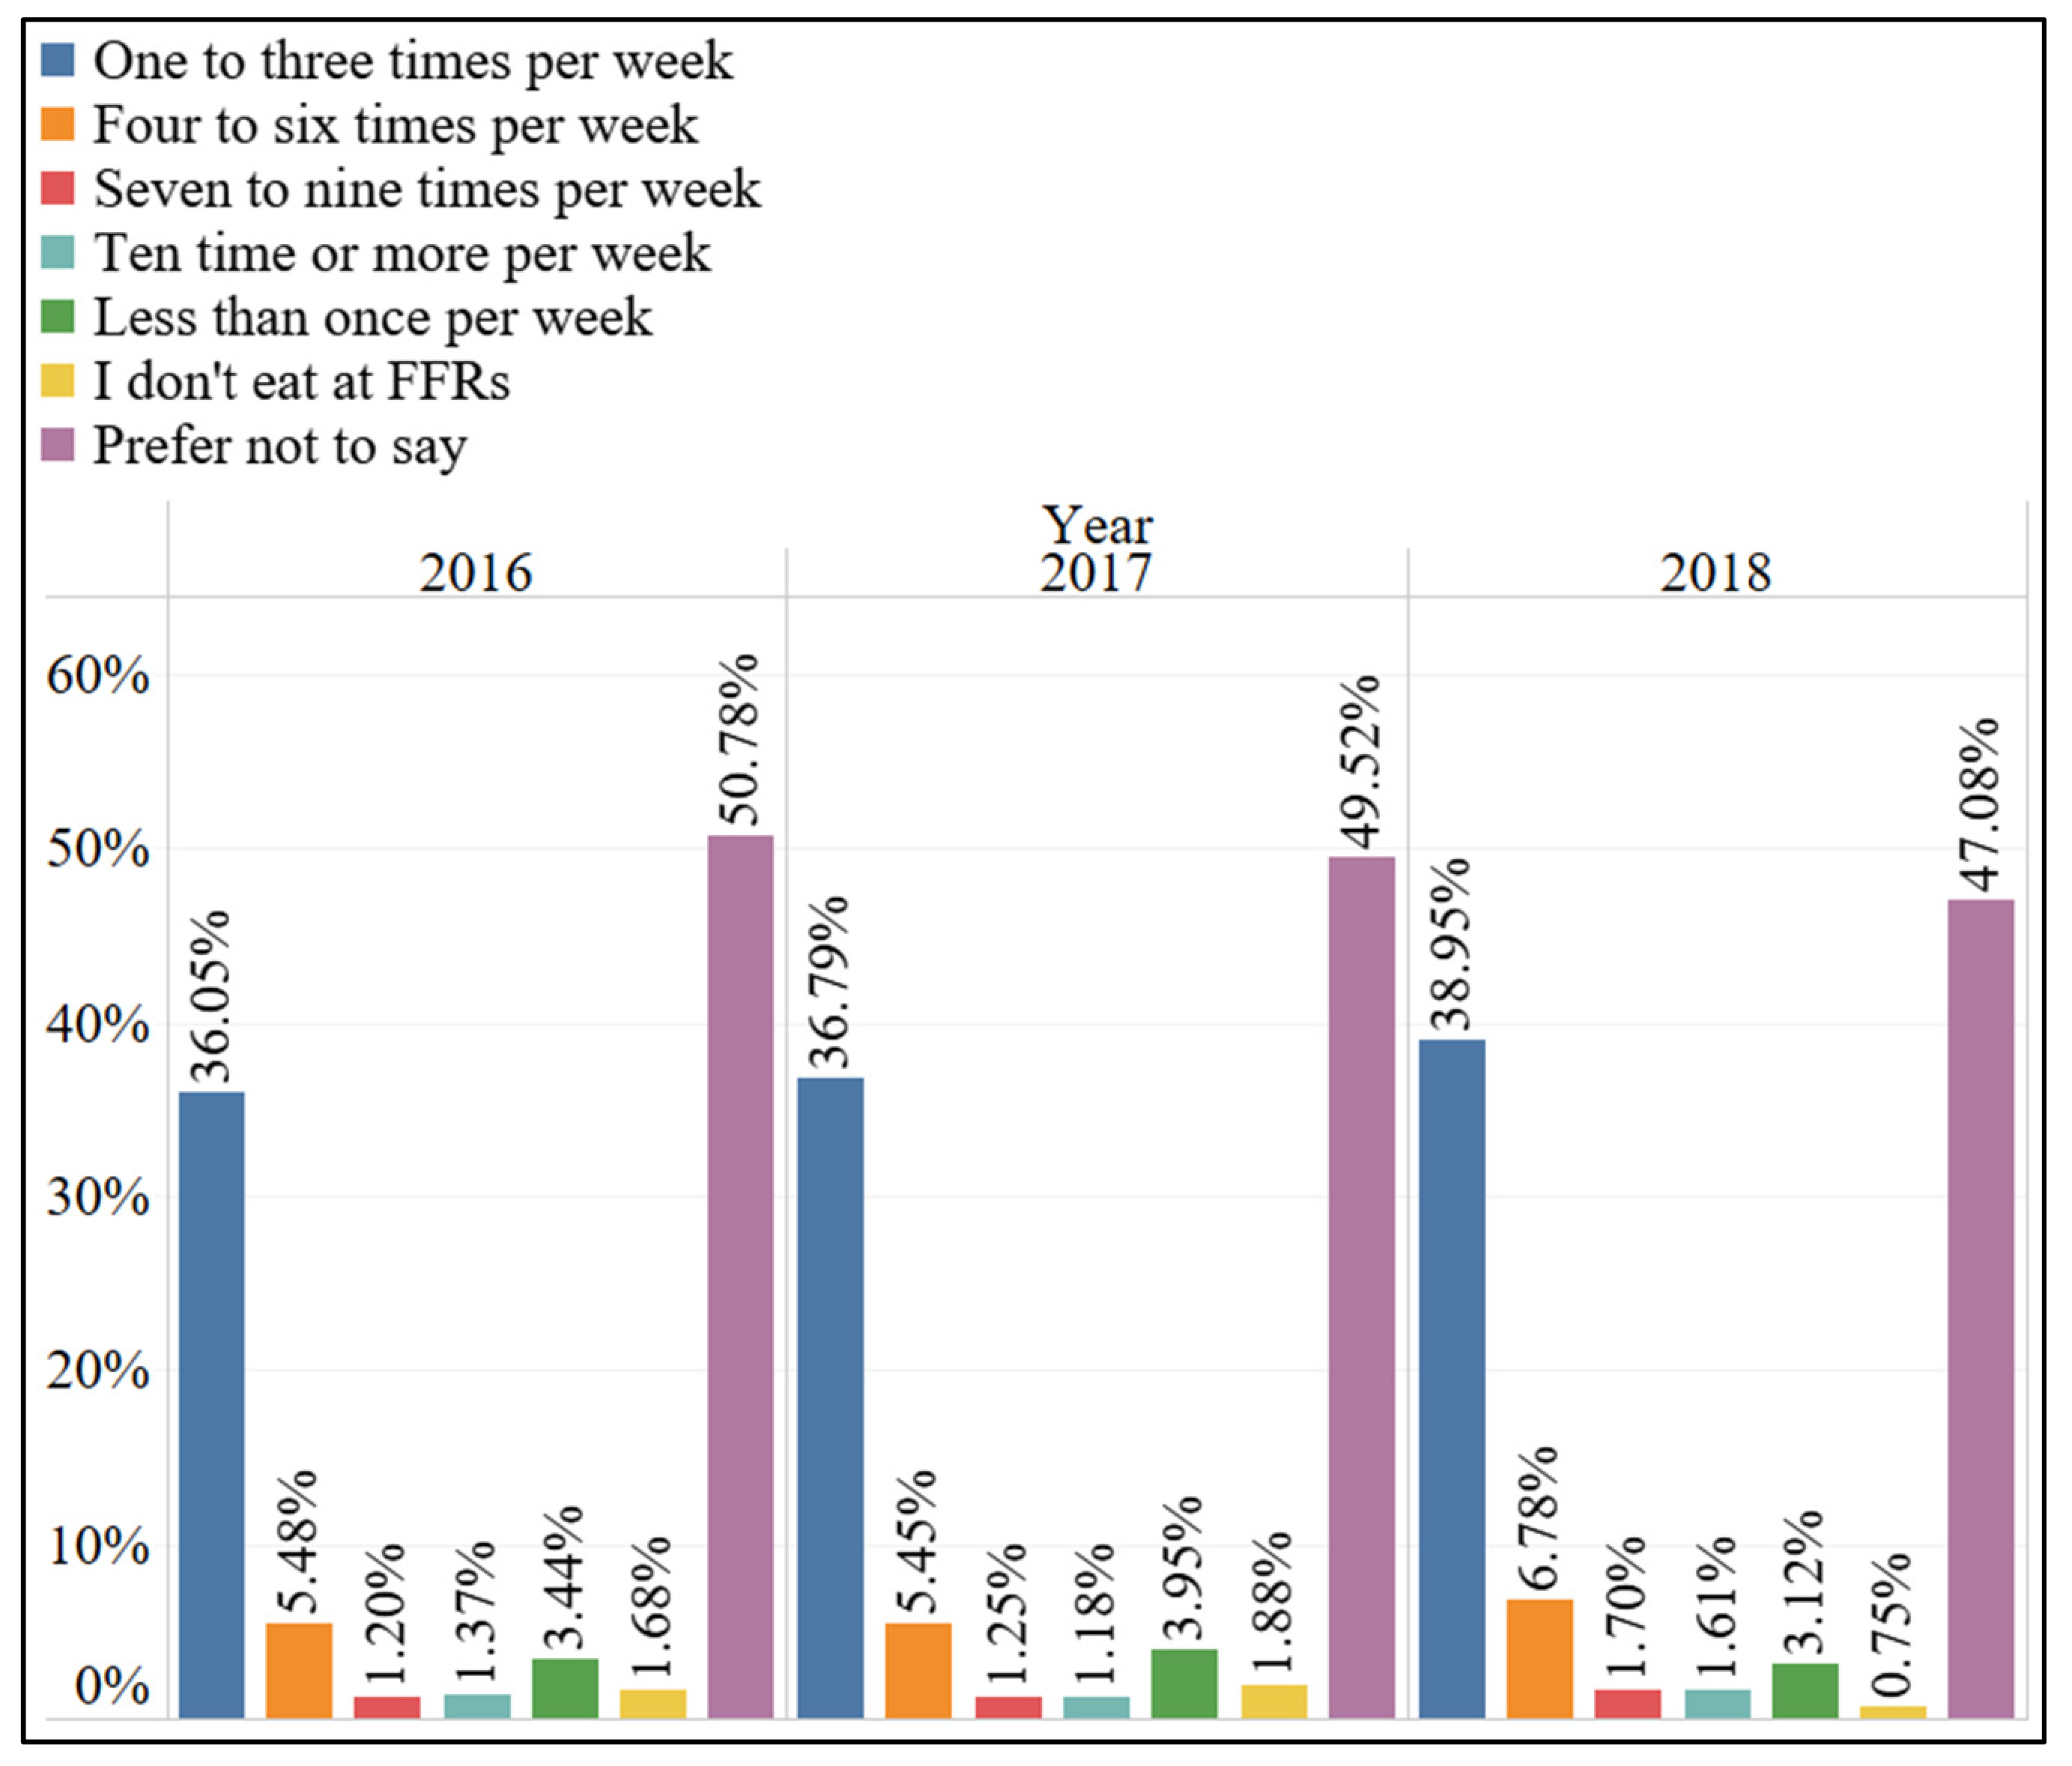
  11. Statista Research Department. Malaysia—Average Fast Food Consumption Per Week in 2016–2018. 2018. Available online: https://www.statista.com/statistics/561279/malaysia-average-fast-food-consumption-per-week/ (accessed on 20 November 2021).
  12. de Freitas, R.S.G.; Stedefeldt, E. COVID-19 pandemic underlines the need to build resilience in commercial restaurants’ food safety. Food Res. Int. 2020, 136, 109472. [Google Scholar] [CrossRef]
  13. Hakim, M.P.; Zanetta, L.D.; da Cunha, D.T. Should I stay, or should I go? Consumers’ perceived risk and intention to visit restaurants during the COVID-19 pandemic in Brazil. Food Res. Int. 2021, 141, 110152. [Google Scholar] [CrossRef]
  14. Ling, K.C.; Mun, Y.W.; Ling, H.M. Exploring factors that influence customer loyalty among Generation Y for the fast food industry in Malaysia. Afr. J. Bus. Manag. 2011, 5, 4813–4823. [Google Scholar]
  15. Kim, W.G.; Li, J.J.; Brymer, R.A. The impact of social media reviews on restaurant performance: The moderating role of excellence certificate. Int. J. Hosp. Manag. 2016, 55, 41–51. [Google Scholar] [CrossRef]
  16. Department of Statistics Malaysia. Demographic Statistics Second Quarter 2019 Malaysia. 2019. Available online: https://www.dosm.gov.my/v1/index.php?r=column/cthemeByCat&cat=430&bul_id=VTJDdStOakJJd2EwcEVVTm4yRDZSQT09&menu_id=L0pheU43NWJwRWVSZklWdzQ4TlhUUT09 (accessed on 20 November 2021).
  17. Han, H.; Back, K.-J.; Barrett, B. Influencing factors on restaurant customers’ revisit intention: The roles of emotions and switching barriers. Int. J. Hosp. Manag. 2009, 28, 563–572. [Google Scholar] [CrossRef]
  18. Gray, E.R.; Balmer, J.M.T. Managing corporate image and corporate reputation. Long Range Plan. 1998, 31, 695–702. [Google Scholar] [CrossRef]
  19. Saeidi, S.P.; Sofian, S.; Saeidi, P.; Saeidi, S.P.; Saaeidi, S.A. How does corporate social responsibility contribute to firm financial performance? The mediating role of competitive advantage, reputation, and customer satisfaction. J. Bus. Res. 2015, 68, 341–350. [Google Scholar] [CrossRef]
  20. LeBlanc, G.; Nguyen, N. Cues used by customers evaluating corporate image in service firms: An empirical study in financial institutions. Int. J. Serv. Ind. Manag. 1996, 7, 44–56. [Google Scholar] [CrossRef]
  21. Keller, K.L. Conceptualizing, measuring, and managing customer-based brand equity. J. Mark. 1993, 57, 1–22. [Google Scholar] [CrossRef]
  22. Andreassen, T.W.; Lindestad, B. Customer loyalty and complex services: The impact of corporate image on quality, customer satisfaction and loyalty for customers with varying degrees of service expertise. Int. J. Serv. Ind. Manag. 1998, 9, 7–23. [Google Scholar] [CrossRef] [Green Version]
  23. van Rekom, J. Deriving an operational measure of corporate identity. Eur. J. Mark. 1997, 31, 410–422. [Google Scholar] [CrossRef]
  24. Han, H.; Ryu, K. Moderating role of personal characteristics in forming restaurant customers’ behavioral intentions: An upscale restaurant setting. J. Hosp. Leis. Mark. 2007, 15, 25–54. [Google Scholar] [CrossRef]
  25. Kim, Y.-S.; Baek, S.-H. Effect of food neophobia on restaurant image, customer satisfaction, and loyalty in ethnic restaurant. Korean J. Food Nutr. 2015, 28, 1082–1089. [Google Scholar] [CrossRef]
  26. O’Leary, S.; Deegan, J. Ireland’s image as a tourism destination in France: Attribute importance and performance. J. Travel Res. 2005, 43, 247–256. [Google Scholar] [CrossRef]
  27. Otengei, S.O.; Changha, G.; Kasekende, F.; Ntayi, J.M. Understanding key determinants of brand loyalty in full service restaurants in Uganda. Adv. Hosp. Tour. Res. (AHTR) 2014, 2, 79–107. [Google Scholar]
  28. Wakefield, K.L.; Blodgett, J.G. The effect of the servicescape on customers’ behavioral intentions in leisure service settings. J. Serv. Mark. 1996, 10, 45–61. [Google Scholar] [CrossRef]
  29. Han, H.; Jeong, C. Multi-dimensions of patrons’ emotional experiences in upscale restaurants and their role in loyalty formation: Emotion scale improvement. Int. J. Hosp. Manag. 2013, 32, 59–70. [Google Scholar] [CrossRef]
  30. Lin, L.; Lu, C. The influence of corporate image, relationship marketing, and trust on purchase intention: The moderating effects of word-of-mouth. Tour. Rev. 2010, 65, 16–34. [Google Scholar] [CrossRef]
  31. Lai, F.; Griffin, M.; Babin, B.J. How quality, value, image, and satisfaction create loyalty at a Chinese telecom. J. Bus. Res. 2009, 62, 980–986. [Google Scholar] [CrossRef]
  32. Kandampully, J.; Suhartanto, D. Customer loyalty in the hotel industry: The role of customer satisfaction and image. Int. J. Contemp. Hosp. Manag. 2000, 12, 346–351. [Google Scholar] [CrossRef]
  33. Patterson, P.G.; Spreng, R.A. Modelling the relationship between perceived value, satisfaction and repurchase intentions in a business-to-business, services context: An empirical examination. Int. J. Serv. Ind. Manag. 1997, 8, 414–434. [Google Scholar] [CrossRef]
  34. Yang, K.-C.; Hsieh, T.-C.; Li, H.; Yang, C. Assessing how service quality, airline image and customer value affect the intentions of passengers regarding low cost carriers. J. Air Transp. Manag. 2012, 20, 52–53. [Google Scholar] [CrossRef]
  35. Dennis, C.; King, T.; Martenson, R. Corporate brand image, satisfaction and store loyalty. Int. J. Retail. Distrib. Manag. 2007, 35, 544–555. [Google Scholar] [CrossRef]
  36. Ryu, K.; Lee, H.; Kim, W.G. The influence of the quality of the physical environment, food, and service on restaurant image, customer perceived value, customer satisfaction, and behavioral intentions. Int. J. Contemp. Hosp. Manag. 2012, 24, 200–223. [Google Scholar] [CrossRef]
  37. Yelkur, R. Customer satisfaction and the services marketing mix. J. Prof. Serv. Mark. 2000, 21, 105–115. [Google Scholar]
  38. Ryu, K.; Han, H.; Kim, T.-H. The relationships among overall quick-casual restaurant image, perceived value, customer satisfaction, and behavioral intentions. Int. J. Hosp. Manag. 2008, 27, 459–469. [Google Scholar] [CrossRef]
  39. Al-Marzouqi, A.; Yahia, I.B. Impact of COVID-19 pandemic on food and beverage service performance and behavioral intents: Importance of sanitary measures. J. Foodserv. Bus. Res. 2022, 25, 209–232. [Google Scholar] [CrossRef]
  40. Hasangholipour, T.; Mostaghimi, M.R.; Ahranjani, N.M. Investigating the effect of marketing mix and corporate image on brand equity of Talia and Rightel companies. Int. Bus. Manag. 2014, 9, 41–52. [Google Scholar]
  41. Rajh, E.; Došen, Đ.O. The effects of marketing mix elements on service brand equity. Econ. Res. Ekon. Istraživanja 2009, 22, 69–83. [Google Scholar] [CrossRef] [Green Version]
  42. Taboli, H.; Pariz, N.; Vafada, M. Assessing the impact of marketing mix on brand equity. Int. J. Sci. Study 2017, 5, 612–621. [Google Scholar]
  43. McCarthy, J. The concept of the marketing mix. J. Advert. Res. 1964, 4, 2–7. [Google Scholar]
  44. Boom, B.H.; Bitner, M.J. Marketing strategies and organisation structures for service firms. In Marketing of Services; Donnelly, J.H., George, W.R., Eds.; American Marketing Association: Chicago, IL, USA, 1981; pp. 47–51. [Google Scholar]
  45. Sarker, M.O.F. Telecom Industry Brand Image and the Extended Service Marketing Ps: A Study on Private University Students of Rajshahi. Am. J. Trade Policy 2019, 6, 95–100. [Google Scholar] [CrossRef]
  46. Akroush, M.; Shible, M.; Khawaldeh, F. The effect of services marketing mix elements on customers satisfaction in the comprehensive motor insurance: An empirical investigation of customers perspectives in Jordan. J. Financ. Commer. Stud. /Manag. Sci. Cairo Univ. 2005, 32, 439–472. [Google Scholar]
  47. Das, D. An empirical study to build a theoretical framework that can determine customer satisfaction in terms of people, process & physical evidence. In Service Marketing Practises in India: Changing Paradigms; Saibaba, S., Santikary, A., Mohanty, P.K., Eds.; SSIM: Hyderabad, India, 2012; pp. 135–143. [Google Scholar]
  48. Dhurup, M.; Mafini, C.; Mathaba, R.L. Store image factors influencing store choice among sportswear consumers: Baseline findings from South Africa. Mediterr. J. Soc. Sci. 2013, 4, 359. [Google Scholar] [CrossRef] [Green Version]
  49. Herstein, R.; Gilboa, S.; Gamliel, E. Private and national brand consumers’ images of fashion stores. J. Prod. Brand Manag. 2013, 22, 331–341. [Google Scholar] [CrossRef]
  50. Naderian, A. Study of store image attributes effect on customer satisfaction among Malaysian customers. Int. J. Mark. Bus. Commun. 2012, 1, 1. [Google Scholar]
  51. Zardari, N.H.; Ahmed, K.; Shirazi, S.M.; Yusop, Z.B. Weighting Methods and Their Effects on Multi-Criteria Decision Making Model Outcomes in Water Resources Management; Springer: Berlin/Heidelberg, Germany, 2015. [Google Scholar]
  52. Min, H.; Min, H. Benchmarking the service quality of fast-food restaurant franchises in the USA: A longitudinal study. Benchmarking Int. J. 2011, 18, 282–300. [Google Scholar] [CrossRef]
  53. Xue, D.; Zhao, Q.; Guo, X. TOPSIS Method for Evaluation Customer Service Satisfaction to Fast Food Industry. In Proceedings of the 2008 IEEE International Conference on Service Operations and Logistics, and Informatics, Beijing, China, 12–15 October 2008; Volume 1, pp. 920–925. [Google Scholar]
  54. Siew, L.W.; Wai, C.J.; Hoe, L.W. An empirical study on the selection of fast food restaurants among the undergraduates with AHP model. Am. J. Inf. Sci. Comput. Eng. 2016, 2, 15–21. [Google Scholar]
  55. Yildiz, S.; Yildiz, E. Service quality evaluation of restaurants using the AHP and TOPSIS method. J. Soc. Adm. Sci. 2015, 2, 53–61. [Google Scholar]
  56. Nazri, E.M.; Balhuwaisl, M.; Kasim, M.M. A pre-evaluation step towards a guaranteed consistent AHP-based pairwise comparison. J. Adv. Res. Soc. Behav. Sci. 2016, 4, 73–80. [Google Scholar]
  57. Artho, C.V. Analytical hierarchy process of consumer preference on japanese food restaurants in Manado Town Square (case studies on ichiban sushi, marugame udon and torico). J. Berk. Ilm. Efisiensi 2017, 17, 1–8. [Google Scholar]
  58. Osvaldo, D.P.; Pangemanan, S.S. Analytical hierarchy process (ahp) approach on consumer preference in selecting restaurant (study: Cabal dining, jw restaurant and jungle beer). J. EMBA J. Ris. Ekon. Manaj. Bisnis Dan Akunt. 2016, 4, 568–577. [Google Scholar] [CrossRef]
  59. Wibowo, S.W.; Tielung, M. Analytical Hierarchy Process (AHP) approach on consumer preference in franchise fast food restaurant selection in Manado City (Study At: Mcdonald’s, Kfc, and A&W). J. EMBA: J. Ris. Ekon. Manaj. Bisnis Dan Akunt. 2016, 4, 22–28. [Google Scholar] [CrossRef]
  60. Ivy, J. A new higher education marketing mix: The 7Ps for MBA marketing. Int. J. Educ. Manag. 2008, 22, 288–299. [Google Scholar] [CrossRef]
  61. Garoufallou, E.; Siatri, R.; Zafeiriou, G.; Balampanidou, E. The use of marketing concepts in library services: A literature review. Libr. Rev. 2013, 62, 312–334. [Google Scholar] [CrossRef]
  62. Hartman, A. Reaching consensus using the Delphi technique. Educ. Leadersh. 1981, 38, 495–497. [Google Scholar]
  63. Hill, K.Q.; Fowles, J. The methodological worth of the Delphi forecasting technique. Technol. Forecast. Soc. Chang. 1975, 7, 179–192. [Google Scholar] [CrossRef]
  64. Sung, W.C. Application of Delphi method, a qualitative and quantitative analysis, to the healthcare management. J. Healthc. Manag. 2001, 2, 11–19. [Google Scholar]
  65. Hirschhorn, F. Reflections on the application of the Delphi method: Lessons from a case in public transport research. Int. J. Soc. Res. Methodol. 2019, 22, 309–322. [Google Scholar] [CrossRef]
  66. Filyushkina, A.; Strange, N.; Löf, M.; Ezebilo, E.E.; Boman, M. Applying the Delphi method to assess impacts of forest management on biodiversity and habitat preservation. For. Ecol. Manag. 2018, 409, 179–189. [Google Scholar] [CrossRef]
  67. Ho, S.; Pattyn, V.; Broucker, C.J. Needs assessment in land administration: The potential of the Nominal Group Technique. Land 2018, 7, 87. [Google Scholar] [CrossRef] [Green Version]
  68. Novakowski, N.; Wellar, B. Using the Delphi technique in normative planning research: Methodological design considerations. Environ. Plan. A 2008, 40, 1485–1500. [Google Scholar] [CrossRef]
  69. Murry, J.W., Jr.; Hammons, J.O. Delphi: A versatile methodology for conducting qualitative research. Rev. High. Educ. 1995, 18, 423–436. [Google Scholar] [CrossRef]
  70. Chen, C.-Y.; Tzeng, G.-H.; Huang, J.-J. Generalized DEMATEL technique with centrality measurements. Technol. Econ. Dev. Econ. 2018, 24, 600–614. [Google Scholar] [CrossRef]
  71. Custer, R.L.; Scarcella, J.A.; Stewart, B.R. The modified Delphi technique-A rotational modification. J. Vocat. Educ. Train. 1999, 15, 50–58. [Google Scholar] [CrossRef]
  72. Wang, Y.-M.; Xiong, L.-J.; Ma, Y.; Gao, X.-L.; Fu, W.-F. Construction of competency evaluation measures for operating room nurses. Chin. Nurs. Res. 2016, 3, 181–184. [Google Scholar] [CrossRef]
  73. Kluge, U.; Ringbeck, J.; Spinler, S. Door-to-door travel in 2035–A Delphi study. Technol. Forecast. Soc. Chang. 2020, 157, 120096. [Google Scholar] [CrossRef]
  74. Hong, Q.N.; Pluye, P.; Fàbregues, S.; Bartlett, G.; Boardman, F.; Cargo, M.; Dagenais, P.; Gagnon, M.-P.; Griffiths, F.; Nicolau, B.; et al. Improving the content validity of the mixed methods appraisal tool: A modified e-Delphi study. J. Clin. Epidemiol. 2019, 111, 49–59. [Google Scholar] [CrossRef] [Green Version]
  75. Estrela, M.; Roque, F.; Silva, T.M.; Zapata-Cachafeiro, M.; Figueiras, A.; Herdeiro, M.T. Validation of the eHealthResp online course for pharmacists and physicians: A Delphi method approach. Biomed. Pharmacother. 2021, 140, 111739. [Google Scholar] [CrossRef]
  76. Barry, M.M.; Battel-Kirk, B.; Dempsey, C. The CompHP core competencies framework for health promotion in Europe. Health Educ. Behav. 2012, 39, 648–662. [Google Scholar] [CrossRef]
  77. Shah, H.A.; Kalaian, S.A. Which is the best parametric statistical method for analyzing Delphi data? J. Mod. Appl. Stat. Methods 2009, 8, 20. [Google Scholar] [CrossRef]
  78. Lefever, S.; Dal, M.; Matthíasdóttir, Á. Online data collection in academic research: Advantages and limitations. Br. J. Educ. Technol. 2007, 38, 574–582. [Google Scholar] [CrossRef]
  79. Rice, S.; Winter, S.R.; Doherty, S.; Milner, M. Advantages and disadvantages of using internet-based survey methods in aviation-related research. J. Aviat. Technol. Eng. 2017, 7, 5. [Google Scholar] [CrossRef]
  80. Sekaran, U.; Bougie, R. Research Methods for Business: A Skill Building Approach; John Wiley & Sons: Hoboken, NJ, USA, 2016. [Google Scholar]
  81. Dias, A., Jr.; Ioannou, P.G. Company and project evaluation model for privately promoted infrastructure projects. J. Constr. Eng. Manag. 1996, 122, 71–82. [Google Scholar] [CrossRef]
  82. Doloi, H. Application of AHP in improving construction productivity from a management perspective. Constr. Manag. Econ. 2008, 26, 841–854. [Google Scholar] [CrossRef]
  83. Melillo, P.; Pecchia, L. What is the appropriate sample size to run analytic hierarchy process in a survey-based research. In Proceedings of the the International Symposium on the Analytic Hierarchy Process, London, UK, 4–7 August 2016; pp. 4–8. [Google Scholar]
  84. Abudayyeh, O.; Zidan, S.J.; Yehia, S.; Randolph, D. Hybrid prequalification-based, innovative contracting model using AHP. J. Manag. Eng. 2007, 23, 88–96. [Google Scholar] [CrossRef]
  85. Tavares, G.; Zsigraiová, Z.; Semiao, V. Multi-criteria GIS-based siting of an incineration plant for municipal solid waste. Waste Manag. 2011, 31, 1960–1972. [Google Scholar] [CrossRef]
  86. Saaty, T.L. The Analytic Hierarchy Process; McGraw-Hill: New York, NY, USA, 1980. [Google Scholar]
  87. Stevens, S.S. Mathematics, measurement, and psychophysics. In Handbook of Experimental Psychology; Stevens, S.S., Ed.; Wiley: Hoboken, NJ, USA, 1951; pp. 1–49. [Google Scholar]
  88. Lin, C.-C. Investigating Complimentary E-Marketing Strategy for Small-and Medium-Sized Enterprises at Growth Stage in Taiwan. Information 2021, 12, 380. [Google Scholar] [CrossRef]
  89. Ishizaka, A.; Labib, A. Analytic hierarchy process and expert choice: Benefits and limitations. Insight 2009, 22, 201–220. [Google Scholar] [CrossRef] [Green Version]
  90. Sulek, J.M.; Hensley, R.L. The relative importance of food, atmosphere, and fairness of wait: The case of a full-service restaurant. Cornell Hotel. Restaur. Adm. Q. 2004, 45, 235–247. [Google Scholar] [CrossRef]
  91. Jin, N.; Lee, S.; Huffman, L. Impact of restaurant experience on brand image and customer loyalty: Moderating role of dining motivation. J. Travel Tour. Mark. 2012, 29, 532–551. [Google Scholar] [CrossRef]
  92. Kara, A.; Kaynak, E.; Kucukemiroglu, O. Marketing strategies for fast-food restaurants: A customer view. Int. J. Contemp. Hosp. Manag. 1995, 7, 16–22. [Google Scholar] [CrossRef]
  93. Oyeniyi, O.J. Brand equity and firm performance: A study of fast-food restaurant brand equity in Nigeria. Inst. Manag. Stud. Res. 2009, 1, 1–16. [Google Scholar]
  94. Wong, G.K.M.; Yu, L. Consumers’ perception of store image of joint venture shopping centres: First-tier versus second-tier cities in China. J. Retail. Consum. Serv. 2003, 10, 61–70. [Google Scholar] [CrossRef]
  95. Qin, G.; Prybutok, V.R. Determinants of customer-perceived service quality in fast-food restaurants and their relationship to customer satisfaction and behavioral intentions. Qual. Manag. J. 2008, 15, 35–50. [Google Scholar] [CrossRef]
  96. Chen, H.-B.; Yeh, S.-S.; Huan, T.-C. Nostalgic emotion, experiential value, brand image, and consumption intentions of customers of nostalgic-themed restaurants. J. Bus. Res. 2014, 67, 354–360. [Google Scholar] [CrossRef]
  97. Qin, H.; Prybutok, V.R.; Zhao, Q. Perceived service quality in fast-food restaurants: Empirical evidence from China. Int. J. Qual. Reliab. Manag. 2010, 27, 424–437. [Google Scholar] [CrossRef]
  98. Vignali, C. McDonald’s:‘think global, act local’–the marketing mix. Br. Food J. 2001, 103, 97–111. [Google Scholar] [CrossRef]
  99. Miller, K.E.; Ginter, J.L. An investigation of situational variation in brand choice behavior and attitude. J. Mark. Res. 1979, 16, 111–123. [Google Scholar] [CrossRef]
  100. Yu, Y.S.; Luo, M.; Zhu, D.H. The effect of quality attributes on visiting consumers’ patronage intentions of green restaurants. Sustainability 2018, 10, 1187. [Google Scholar] [CrossRef] [Green Version]
  101. Fielding, J.E.; Aguirre, A.; Palaiologos, E. Effectiveness of altered incentives in a food safety inspection program. Prev. Med. 2001, 32, 239–244. [Google Scholar] [CrossRef]
  102. Gent, R.N.; Telford, D.R.; Syed, Q. An outbreak of campylobacter food poisoning at a university campus. Commun. Dis. Public Health 1999, 2, 39–42. [Google Scholar]
  103. Driskell, J.A.; Meckna, B.R.; Scales, N.E. Differences exist in the eating habits of university men and women at fast-food restaurants. Nutr. Res. 2006, 26, 524–530. [Google Scholar] [CrossRef]
  104. Law, A.K.Y.; Hui, Y.V.; Zhao, X. Modeling repurchase frequency and customer satisfaction for fast food outlets. Int. J. Qual. Reliab. Manag. 2004, 21, 545–563. [Google Scholar] [CrossRef]
  105. Familmaleki, M.; Aghighi, A.; Hamidi, K. Analyzing the influence of sales promotion on customer purchasing behavior. Int. J. Econ. Manag. Sci. 2015, 4, 1–6. [Google Scholar]
  106. Allon, G.; Federgruen, A.; Pierson, M. How much is a reduction of your customers’ wait worth? An empirical study of the fast-food drive-thru industry based on structural estimation methods. Manuf. Serv. Oper. Manag. 2011, 13, 489–507. [Google Scholar] [CrossRef] [Green Version]
  107. Bowen, J.T.; Morris, A.J. Menu design: Can menus sell. Int. J. Contemp. Hosp. Manag. 1995, 7, 4–9. [Google Scholar] [CrossRef]
  108. Garvey, M.; Dismore, A.G.; Dismore, H. Running A Restaurant for Dummies; John Wiley & Sons: Hoboken, NJ, USA, 2011. [Google Scholar]
  109. Omar, M.S.; Ariffin, H.F.; Ahmad, R. Factors affecting customers’ satisfaction in Arabic restaurants. Int. J. Adm. Gov. 2014, 1, 1–8. [Google Scholar]
  110. Hinkin, T.R.; Tracey, J.B. Continued Relevance of ‘Factors Driving Meeting Effectiveness’ Recent history has only reinforced guests’ preferences regarding meeting-space attributes. Tops is safety and security, followed by service, service, service. Cornell Hotel. Restaur. Adm. Q. 2003, 44, 27–30. [Google Scholar]
  111. Tinoco, M.A.C.; Ribeiro, L.D. Main attributes of quality and price perception for a la carte restaurants. Management 2012, 2, 40–48. [Google Scholar]
  112. Liu, Y.; Jang, S.S. Perceptions of Chinese restaurants in the US: What affects customer satisfaction and behavioral intentions? Int. J. Hosp. Manag. 2009, 28, 338–348. [Google Scholar] [CrossRef]
  113. Marinkovic, V.; Senic, V.; Mimovic, P. Factors affecting choice and image of ethnic restaurants in Serbia. Br. Food J. 2015, 117, 1903–1920. [Google Scholar] [CrossRef]
  114. Douglas, J. Mystery shoppers: An evaluation of their use in monitoring performance. TQM J. 2015, 27, 705–715. [Google Scholar] [CrossRef]
  115. Leeds, B. Mystery shopping’offers clues to quality service. Bank Mark. 1992, 24, 24–27. [Google Scholar]
  116. Yaoyuneyong, G.; Whaley, J.E.; Butler, R.A.; Williams, J.A.; Jordan, K.L., Jr.; Hunt, L. Resort mystery shopping: A case study of hotel service. J. Qual. Assur. Hosp. Tour. 2018, 19, 358–386. [Google Scholar] [CrossRef]
  117. Hortamani, A.; Ansari, A.; Akbari, M. Studying impact of price satisfaction on loyalty: A case study in electric generating plant snowa. Int. J. Acad. Res. Account. Financ. Manag. Sci. 2013, 3, 46–50. [Google Scholar]
  118. Alhelalat, J.A.; Ma’moun, A.H.; Twaissi, N.M. The impact of personal and functional aspects of restaurant employee service behaviour on customer satisfaction. Int. J. Hosp. Manag. 2017, 66, 46–53. [Google Scholar] [CrossRef]
  119. Medeiros, C.O.; Salay, E. A review of food service selection factors important to the consumer. Food Public Health 2013, 3, 176–190. [Google Scholar]
  120. Komaki, J.; Blood, M.R.; Holder, D. Fostering friendliness in a fast food franchise. J. Organ. Behav. Manag. 1980, 2, 151–164. [Google Scholar] [CrossRef]
  121. Chang, H.H.; Jeng, D.J.-F.; Hamid, M.R.A. Conceptualising consumers’ word-of-mouth behaviour intention: Evidence from a university education services in Malaysia. Serv. Bus. 2013, 7, 17–35. [Google Scholar] [CrossRef]
  122. Wu, H.-C.; Mohi, Z. Assessment of service quality in the fast-food restaurant. J. Foodserv. Bus. Res. 2015, 18, 358–388. [Google Scholar] [CrossRef]
  123. Namin, A. Revisiting customers’ perception of service quality in fast food restaurants. J. Retail. Consum. Serv. 2017, 34, 70–81. [Google Scholar] [CrossRef]
  124. Stewart, B.; Tinsley, A. From qualitative to quantitative: Development of an instrument to assess food choice influences of young adults. Ecol. Food Nutr. 1995, 34, 171–181. [Google Scholar] [CrossRef]
  125. Glanz, K.; Basil, M.; Maibach, E.; Goldberg, J.; Snyder, D.A.N. Why Americans eat what they do: Taste, nutrition, cost, convenience, and weight control concerns as influences on food consumption. J. Am. Diet. Assoc. 1998, 98, 1118–1126. [Google Scholar] [CrossRef]
  126. Koshki, N.; Esmaeilpour, H.; Ardestani, A.S. The study on the effects of environmental quality, food and restaurant services on mental image of the restaurant, customer perceived value, customer satisfaction and customer behavioral intentions:(Case study of Boroujerd’s restaurants). Kuwait Chapter Arab. J. Bus. Manag. Rev. 2014, 3, 261. [Google Scholar] [CrossRef] [Green Version]
  127. Pettijohn, L.S.; Pettijohn, C.E.; Luke, R.H. An evaluation of fast food restaurant satisfaction: Determinants, competitive comparisons and impact on future patronage. J. Restaur. Foodserv. Mark. 1997, 2, 3–20. [Google Scholar] [CrossRef]
  128. Rizal, H.; Jeng, D.J.-F.; Chang, H.H. The role of ethnicity in domestic intercultural service encounters. Serv. Bus. 2016, 10, 263–282. [Google Scholar] [CrossRef]
  129. Jones, P.; Dent, M. Improving service: Managing response time in hospitality operations. Int. J. Oper. Prod. Manag. 1994, 14, 52–58. [Google Scholar] [CrossRef]
  130. Omar, M.S.; Ariffin, H.F.; Ahmad, R. The relationship between restaurant ambience and customers’ satisfaction in Shah Alam Arabic Restaurants, Selangor. Int. J. Adm. Gov. 2015, 1, 1–8. [Google Scholar]
  131. Ryu, K.; Jang, S.S. The effect of environmental perceptions on behavioral intentions through emotions: The case of upscale restaurants. J. Hosp. Tour. Res. 2007, 31, 56–72. [Google Scholar] [CrossRef]
  132. Yan, X.; Wang, J.; Chau, M. Customer revisit intention to restaurants: Evidence from online reviews. Inf. Syst. Front. 2015, 17, 645–657. [Google Scholar] [CrossRef]
  133. Yüksel, A.; Yüksel, F. Measurement of tourist satisfaction with restaurant services: A segment-based approach. J. Vacat. Mark. 2003, 9, 52–68. [Google Scholar] [CrossRef]
  134. Kanyan, A.; Ngana, L.; Voon, B.H. Improving the service operations of fast-food restaurants. Procedia-Soc. Behav. Sci. 2016, 224, 190–198. [Google Scholar] [CrossRef] [Green Version]
  135. Kim, Y.; Kim, S.S.; Seo, J.; Hyun, J. Hotel employees’ competencies and qualifications required according to hotel Divisions. J. Tour. Hosp. Culin. Arts 2011, 3, 1–18. [Google Scholar]
  136. Pratten, J.D. Customer satisfaction and waiting staff. Int. J. Contemp. Hosp. Manag. 2004, 16, 385–388. [Google Scholar] [CrossRef]
  137. Wu, H.-C. An empirical study of the effects of service quality, perceived value, corporate image, and customer satisfaction on behavioral intentions in the Taiwan quick service restaurant industry. J. Qual. Assur. Hosp. Tour. 2013, 14, 364–390. [Google Scholar] [CrossRef]
  138. Qin, H.; Prybutok, V.R. Service quality, customer satisfaction, and behavioral intentions in fast-food restaurants. Int. J. Qual. Serv. Sci. 2009, 1, 78–95. [Google Scholar] [CrossRef]
  139. Wirtz, J.; Jerger, C. Managing service employees: Literature review, expert opinions, and research directions. Serv. Ind. J. 2016, 36, 757–788. [Google Scholar] [CrossRef]
  140. Shamah, R.A.M.; Mason, M.C.; Moretti, A.; Raggiotto, F. Investigating the antecedents of African fast food customers’ loyalty: A self-congruity perspective. J. Bus. Res. 2018, 86, 446–456. [Google Scholar] [CrossRef]
  141. Din, N.; Zahari, M.S.M.; Shariff, S.M. Nutritional labelling in Malaysian full service restaurant menu. J. ASIAN Behav. Stud. 2017, 2, 47–55. [Google Scholar] [CrossRef] [Green Version]
  142. Lu, S.; Fine, G.A. The presentation of ethnic authenticity: Chinese food as a social accomplishment. Sociol. Q. 1995, 36, 535–553. [Google Scholar] [CrossRef]
  143. Rozekhi, N.A.; Hussin, S.; Siddiqe, A.; Rashid, P.D.A.; Salmi, N.S. The influence of food quality on customer satisfaction in fine dining restaurant: Case in Penang. Int. Acad. Res. J. Bus. Technol. 2016, 2, 45–50. [Google Scholar]
  144. Namkung, Y.; Jang, S. Does food quality really matter in restaurants? Its impact on customer satisfaction and behavioral intentions. J. Hosp. Tour. Res. 2007, 31, 387–409. [Google Scholar] [CrossRef]
  145. Namkung, Y.; Jang, S.S. Are highly satisfied restaurant customers really different? A quality perception perspective. Int. J. Contemp. Hosp. Manag. 2008, 20, 142–155. [Google Scholar] [CrossRef]
  146. Yoo, S.A. Customer perceptions of restaurant cleanliness: A cross cultural study. Master’s Thesis, Virginia Polytechnic Institute and State University, Blacksburg, VA, USA, 9 July 2012. [Google Scholar]
  147. Barber, N.; Scarcelli, J.M. Clean restrooms: How important are they to restaurant consumers? J. Foodserv. 2009, 20, 309–320. [Google Scholar] [CrossRef]
  148. Jin, G.Z.; Leslie, P. The effect of information on product quality: Evidence from restaurant hygiene grade cards. Q. J. Econ. 2003, 118, 409–451. [Google Scholar] [CrossRef] [Green Version]
Figure 1. The frequency of Malaysians consuming food at FFRs in any given week. Source: Statista Research Department.
Information 13 00219 g001
Figure 2. The four phases of the research.
Information 13 00219 g002
Figure 3. A screenshot of FFR image evaluation hierarchical model from Expert Choice.
Information 13 00219 g003
Figure 4. A screenshot of pairwise comparison section of Expert Choice.
Information 13 00219 g004
Figure 5. Tree map showing the weights of main and sub-attributes. A green, red, and blue value represents the sub-attribute’s local weight, global weight, and overall rank, respectively.
Information 13 00219 g005
Figure 6. Performance scores of FFRs.
Information 13 00219 g006
Figure 7. Overall image score of each FFR.
Information 13 00219 g007
Table 1. Saaty’s AHP scale.
Preference ValueInterpretation
1 Element   i   and   j are equally preferred
2 Element   i   is   equally   to   moderately   preferred   than   j
3 Element   i   is   moderately   preferred   than   j
4 Element   i   is   moderately   to   strongly   preferred   than   j
5 Element     is   strongly   preferred   than   j  
6 Element   i   is   strongly   to   very   strongly   preferred   than   j
7 Element   i   is   very   strongly   preferred   than   j
8 Element   i   is   very   strongly   to   extremely   preferred   than   j
9 Element   i   is   extremely   preferred   than   j
1/2 Element   i   is   less   equally   to   moderately   preferred   than   j
1/3 Element   i   is   less   moderately   preferred   than   j
1/4 Element   i   is   less   moderately   to   strongly   preferred   than   j
1/5 Element   i   is   less   strongly   preferred   than   j
1/6 Element   i is less strongly to very strongly preferred than j
1/7 Element   i is less very strongly preferred than j
1/8 Element   i is less very strongly to extremely preferred than j
1/9 Element   i is less extremely preferred than j
Table 2. Conversion of preference ratings into a pairwise matrix.
Main AttributeRatingPairwise Matrix c 1 c 2 c 3
People   c 1 7 c 1 1 1 2   *2 **
Process   c 2 8 c 2 213 ***
Physical   evidence   c 3 6 c 3 ½1/31
Sample of calculations: * b = r 1 r 2 = 7 8 = 1 ; Since b < 0 ,   then a 12 = 1 1 b = 1 2 ; ** b = r 1 r 3 = 7 6 = 1 ; Since b > 0 ,   then a 13 = b + 1 = 2 ; *** b = r 2 r 3 = 8 6 = 2 ; Since b > 0 ,   then a 23 = b + 1 = 3 .
Table 3. Comparison between methods.
No.CriterionClassical AHPHybrid of Classical Delphi and Classical AHPProposed Hybrid of Modified Delphi and C-AHP
1Does the method help determine FFR image attributes that the experts mutually agree on? (D) No, because the method is not integrated with the Delphi survey(A) Yes (A) Yes
2Does the method allow us to reach a quicker consensus on FFR image attributes?This criterion is not applicable due to the absence of Delphi survey(D) Not possible since the Delphi survey begins with open-ended questions(A) Yes
3Does the method guarantee pairwise comparisons with an acceptable degree of inconsistency?(D) No(D) No(A) Yes
4Amount of input data required for a pairwise comparison matrix with n number of elements to compare ( D )   High .   It   requires   n n 1 / 2 amount of input data. ( D )   High .   It   requires   n n 1 / 2 amount of input data. ( A )   Low .   It   only   requires   n amount of input data.
5Complexity in providing the type of input data required for a pairwise comparison matrix ( D )   Complex   especially   when   the   number   of   elements   to   compare ,   n is large ( D )   Complex   especially   when   the   number   of   elements   to   compare ,   n is large ( A )   Manageable   even   if   the   number   of   elements   to   compare ,   n is large
Note: (A) denotes an advantage and (D) represents a disadvantage.
Table 4. List of sub-attributes extracted from past literature.
Main AttributeSub-AttributeDescriptionSource
PeopleHospitalityThe staff are friendly, willing to help the customers, and have an excellent courtesy and response manner.[36,52,92,95,96]
Employees’ KnowledgeThe staff serve the food exactly as orders made by customers, and they can provide all the information about their service to the customers. [36,95,96]
Employees’ problem-solving skillsThe staff are trustworthy. They apologize for the mistake and can deal with complaints.[95,97]
ProcessTaste of foodA standardized set of items that taste the same at any point of time.[36,38,52,57,59,91,96,97,98,99,100]
Healthy foodThe food is hygiene, nutritious and fresh. The restaurant uses proper food storage, handling, and preparation process to maintain the hygiene, nutrients, and freshness of the fast-food items.[101,102]
Service response timeQuick service and minimum waiting time.[52,103,104]
Sales promotionThe FFR efficiently deliver messages about the available sales promotions, e.g., coupon & discounts. [105]
Value for moneyMoney paid is worth the speediness involved in the process of preparing and serving the food after an order is made. [106]
Physical evidenceMenu designClear descriptions, clear pictures of food items, price tags are displayed, and informative menu design.[107,108]
Employees’ appearanceEmployees have a professional appearance, neat and well dressed. [36,38,91,95]
Physical cleanlinessClean dining environment.[36,38,52,57,59,92,95,96,97,99]
ParkingThe restaurant has a convenient parking location and sufficient parking space.[92,95,96,99]
Internal ambianceInternal seating facilities, nice interior design & décor, nice music, restaurant decorations, lighting, layout, appropriate room temperature, good atmosphere, and having adequate space.[36,38,57,59,91,92,96,109]
Overall safetyThe restaurant is equipped with all the necessary safety features such as CCTVs, fire extinguishers, and emergency exits.[52,110,111]
Exterior Pleasant outward appearance and scenery around the restaurant. [91,96,112,113]
Table 5. The mean and CV values of the finalized sub-attributes.
Main AttributeSub-AttributeMeanCV (%)
People
(Mean = 4.82, CV = 8.40%)
Hospitality4.916.14
Employees’ knowledge5.000.00
Employees’ problem-solving skills4.6410.88
Process
(Mean = 4.91, CV = 6.14%)
Taste of food5.000.00
Healthy food5.000.00
Service response time4.828.40
Sales promotion4.6414.54
Value of money4.6410.88
* Variety of food4.828.40
* Operation time4.828.40
Physical evidence
(Mean = 4.82, CV = 8.40%)
Menu design4.916.14
Employees’ appearance4.916.14
Physical cleanliness4.916.14
Parking4.0017.95
Internal ambiance4.828.40
Overall safety4.916.14
Exterior4.916.14
Note: * indicates the sub-attributes added after considering the suggestions given by the experts during the first round of Delphi survey.
Table 6. Possible strategies for improvement.
No.Sub-Attribute
(Global Weight)
Possible Strategies
1Hospitality (0.118)
  • Offer more in-house professional training, such as communication or public relation-based training to the existing staff [134].
  • Appoint staff who possess strong interpersonal skills [135,136].
  • Station experienced staff in the front line for delivering an enjoyable experience for the customers [95].
2Employees’ problem-solving skills (0.116)
  • Assure the staff is more responsive to the needs of the customers or complaints made by them [137].
  • Offer relevant courses to equip the staff with various coping skills, so that they can adequately handle unexpected crowds, problematic customers, or any other undesirable situations [95,138,139].
  • Assign mentors to the new staff to coach them on how they can deal with the demands or complaints made by the customers [140].
3Employees’ knowledge (0.101)
  • Organize brief sharing sessions with the staff before work start if there are any new products or sales promotions introduced by the management [95].
  • Equip employees with the nutritional knowledge of the food they are providing [141].
4Food taste (0.060)
  • Cook/Prepare the food by strictly adhering to the standard procedures so that a consistent taste is delivered over time [142].
  • Use fresh ingredients [143].
  • Introduce food matching the local culture’s taste [3,97].
  • Serve the food within the appropriate temperature range [144,145].
5Physical cleanliness (0.059)
  • Keep the floor and carpets clean [146].
  • Keep the restrooms clean [147].
  • Keep the tables and chairs clean [95].
  • Display the certificate from the health and sanitary inspection authority at the entrance of the restaurant [148].
6Service response time (0.052)
  • Re-examine and re-design the service delivery operation if the average customer waiting time is long [129].
  • Deliver more skill-based training to the kitchen staff to increase their efficiency in preparing the ordered food [134].
  • Introduce a drive-through ordering and pick-up option [123].
  • Introduce online ordering and pick-up systems [123].
Publisher’s Note: MDPI stays neutral with regard to jurisdictional claims in published maps and institutional affiliations.

