
Prediction of Enterprise Free Cash Flow Based on a Backpropagation Neural Network Model of the Improved Genetic Algorithm


Abstract
1. Introduction
2. Model
2.1. Fitness Function
2.2. Design of BP Neural Network
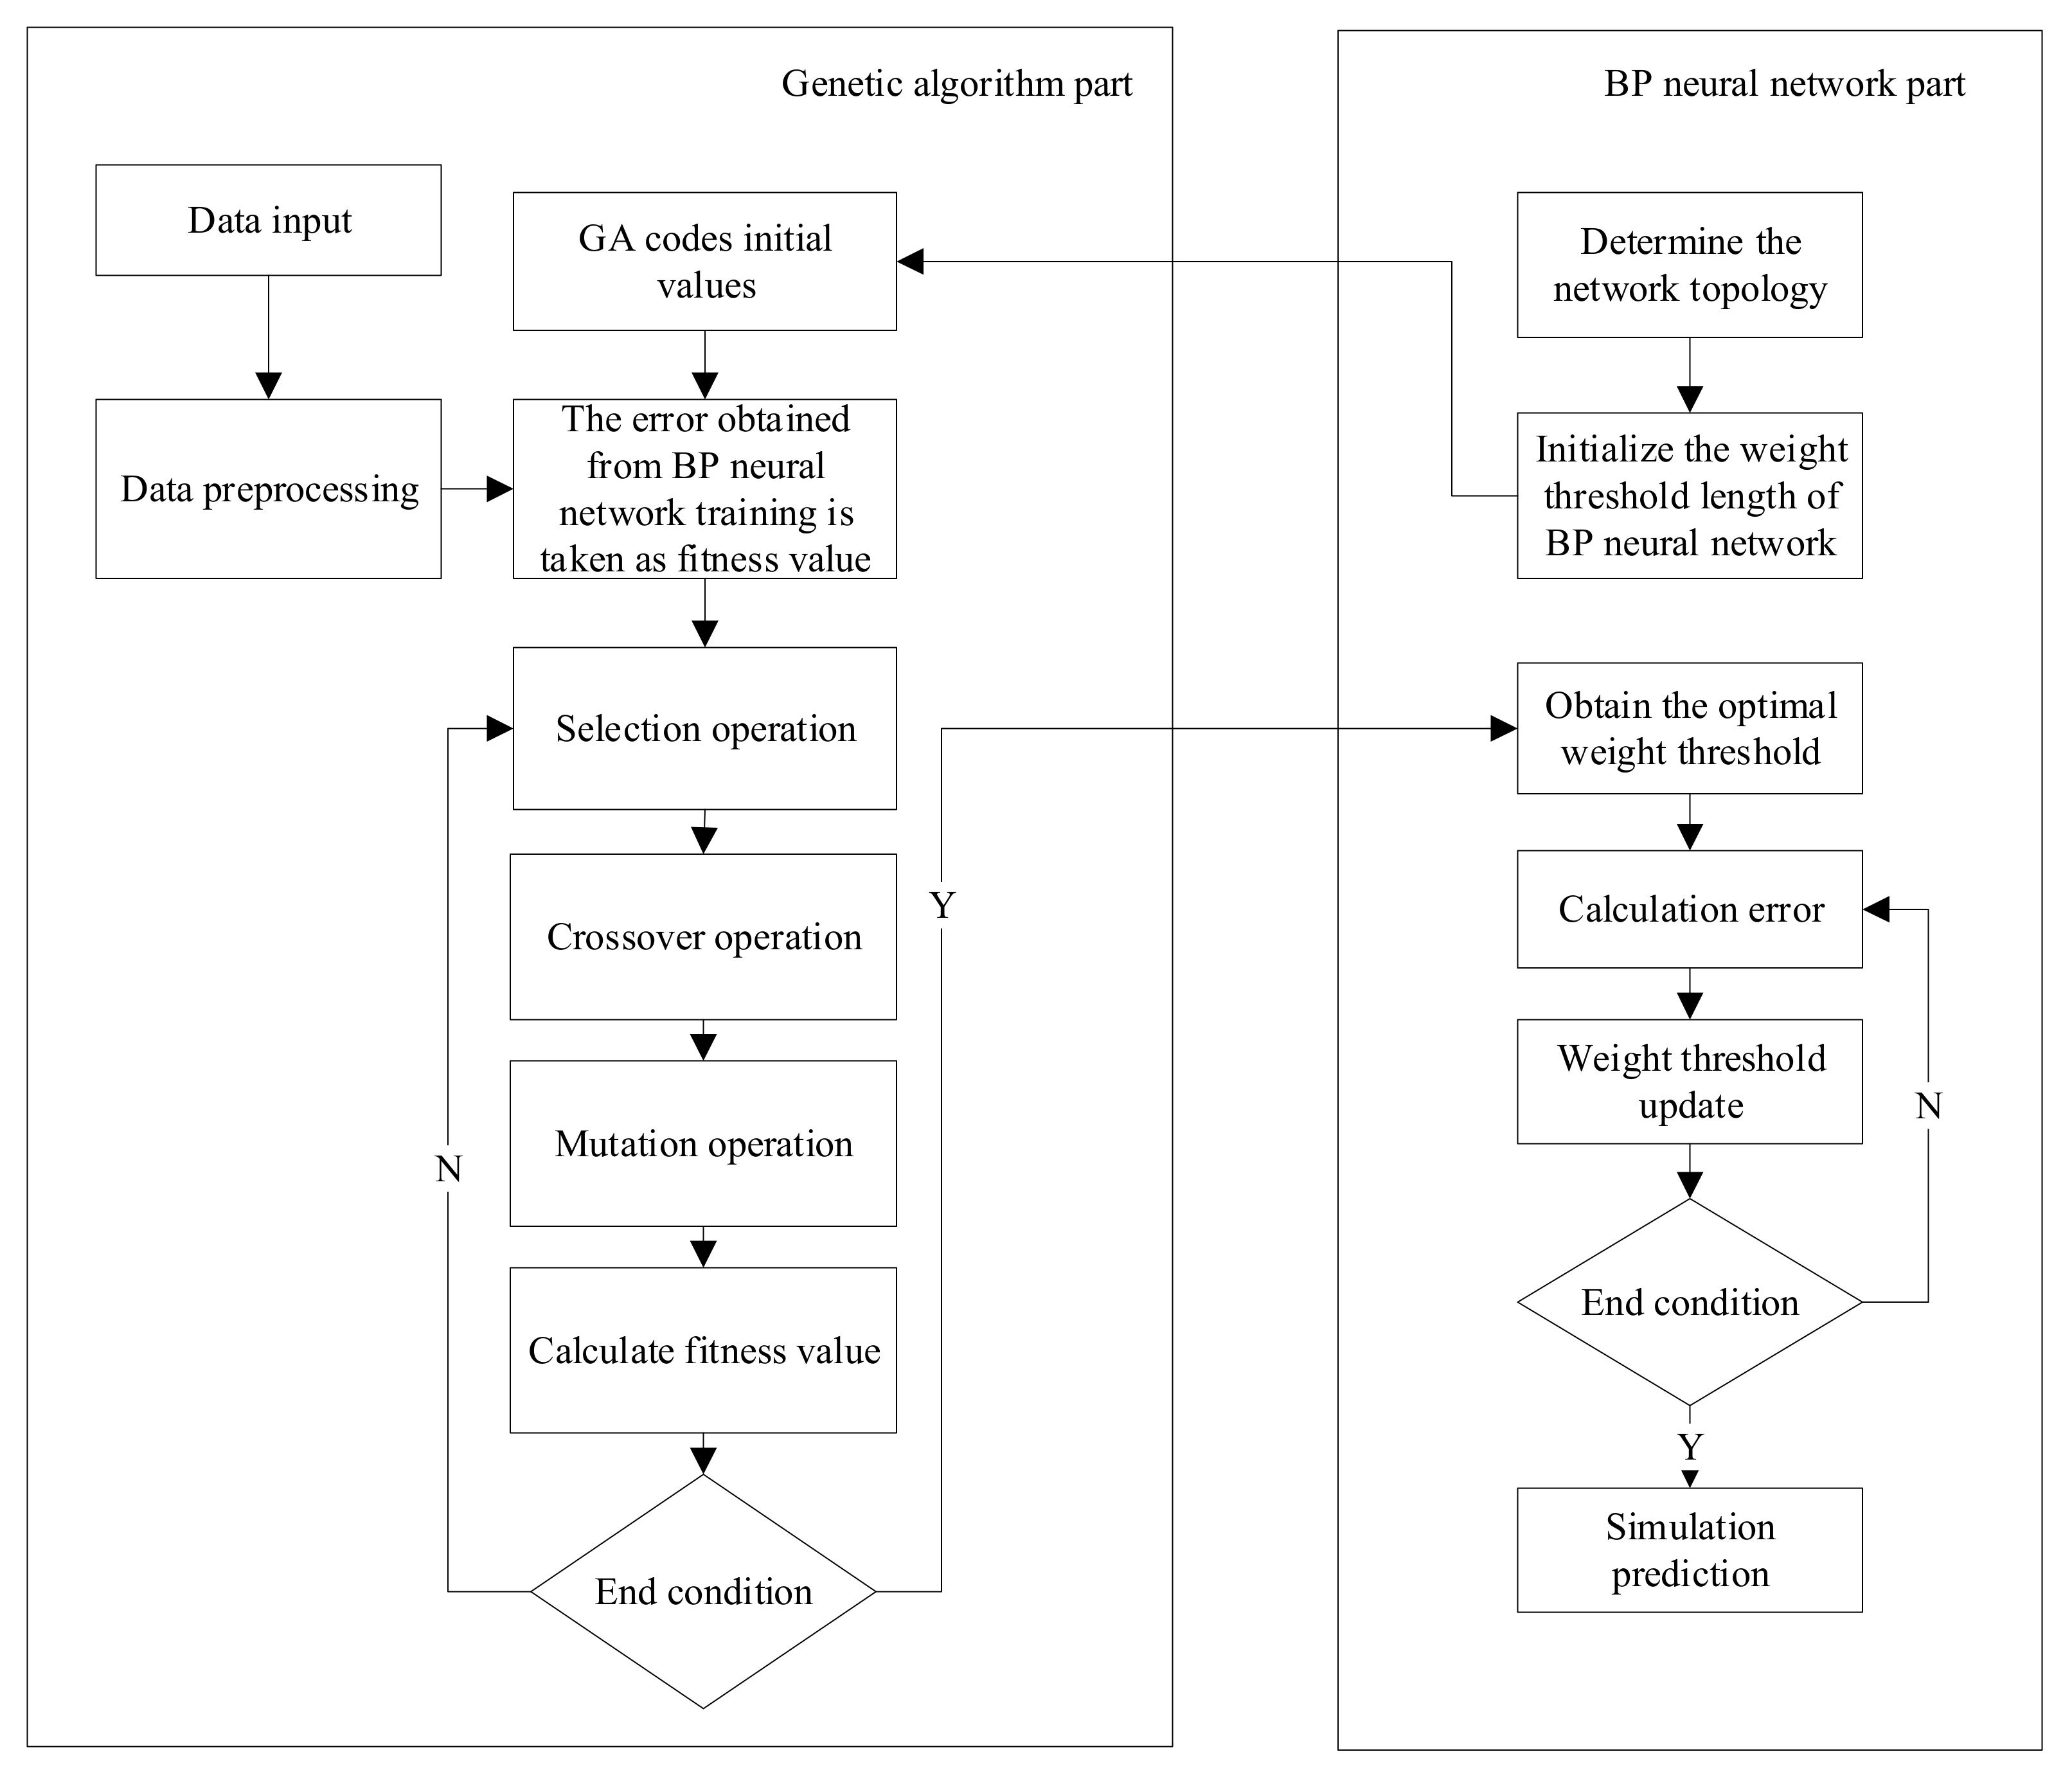
2.3. Implementation Steps of the Model
3. Experiments
3.1. Experimental Setup
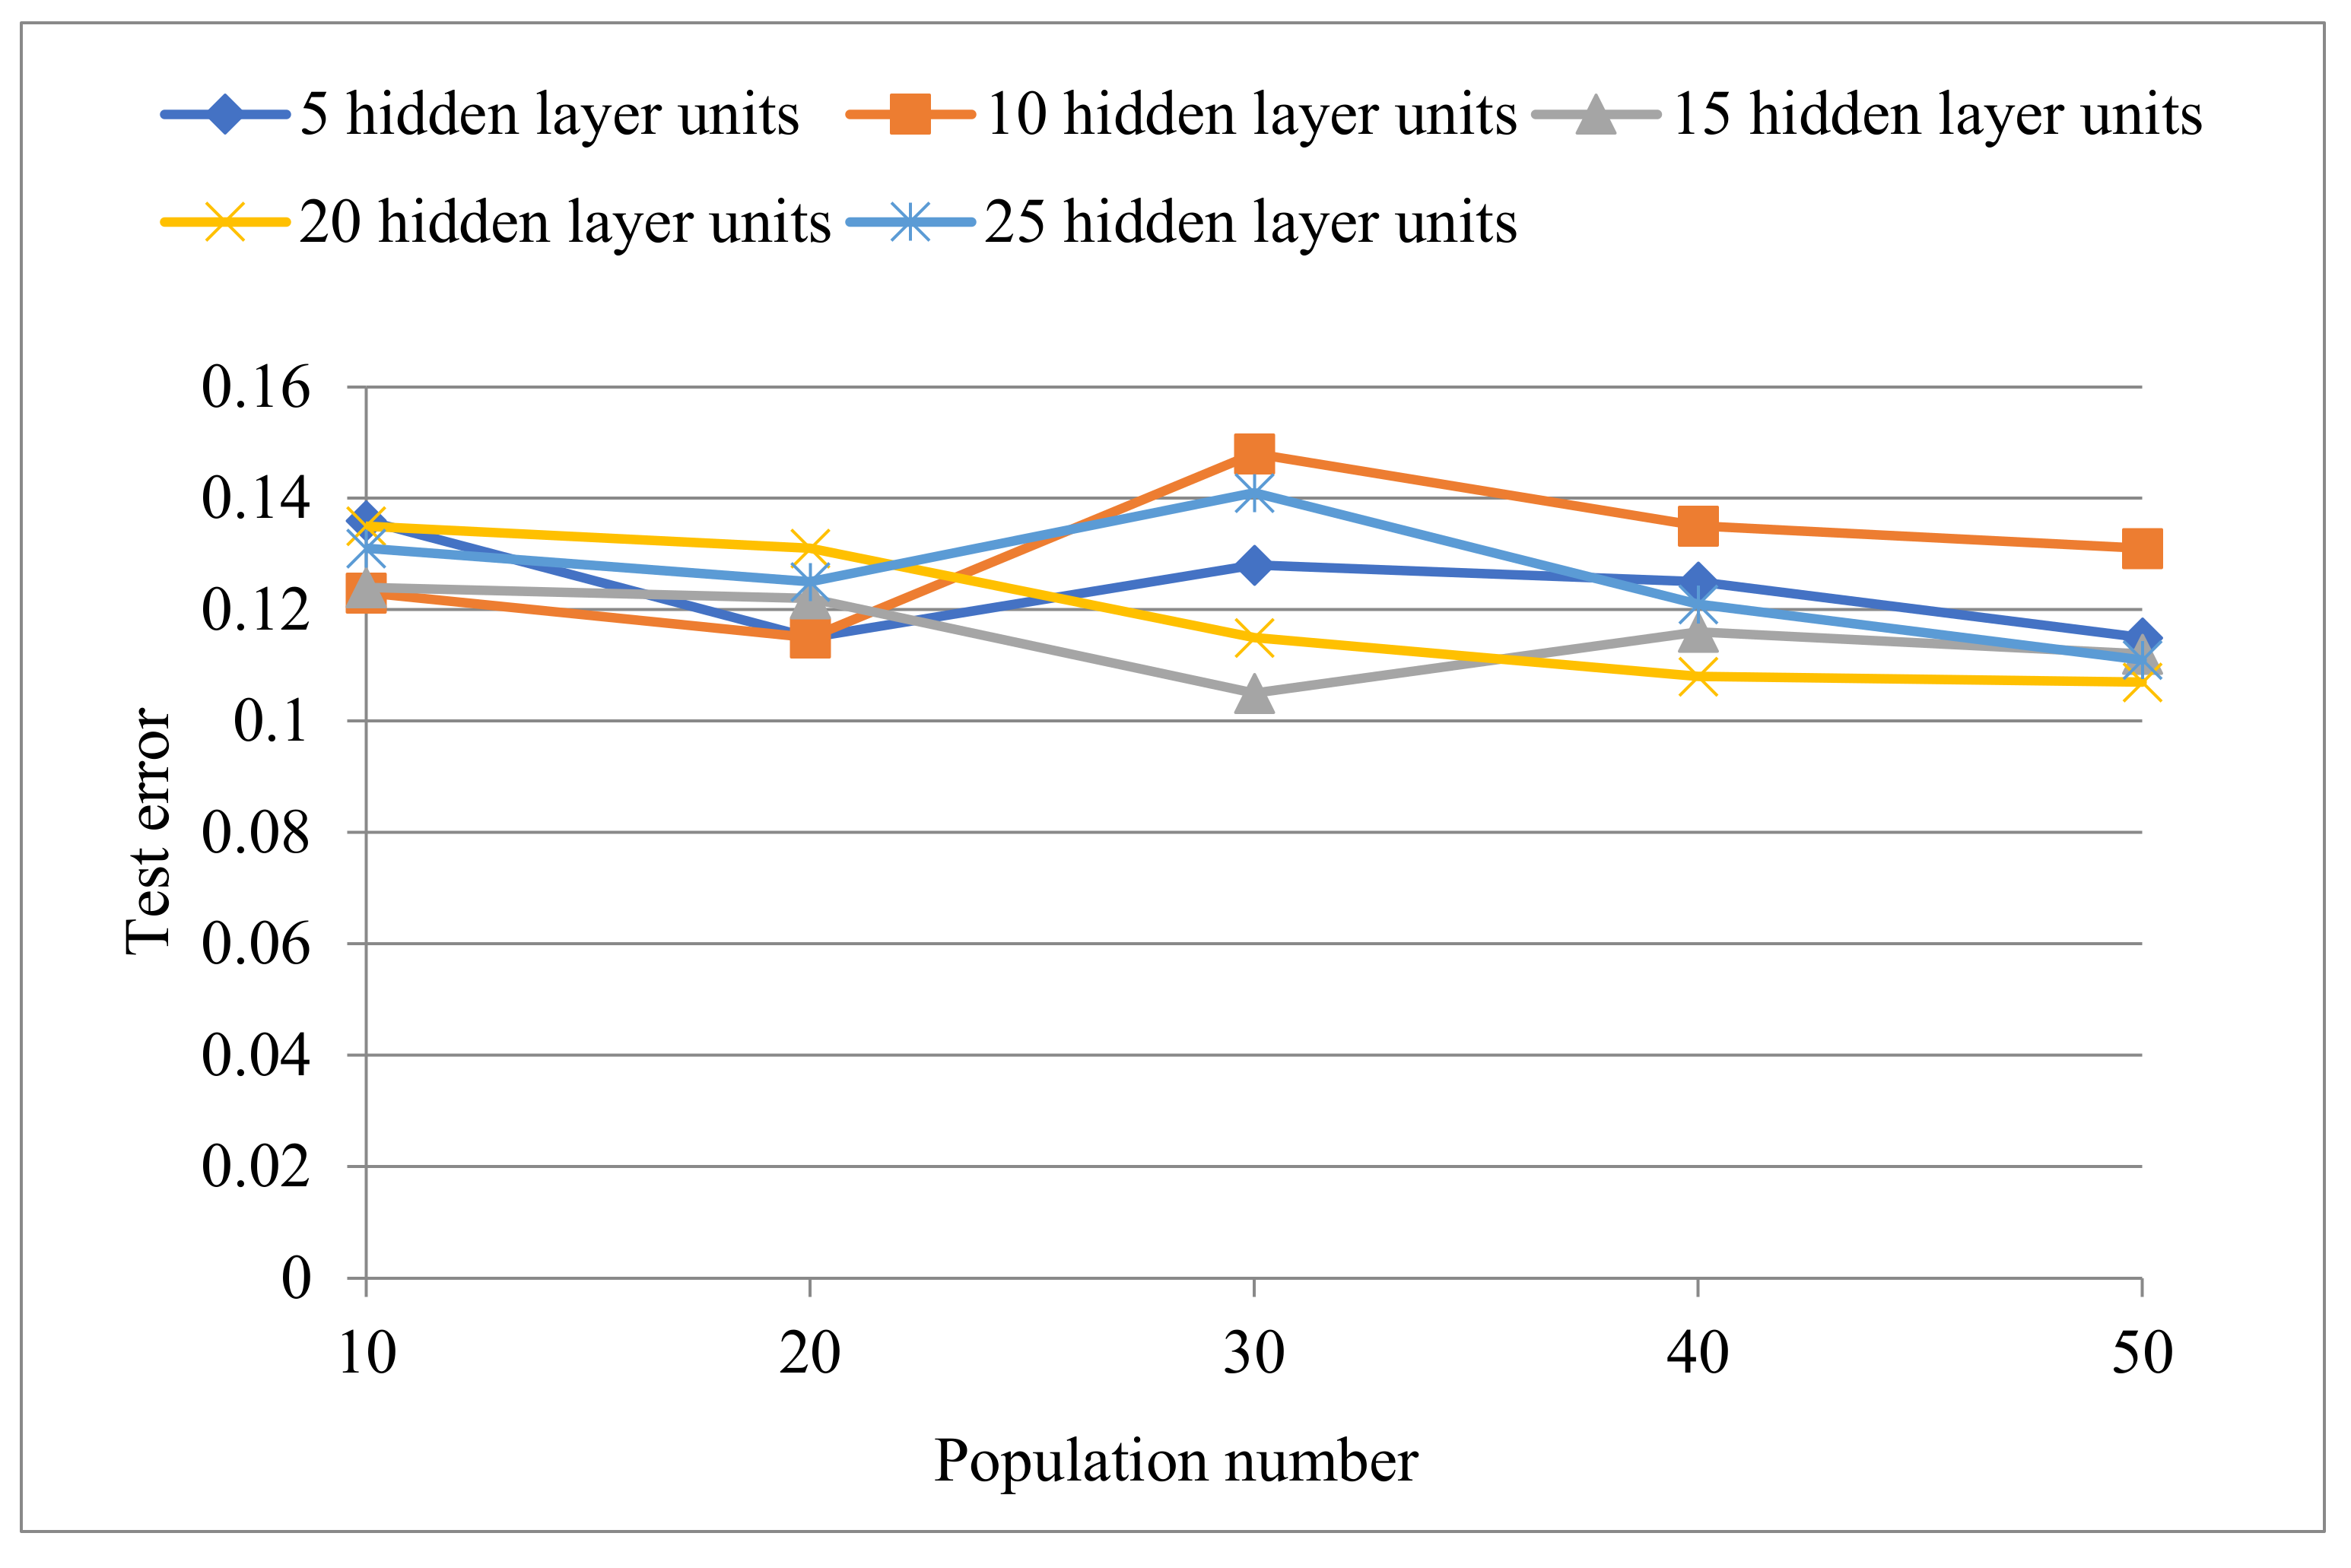
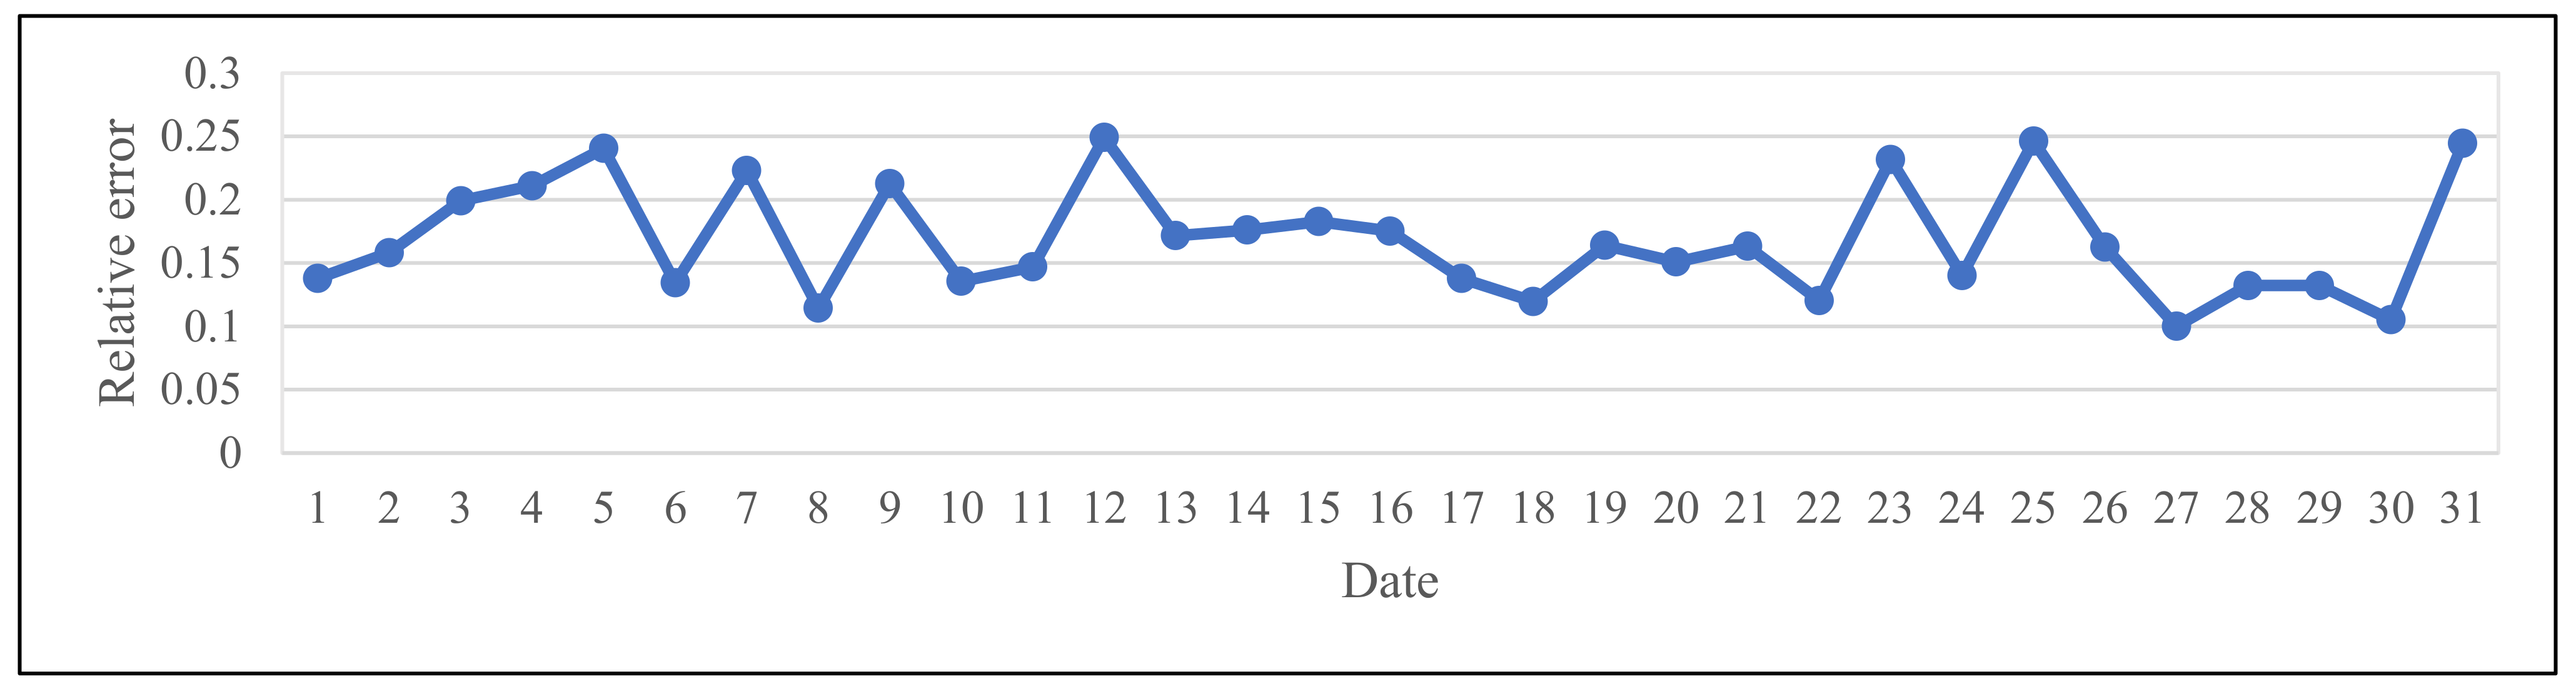
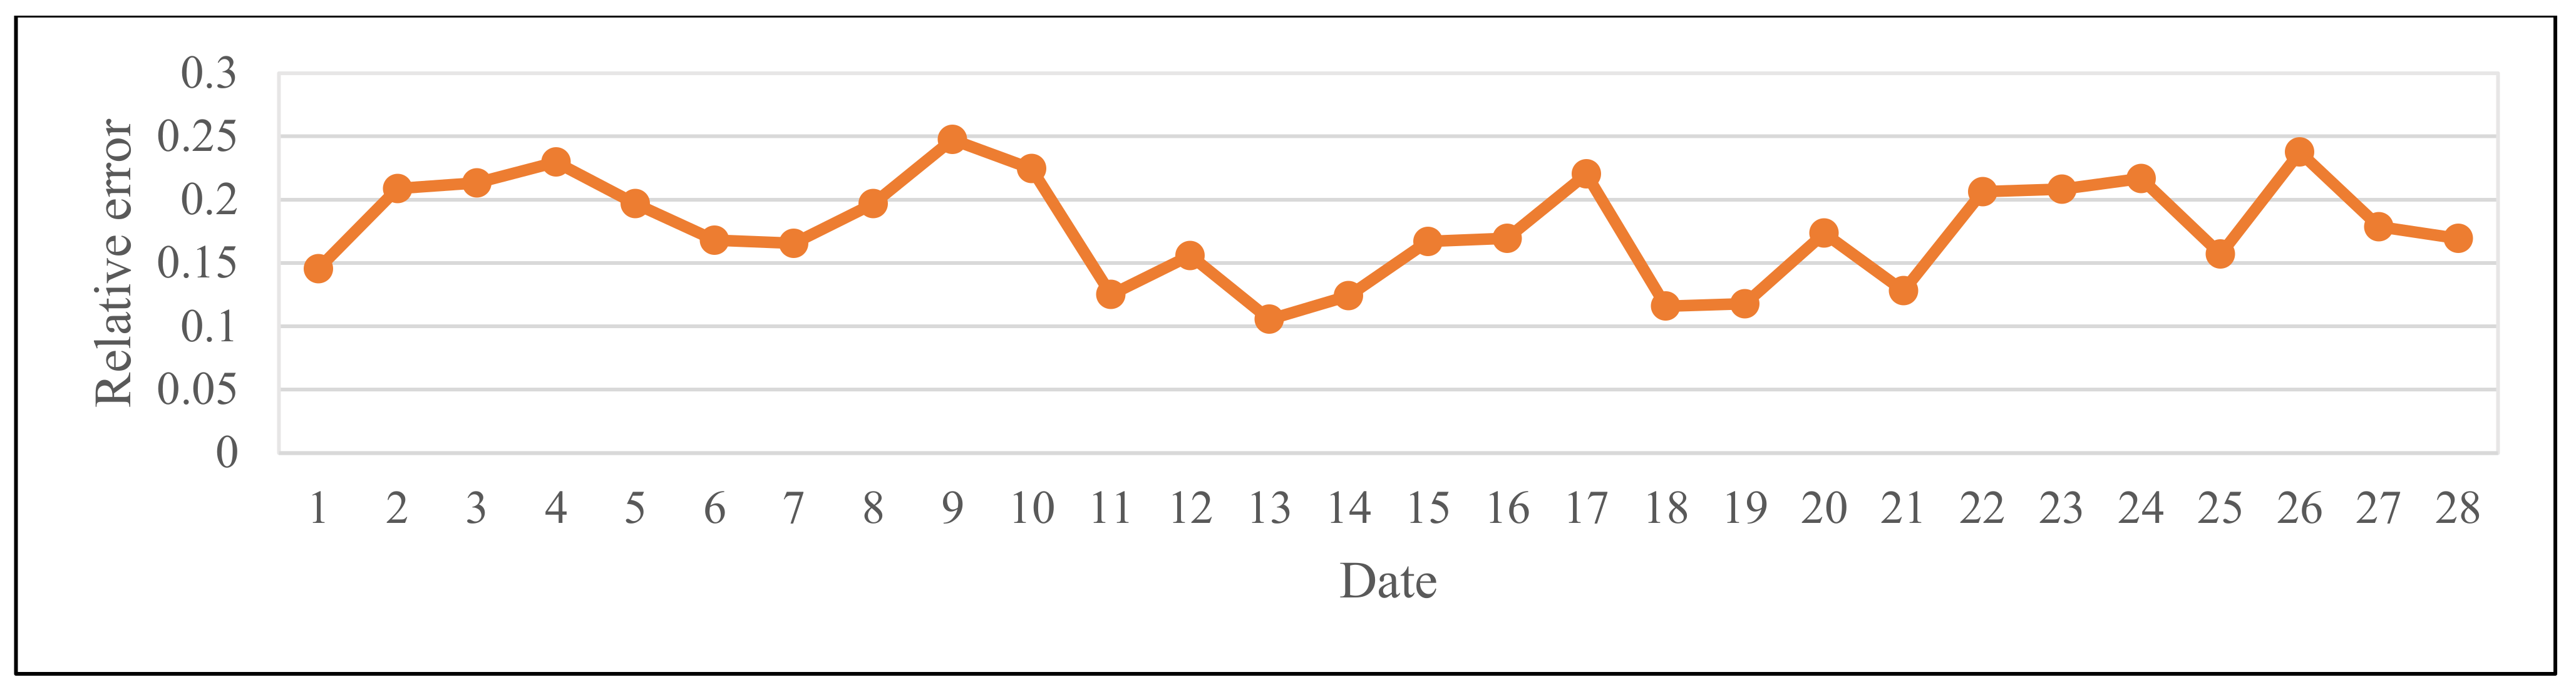
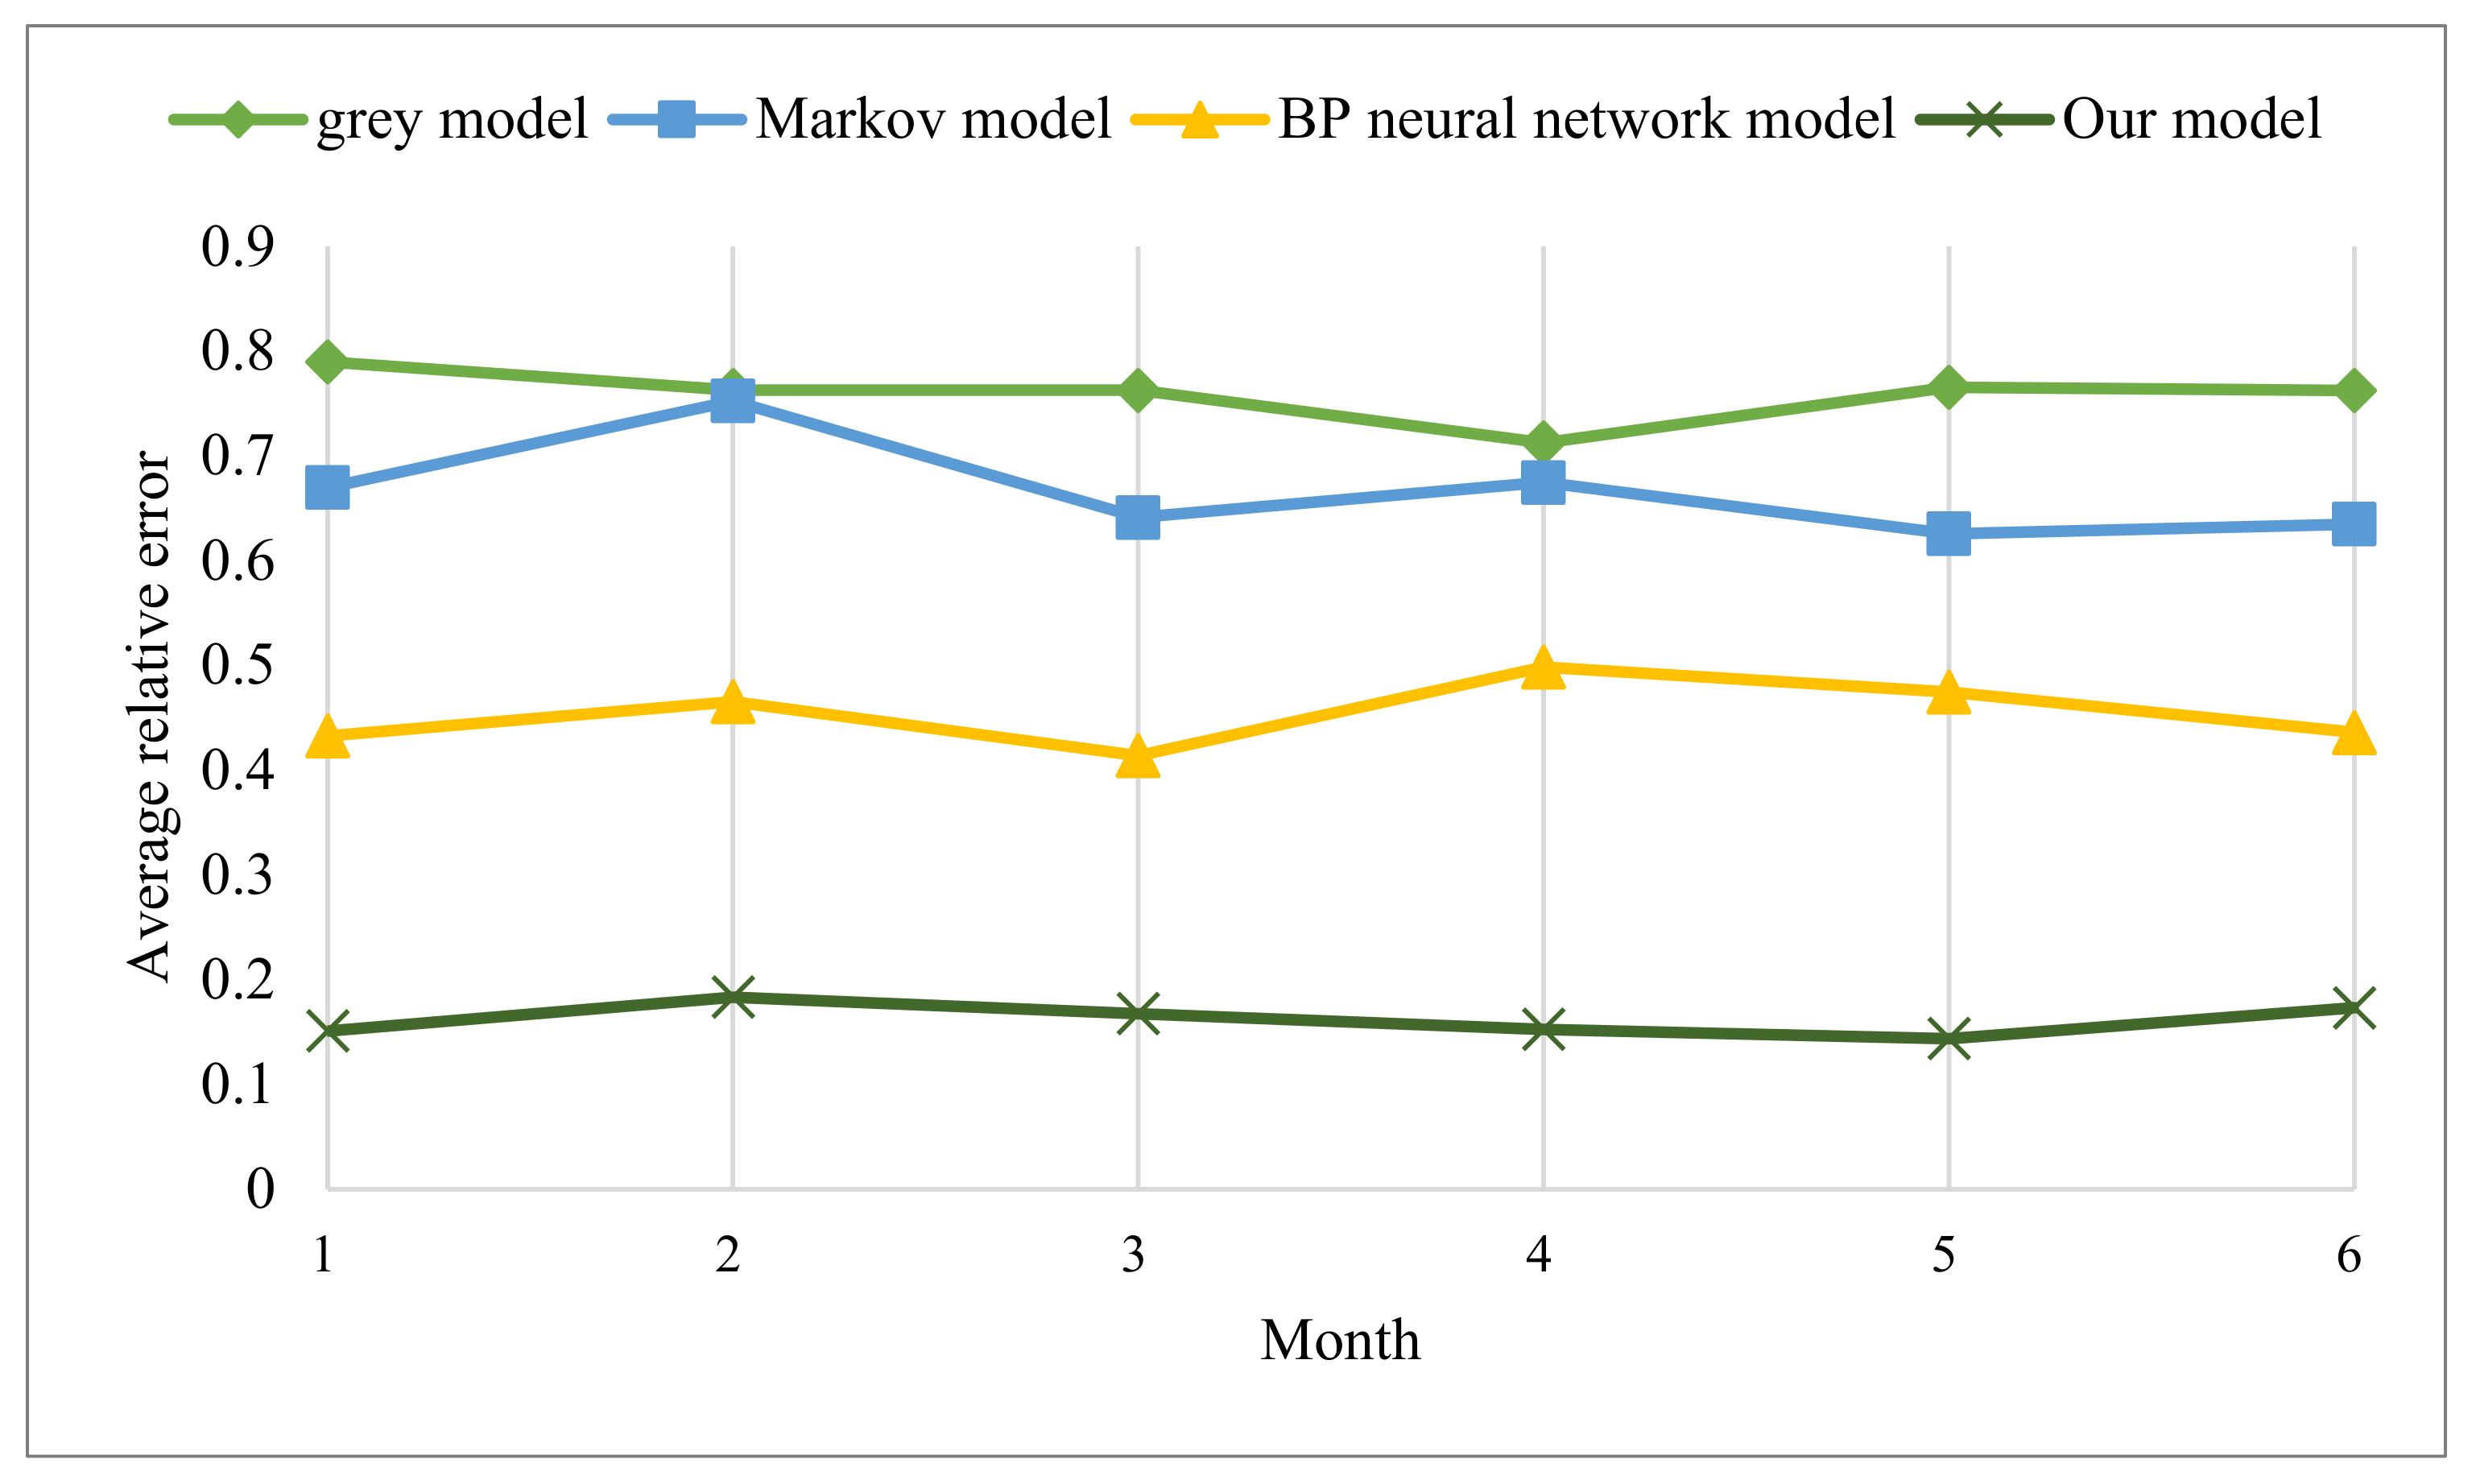
3.2. Experimental Results
4. Conclusions
Author Contributions
Funding
Acknowledgments
Conflicts of Interest
References
- Fomina, O.; Moshkovska, O.; Luchyk, S.; Manachynska, Y.; Kuzub, M. Managing the Agricultural Enterprises’ Valuation: Actuarial Approach. Probl. Perspect. Manag. 2020, 18, 289–301. [Google Scholar] [CrossRef]
- Miciula, I.; Kadlubek, M.; Stępień, P. Modern Methods of Business Valuation—Case Study and New Concepts. Sustainability 2020, 12, 2699. [Google Scholar] [CrossRef]
- Huang, W.; Liu, J.; Bai, H.; Zhang, P. Value Assessment of Companies by Using an Enterprise Value Assessment System Based on Their Public Transfer Specification. Inf. Processing Manag. 2020, 57, 102254. [Google Scholar] [CrossRef]
- Gráf, P.; Rowland, Z. Potential of the Small Enterprise Value Assessment Using the Discounted FCFF Method. In Economic Systems in the New Era: Stable Systems in an Unstable World; Ashmarina, S.I., Horák, J., Vrbka, J., Šuleř, P., Eds.; IES 2020 Lecture Notes in Networks and Systems; Springer: Cham, Switzerland, 2021; Volume 160, pp. 846–855. [Google Scholar] [CrossRef]
- Liu, Y.C.; Yeh, I.C. Building Valuation Model of Enterprise Values for Construction Enterprise with Quantile Neural Networks. J. Constr. Eng. Manag. 2016, 142, 04015075. [Google Scholar] [CrossRef]
- Vochozka, M.; Rowland, Z.; Suler, P.; Marousek, J. The Influence of the International Price of Oil on the Value of the EUR/USD Exchange Rate. J. Compet. 2020, 12, 167–190. [Google Scholar] [CrossRef]
- Vochozka, M.; Horák, J.; Krulický, T.; Pardal, P. Predicting Future Brent Oil Price on Global Markets. Acta Montan. Slovaca 2020, 25, 375–392. [Google Scholar] [CrossRef]
- Luca, P.D. Enterprise Valuation. In Analytical Corporate Valuation; Springer: Cham, Switzerland, 2018; pp. 367–397. [Google Scholar] [CrossRef]
- Nekhili, M.; Amar, I.F.B.; Chtioui, T.; Lakhal, F. Free Cash Flow and Earnings Management: The Moderating Role of Governance and Ownership. J. Appl. Bus. Res. 2016, 32, 255–268. [Google Scholar] [CrossRef]
- Dewi, I.A.M.C.; Sari, M.M.R.; Budiasih, I.G.A.N.; Suprasto, H.B. Free Cash Flow Effect towards Firm Value. Int. Res. J. Manag. IT Soc. Sci. 2019, 6, 108–116. [Google Scholar] [CrossRef]
- Abdoh, H.A.A.; Varela, O. Product Market Competition, Cash Flow and Corporate Investments. Manag. Financ. 2018, 44, 207–221. [Google Scholar] [CrossRef]
- Buus, T. A General Free Cash Flow Theory of Capital Structure. J. Bus. Econ. Manag. 2015, 16, 675–695. [Google Scholar] [CrossRef]
- Agustia, D. Pengaruh Faktor Good Corporate Governance, Free Cash Flow, dan Leverage Terhadap Manajemen Laba. J. Akunt. Dan Keuang. 2013, 15, 27–42. [Google Scholar] [CrossRef]
- Park, K.; Jang, S.C. Capital Structure, Free Cash Flow, Diversification and Firm Performance: A Holistic Analysis. Int. J. Hosp. Manag. 2013, 33, 51–63. [Google Scholar] [CrossRef]
- Bukit, R.B.; Nasution, F.N. Employee Diff, Free Cash Flow, Corporate Governance and Earnings Management. Procedia Soc. Behav. Sci. 2015, 211, 585–594. [Google Scholar] [CrossRef]
- Chen, X.; Sun, Y.; Xu, X. Free Cash Flow, Over-Investment and Corporate Governance in China. Pac. Basin Financ. J. 2016, 37, 81–103. [Google Scholar] [CrossRef]
- Kadioglu, E.; Kilic, S.; Yilmaz, E.A. Testing the Relationship between Free Cash Flow and Company Performance in Borsa Istanbul. Int. Bus. Res. 2017, 10, 148–158. [Google Scholar] [CrossRef][Green Version]
- Guizani, M.; Abdalkrim, G. Board Gender Diversity, Financial Decisions and Free Cash Flow: Empirical Evidence from Malaysia. Manag. Res. Rev. 2022, 45, 198–216. [Google Scholar] [CrossRef]
- Nobakht, M.; Hassanzadeh, R.B. Impact of Free Cash Flow on Real and Artificial Earnings Management. Account. Audit. Rev. 2017, 24, 421–440. [Google Scholar] [CrossRef]
- Vochozka, M.; Vrbka, J.; Suler, P. Bankruptcy or Success? The Effective Prediction of a Company’s Financial Development Using LSTM. Sustainability 2020, 12, 7529. [Google Scholar] [CrossRef]
- Luo, N.; Chen, J.; Kong, L.; Zhu, Y. Enterprise Valuation Analysis Based on Grey Prediction Model and Index Selection—A Case Study of Huayi Brothers Media Group. Int. J. Econ. Financ. 2016, 8, 11–22. [Google Scholar] [CrossRef]
- Yao, H.; Li, X.; Hao, Z.; Li, Y. Dynamic Asset–Liability Management in A Markov Market with Stochastic Cash Flows. Quant. Financ. 2016, 16, 1575–1597. [Google Scholar] [CrossRef]
- Rowland, Z.; Lazaroiu, G.; Podhorská, I. Use of Neural Networks to Accommodate Seasonal Fluctuations When Equalizing Time Series for the CZK/RMB Exchange Rate. Risks 2021, 9, 1. [Google Scholar] [CrossRef]
- Li, J.; Hu, H.; Li, X.; Jin, Q.; Huang, T. Economic Benefit of Shale Gas Exploitation Based on Back Propagation Neural Network. J. Intell. Fuzzy Syst. 2020, 39, 8823–8830. [Google Scholar] [CrossRef]
- Jennergren, L.P. Continuing Value in Firm Valuation by The Discounted Cash Flow Model. Eur. J. Oper. Res. 2008, 185, 1548–1563. [Google Scholar] [CrossRef]
- Décamps, J.P.; Mariotti, T.; Rochet, J.C.; Villeneuve, S. Free Cash Flow, Issuance Costs, and Stock Prices. J. Financ. 2011, 66, 1501–1544. [Google Scholar] [CrossRef]
- Tabei, S.M.A.; Bagherpour, M.; Mahmoudi, A. Application of Fuzzy Modelling to Predict Construction Projects Cash Flow. Period. Polytech. Civ. Eng. 2019, 63, 647–659. [Google Scholar] [CrossRef]
- Weytjens, H.; Lohmann, E.; Kleinsteuber, M. Cash Flow Prediction: MLP and LSTM Compared to ARIMA and Prophet. Electron. Commer. Res. 2021, 21, 371–391. [Google Scholar] [CrossRef]
- Hsu, S.C. Fuzzy Time Series Customers Prediction: Case Study of an E-Commerce Cash Flow Service Provider. Int. J. Comput. Intell. Appl. 2016, 15, 1650024. [Google Scholar] [CrossRef]
- Wang, J.S.; Ning, C.X. ANFIS Based Time Series Prediction Method of Bank Cash Flow Optimized by Adaptive Population Activity PSO Algorithm. Information 2015, 6, 300–313. [Google Scholar] [CrossRef]


| Initial Parameters of Genetic Algorithm | Value |
|---|---|
| Population size | 30 |
| Number of iterations | 150 |
| Crossing probability | 0.9 |
| Crossing probability | 0.1 |
| Select operation | Roulette |
| Fitness function | Matlab’s own function |
| Initial Parameters of Neural Network | Value |
|---|---|
| Number of input layers | 5 |
| Number of hidden layers | 15 |
| Number of output layers | 1 |
| Target error | 1 × 10⁻⁶ |
| Training times | 10,000 |
| Learning rate | 0.01 |
| Training function | Traindm function |
| Training method | Momentum gradient descent |
| Activation function | Sigmoid function |
| Network weights and thresholds | Optimal weights obtained by genetic algorithm |
| Number of Hidden Layer Units | Population | Test Error |
|---|---|---|
| 5 | 10 | 0.136 |
| 5 | 20 | 0.115 |
| 5 | 30 | 0.128 |
| 5 | 40 | 0.125 |
| 5 | 50 | 0.115 |
| 10 | 10 | 0.123 |
| 10 | 20 | 0.115 |
| 10 | 30 | 0.148 |
| 10 | 40 | 0.135 |
| 10 | 50 | 0.131 |
| 15 | 10 | 0.124 |
| 15 | 20 | 0.122 |
| 15 | 30 | 0.105 |
| 15 | 40 | 0.116 |
| 15 | 50 | 0.112 |
| 20 | 10 | 0.135 |
| 20 | 20 | 0.131 |
| 20 | 30 | 0.115 |
| 20 | 40 | 0.108 |
| 20 | 50 | 0.107 |
| 25 | 10 | 0.131 |
| 25 | 20 | 0.125 |
| 25 | 30 | 0.141 |
| 25 | 40 | 0.121 |
| 25 | 50 | 0.111 |
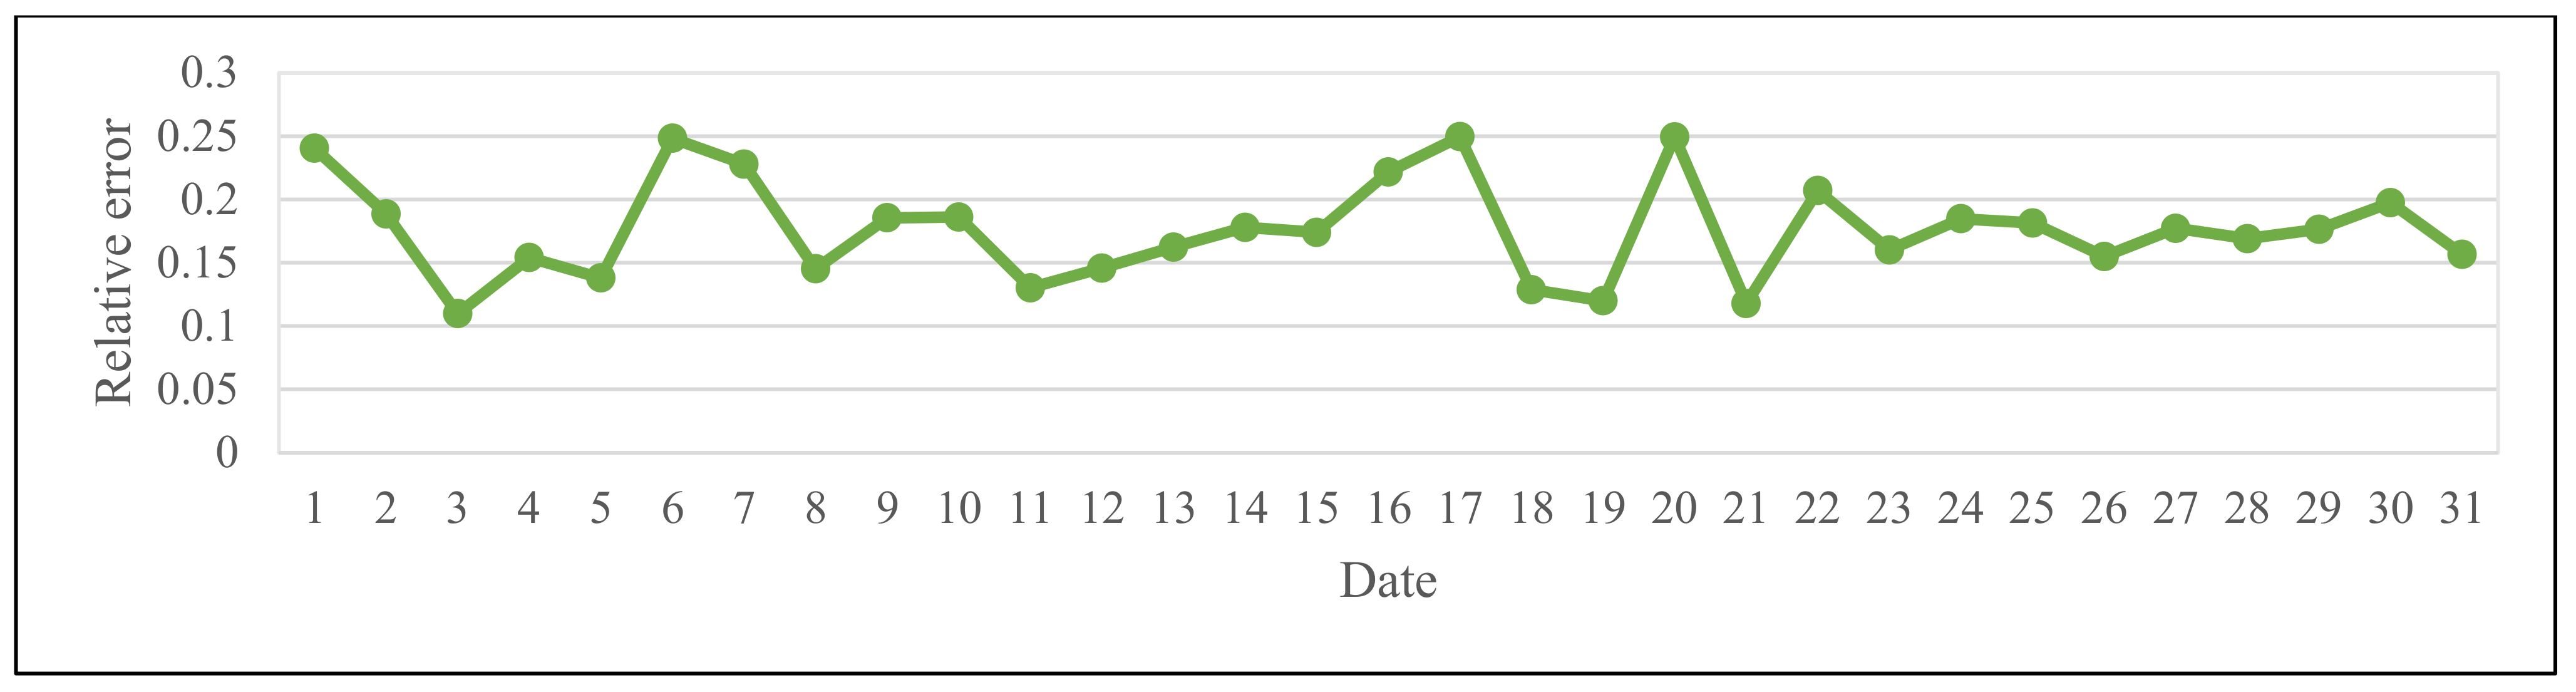
| Date | January 1 | January 2 | January 3 | January 4 | January 5 | January 6 | January 7 | January 8 | January 9 |
| RE | 0.1379 | 0.1582 | 0.1992 | 0.2110 | 0.2405 | 0.1343 | 0.2230 | 0.1143 | 0.2127 |
| Date | January 10 | January 11 | January 12 | January 13 | January 14 | January 15 | January 16 | January 17 | January 18 |
| RE | 0.1356 | 0.1470 | 0.2492 | 0.1716 | 0.1761 | 0.1828 | 0.1752 | 0.1378 | 0.1197 |
| Date | January 19 | January 20 | January 21 | January 22 | January 23 | January 24 | January 25 | January 26 | January 27 |
| RE | 0.1640 | 0.1509 | 0.1633 | 0.1204 | 0.2318 | 0.1401 | 0.2462 | 0.1625 | 0.1002 |
| Date | January 28 | January 29 | January 30 | January 31 | February 1 | February 2 | February 3 | February 4 | February 5 |
| RE | 0.1323 | 0.1323 | 0.1052 | 0.2446 | 0.1454 | 0.2088 | 0.2132 | 0.2296 | 0.1967 |
| Date | February 6 | February 7 | February 8 | February 9 | February 10 | February 11 | February 12 | February 13 | February 14 |
| RE | 0.1679 | 0.1655 | 0.1967 | 0.2476 | 0.2245 | 0.1251 | 0.1558 | 0.1056 | 0.1241 |
| Date | February 15 | February 16 | February 17 | February 18 | February 19 | February 20 | February 21 | February 22 | February 23 |
| RE | 0.1669 | 0.1694 | 0.2203 | 0.1159 | 0.1177 | 0.1735 | 0.1280 | 0.2063 | 0.2082 |
| Date | February 24 | February 25 | February 26 | February 27 | February 28 | March 1 | March 2 | March 3 | March 4 |
| RE | 0.2167 | 0.1570 | 0.2375 | 0.1786 | 0.1693 | 0.2404 | 0.1885 | 0.1098 | 0.1540 |
| Date | March 5 | March 6 | March 7 | March 8 | March 9 | March 10 | March 11 | March 12 | March 13 |
| RE | 0.1379 | 0.2483 | 0.2279 | 0.1451 | 0.1854 | 0.1861 | 0.1302 | 0.1458 | 0.1623 |
| Date | March 14 | March 15 | March 16 | March 17 | March 18 | March 19 | March 20 | March 21 | March 22 |
| RE | 0.1779 | 0.1740 | 0.2217 | 0.2495 | 0.1287 | 0.1199 | 0.2494 | 0.1178 | 0.2070 |
| Date | March 23 | March 24 | March 25 | March 26 | March 27 | March 28 | March 29 | March 30 | March 31 |
| RE | 0.1601 | 0.1847 | 0.1814 | 0.1549 | 0.1772 | 0.1690 | 0.1764 | 0.1974 | 0.1565 |
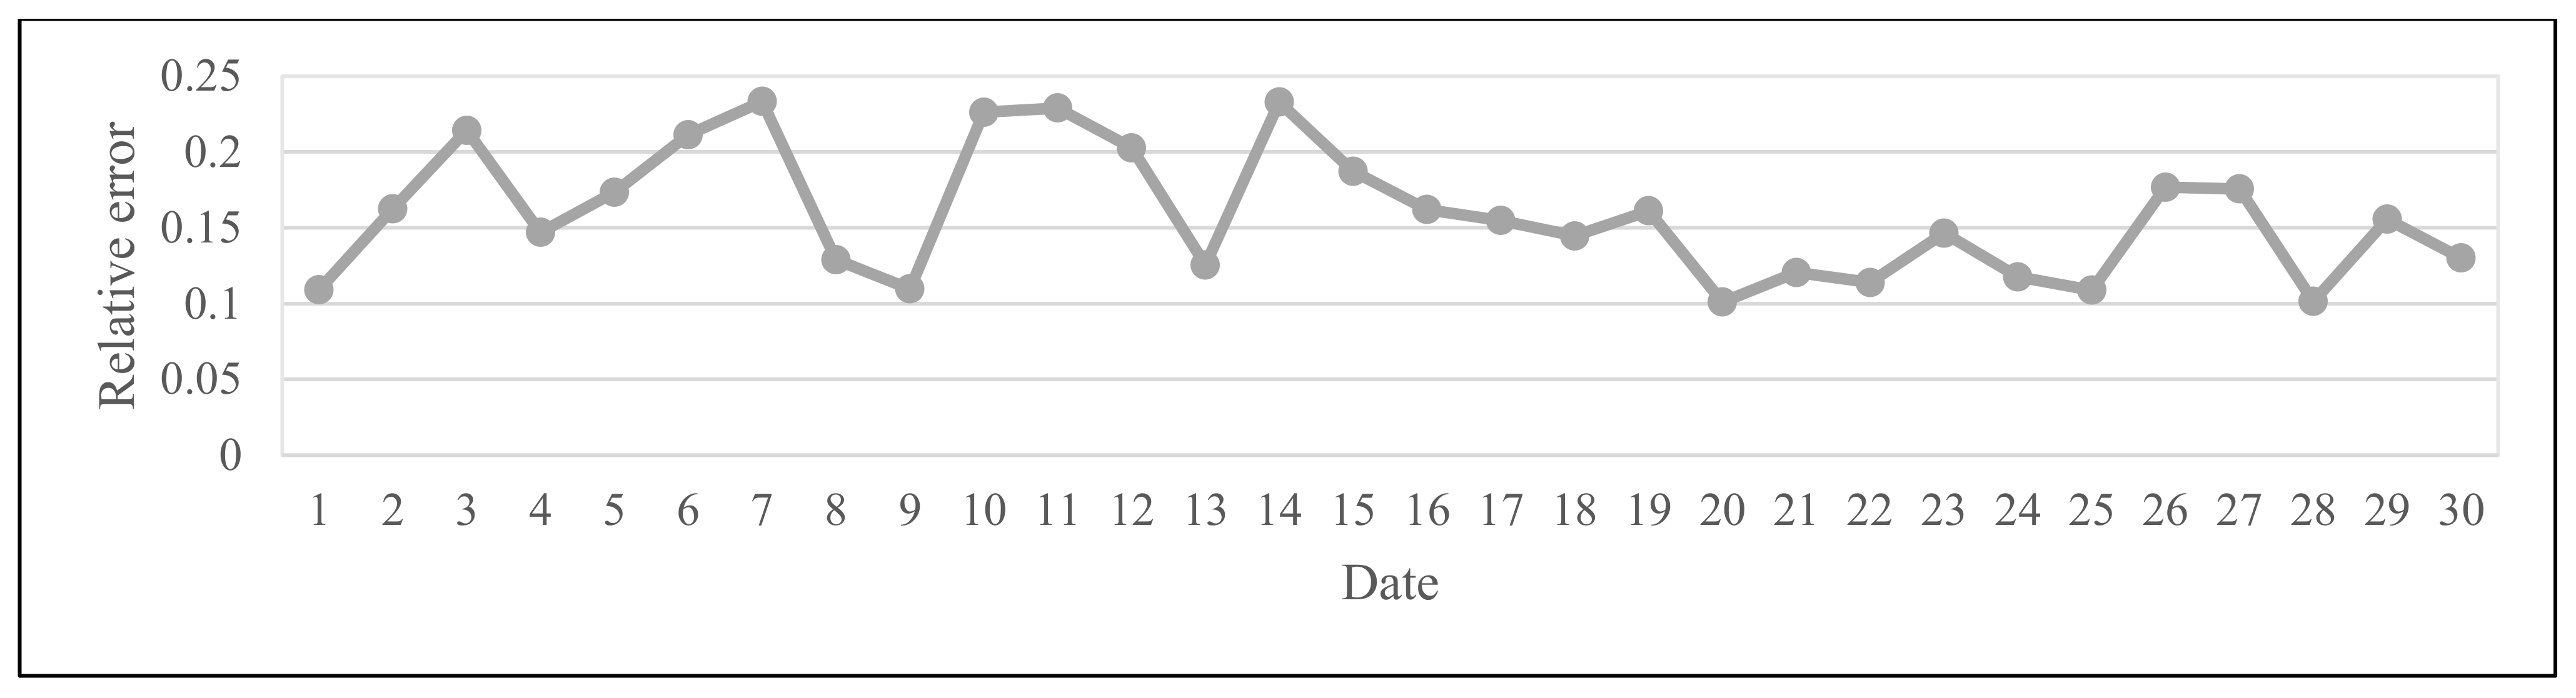
| Date | April 1 | April 2 | April 3 | April 4 | April 5 | April 6 | April 7 | April 8 | April 9 |
| RE | 0.1091 | 0.1625 | 0.2142 | 0.1470 | 0.1734 | 0.2114 | 0.2333 | 0.1289 | 0.1097 |
| Date | April 10 | April 11 | April 12 | April 13 | April 14 | April 15 | April 16 | April 17 | April 18 |
| RE | 0.2262 | 0.2290 | 0.2027 | 0.1254 | 0.2329 | 0.1872 | 0.1620 | 0.1548 | 0.1446 |
| Date | April 19 | April 20 | April 21 | April 22 | April 23 | April 24 | April 25 | April 26 | April 27 |
| RE | 0.1612 | 0.1011 | 0.1205 | 0.1139 | 0.1464 | 0.1176 | 0.1088 | 0.1767 | 0.1756 |
| Date | April 28 | April 29 | April 30 | May 1 | May 2 | May 3 | May 4 | May 5 | May 6 |
| RE | 0.1014 | 0.1556 | 0.1301 | 0.1778 | 0.2072 | 0.2248 | 0.1470 | 0.1235 | 0.1862 |
| Date | May 7 | May 8 | May 9 | May 10 | May 11 | May 12 | May 13 | May 14 | May 15 |
| RE | 0.1692 | 0.2379 | 0.2152 | 0.1855 | 0.1012 | 0.2121 | 0.1032 | 0.1896 | 0.1529 |
| Date | May 16 | May 17 | May 18 | May 19 | May 20 | May 21 | May 22 | May 23 | May 24 |
| RE | 0.1371 | 0.2294 | 0.1563 | 0.1272 | 0.1616 | 0.1369 | 0.1943 | 0.1391 | 0.2316 |
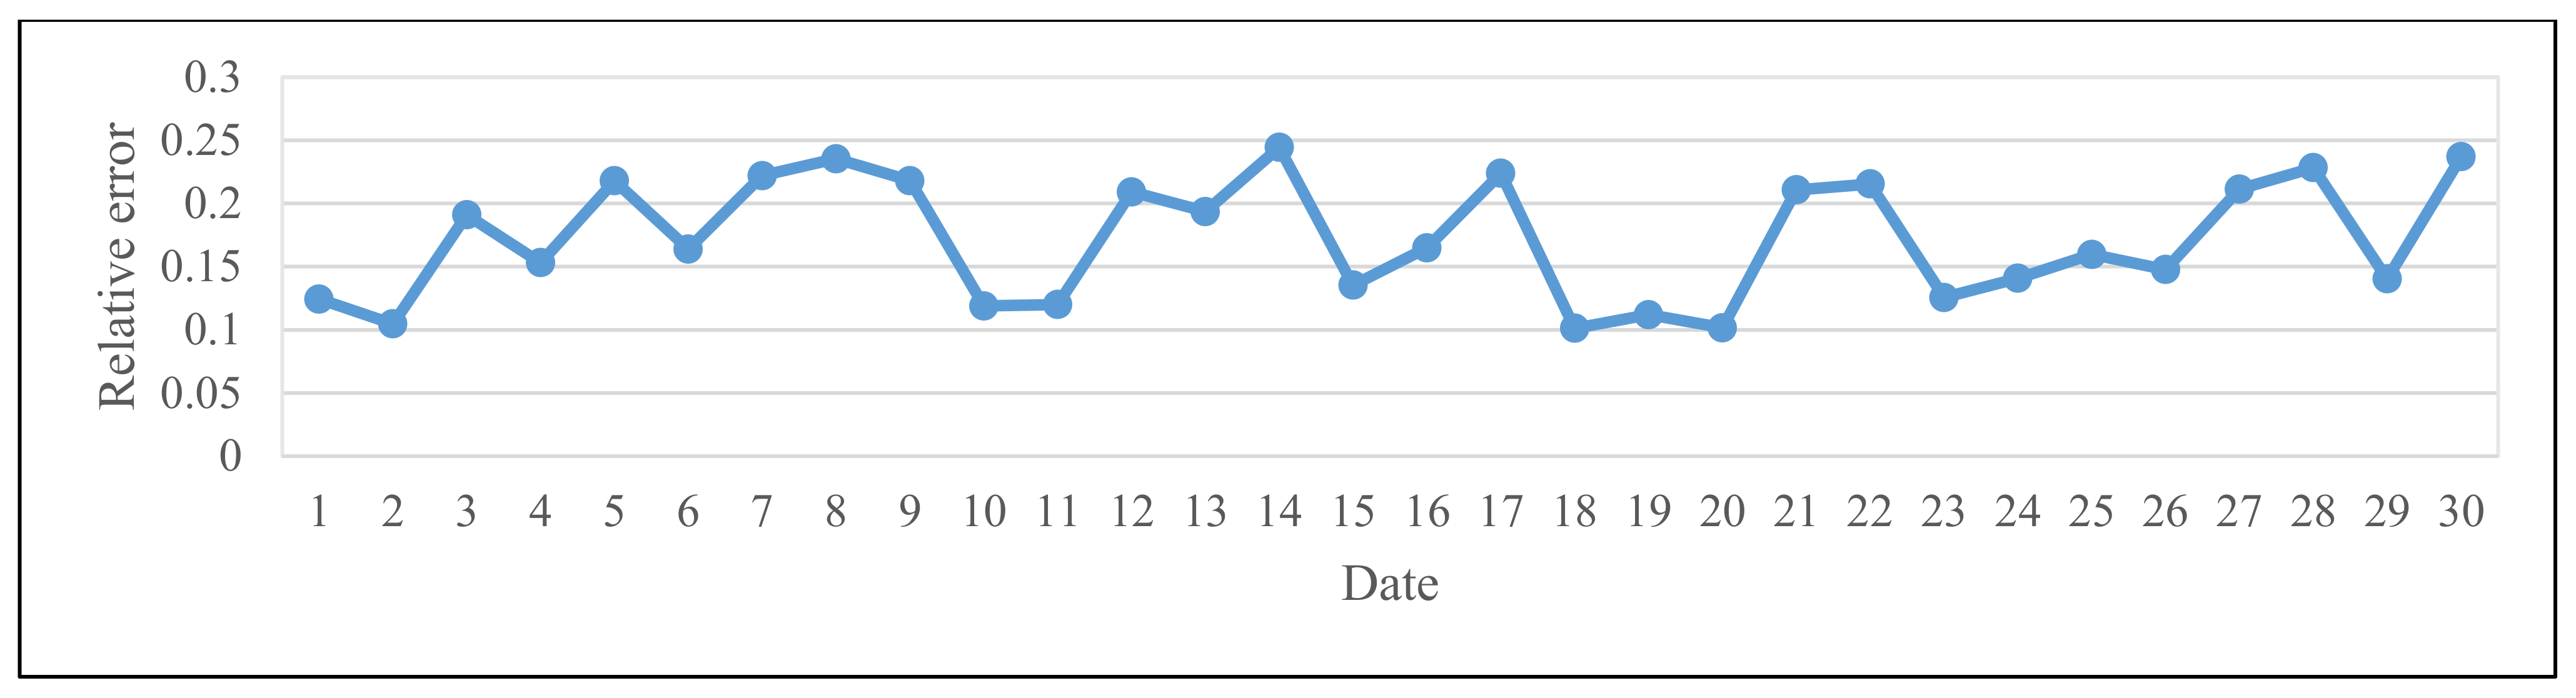
| Date | May 25 | May 26 | May 27 | May 28 | May 29 | May 30 | May 31 | June 1 | June 2 |
| RE | 0.1248 | 0.1354 | 0.1238 | 0.2109 | 0.1152 | 0.1405 | 0.1278 | 0.1243 | 0.1047 |
| Date | June 3 | June 4 | June 5 | June 6 | June 7 | June 8 | June 9 | June 10 | June 11 |
| RE | 0.1910 | 0.1531 | 0.2179 | 0.1639 | 0.2220 | 0.2353 | 0.2180 | 0.1189 | 0.1200 |
| Date | June 12 | June 13 | June 14 | June 15 | June 16 | June 17 | June 18 | June 19 | June 20 |
| RE | 0.2091 | 0.1935 | 0.2445 | 0.1353 | 0.1649 | 0.2239 | 0.1012 | 0.1120 | 0.1016 |
| Date | June 21 | June 22 | June 23 | June 24 | June 25 | June 26 | June 27 | June 28 | June 29 |
| RE | 0.2108 | 0.2154 | 0.1255 | 0.1407 | 0.1597 | 0.1477 | 0.2113 | 0.2283 | 0.1403 |
| Date | June 30 | ||||||||
| RE | 0.2369 |
Publisher’s Note: MDPI stays neutral with regard to jurisdictional claims in published maps and institutional affiliations. |
© 2022 by the authors. Licensee MDPI, Basel, Switzerland. This article is an open access article distributed under the terms and conditions of the Creative Commons Attribution (CC BY) license (https://creativecommons.org/licenses/by/4.0/).
Share and Cite
Zhu, L.; Yan, M.; Bai, L. Prediction of Enterprise Free Cash Flow Based on a Backpropagation Neural Network Model of the Improved Genetic Algorithm. Information 2022, 13, 172. https://doi.org/10.3390/info13040172
Zhu L, Yan M, Bai L. Prediction of Enterprise Free Cash Flow Based on a Backpropagation Neural Network Model of the Improved Genetic Algorithm. Information. 2022; 13(4):172. https://doi.org/10.3390/info13040172
Chicago/Turabian StyleZhu, Lin, Mingzhu Yan, and Luyi Bai. 2022. "Prediction of Enterprise Free Cash Flow Based on a Backpropagation Neural Network Model of the Improved Genetic Algorithm" Information 13, no. 4: 172. https://doi.org/10.3390/info13040172
APA StyleZhu, L., Yan, M., & Bai, L. (2022). Prediction of Enterprise Free Cash Flow Based on a Backpropagation Neural Network Model of the Improved Genetic Algorithm. Information, 13(4), 172. https://doi.org/10.3390/info13040172