Article

Data Quality Barriers for Transparency in Public Procurement

1
Department of Computer Science, OsloMet—Oslo Metropolitan University, 0166 Oslo, Norway
2
Department of Artificial Intelligence, Universidad Politécnica de Madrid, 28040 Madrid, Spain
3
Software and Service Innovation, SINTEF AS, 0373 Oslo, Norway
4
Centre for Knowledge Transfer in Information Technologies, Jožef Stefan Institute, 1000 Ljubljana, Slovenia
5
Ministry of Public Administration, Government of Slovenia, 1000 Ljubljana, Slovenia
6
OpenOpps Ltd., London SW1P 2PD, UK
7
OpenCorporates Ltd., London N3 1LF, UK
8
Department of Informatics, King’s College London, London WC2R 2LS, UK
*
Author to whom correspondence should be addressed.
Information 2022, 13(2), 99; https://doi.org/10.3390/info13020099
Submission received: 4 January 2022 / Revised: 16 February 2022 / Accepted: 17 February 2022 / Published: 20 February 2022
(This article belongs to the Topic Digital Transformation and E-Government)

Abstract

:
Governments need to be accountable and transparent for their public spending decisions in order to prevent losses through fraud and corruption as well as to build healthy and sustainable economies. Open data act as a major instrument in this respect by enabling public administrations, service providers, data journalists, transparency activists, and regular citizens to identify fraud or uncompetitive markets through connecting related, heterogeneous, and originally unconnected data sources. To this end, in this article, we present our experience in the case of Slovenia, where we successfully applied a number of anomaly detection techniques over a set of open disparate data sets integrated into a Knowledge Graph, including procurement, company, and spending data, through a linked data-based platform called TheyBuyForYou. We then report a set of guidelines for publishing high quality procurement data for better procurement analytics, since our experience has shown us that there are significant shortcomings in the quality of data being published. This article contributes to enhanced policy making by guiding public administrations at local, regional, and national levels on how to improve the way they publish and use procurement-related data; developing technologies and solutions that buyers in the public and private sectors can use and adapt to become more transparent, make markets more competitive, and reduce waste and fraud; and providing a Knowledge Graph, which is a data resource that is designed to facilitate integration across multiple data silos by showing how it adds context and domain knowledge to machine-learning-based procurement analytics.

1. Introduction

Public procurement is a business impacting the lives of millions. Globally governments spend trillions of dollars a year on public contracts for goods, services, and works (https://www.open-contracting.org/what-is-open-contracting/global-procurement-spend/ (accessed on 19 February 2022)); for example, public authorities in the European Union (EU) spend around 14% of GDP every year (https://ec.europa.eu/growth/single-market/public-procurement_en (accessed on 19 February 2022)). A market of such a size has substantial challenges, such as delivering quality services with greatly reduced budgets; preventing losses through fraud and corruption; and building healthy and sustainable economies. Even a small percentage of cost increase can easily have a massive impact. Particularly, identifying fraud in public tendering is a major struggle; the Organisation for Economic Co-operation and Development (OECD) estimates that a vast majority of these cases remain undetected across all OECD countries [1]. The Economist reported in 2016 about instances of corruption in EU public procurement processes, citing a case in Spain worth EUR 120 million and a Romanian case where EUR 50 million worth of bribes were allegedly received for awarding software contracts (https://www.economist.com/europe/2016/11/19/rigging-the-bids (accessed on 19 February 2022)). A study by RAND Europe reports the costs of corruption in EU public tendering as high as EUR 990 billion a year (https://www.politico.eu/article/corruption-costs-eu-990-billion-year-rand-study-fraud-funding/ (accessed on 19 February 2022)). In this respect, making government work more transparent and accountable is one of the major instruments that can be used by governments to increase the level of responsibility of public office holders for their decisions and for a better use of public finances [2,3].
The ever-growing need for enhanced transparency and accountability leads to a pressing need for better insight into and management of government spending, requiring data and tools to analyse and oversee such a complex process. An open approach combined with data management and advanced analytics plays a critical role in this respect [4]; therefore, there are increasingly more regulations pushing public entities to publish information on their processes for procurement (e.g., EU Public Sector Information Directive and the Data Governance Act). Improving the accessibility to procurement data, by publishing the underlying data openly for everyone to access and use, contributes to a more informed public debate and allows communities to deal with the illegal management and use of functions, systemic corruption, unfair competitiveness, and clientelism. However, there are several challenges to be addressed, including the following [5]:
  • Data heterogeneity including structured data (e.g., statistics and financial records) as well as unstructured data (e.g., text and social media content) sources in various languages with their own vocabulary and formats, such as PDFs, APIs, CSVs, and databases;
  • Transforming this large and heterogeneous set of data sources into an interconnected knowledge organisation structure using standardised vocabularies and sustainable knowledge integration and sharing approaches, which could be analysed in depth to detect patterns and anomalies.
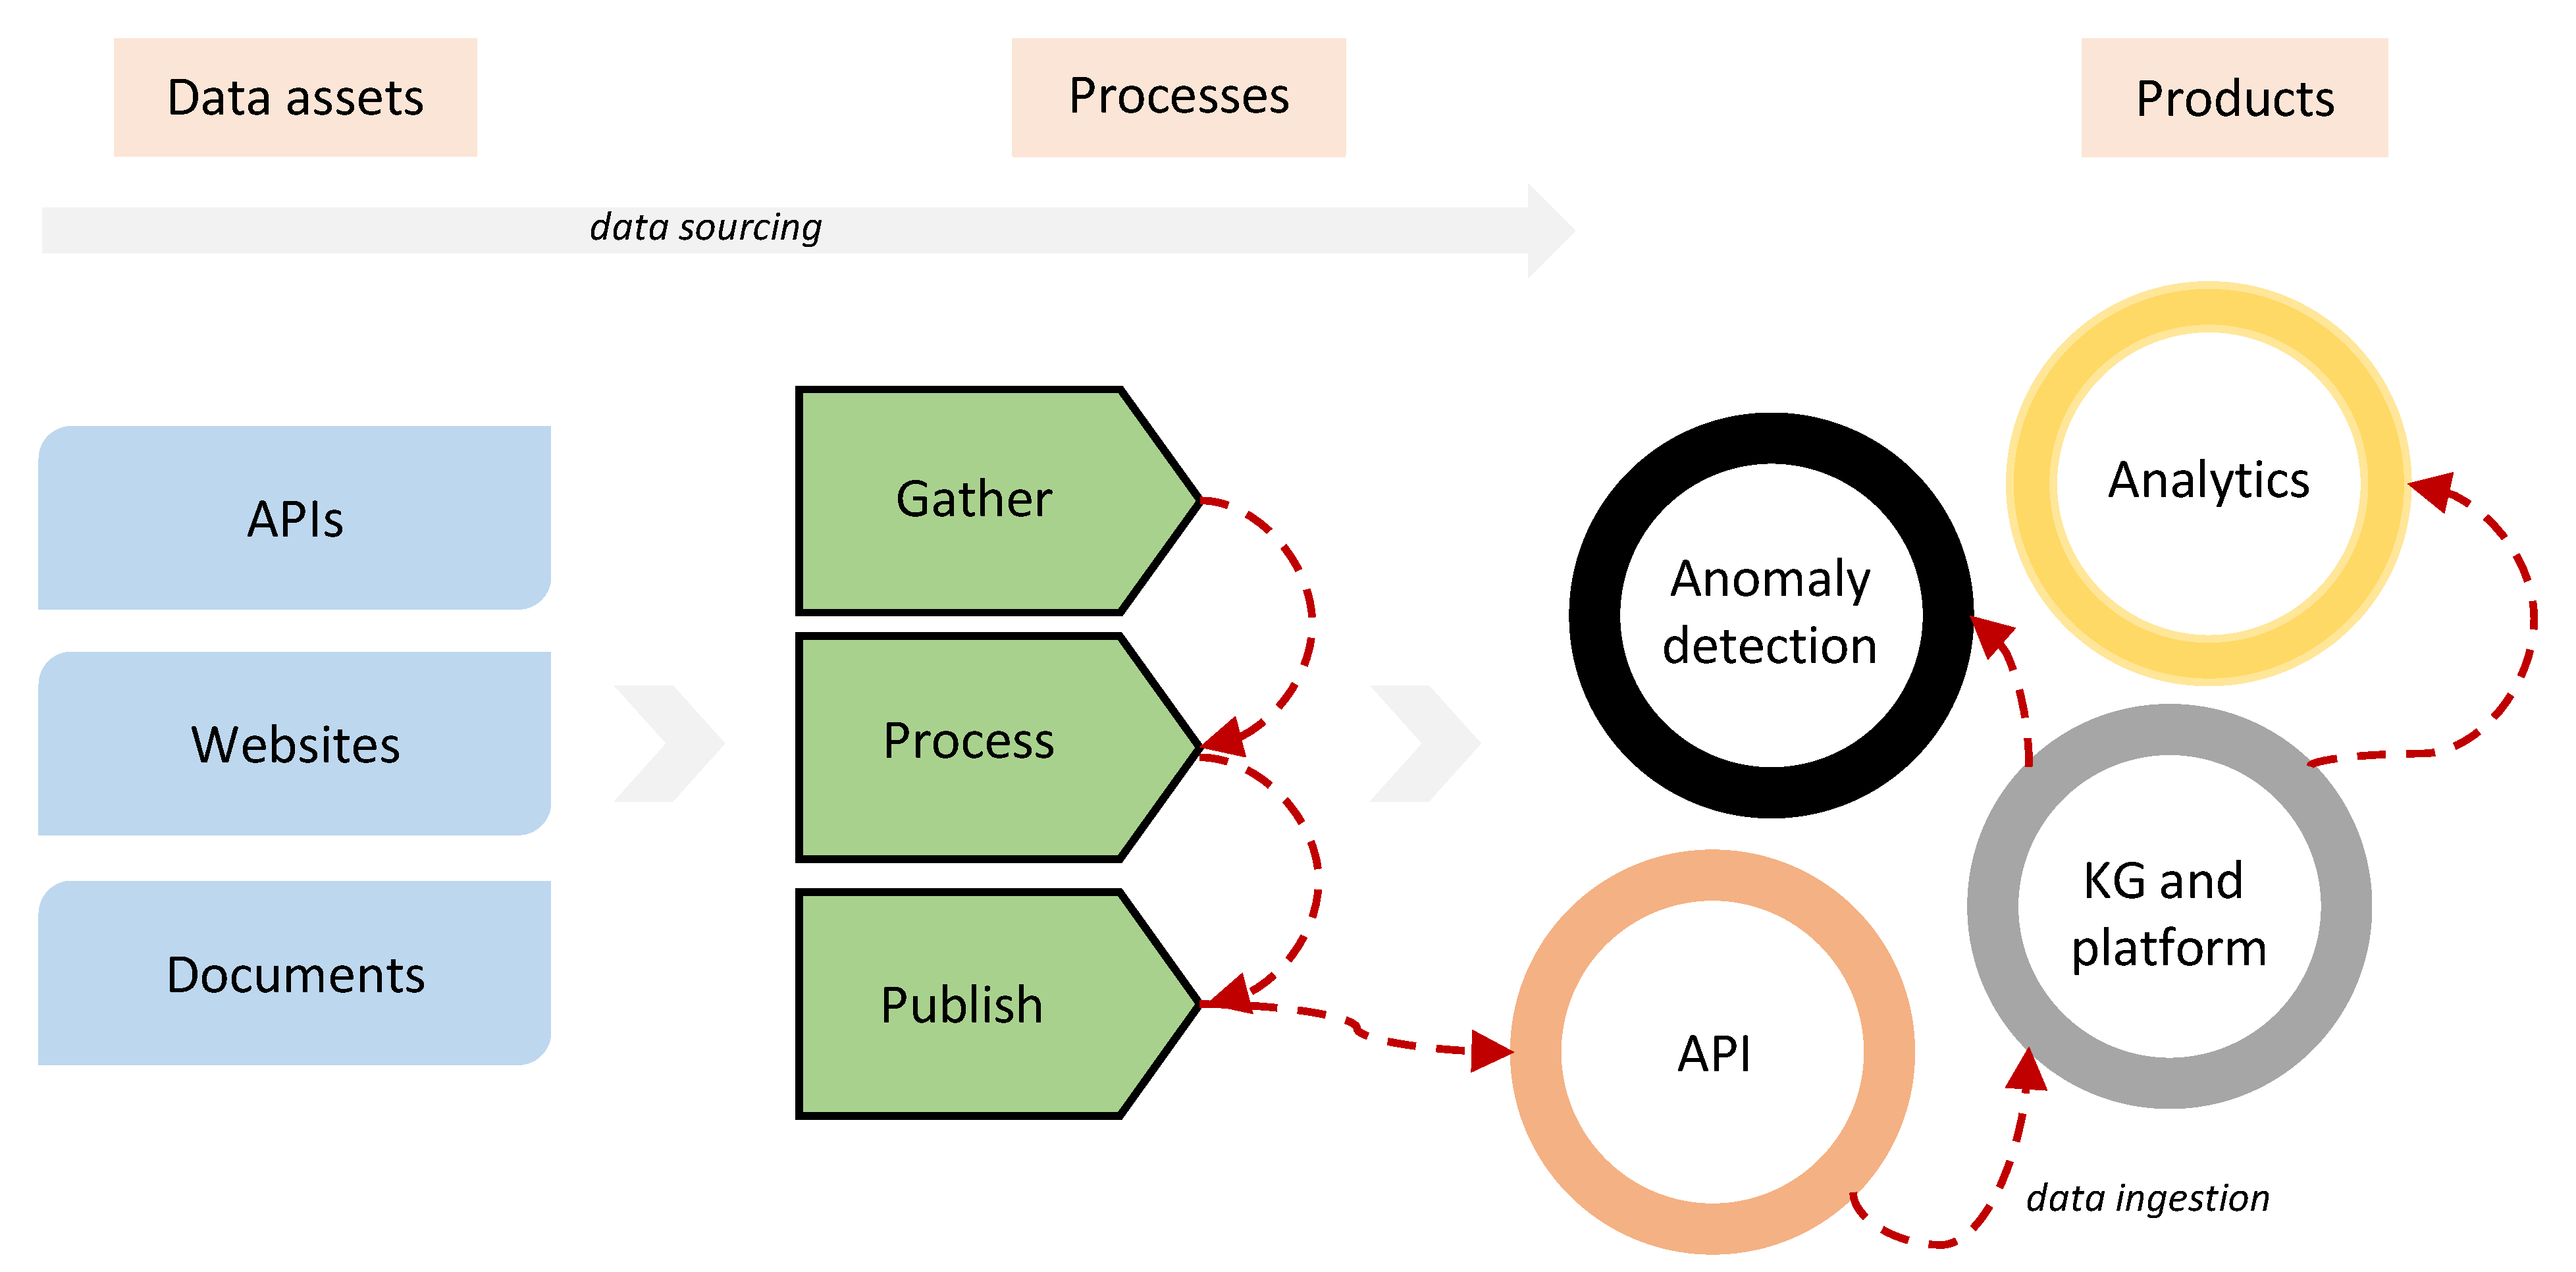
Our expectation is that it will be possible for governments, companies, data journalists, transparency activists, and regular citizens to identify fraud or uncompetitive markets by connecting heterogeneous data sources, which are currently created and maintained in siloes, and publishing them openly [6,7]. Existing solutions come with major limitations including missing relevant data of sub-par quality or hardly accessible data and rudimentary technologies and tools for decision makers with limited capabilities and actionable insight [5]. For instance, a specific mechanism called buyer profile (e.g., Directive 2014/24/EU8) was created through some European directives requiring all public-sector entities to publish notices concerning contracts announced for tendering. This included contract notice (explaining the requirements of the contract and inviting businesses to compete), the award notice, and the formalisation notice. In consequence, the distributed buyer profiles of every single public sector authority have become a central information hub for companies and citizens interested in the area of public procurement [8]. However, due to considerable technical and functional differences and interoperability problems between the profiles of different public authorities, the adoption of buyer profiles has been drastically constrained. Therefore, integration and processing of the information published through these entities became a major challenge. Consequently, even seemingly straightforward tasks, such as aggregating the total income of a company across all public authorities in Europe, are very hard to execute. One of the solutions that is being adopted to ameliorate this heterogeneity problem consists in forcing all public authorities to publish on a single website [9]. For instance, in Spain, this is happening with the Public Sector Contracting Platform (PCSP). In the UK, a similar approach has been taken, where the new Contracts Finder service is used as a central hub for public data, and a new law has been passed requiring local authorities to use publication services. These and similar solutions only have a limited impact in terms of meeting the minimum needs for competitive tendering, since it would be sufficient to publish a limited set of announcements. However, transparency and accountability require giving citizens and companies much more data with the possibility of easily connecting relevant data sets (e.g., spending and company data), both within and beyond national borders and languages, allowing extended and deeper analyses. To this end, in this article, we present a case where we applied a number of anomaly detection techniques over a set of integrated open data sets including procurement, company, and spending data of Slovenia. This has been realised through a platform we developed, TheyBuyForYou [10,11], for integrating, curating, and publishing cross-border and cross-language procurement data and related data sets into a Knowledge Graph (KG). A KG is an interconnected semantic knowledge organisation structure [12], using the Semantic Web and linked data approach and technologies [13]. Semantic Web aims at providing well-defined meaning to the information on the Web through a set of standards and technologies. Linked data is a fundamental part of the Semantic Web, and it is concerned with the integration of large scale and interrelated data sets on the Web (https://www.w3.org/standards/semanticweb/ (accessed on 19 February 2022)). In addition to the anomaly detection case, we used the platform and resulting KG in several business scenarios including public and private stakeholders [11]. Based on our experience gained through the construction and use of the platform and KG, we elaborate on a set of guidelines for publishing high quality procurement data allowing advanced procurement analytics, since there are significant shortcomings in the quality of data being published. The key elements of the approach includes the following:
(a)
Data sourcing: gathering, enriching, and curating (i.e., including classification according to common vocabularies, resolving mismatches at schema level, and deduplication) procurement data across EU countries from several different primary sources;
(b)
Tackling with heterogeneity: data mapping, transformation, and publication with respect to common vocabularies and standards and entity reconciliation for linking data sets through common, but originally disconnected, entities;
(c)
Cross-lingual matching and pattern mining: matching contracts and company profiles across multiple languages and identifying spending patterns across data sets from different sources.
We used a mix of qualitative and quantitative methods to collect and categorise findings. Our data providers are among the largest providers for open company and procurement data and they have been gathering experiences as part of their businesses over years. They have been analysing their data using various AI/ML techniques to detect, categorise, and quantify data quality problems. We categorised findings of our data providers with respect to known categories of data quality issues over an extended period of time through face-to-face and remote meetings. Secondly, by a construction of KG and using it in different real-life cases, while in this article anomaly detection is presented as the focus case, we observed and categorised general data quality issues.
The rest of the article is structured as follows. Section 2 presents the related initiatives and work, while Section 3 describes procurement data sourcing. Section 4 presents TheyBuyForYou platform and KG, while Section 5 describes techniques and examples for anomaly detection based on the resulting KG and platform. Section 6 puts forward a set of guidelines for procurement data publishers; finally, Section 7 concludes the article.

2. Related Work

In what follows, we review the related work from several dimensions including notable transparency initiatives, procurement platforms for public procurement in general and major data standards for electronic procurement.

2.1. Public Procurement Transparency Initiatives

The Open Contracting Partnership (https://www.open-contracting.org (accessed on 19 February 2022)) is an international initiative originally emerged from the collaboration of the World Bank Institute (https://www.worldbank.org (accessed on 19 February 2022)) and the German Agency for International Cooperation and Development, GIZ (https://www.giz.de (accessed on 19 February 2022)). It promotes increased disclosure and widespread participation in public contracting, covering the entire contracting chain from planning to finalisation of contract obligations, including tendering and performance. Open Contracting Partnership promotes high-level policies for an increased, standardised disclosure of contracting data and argues for a smarter, more strategic use of such data. The Open Contracting Data Standard (OCDS) (https://standard.open-contracting.org (accessed on 19 February 2022)) is a core product of the Open Contracting Partnership. Version 1.0 was developed for the Open Contracting Partnership by the World Wide Web Foundation (https://webfoundation.org (accessed on 19 February 2022)), through a project supported by the Omidyar Network (https://omidyar.com (accessed on 19 February 2022)) and the World Bank Institute. Ongoing development is managed by the Open Data Services Co-operative (https://opendataservices.coop (accessed on 19 February 2022)) under a contract to the Open Contracting Partnership.
OpenOwnership (https://www.openownership.org (accessed on 19 February 2022)) is a civil-society-led project to create a global beneficial ownership register, led by leading anticorruption non-governmental organisations (e.g., Transparency International, Global Witness, ONE, B-Team, Open Contracting Partnership, and Open Government Partnership) and OpenCorporates (https://opencorporates.com (accessed on 19 February 2022)). The pilot for the register was launched in March 2017 and funded by the UK government’s Department for International Development, and it provides a platform that aggregates public beneficial ownership data (initially from the UK’s PSC register, the Slovakia Public Sector Partners Register, and the EITI Beneficial Ownership Pilots) and allows companies to disclose their own beneficial ownership.

2.2. Procurement Platforms

Public procurement platforms are, to a large extent, adopted from private sector, with little attention for key considerations, such as integration, interoperability, accountability, and transparency. For this reason, such platforms are often not a good fit for use in the public domain. They come with restrictive contracts and introduce unnecessary complications for publishing open data. An example in this context is Dun & Bradstreet (https://www.dnb.co.uk (accessed on 19 February 2022)) using proprietary identifiers (DUNS ID) for all government suppliers. This means that data cannot be reused without a subscription to Dun & Bradstreet, which is a considerable barrier particularly for data integration supporting advanced analytic processes (e.g., anomaly detection). Some other portals claim ownership and copyright on the public tender data published, even though the data are authored by their public-sector clients and are required to be published openly according to the law. There is a large technical heterogeneity involved for managing public contracts, which are handled using a variety of tools and formats across cities and even departments within the same public body. These include spreadsheets, databases, and Lotus Notes. As a result, it becomes a challenge to establish a high-level overview of the processes and decisions through harnessing the procurement data collectively. Proprietary data formats and restrictive contracts lock governments to specific suppliers and make it much harder to change to alternative suppliers or create their own solutions. This increases the costs, limits citizens, and makes comparing different suppliers more difficult (https://www.nao.org.uk/report/efficiency-and-reform-in-government-corporate-functions-through-shared-service-centres (accessed on 19 February 2022)). In the EU, as a response to these challenges, Tenders Electronic Daily (TED) (https://ted.europa.eu (accessed on 19 February 2022)) emerged. It is the official European portal for public procurement providing multilingual data. However, tenders below a certain threshold are often not published and data are poorly structured, incomplete, and insufficiently robust for much of the advanced analyses.

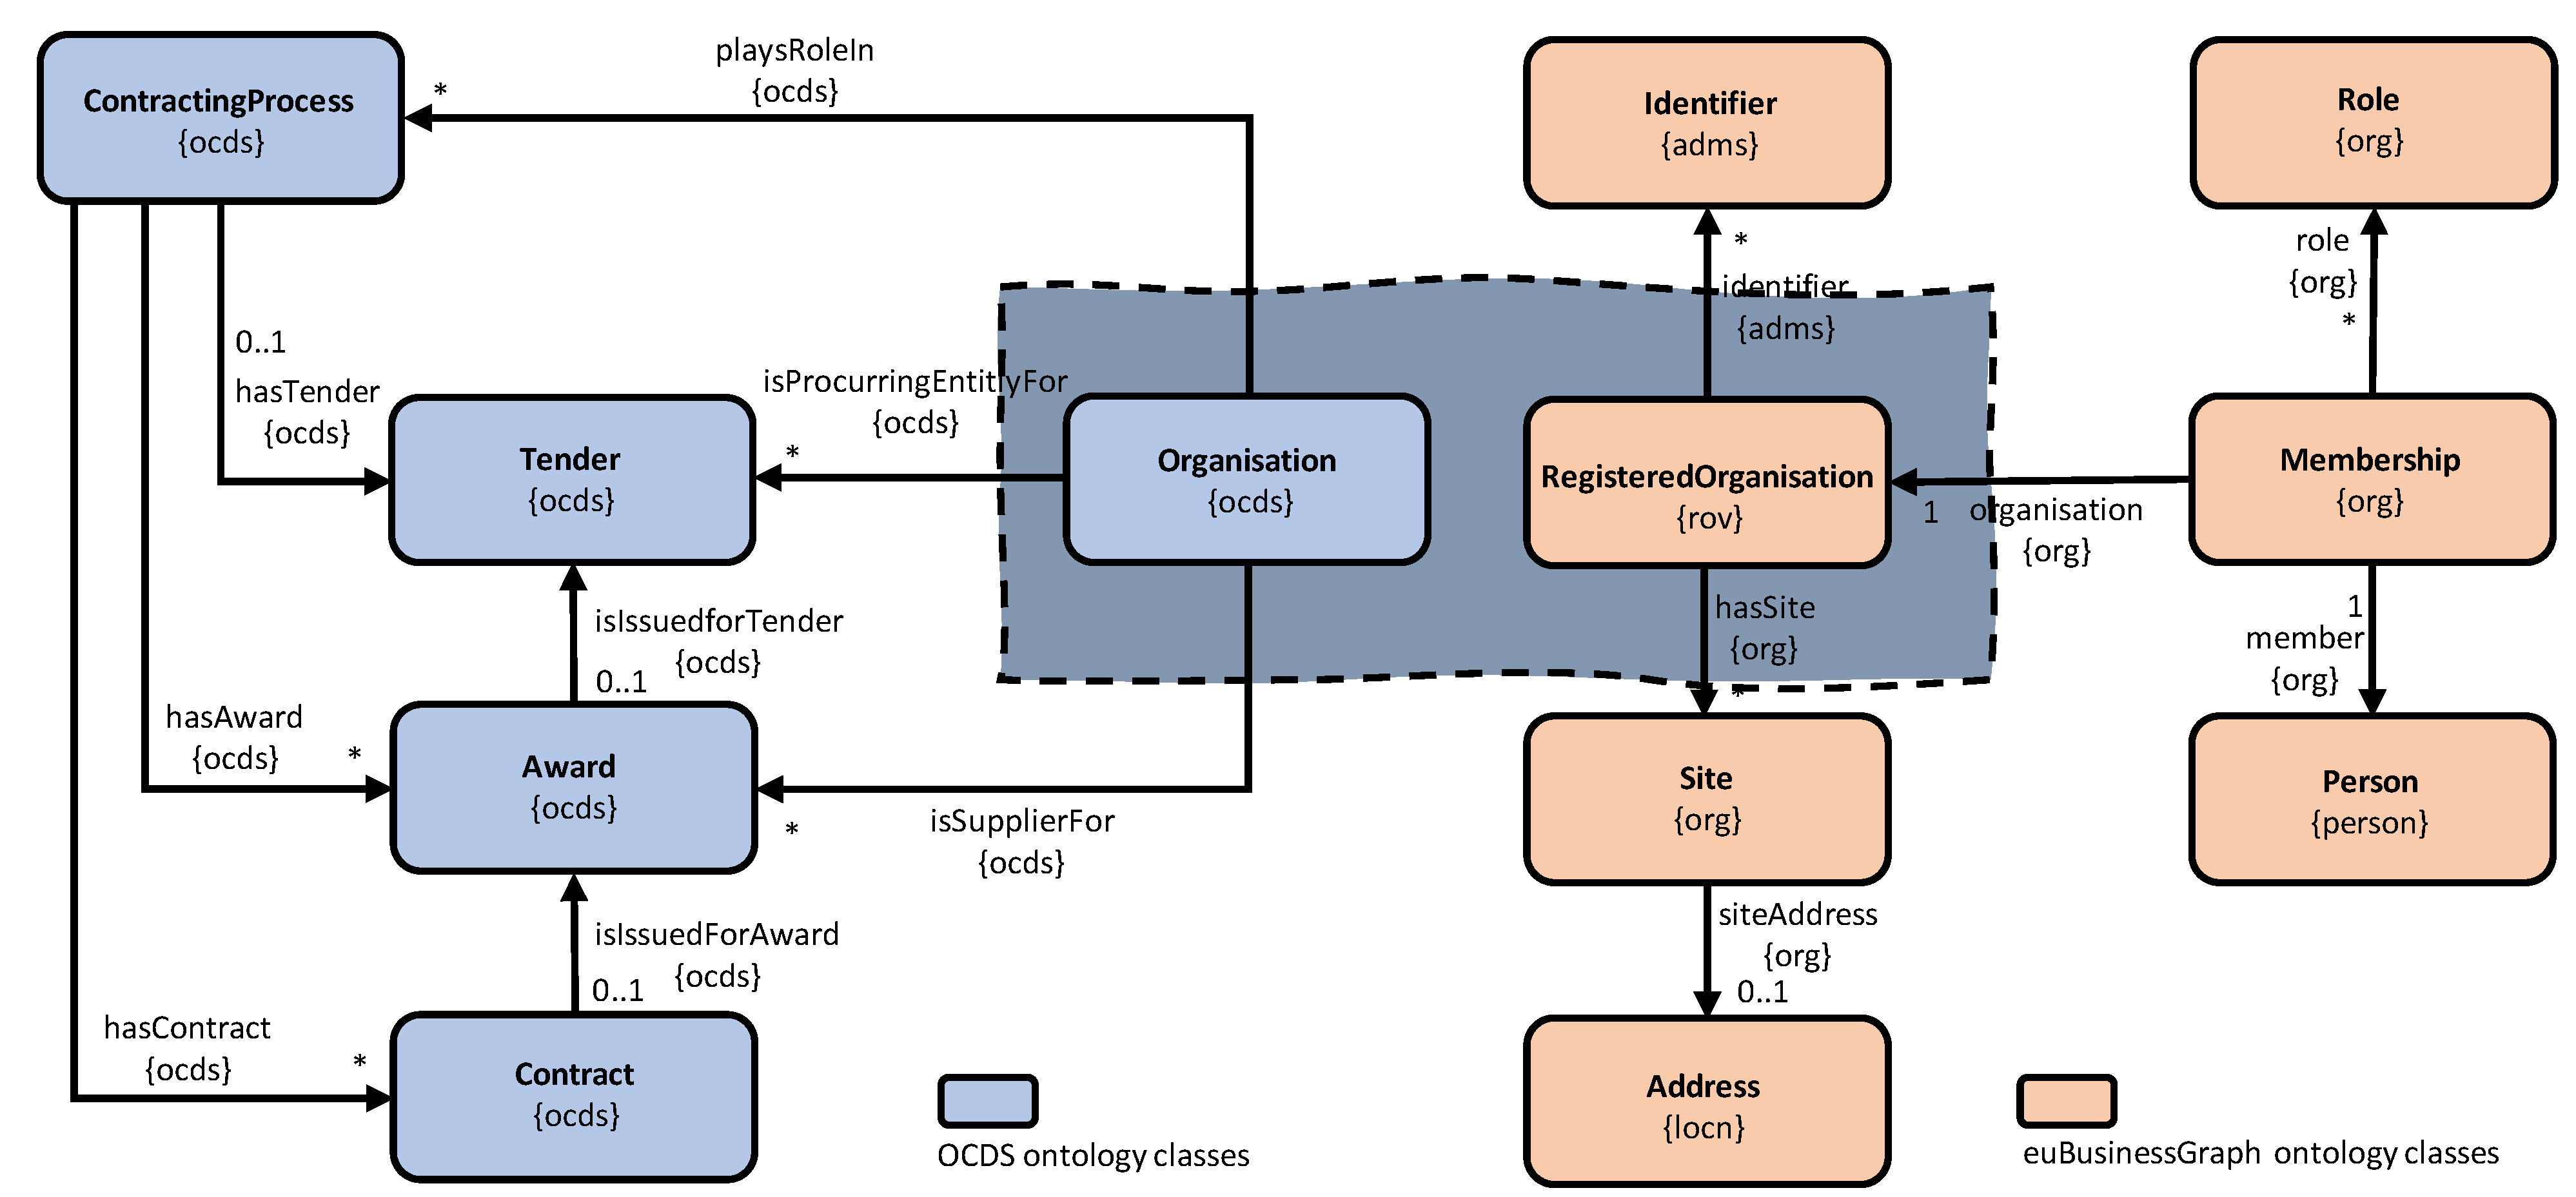
2.3. Procurement Data Models and Ontologies

Several initiatives exist for creating de jure and de facto data standards for electronic procurement. These include among others OpenPEPPOL (https://peppol.eu/about-openpeppol (accessed on 19 February 2022)), CEN BII, TED eSenders (https://simap.ted.europa.eu/web/simap/sending-electronic-notices (accessed on 19 February 2022)), CODICE (https://contrataciondelestado.es/wps/portal/codice (accessed on 19 February 2022)), and OCDS. These standards define vocabularies, data formats, and file formats for structuring the messages exchanged by the various agents involved in electronic procurement. They are mostly developed for interoperability purposes, which includes achieving communication between systems. For this reason, they are usually oriented to the type of information that is transmitted between the organisations involved. The structure of information is commonly provided by the content of the documents that are exchanged, and there are no generalised standardised practices for referring to third parties, companies participating in the process, or even the main object of contracts. In sum, they still generate a significant level of heterogeneity.
Since 2012, approaches based on Semantic Web technologies emerged in order to alleviate the issues presented. The Semantic Web initiative provides standards and technologies for providing information with a well-defined meaning and facilitating its representation, exchange, and reuse [14]. Ontologies play an essential role within the Semantic Web; an ontology captures and formalises rich domain knowledge by using commonly agreed vocabularies in a logic-based framework supporting automated reasoning [15]. Ontology-based approaches in public procurement include PPROC ontology [8] for describing public processes and contracts, LOTED2 ontology [16] for public procurement notices, PCO ontology [17] for contracts in public domain, and MOLDEAS ontology [18] for announcements about public tenders. Finally, there is also eProcurement ontology, which is under development and supported by the European Commission. LOTED2 was developed as a legal ontology and compared to PPROC and MOLDEAS, PCO is more extensive and complex. PPROC was developed with the goal of setting a balance between usability and expressiveness. Currently, none of the proposed ontologies have a wide adoption in the procurement domain.

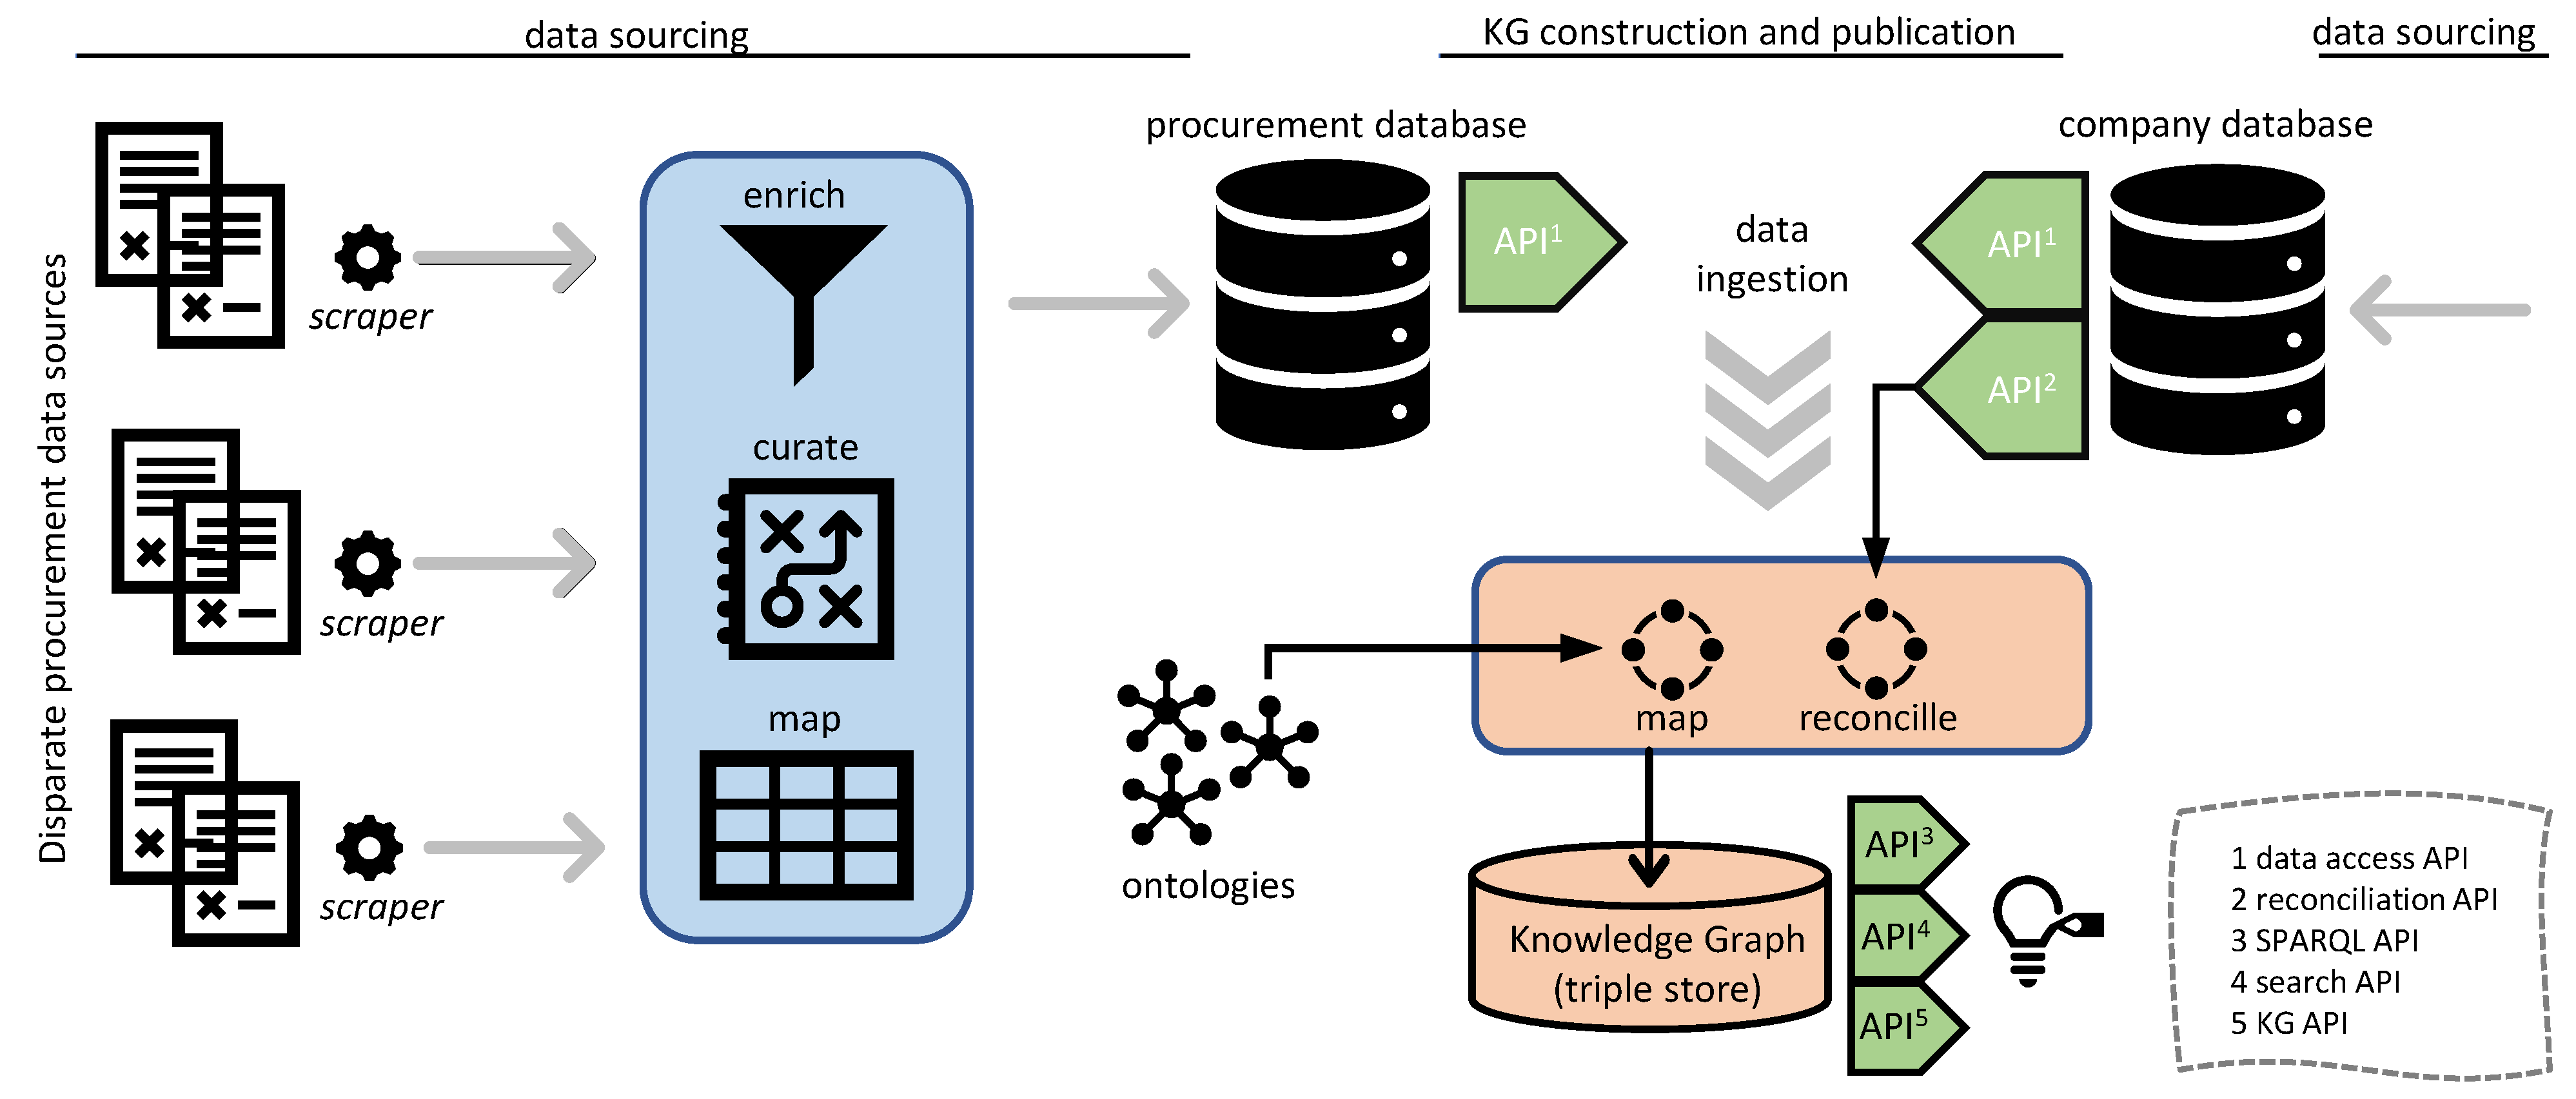
3. Procurement Data Sourcing

Advertising is a key instrument of any procurement process, since it ensures competitiveness and transparency [19]. As discussed earlier, various national and international portals publish notices (tender, award, etc.) related to contracting processes. Data disclosed through such notices often suffer from data quality issues and buyers publish the same data often for the purpose of transparency in different portals. Therefore, the processes of gathering, processing, enriching, and curating these independently published data sets are crucial before any large scale integration and analytic processes can take place.
Partly in the context of the work presented here, OpenOpps (https://openopps.com (accessed on 19 February 2022)), the largest data source of European tenders and contracts in the world, sourced core TED data as well as thousands of daily notices from local, regional, and national portals around the EU. The data include details on buyers, suppliers (for contracts), titles, descriptions, values, and categories. The number of data sources is more than 680 globally and over 560 for Europe—see Table 1. Over 400 different scripts were used to gather data from each source by performing Web scraping. These scripts are deployed on a monitored platform and triggered on a daily basis to collect all documents published in the last twenty-four hours. The platform checks the status of scripts against failures and sources against potential changes (e.g., published fewer than expected documents). All scripts are maintained regularly, establishing a consistent flow of high-quality data. As data are gathered, it is stored in a raw form, formatted and cleansed, and then mapped to the OCDS. Mapping involves reallocating a source field to an equivalent field that is defined in OCDS. Data are processed as needed, such as by splitting single records into two fields, so as to comply with the data standard. This mapping process allows publishing data in a consistent format regardless of the format used by the source provider. The data sourcing process is depicted in Figure 1 in relation to KG, platform, and related products.
Currently, data are published openly, over 6 GBs, on Zenodo (https://doi.org/10.5281/zenodo.3712322 (accessed on 19 February 2022)) under Open Database License (ODbl) (https://opendatacommons.org/licenses/odbl (accessed on 19 February 2022)) starting from January 2019, with a monthly update.

3.1. Data Sourcing Process

In order to collect data, we deploy scrapers for each source. This requires setup time to configure the scraper and deploy core tools to initially manage the raw data collected, such as text conversion and HTML stripping. The scrapers collect data based on the site’s structure at the time of the scraper’s creation; a website change will affect the operation of the scraper. This means that scrapers require regular monitoring and maintenance to ensure a steady data stream. Scrapers are run with due consideration for the resources of the publisher, e.g., by not using open string searches and timing data collection. Each scraper has a unique table for its data. Data are gathered using Python and are processed through code that is run using dynamic machines and configuration on the AWS platform. The launcher script triggers each scraper, which collects data before it is stored and subsequently mapped in PostgreSQL. Attachments are stored on an Amazon S3 bucket. Data are then validated, copied, and indexed for use in Elastic Search indexes and published through an API (see Figure 1), which is later used to ingest data from the resulting procurement database to KG.
Each record is validated before being served into the Elastic Search indexes and thence to the API. This strict regime of checks allows us to ensure that our data meets the required standards, but also gives us critical information on the performance of data gathering tools, e.g., the ratio between documents gathered and documents that are published gives an indication on whether a scraper is working properly. At the time of mapping data to OCDS, each record is validated in the following manner:
  • A minimum number of fields need to be present in a record for it to be a viable record. For instance, a buyer name, a title, and a tender deadline date are required for tenders.
  • Relative fields need to be structured. This is particularly important for date fields, and source strings must be able to be mapped to a date for us to use them.
  • The record needs to include viable data, e.g., which is the deadline date later than the current date. This allows us to provide only data that can be used by data consumers.
  • Every record is checked for OCDS compliance; this permits errors that may occur as a result of changes to the underlying HTML code when data are scraped.
We also monitor our entire pipeline constantly and conduct further monitoring on each step in the data harvesting process. Monitoring harvesting processes successfully can be difficult, sources may publish records intermittently, or an error may only impact a small number of records. We estimate the likely standard deviation for publishing in each source and check sources that deviate from the mean by greater than 20%.

3.2. Data Curation

The data curation process addresses several potential issues with the data, including missing data, duplicates, poorly formed data, erroneous data, and absent data (e.g., [20]), as discussed in what follows.

3.2.1. Missing Data

The number of mandated fields varies significantly in each data source, and the lack of standards in the source data means that data can frequently be missing. The fields value is completed only in less than 10% of tender notices and often ignored in the contract award notice fields. Therefore, in tender and contracting data, it is the least frequently completed field. Even where mandates are in place, buyers frequently provide value entries with zero for the sake of compliance and to avoid providing useful information. In other examples, we have found that wherever a field is not mandated, some publishers will not complete the data. In addition to values, frequently missing data include contract durations, contract end dates, contract awardees, contract awardee addresses, and contract status. The absence of titles and descriptions, particularly in contract award notices, is also common. An especially important data item for procurement transparency is the reference data linking a contract award with a tender notice. This problem appears often in data provided by TED, where each contract award notice has the option to provide an ID that links the award notice to the source tender. Our analysis suggest that only 9% of award notices provided an explicit link between tenders and contracts. Therefore, most of the contract award notices were “orphaned” with no link to source tenders.
Missing information is inferred if possible. For example, in the instance of a small and local source of data that does not publish the country name of the content, the country name is inferred on the basis that all of data are limited to a specific country. In the same manner, we record the date that we first discover a new record as the release date of that record in the absence of any release date. In some cases, we are forced to infer values, in particular, the use of monetary values that require a currency. Some national sources do not provide data on the currency in use; in this case, we default to the national currency. However, we recognise the frailty of this approach, as some buyers publish opportunities with a USD estimate, but without this being recorded in structured data, we may end up incorrectly recording the currency of a particular document.

3.2.2. Duplicates

The same notices are published in multiple sources frequently by publishers to meet the legal requirements imposed by the host country and the EU. For instance, Norwegian tenders must be published on Doffin (https://www.doffin.no (accessed on 19 February 2022)) and, when over the threshold, on TED. This should mean that all over threshold tenders are available at least twice. It is not a simple task to handle duplicates, since publishing platforms have different schema with no guarantee of interoperability. For instance, some sources restrict the number of characters in a title, and others do not. This can allow for an extensive text appearing in one source and a shorter text appearing in another source. Despite the obvious difference in the two documents, one is still effectively a duplicate of the other.
Very few of the duplicate records that we identified are actual duplicates with exact similarities between the documents. Therefore, we developed a series of tests to measure the likelihood of duplication. In the first instance, we extract a shortlist of features from each record and then run an algorithm to compare them. For efficiency, we limit the comparative analysis to a short window of time and our comparisons are also limited. Our first test is to determine whether the tender response deadline is the same, and different deadlines are assumed to be different documents even if the texts are exactly the same. We then use a Damerau–Levenshtein distance calculation to measure the distance between the buyer name and the title of each record, and those with a similarity score of over 95% were checked for description similarity based on the length of the shortest description. We take the length of the shortest description and compare the same amount of text from the longer description. Again, if we achieve a threshold score, we record the data as a duplicate. Once we identify a duplicate, we count the number of fields that contain data and define the record with the highest number of completed fields as the canonical source. Using a separate table, we list the canonical record and the duplicate record. Where multiple duplicates exist, we record each duplicate. No canonical record can already exist as a duplicate; thus, there is an additional lookup required to prevent duplicates from being flagged as canonical records.

3.2.3. Poorly Formed Data

In addition missing data, data providers often release data that are malformed or cannot be parsed reasonably. String values are provided frequently for the tender and contract value fields instead of numerical values. The use of character delimiters in value data is not consistent across sources. This is because different delimiters are used to separate numbers and to indicate decimals by different nationalities. In some cases, the use of delimiters is inconsistent within the actual data source, making the processing of the data almost impossible to correctly map. We also experienced poorly formed dates, with buyers having the option to enter dates as they wish; thus, long text dates can often be found (for instance, “The 15th of January, 2019” was published as the start date of a tender).
Where data were poorly formed, we record the source data in a native text format before attempting to transform the data at the point of mapping data to the OCDS, as far as possible. Our primary focus is date and value fields, which we attempt to cast to timestamps and floating values using Regex. Where there is a consistent format for data fields across the site, casting the data correctly is relatively simple. Where there is a mix of data formatting, the challenge is much greater. It is sometimes not possible to apply a single or conditional approach to converting the data to a consistent data type, and we have to make a decision to either exclude the field in the final output or to simply include the raw text in the mapped data.

3.2.4. Erroneous Data

One of the most problematic issues to manage is the occurrence of erroneous data. Again, structured data such as numeric and date records are frequently a problem here. In the UK, the number of contract award notices that include a zero value in the Contracts Finder site has exceeded 10% in every year since its launch. Moreover, buyers often record inconsistent date data, due to missing validation on date-related data. For instance, in Contracts Finder, there have been thirty contracts awarded in 2019, where the publication date goes beyond the contract end date, and there are fifteen contracts where the start date of the contract is greater than the end date of the contract. Similar problems occur in TED data, as well as a range of sources that we gather data from. Across Europe, we found that over 402 contracts had apparently been published after the contract had expired in 2019. We also identified a number of issues with the use of common procurement vocabulary (CPV), which is the standard classification codification used in TED and across the EU. We frequently found that tender notices are classified erroneously or with confusion. For instance, a tender for the hire of office premises was labelled as construction work. Neither the title nor the description made clear what was being purchased in this example, but either the title or the CPV had been recorded incorrectly. Obfuscation can also occur if CPV codes are overused; in a notice from the Irish Republic, 83 CPV codes had been applied, making it harder to recognise exactly what the precise need is.
Erroneous data provide the most significant challenge for analysts working with procurement data. In many cases, we can identify erroneous data with algorithmic analyses, and in other cases, it is possible to infer or deduce the correct value, for example, we can classify records that have been poorly classified. However, in many cases, there is no possibility to infer erroneous data to a sufficiently high level of accuracy. For example, we might be able to infer that a contract will end between two dates, but we will not be able to infer this information with sufficient level of accuracy to replace an erroneous date with a single replacement date.

3.2.5. Absent Data

Sometimes sources do not cover the core elements of information, for example, a value field does not exist in several European countries. Some provide only a title and no description. Currency information for the monetary values is missing in a considerable number of sites. In all cases, if a publisher sought to add the additional information, such as a different currency, there would be no capacity in the system to provide the information required in a structured form. Effectively, the underlying systems for publishing data are insufficiently sophisticated to allow buyers to publish high quality data. This impacts data quality significantly, but particularly in two key areas. Firstly, there are very few opportunities for publishers to publish identifiers for either public bodies or for contractors. This means that even if buyers wanted to correctly link data to legal entities through the use of identifiers, it is not possible to do so. This is true for the current TED schema and almost all of the schemas in Europe. Secondly, the lack of sophistication in the storage and records of data does not allow for any version control in the outputs and no method to record releases as updates. This is critical for amendments to contracts, particularly amendments to contract values. Whilst TED does provide some capacity for publishers to amend contracts, changes are recorded as new documents, which often do not link back to the source contract, largely because publishers wishing to link the record need to complete a range of manual steps to source and then copy across the identifier for input in the amendment document. Again, the sophistication of the mechanism limits the ability for publishers to curate high quality data.
The absence of quality data has a downstream impact on the analysis of the data. Data consumers cannot always record what changes have been made to documents or when those changes were made. Comparative analysis of documents allows us to record differences, but for instance being able to differentiate between an amended typo or a material difference in demand is a challenge. Problems are exacerbated by poorly formed data where source data cannot be cast to an appropriate data type, it is much harder to recognise whether changes to the data are substantial or not.

3.3. Data Enrichment

The data collected were enriched, i.e., expanded with additional information in order to increase its value and use, using natural language processing techniques through a number of methods, including entity recognition for suppliers, identifying towns and other known entities in address data using transfer learning, classifying tender notices to the highest level CPV codes (https://ec.europa.eu/growth/single-market/public-procurement/digital/common-vocabulary_en (accessed on 19 February 2022)), and ascribing a language and country of origin to each document. A challenging issue in this context is CPV classification due to a number of complicating factors in the underlying published data and the scale of the problem. We developed an advanced classifier (with a precision of 83%, a recall of 88%, and an F1 score, i.e., harmonic mean or average of precision and recall, of at least 84%) working for all languages on our database addressing the following challenges.
Multi-label data: All documents published in TED and many of the public sources around Europe publish documents with multiple classifications, with no primary classification identified. Many records have more than ten classification references and some buyers deploy a technique of adding diverse requirements to a single tender in different lots; this requires buyers to provide diverse categorisations for the same tender, making it hard to identify a primary classification for a tender. The solution that we developed provides five different CPV classifications with scores. This means that we can choose the “primary” CPV based on its score and by taking the common high level classification from the five different CPV labels suggested.
Inaccurate classification: A high number of documents are usually incorrectly classified; mostly, this comes down to confusion around the correct class to apply, but occasionally there is a clear misapplication of codes. We often see consulting described as training or research for instance. This problem is exacerbated by the inconsistent nature of CPV codes that are poorly optimised for the description of services. “Consultancy” is mentioned six times in the top two layers of the classification and in four different divisions of the vocabulary. We measure top level matches between original and applied CPVs; however, some categories such a services related to software are spread across CPVs. Our classifications in these instances are often correct, despite being treated as “incorrect” in our F1 scoring. Our classifier adds CPVs down to Level 3 by adding a lot more granularity and saving data consumers substantial amounts of time in browsing and reading notice data.
Poor narrative data: With some documents having only five words in their combined titles and descriptions, this is barely enough narrative to classify the documents and makes the task of classifying data much harder. This issue is particularly prevalent in Spain where narratives are, on average, half as long as narratives in the UK. First, we add CPVs where none are present. Second, we improve published CPV data, which are often limited to high levels. For instance, a tender for “Health and social work services” does not provide much clarity on whether the notice is for health care or social care. By classifying notices to the third level, users will have much more information about what the notice is about. In instances where notices have a combined word count of five for the title and description, it is unlikely that this will be fully addressed as it is a data publishing issue, although our classifier still maintains a high degree of accuracy.
Scale of the classification: This increases the complexity of the analysis significantly. With thousands of classification options open to the algorithm, the risk of inaccurate classification increases exponentially with the number of classes to be used. The classifier that we implemented can accurately process millions of documents in days and does not suffer scalability issues.

4. Knowledge Graph Construction and Publication

A KG based on ontologies, unlike data models such as OCDS, allows the integration of similar and/or related data sets, since ontologies act as a commonly agreed super structure over the underlying data sets and provide a uniform way to access data [21,22]. In the context of this work, procurement data were integrated with a company data set in order to gain access to detailed information on suppliers, and then the resulting data are published by using Linked Data technologies and principles.
The KG construction process follows an ontology-based extract-transform-load (ETL) approach [23] and mainly includes gathering procurement and company data, integrating them by reconciling entities (i.e., over suppliers), mapping them to standard vocabularies given by a set of ontologies, and transforming data with respect to these mappings—see Figure 2. In the context of this work, the procurement data set, described earlier, was integrated with a company data set during the KG construction process. This is because supplier (i.e., company) information appearing in procurement documents contains very little information and extending these data with detailed company information enables more advanced analytics processes. Company data were provided by OpenCorporates. It gathers data from national company registers and other sources through various techniques including scraping and represents data using its own internal data model. OpenCorporates has the largest open database of core company data (i.e., existence and basic attributes) in the world.
Two main ontologies were used for the data integration process. We developed an ontology for representing procurement data based on the OCDS model [24] and reused another ontology, euBusinessGraph [25], for representing company data—see Figure 3. The contracting process is the core concept of the OCDS ontology. A contracting process may have one planning and one tender stage. A tender may have several associated awards, while there could be only one contract issued for an award. The ontology includes 25 classes, 69 object properties, and 81 datatype properties; main classes include, for example, ContractingProcess, Tender, Award, and Contract. The euBusinessGraph ontology models registered organisations (i.e., companies registered as legal entities), identifier systems (i.e., a company can have several identifiers), officers (i.e., associated officers and their roles), and data sets (i.e., capturing information about data sets that are offered by company data providers). The ontology includes 20 classes, 33 object properties, and 57 data properties; the main classes include, for example, RegisteredOrganisation, Identifier, and Person. Procurement data are fetched on a daily basis using the API of OpenOpps. This is followed by a reconciliation process matching supplier records in procurement data against the company dataset using a reconciliation service provided by OpenCorporates. Matching company data are fetched using the API of OpenCorporates and linked with the procurement data. The fetched procurement data and company data are transformed into RDF with respect to OCDS and euBusinessGraph ontology using RML [26].
Data in the KG is published through the following means supporting various data access and processing needs:
1.
A KG API: This is a REST-based API exposing URIs for the resources available in the KG (e.g., awards and contracts) and includes functionalities such as authentication and authorisation, pagination, and sorting. The KG API is mainly meant for programmers and developers who are not familiar with Semantic Web technologies. KG API is available online (https://tbfy.github.io/knowledge-graph-API (accessed on 19 February 2022)) along with an explanatory video (https://www.youtube.com/watch?v=Iyq_mUPWAaA (accessed on 19 February 2022)).
2.
A SPARQL end-point: This is an end-point present over HTTP and receives and processes SPARQL protocol requests. It is primarily meant for executing ad-hoc queries over the KG and is not constrained with certain resources such as KG API. The SPARQL end-point is available online (http://data.tbfy.eu/sparql (accessed on 19 February 2022)) along with a third party GUI (http://yasgui.tbfy.eu (accessed on 19 February 2022)).
3.
A Search API: This API allows exploring large multilingual document collections of public procurement data through a REST-based API as well as searching for similar documents given a document or even given a text. The Search API is available online (http://tbfy.librairy.linkeddata.es/search-api (accessed on 19 February 2022)) along with an explanatory video (https://www.youtube.com/watch?v=djnLBZOHphw (accessed on 19 February 2022)).
On September 2021, the KG consisted of 160 million triples and contained information about the following: 2.25 million tenders, 3.05 million awards, and 151 thousand companies (for reconciled suppliers in awards). The data are made available online on Zenodo (https://doi.org/10.5281/zenodo.3712322 (accessed on 19 February 2022)) under ODbl including original and mapped data sets. All data assets and schema (http://data.tbfy.eu (accessed on 19 February 2022)) and tools (http://platform.tbfy.eu (accessed on 19 February 2022)) used in the process are made available with documentation.

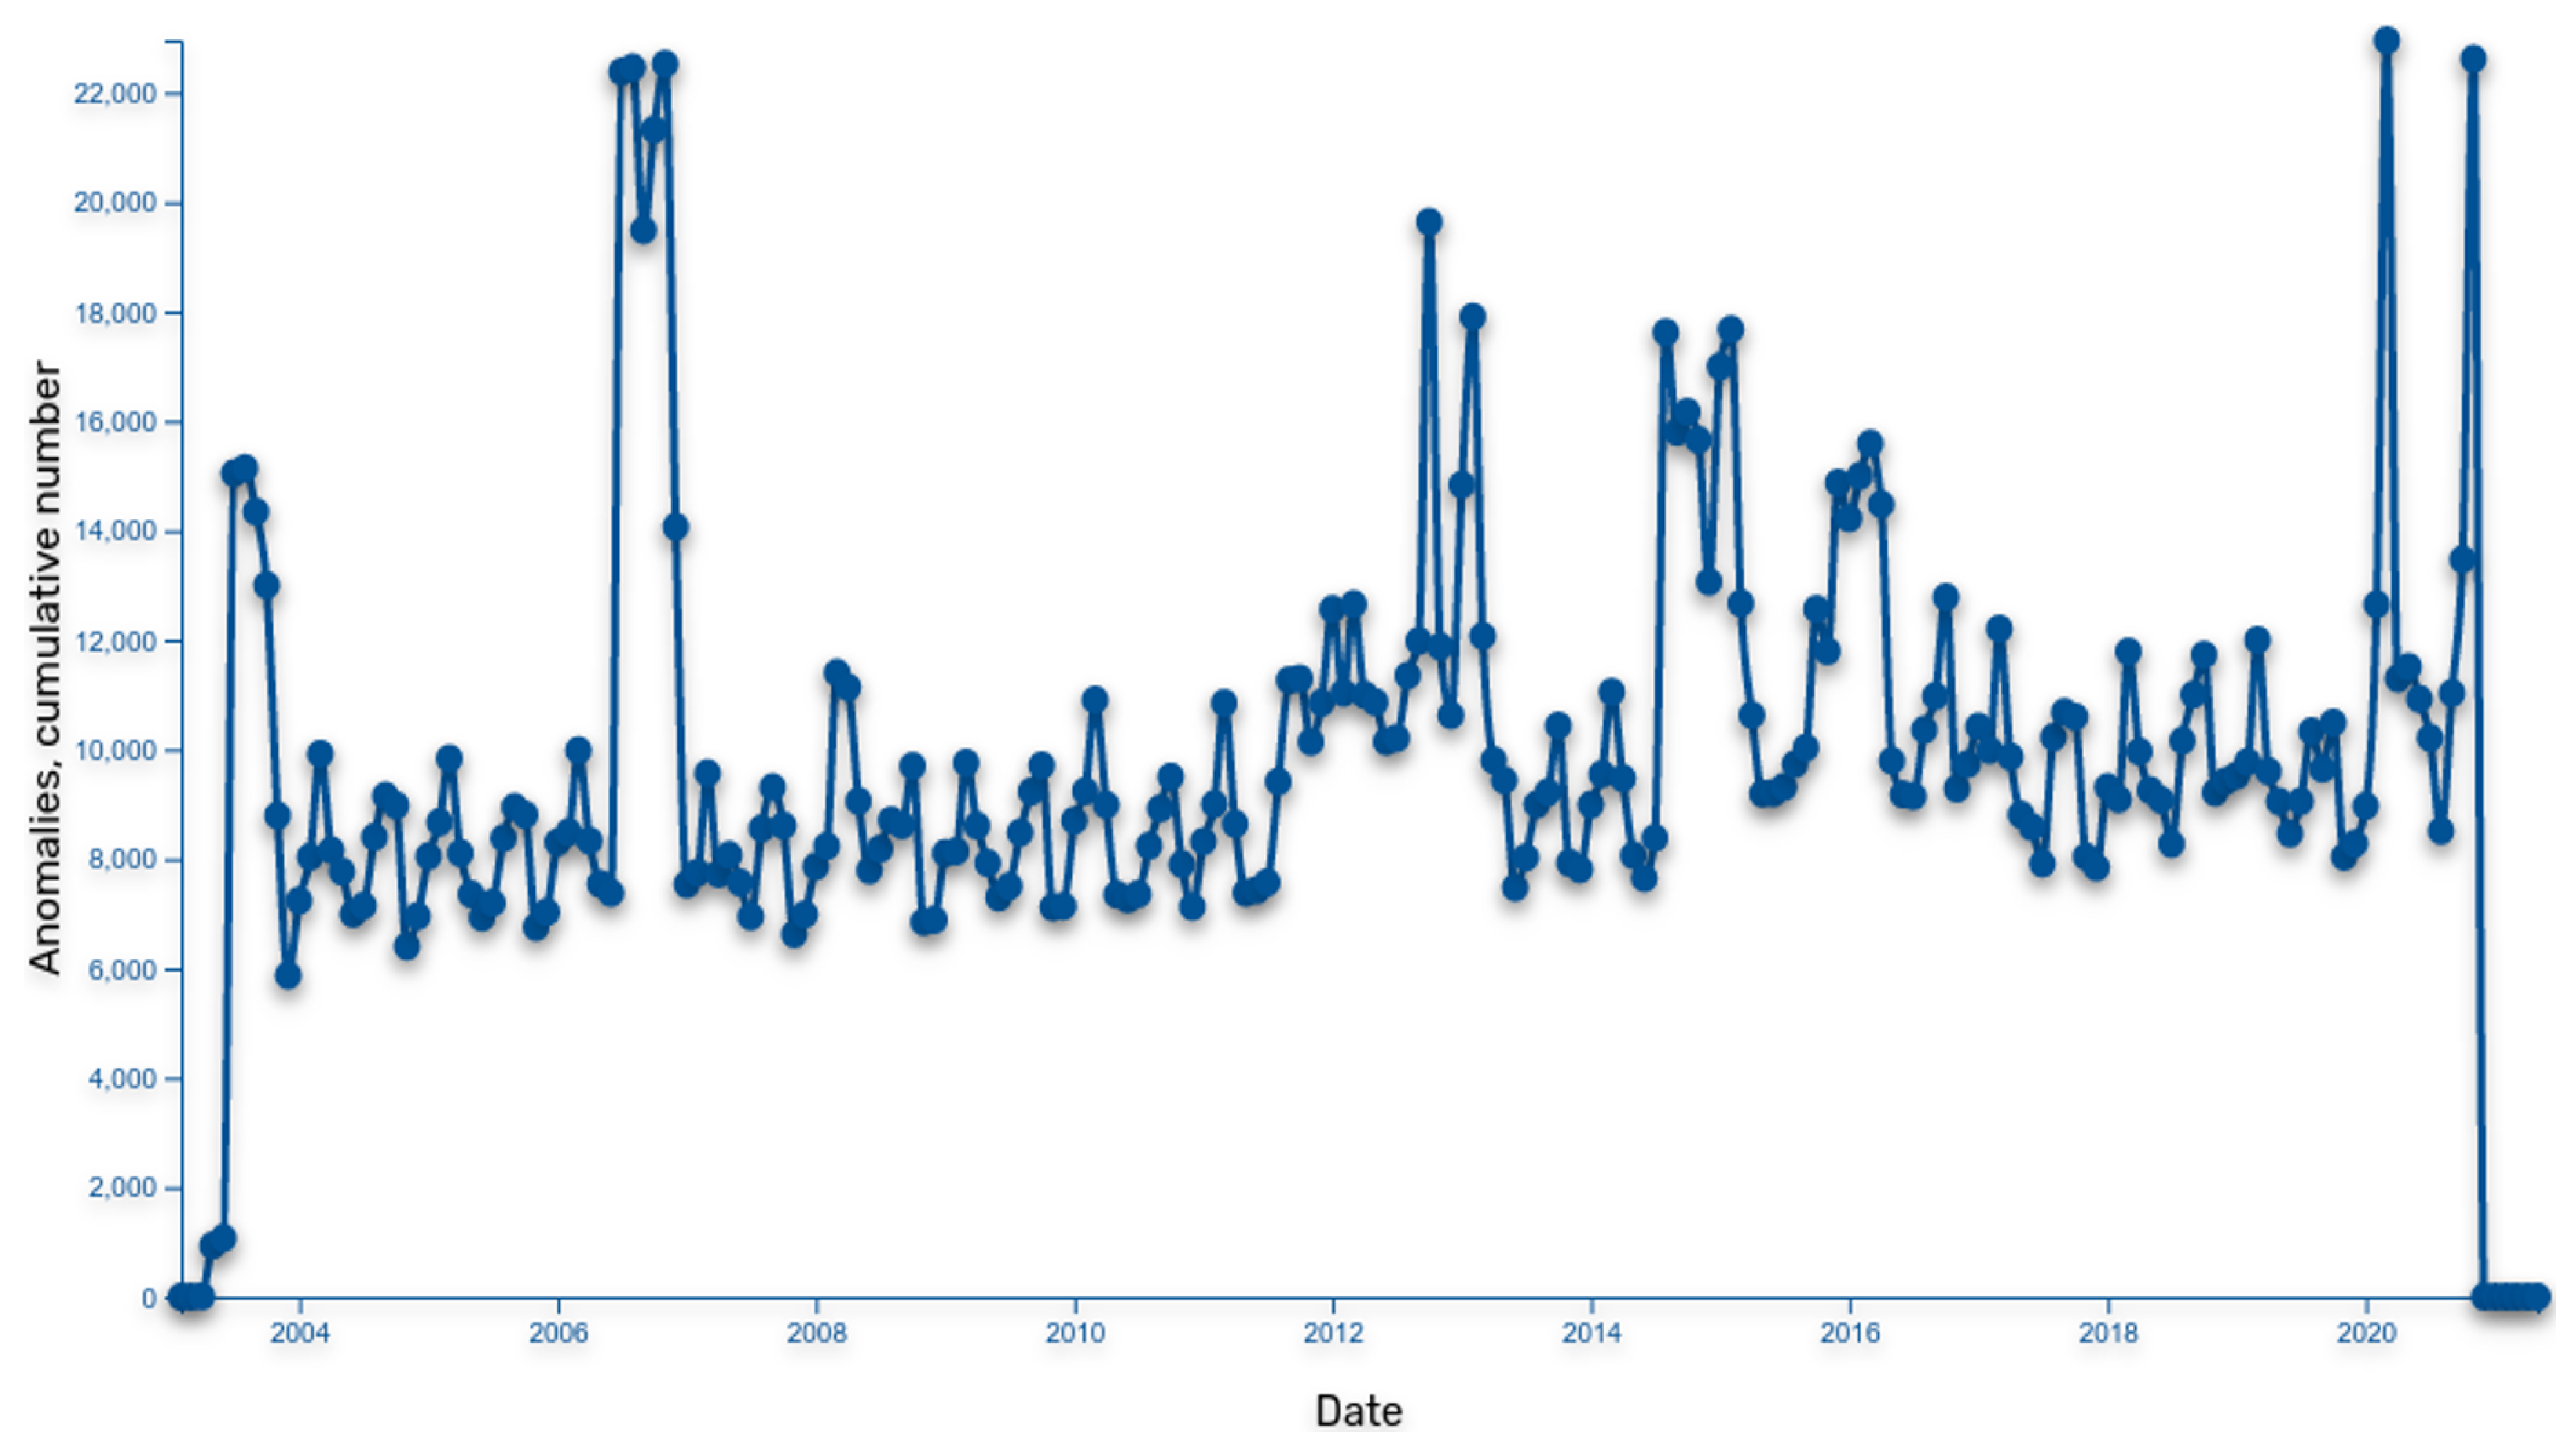
5. Using Public Procurement Data for Anomaly Detection

Once procurement data are integrated and openly available, it is possible to apply various techniques to identify potential anomalies (e.g., [27,28]). We implemented a series of anomaly detection techniques in collaboration with domain experts from the Public Procurement Directorate of Slovenia in order to identify patterns and anomalies in public contracting processes, such as fraudulent behaviour or monopolies in procurement processes and networks across data sets produced independently including the KG. The first set of techniques was primarily applied over Slovenian spending data in combination with procurement data, while the second set of techniques was applied on Slovenian public procurement data. We report several interesting findings, while noting that they do not necessarily refer to fraud or missconduct. The experience shows that by using open integrated data sets and anomaly detection techniques, it is possible to detect cases that stand out and investigate them in detail.
Regarding anomaly detection on spending data, it is mainly based on Slovenian procurement data and publicly available Slovenian spending data (https://erar.si (accessed on 19 February 2022)). The financial transactions were converted into a dynamic network encoding the flow of money across the entities in the ecosystem. Such data structure serves as a basis for follow-up analyses. The aim is to transform transaction data and corresponding metadata on entities into a data structure allowing complex analysis and per-request query operators. The query operators allow detecting unusual and complex patterns in spending patterns across the network. Anomaly detection was implemented as a transformation of the dynamic network into sparse feature vectors, which were further used with more traditional machine learning (ML) techniques (either supervised or unsupervised) to detect anomalous situations. The key to detecting relevant signals in the data is in the representation of the transformed vectors in combination with human experience (in the form of which features to extract) with statistical/ML techniques (detecting unusual behaviour in the data). The anomaly detection methods applied over the procurement and spending data include the following:
1.
Average Deviation Anomaly: This method summarises financial transactions between two entities and find the most deviating ones. The method was applied on all entities as well as on entities grouped based on company classifiers (e.g., construction-oriented companies and IT-oriented companies).
2.
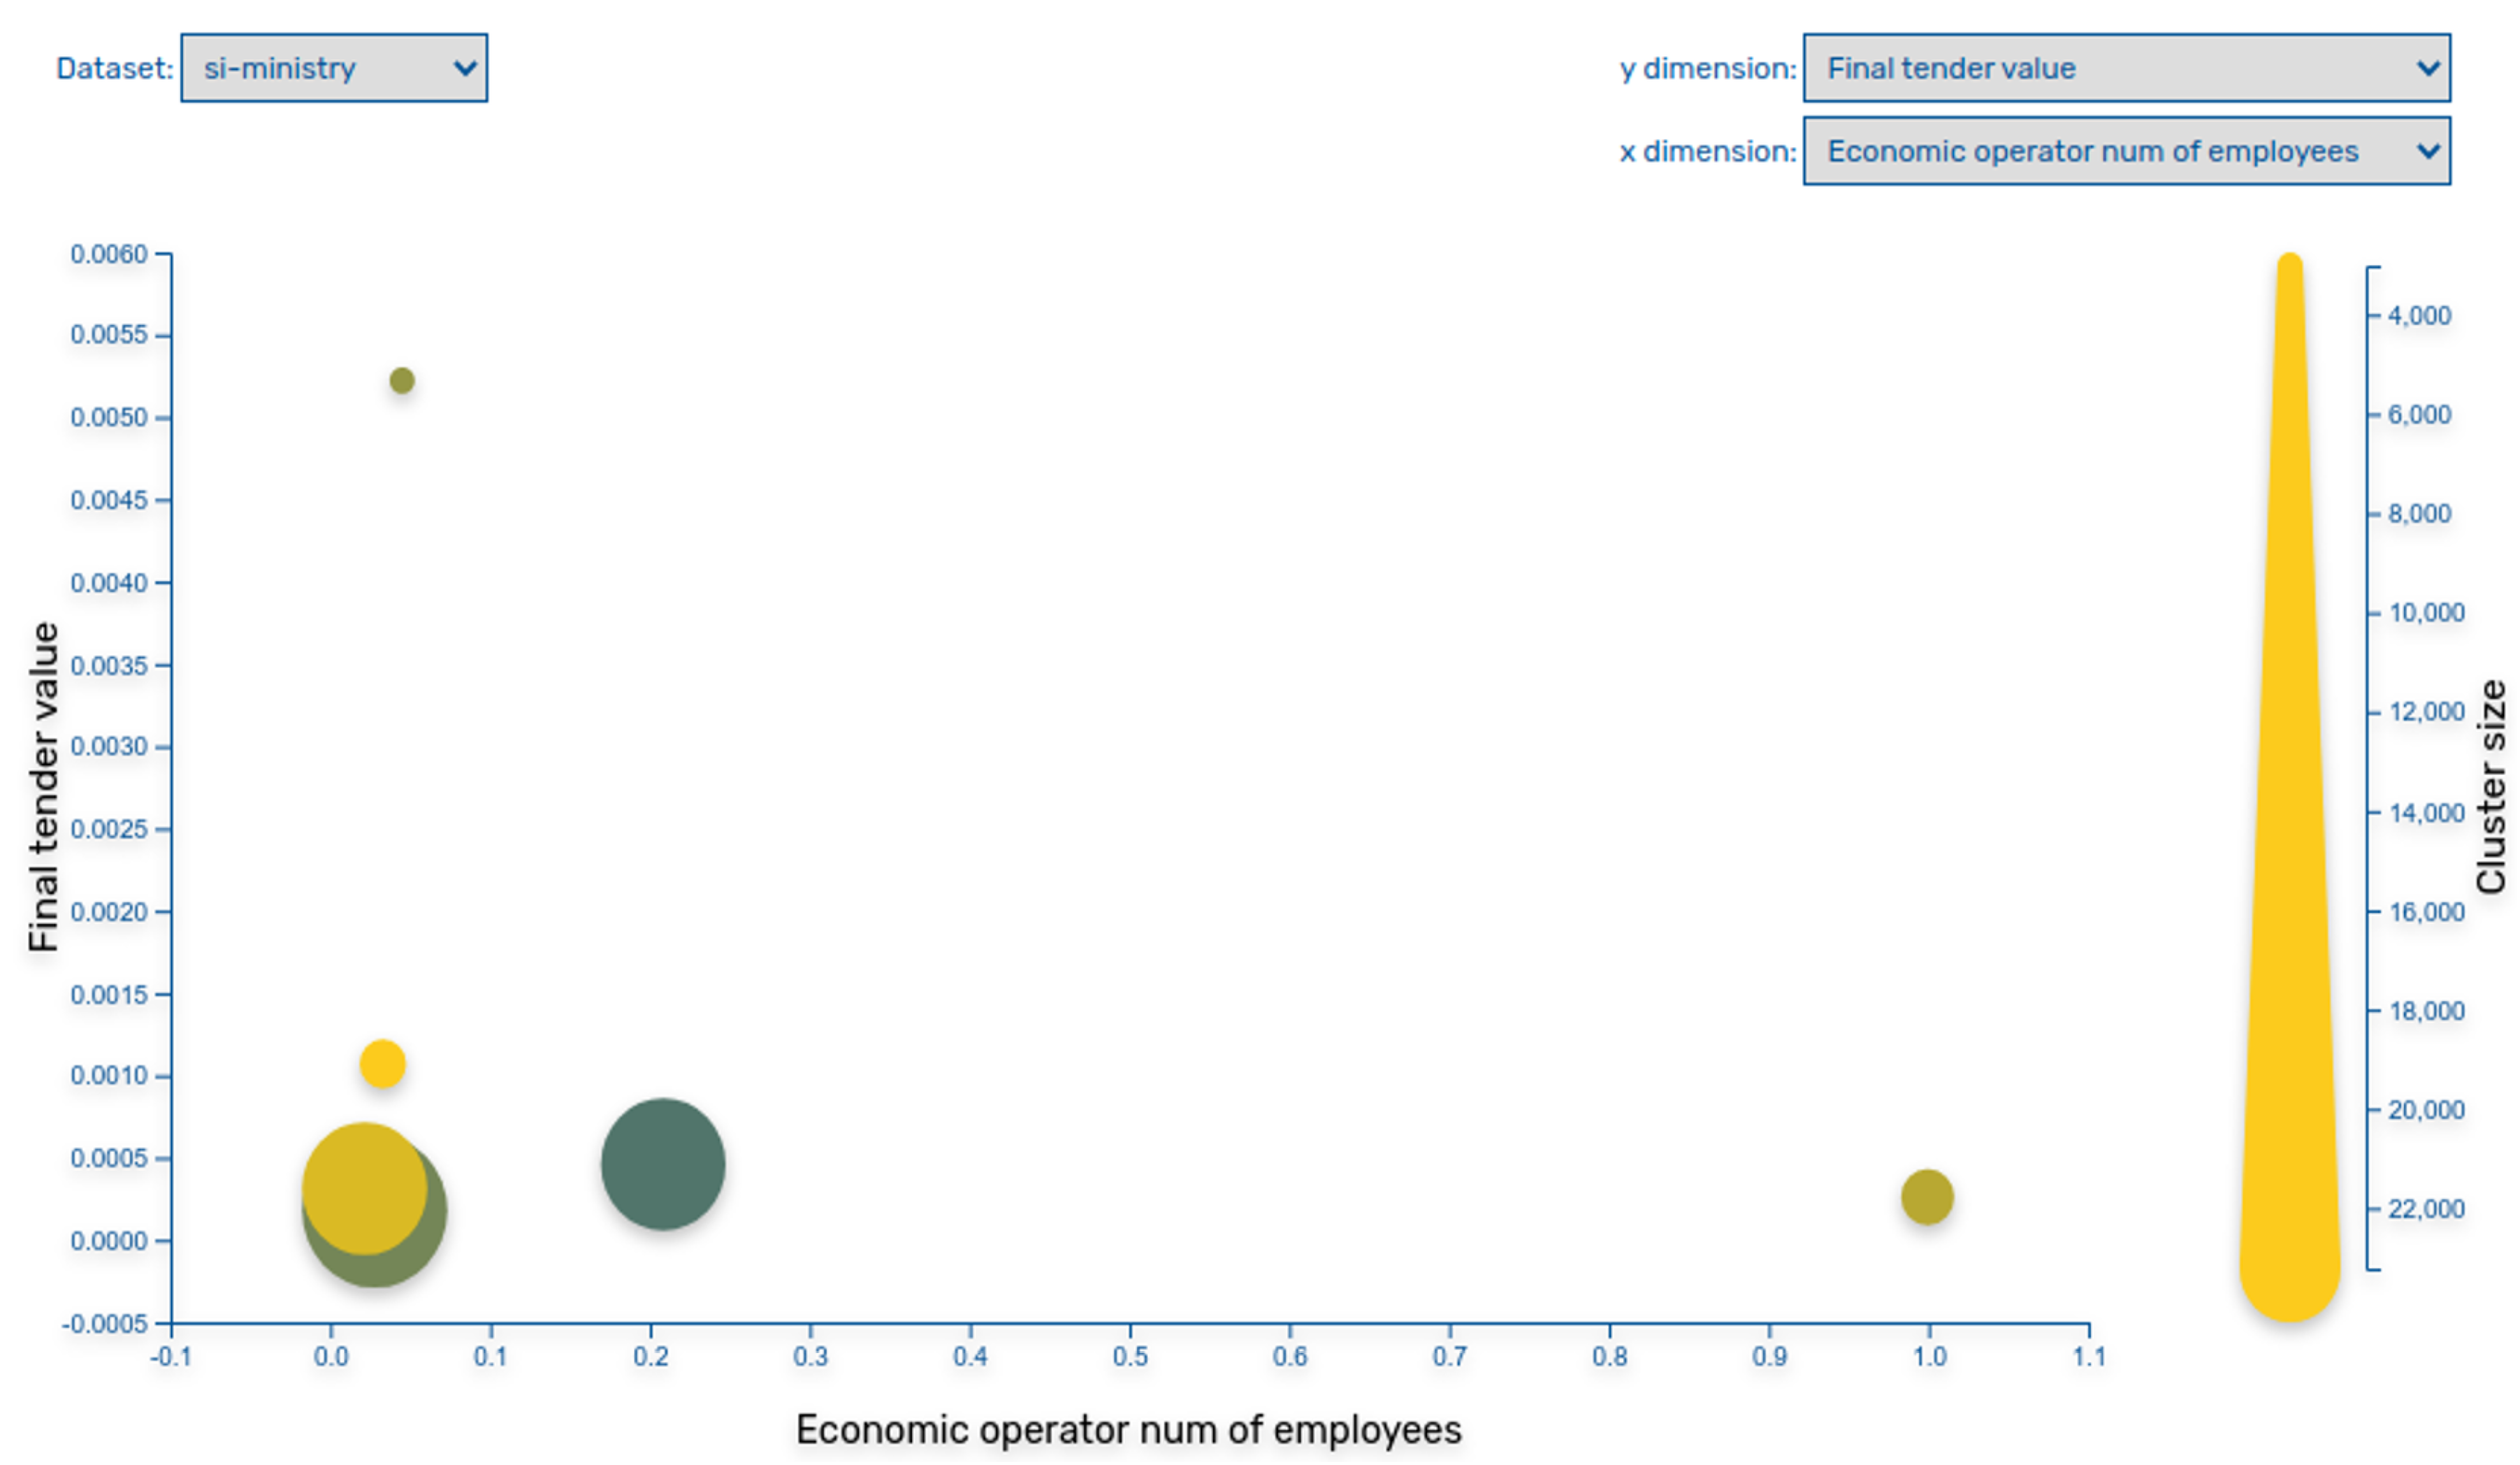
Clusters: The method organises transaction sums into an optimal number of clusters and define deviations within each cluster separately. Therefore, this method performs data clustering in order to determine the best arrangement of values into different classes. The method seeks to minimise each class’s average deviation from the class mean and at the same time it is maximising each class’s deviation from the means of the other groups. The method clusters data in a manner that it reduces variance within classes and maximise variance between classes.
3.
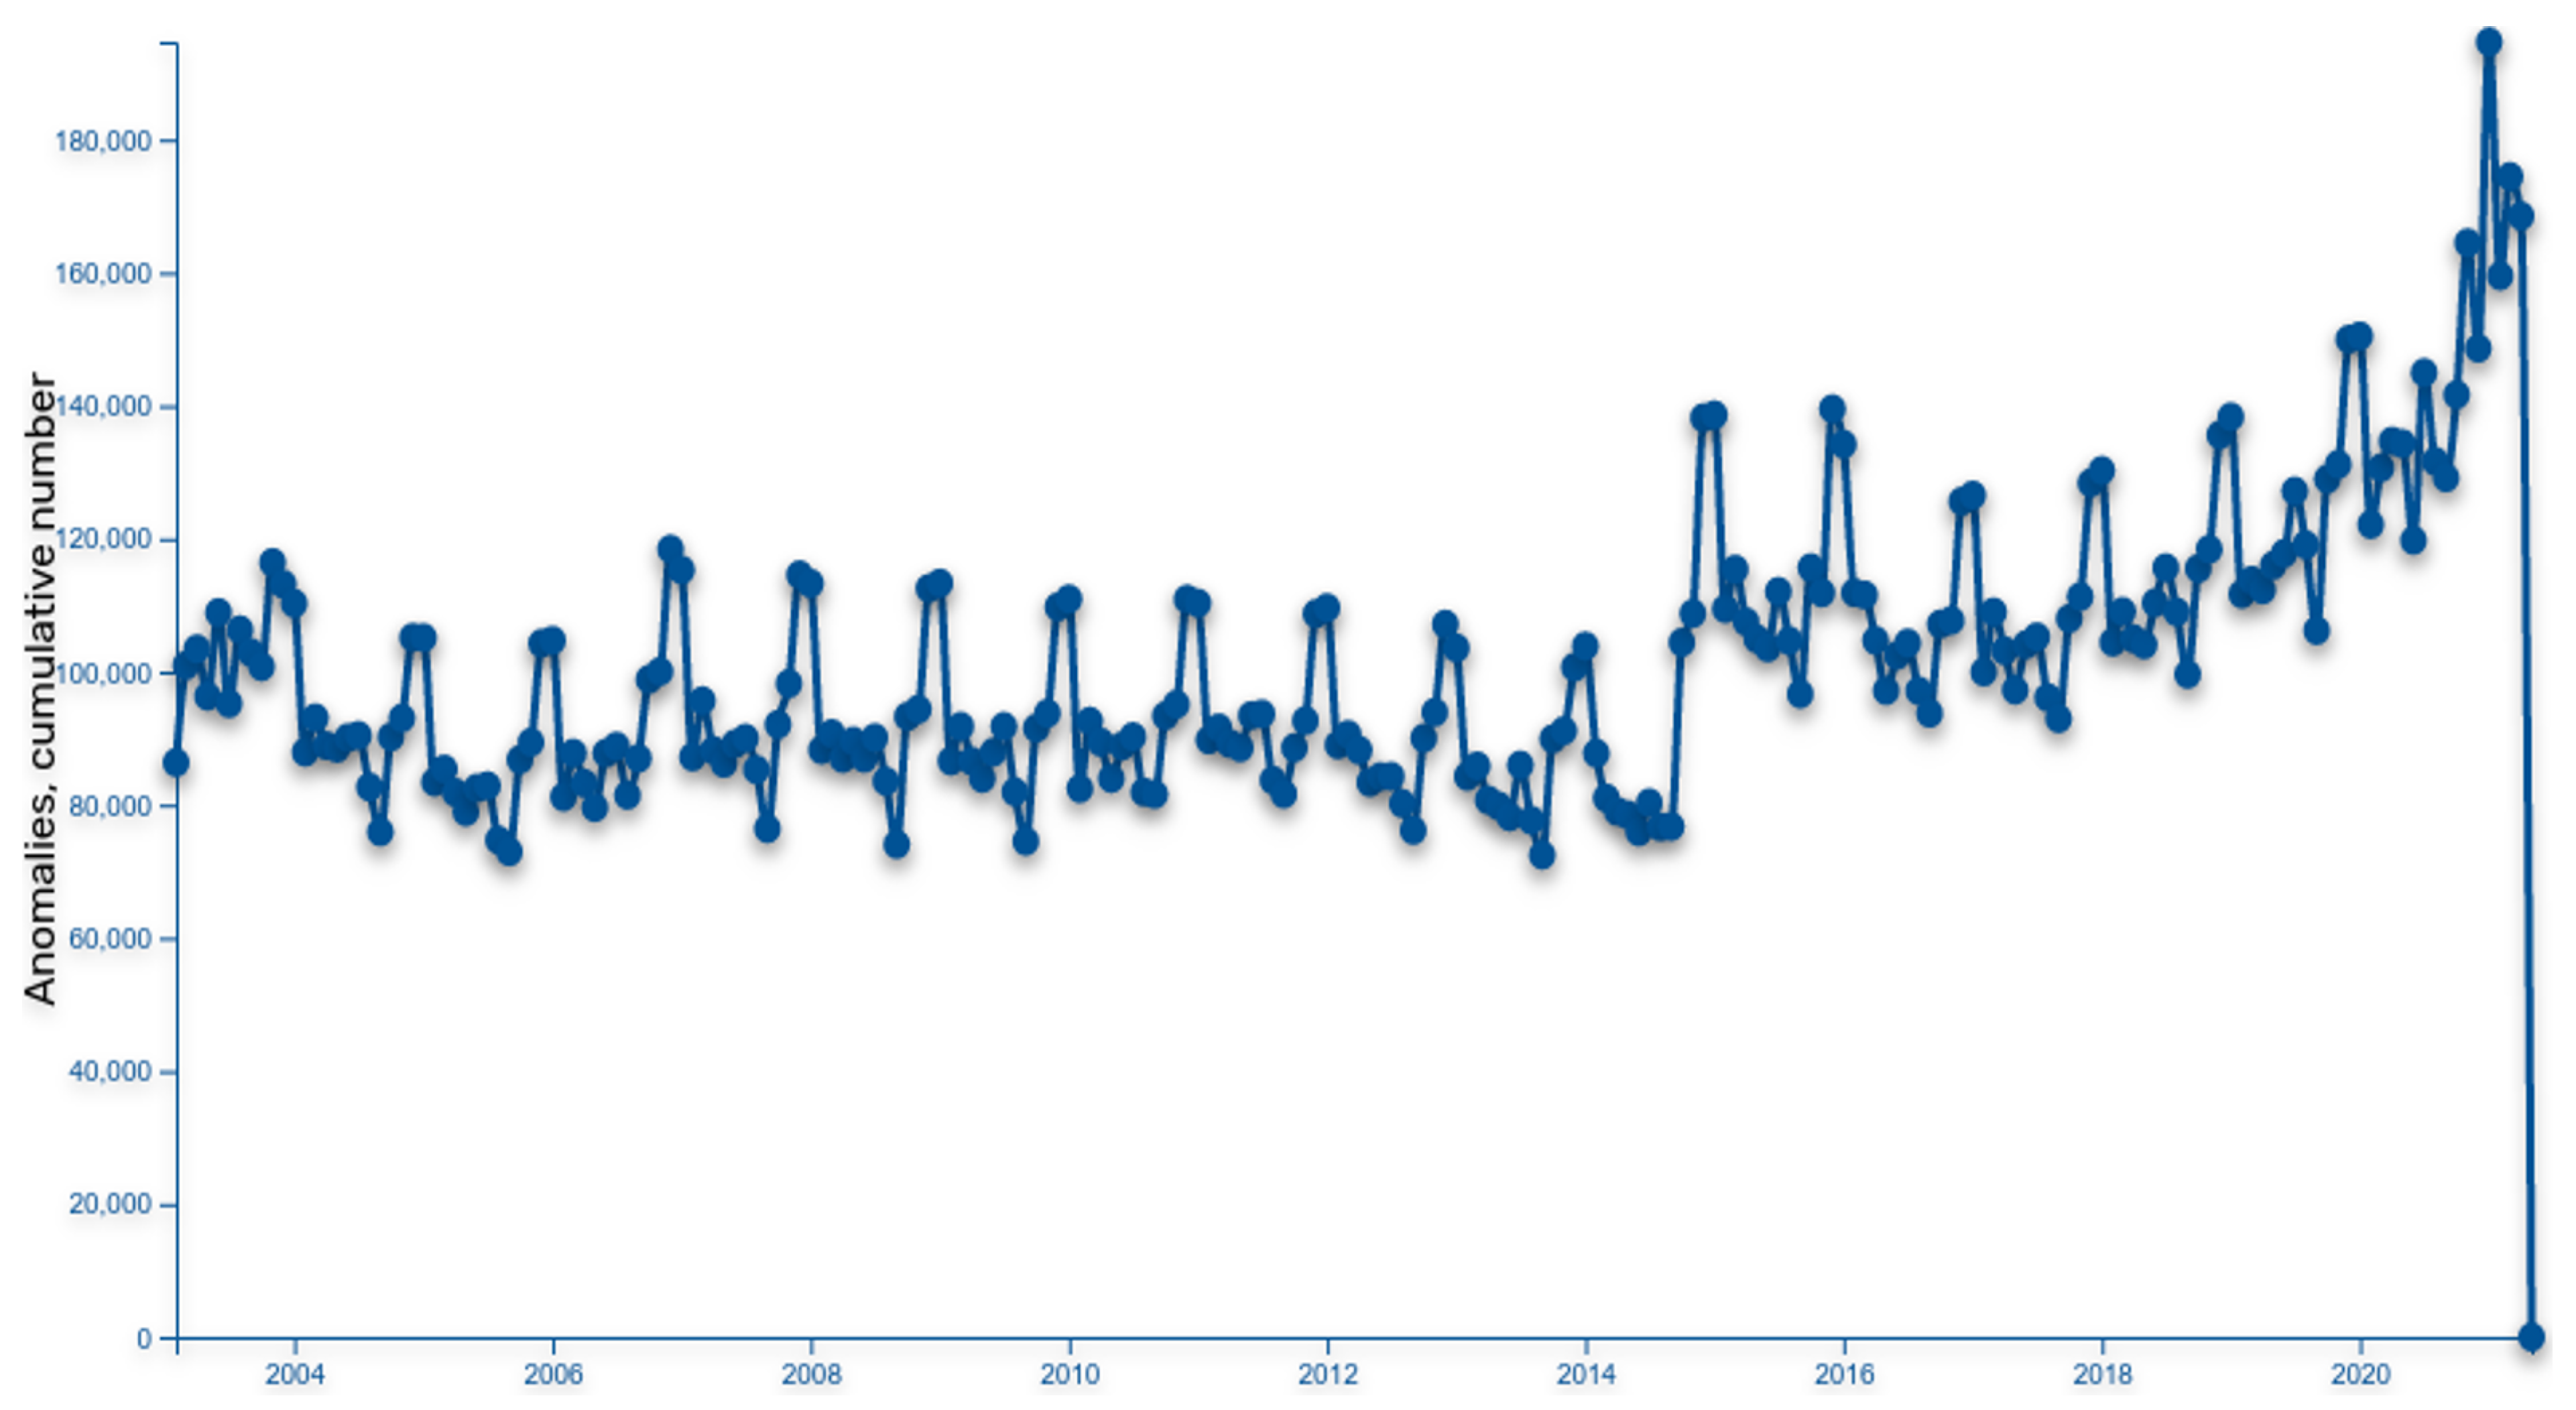
Periods: This method defines a financial transaction as a base relation between two entities (public sector entity and business entity). Based on this, relation periods (when relation started or ended) are detected and starting/ending periods are accumulated on a timeline. Based on cumulative relation period extremes, deviations are detected, and entities are listed as part of identified extremes.
4.
Derivatives: This method analyses the biggest changes within two entities and transactional relation in a given period. If a change is identified as an anomaly, it is added to the cumulative anomaly graph. Once the cumulative anomaly graph is defined (based on all transactions jumps between the two entities), the extremes are identified, and anomalous companies are identified. The goal of this method is to find companies showing the greatest changes in transaction relations.
5.
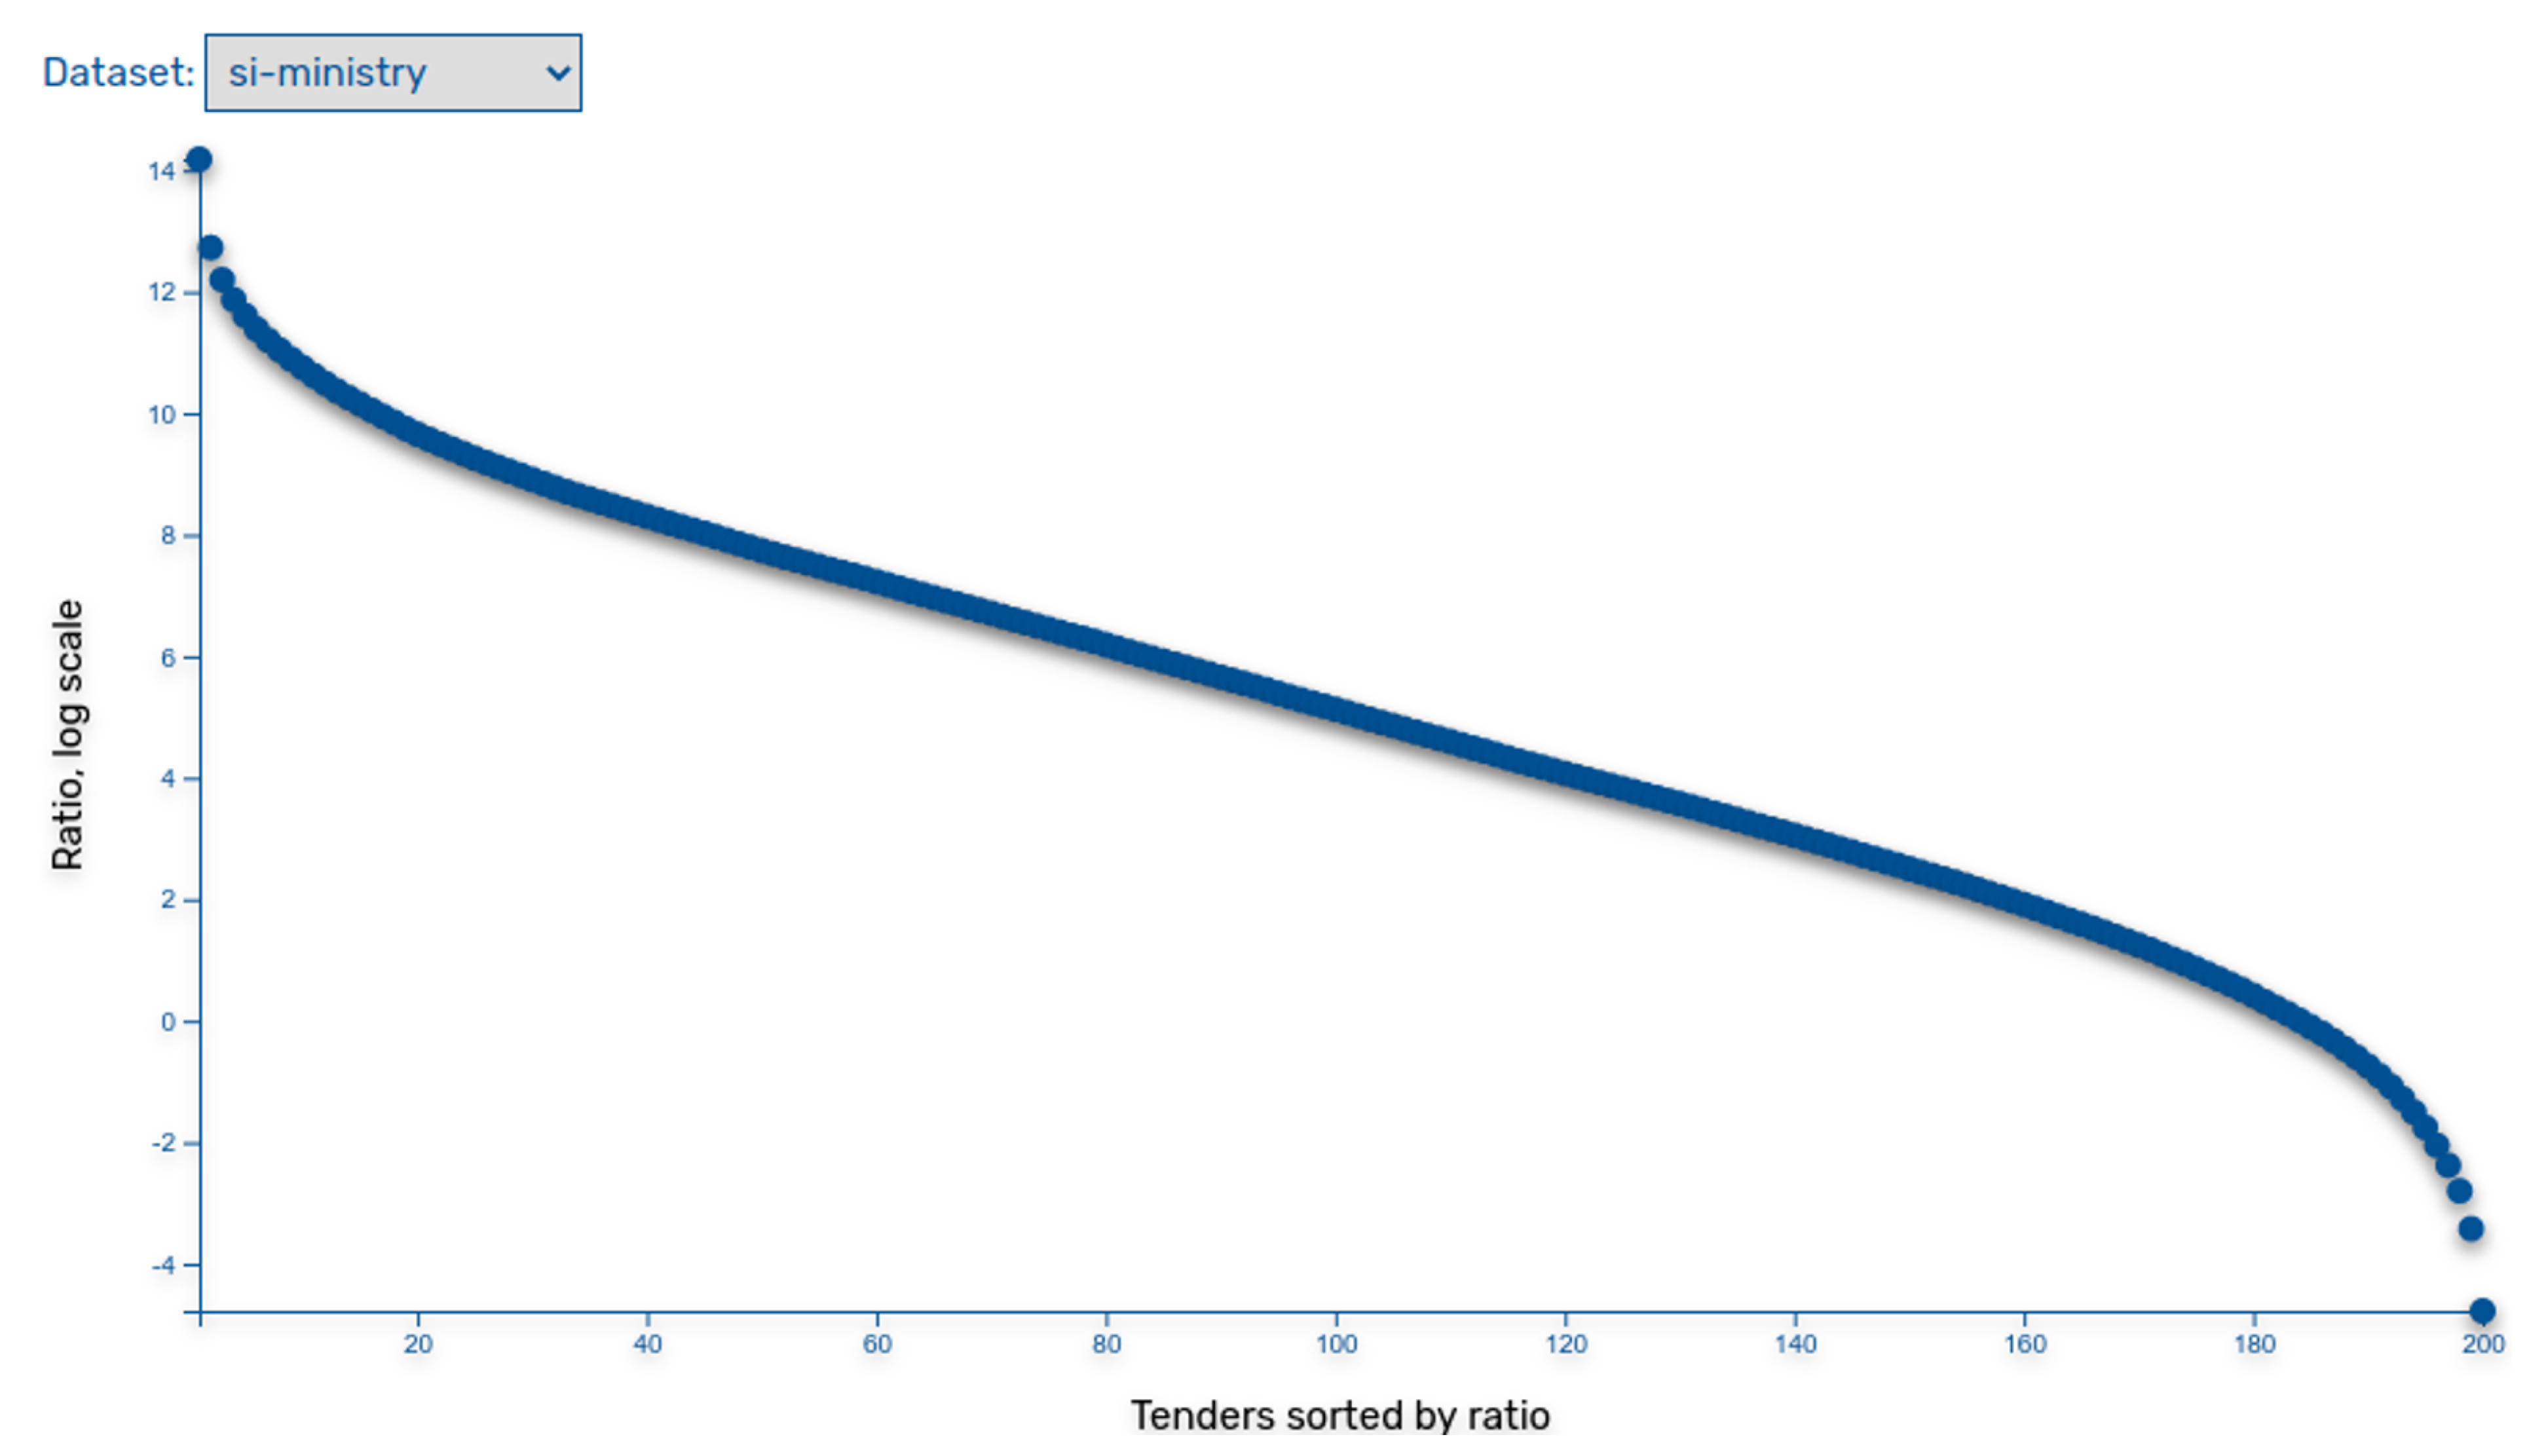
Cumulatives: In this method’s approach, we first define transaction sums for all related entities and normalise sums with the total transactions sum. In such manner, this method defines a comparison baseline. Then, it takes transactions between entities and sums them into a predefined number of periods. For each period partial sums weights are compared to baseline weights, and the anomalies are identified. The more anomalous a company behaves, the higher it ranks on the anomalous list. The purpose of the method is to identify the greatest changes within the series of accumulated periods.
In Figure 4 and Figure 5, we present two representative examples. The first case shown in Figure 4 presents an analysis of all Slovenian public spending data with Periods method, which detected some interesting patterns in public spending changes. The x-axes represent time and starts at January 2003, where one unit means one month. The y-axis represents the number of detected extremes with start/end of the transaction period. We can visually observe several patterns, for instance, the accumulation of anomalies at the beginning of the budget year and also around local and parliamentary elections. However, there are some other extremes visible. At the end of 2006, Slovenia adopted the Euro currency, between 2012 and 2013, there were political and economic crises in Slovenia, and at the end of 2014, a new government was elected. In 2016, Slovenia expected a migrant crisis and we can also observe the accumulation of anomalies during the COVID-19 epidemic. The second example shown in Figure 5 represents the analysis of all Slovenian public spending data with the derivatives method. The x-axes represent time and starts with January 2003, where one unit means one month. The y-axis represents the number of detected “cases”, and the number of anomalous transaction extremes. There are two interesting observations. First, the graph has a global minimum around the summer of 2014, when Slovenia finally overcame the economic crisis. This can be explained as a consequence of government savings programmes. Second, specific extremes are associated to end of a budget year. Further analysis has shown the association with other specific events, such as big floods in Slovenia at the end of 2010 and 2012 and also national and local elections.
We also applied several approaches for analysing procurement data including supervised, unsupervised, and statistical analysis [10,11]. Concerning unsupervised learning, we clustered data using the k-Means method in order to find patterns in the data and to identify anomalous data points that are not part of the previously found clusters. For supervised learning, we used the decision tree method to acquire a better understanding of the decision-making process in the public procurement domain. Finally, for statistical analysis, we dealt with various ratios between preselected parameters, such as the ratio between tender values and the estimated number of bidders.
In Figure 6, a visual presentation of the interdependence of tender value and the number of employees of a bidder, as part of statistical analysis, is shown. The upper left part of the graph shows companies with a high number of employees that won small tenders, while on the bottom right part, it shows companies with a small number of employees that won big tenders. We have found several examples of companies with no or only a small number of employees who won very big tenders. Most of them were subsidiaries of foreign companies, but we have also found cases where media have been reporting about alleged corruption on the past. Figure 7 is showing visualisation of the Clusters method. This method is looking for previously undetected patterns in a data, usually those we are not aware of. Using the Clusters method (i.e., k-Means method), in the given example, we found that one small group had a high final tender value and low number of employees. A deeper analysis shows that there are a number of companies with only one or few employees, and they received contracts with a value of more than 200.000 EUR.
With all these anomaly detection methods, it is possible to automatically detect cases that stand out of the large amount of procurement and spending data. These cases can be then manually investigated further.

6. Recommendations for Publishing Procurement Data

In addition to anomaly detection case, we used KG and platform in other cases with public and private stakeholders, including procurement analytics and supplier selection [11]. We faced major obstacles during both the construction of KG and its use, impacting the quality of analytics processes. Some of these obstacles related to general data quality, which were discussed earlier in this article. In this section, based on the experience we gained both through the anomaly detection case and KG construction process, a set of specific recommendations was proposed for public administrations in Europe and worldwide in order to guide them to manage and publish their public procurement data according to open data principles. The aim is to improve the availability and quality of data published in order to allow advanced tools and analytics processes to support competitive and fair markets.
  • Make your public procurement data available in a structured format and according to existing standards
Public procurement data should be published in structured formats and following protocols that make it easy for data reusers to obtain the data, process it, and use it for their own purposes. Examples of such formats include tabular, tree-based or graph data formats such as Microsoft Excel, CSV, OData, XML, JSON, or RDF. Furthermore, if not only the formats are structured but also the data models used for their publication are commonly agreed upon, the gain in terms of data reuse will be larger. In open data publishing, it is common to produce shared data models, vocabularies, or ontologies to ensure that data can be exchanged across applications and to combine data from different publishers (for instance, to undertake comparative analyses in different regions or countries).
  • Include identifiers of all the tenderers that participate in a contracting process
Clear references to all tenderers that participated in a tender (not only awardees) should be included, with a standardised unique identifier that removes any ambiguity about the organisations (e.g., a URI in a global company registry). Many public administrations include only organisations that were awarded a contract. This is not very useful for an auditor or a civil society organisation that aims to perform the following: ascertain if there are any questionable practices among tenderers, for instance, prior agreements among groups of companies that commonly bid together; compute performance indicators such as the number of bidders per contract for competitiveness analyses; or determine the share of bidders that are small and medium businesses to understand barriers to entry. In many cases, the data made available include only the name of the tenderer, but no indication of the VAT number or any other unique identifier that could be used to link the tenderer to a registry of companies.
  • Include identifiers of the departments and suborganisations that act as tenderers
Data about a tenderer should be descriptive rather than generic (e.g., the specific department within the public authority that is requesting the work). There are too many cases where public procurement records do not provide many details about tenderers or buyers. In a medium-sized city such as Zaragoza, there are more than 10 public entities (the city council, foundations, etc.) that may act as tenderers of contracting processes; when the tenderer is listed as the City Council of Zaragoza, the contract may be associated with any of its departments. The references to the tenderers also should be machine-readable (e.g., using unique identifiers in the procurement management system rather than department names stored as plain text). Otherwise, there is a greater risk of inconsistencies in data entry—for instance, when it comes to names of departments, even the smallest variations such as abbreviations, spelling, casing will make the data much harder to use. This is because the user will have to reconcile these variations in order to be able to perform any meaningful analysis.
  • Include identifiers of the participating organisations in joint ventures’ data
Both single bidders and joint ventures should be identified using standardised URIs, e.g., from company registers. In addition, joint ventures need to provide information about each member organisation, again identified using a standardised URI. More often than not, especially for large contracts, several organisations join forces to bid. In most countries, such joint ventures are considered a new type of organisation, with a new fiscal ID. This makes it difficult to reproduce all contracting processes in which an organisation has been involved, as these include both those where the supplier bided on its own and those where they were part of a joint bid. This makes public procurement less transparent. In addition, it reduces the accuracy of services that aim to provide added-value to buyers (e.g., by scouting potential suppliers based on the contracting processes where they have participated) or to potential suppliers (e.g., to find contracting processes according to their profile).
  • All notices and steps associated to a contracting process should be linked with the same identifier
All data about a contracting process should be aggregated around the same core data structure/data items, maintaining relevant IDs during the entire contract. Procurement data models, such as the Open Contracting Data Standard, CODICE, the data model of TED, etc., recommend keeping the same identifier for each contracting process during its lifecycle so that all data can be adequately aggregated as the process progresses. However, because in many cases, data are not easily available and needs to be scraped, such identifiers can be lost, resulting in disconnected data items that cannot be reconciled for analysis purposes.
  • Link invoices (and results) to the public procurement process to which they belong
Additional information, including invoices and results, should be disclosed in order to enable richer and more accurate analyses of costs and outcomes, both at the point when a contract is signed and during its execution. Public procurement data often focus on the award stage of a contract rather than accounting for the entire lifecycle of the contract, including subsequent changes. Such contract changes are not uncommon in public contracts, but the data that are released record only major modifications to the contracts, if any at all. This means that auditors or civil society organisations do not have full access to the real final cost of contracts, since the data that are made available do not document what happened after the original contract was signed; sometimes, they have to infer such costs from bank account movements, if available. A similar situation happens with the results of service or works contracts. For example, when a report has been produced that can be made openly available, this report should be linked to the corresponding contracting process. When a piece of open software has been developed, this should be made available accompanied by documentation of the works performed. Such documentation is often standard procedure towards the buyer, but it is not disclosed publicly or linked to the structured procurement records released by public administrations.
  • The text of all documents used in a contracting process should be available for further processing and linked to their corresponding contracting process
Providing added value on public contracting is feasible if data are made available in a structured manner, as we have described in previous sections. Public administrations should also consider releasing ancillary unstructured documentation (such as administrative and technical procurement notices). This documentation could be processed using machine learning and natural language processing (NLP) technology for richer insights.
  • Provide commonly agreed visualisations of public contracting data
Government spenders should communicate key insights about their procurement practices by using infographics, charts, and dashboards in order to make data accessible to as many audiences as possible, including the public. To facilitate comparisons, these visual designs should be consistent in terms of the choice of charts to convey a specific procurement detail and consistent encodings, including colour schemes, as well as axes labels, annotations, and legends. Regarding the former, for instance, bar charts could be used to show the total value of contracts for each month of the year or in different regions. Pie charts could show the breakdown of such amounts across sectors. Some charts will be more suitable than others to present each type of information, and they should be used consistently. Regarding the latter, for example, chart annotations for highlighting average values, outliers, etc., could be formatted in the same way to facilitate chart comprehension.
  • Provide answers to the most common questions made by citizens and organisations
To increase the accessibility of the data even further, publishers should consider how they could support a wide range of audiences, including people with limited technical skills or knowledge of the data models used, and find answers to common concerns such as the following: the suppliers that are awarded the largest contract; the money spent to build a public building; or the costs of keeping public parks in good shape. The European Data Portal has released a series of recommendations for making open government data more accessible and easier to use by everyone in their report on “The future of open data portals” (https://op.europa.eu/en/publication-detail/-/publication/a1b8aa36-daae-11ea-adf7-01aa75ed71a1/language-en (accessed on 19 February 2022)). Among others, it recommends co-locating data and tools to use the data to answer typical questions people aim to answer with the data. One approach is generating shortcuts and easy-to-follow paths that allow solving these types of queries, either providing them as part of the offered visualisations or as links where the corresponding data can be downloaded.
  • Use your own public procurement data internally (e.g., as a data backend in your transparency portal)
Making public procurement data available for download (e.g., as an XML, CSV, Excel, or JSON file) helps with reuse. Making the data available according to shared data models or ontologies (e.g., downloadable in RDF or JSON-LD) and via an API helps even more. However, to ensure data are accurate and relevant, our experience has shown that the publishers themselves need to use it routinely. Collecting, collating, and releasing procurement data are complex processes—errors are unavoidable at many stages in this process, from data entry and processing to exports and to reconciliation. Publishers have the unique advantage that they know most about the context in which the data were produced and can diagnose how the errors came through and could be remedied. Other users lack such insights and could only flag errors in the data to the publisher. We recommend public procurement data providers to make use of the open data that they are publishing, following an open-data-by-default principle, so that their management systems make use of it instead of the data that are stored internally in their own databases. This may be useful, for instance, for deriving public procurement indicators that are fed into the transparency portal. Through use, the data publisher can identify very quickly critical errors and omissions and correct them before others try to use the data.

7. Conclusions

A considerable part of public spending is lost due to fraud, waste, and corruption; therefore, governments worldwide have developed policies and initiatives in order to increase transparency and accountability. One method to realise this is to publish procurement and related data openly in a structured and homogeneous way so that various stakeholders could oversee and analyse public expenditure and related processes. In this respect, in this article, we presented our experience for acquiring, integrating, and publishing public procurement data and related data sets by using Linked Open Data principles and of applying anomaly detection techniques.
Our experience firstly shows that data integration through ontologies and existing data mapping tools is a viable solution for integrating disparate public data sets. Secondly, anomaly detection techniques when applied over an integrated data set open up a large space for relevant stakeholders for indepth and richer analyses. The challenges involved in the process mostly relate to data quality and poor data publication practices. Therefore, we pointed out a number of data quality issues and suggested a set of guidelines for publishing high quality procurement data.
The future work will include identifying and integrating more relevant data sets, developing (semi-)automated methods and techniques for addressing data quality issues, creating new software tools to support the data integration process, and implementing more anomaly detection techniques together with domain experts. The platform and approach used in this study is to be deployed in other national, local, regional, and international contexts to showcase the benefits of open data and challenges related to the data quality and publication processes to policy makers, data publishers, and other relevant stakeholders.

Author Contributions

Conceptualisation, all; methodology, all; software, A.S., B.E., C.B.-O., F.Y.-M., M.K. and M.P.; validation, all; investigation, all; writing—original draft preparation, all; writing—review and editing, all; project administration, A.S. and T.C.L.; funding acquisition, Ó.C., I.M., C.T., E.S. and T.C.L. All authors have read and agreed to the published version of the manuscript.

Funding

This research was funded by European Commission Horizon 2020, grant number 780247.

Conflicts of Interest

The authors declare no conflict of interest.

References

  1. OECD Principles for Integrity in Public Procurement; Technical Report; Organisation for Economic Co-Operation and Development: Paris, France, 2009.
  2. Safarov, I.; Meijer, A.; Grimmelikhuijsen, S. Utilization of open government data: A systematic literature review of types, conditions, effects and users. Inf. Polity 2017, 22, 1–24. [Google Scholar] [CrossRef] [Green Version]
  3. Ruijer, E.; Evelijn, M. Researching the democratic impact of open government data: A systematic literature review. Inf. Polity 2017, 22, 233–250. [Google Scholar] [CrossRef]
  4. Futia, G.; Melandri, A.; Vetrò, A.; Morando, F.; Martin, J.C.D. Removing Barriers to Transparency: A Case Study on the Use of Semantic Technologies to Tackle Procurement Data Inconsistency. In Proceedings of the 14th International Conference on the Semantic Web (ESWC), Portorož, Slovenia, 28 May–1 June 2017; Volume10249, pp. 623–637. [Google Scholar] [CrossRef]
  5. Espinoza-Arias, P.; Fernández Ruíz, M.J.; Morlán-Plo, V.; Notivol-Bezares, R.; Corcho, Ó. The Zaragoza’s Knowledge Graph: Open Data to Harness the City Knowledge. Information 2020, 11, 129. [Google Scholar] [CrossRef] [Green Version]
  6. Janssen, M.; Charalabidis, Y.; Zuiderwijk, A. Benefits, Adoption Barriers and Myths of Open Data and Open Government. Inf. Syst. Manag. 2012, 29, 258–268. [Google Scholar] [CrossRef] [Green Version]
  7. Lourenço, R.P. An analysis of open government portals: A perspective of transparency for accountability. Gov. Inf. Q. 2015, 32, 323–332. [Google Scholar] [CrossRef]
  8. Muñoz-Soro, J.F.; Esteban, G.; Corcho, Ó.; Serón, F.J. PPROC, an ontology for transparency in public procurement. Semant. Web 2016, 7, 295–309. [Google Scholar] [CrossRef] [Green Version]
  9. Bobowski, S.; Gola, J.; Szydło, W. Access to Public Procurement Contracts in EU: Perspective of SMEs. In Proceedings of the 20th Eurasia Business and Economics Society Conference (EBES 2017), Vienna, Austria, 28–30 September 2018; pp. 89–103. [Google Scholar] [CrossRef]
  10. Soylu, A.; Corcho, Ó.; Elvesæter, B.; Badenes-Olmedo, C.; Blount, T.; Martínez, F.Y.; Kovacic, M.; Posinkovic, M.; Makgill, I.; Taggart, C.; et al. TheyBuyForYou Platform and Knowledge Graph: Expanding Horizons in Public Procurement with Open Linked Data. Semant. Web 2022, 13, 265–291. [Google Scholar] [CrossRef]
  11. Soylu, A.; Corcho, Ó.; Elvesæter, B.; Badenes-Olmedo, C.; Martínez, F.Y.; Kovacic, M.; Posinkovic, M.; Makgill, I.; Taggart, C.; Simperl, E.; et al. Enhancing Public Procurement in the European Union Through Constructing and Exploiting an Integrated Knowledge Graph. In Proceedings of the 19th International Semantic Web Conference (ISWC 2020), Athens, Greece, 2–6 November 2020; Volume 12507, pp. 430–446. [Google Scholar] [CrossRef]
  12. Yan, J.; Wang, C.; Cheng, W.; Gao, M.; Zhou, A. A Retrospective of Knowledge Graphs. Front. Comput. Sci. 2018, 12, 55–74. [Google Scholar] [CrossRef]
  13. Mountantonakis, M.; Tzitzikas, Y. Large-Scale Semantic Integration of Linked Data: A Survey. ACM Comput. Surv. 2019, 52, 1–40. [Google Scholar] [CrossRef]
  14. Hitzler, P. A Review of the Semantic Web Field. Commun. ACM 2021, 64, 76–83. [Google Scholar] [CrossRef]
  15. Guarino, N.; Oberle, D.; Staab, S. What Is an Ontology? In Handbook on Ontologies; Staab, S., Studer, R., Eds.; Springer: Berlin/Heidelberg, Germany, 2009; pp. 1–17. [Google Scholar] [CrossRef]
  16. Distinto, I.; d’Aquin, M.; Motta, E. LOTED2: An ontology of European public procurement notices. Semant. Web 2016, 7, 267–293. [Google Scholar] [CrossRef] [Green Version]
  17. Nečaský, M.; Klímek, J.; Mynarz, J.; Knap, T.; Svátek, V.; Stárka, J. Linked data support for filing public contracts. Comput. Ind. 2014, 65, 862–877. [Google Scholar] [CrossRef]
  18. Álvarez Rodríguez, J.M.; Gayo, J.E.L.; Cifuentes, F.; Hérnandez, G.; Sánchez, C.; Luna, J.A.G. Towards a Pan-European E-Procurement Platform to Aggregate, Publish and Search Public Procurement Notices Powered by Linked Open Data: The Moldeas Approach. Int. J. Softw. Eng. Knowl. Eng. 2012, 22, 365–384. [Google Scholar] [CrossRef]
  19. Miroslav, M.; Miloš, M.; Štavljanin, V.; Božo, D.; Đorđe, L. Semantic technologies on the mission: Preventing corruption in public procurement. Comput. Ind. 2014, 65, 878–890. [Google Scholar] [CrossRef]
  20. Csáki, C.; Prier, E. Quality Issues of Public Procurement Open Data. In Proceedings of the 7th International Conference on Electronic Government and the Information Systems Perspective (EGOVIS 2018), Regensburg, Germany, 3–5 September 2018; Volume 11032, pp. 177–191. [Google Scholar] [CrossRef]
  21. Kharlamov, E.; Jiménez-Ruiz, E.; Pinkel, C.; Rezk, M.; Skjæveland, M.G.; Soylu, A.; Xiao, G.; Zheleznyakov, D.; Giese, M.; Horrocks, I.; et al. Optique: Ontology-Based Data Access Platform. In Proceedings of the ISWC 2015 Posters & Demonstrations Track Co-Located with the 14th International Semantic Web Conference (ISWC-2015), Monterey, CA, USA, 11–15 October 2015; Volume 1486. [Google Scholar]
  22. Kharlamov, E.; Mailis, T.P.; Bereta, K.; Bilidas, D.; Brandt, S.; Jiménez-Ruiz, E.; Lamparter, S.; Neuenstadt, C.; Özçep, Ö.L.; Soylu, A.; et al. A semantic approach to polystores. In Proceedings of the International Conference on Big Data (BigData 2016), Washington, DC, USA, 5–8 December 2016; pp. 2565–2573. [Google Scholar] [CrossRef]
  23. Corcho, O.; Priyatna, F.; Chaves-Fraga, D. Towards a new generation of ontology based data access. Semant. Web 2020, 11, 153–160. [Google Scholar] [CrossRef]
  24. Soylu, A.; Elvesæter, B.; Turk, P.; Roman, D.; Corcho, Ó.; Simperl, E.; Konstantinidis, G.; Lech, T.C. Towards an Ontology for Public Procurement Based on the Open Contracting Data Standard. In Proceedings of the 18th IFIP WG 6.11 Conference on e-Business, e-Services, and e-Society (I3E 2019), Trondheim, Norway, 18–20 September 2019; Volume 11701, pp. 230–237. [Google Scholar] [CrossRef]
  25. Roman, D.; Alexiev, V.; Paniagua, J.; Elvesæter, B.; Zernichow, B.M.V.; Soylu, A.; Simeonov, B.; Taggart, C. The euBusinessGraph Ontology: A Lightweight Ontology for Harmonizing Basic Company Information. Semant. Web 2022, 13, 41–68. [Google Scholar] [CrossRef]
  26. Dimou, A.; Sande, M.V.; Colpaert, P.; Verborgh, R.; Mannens, E.; de Walle, R.V. RML: A Generic Language for Integrated RDF Mappings of Heterogeneous Data. In Proceedings of the Workshop on Linked Data on the Web Co-Located with the 23rd International World Wide Web Conference, Seoul, Korea, 7–11 April 2014; Volume 1184. [Google Scholar]
  27. Lyra, M.S.; Pinheiro, F.L.; Bacao, F. Public Procurement Fraud Detection: A Review Using Network Analysis. In Proceedings of the Tenth International Conference on Complex Networks and Their Applications (COMPLEX NETWORKS 2021), Madrid, Spain, 30 November–2 December 2022; Volume 1015, pp. 116–129. [Google Scholar] [CrossRef]
  28. García Rodríguez, M.J.; Rodríguez-Montequín, V.; Ballesteros-Pérez, P.; Love, P.E.; Signor, R. Collusion detection in public procurement auctions with machine learning algorithms. Autom. Constr. 2022, 133, 104047. [Google Scholar] [CrossRef]
Figure 1. Data sourcing process for the procurement data and related products including the KG, platform, and related products.
Information 13 00099 g001
Figure 2. Knowledge graph construction process for procurement and company data provided by OpenOpps and OpenCorporates, respectively.
Information 13 00099 g002
Figure 3. The fragments of OCDS and euBusinessGraph ontologies for representing procurement and company data, respectively.
Information 13 00099 g003
Figure 4. The results of the periods method applied over Slovenian spending data.
Information 13 00099 g004
Figure 5. The results of the Derivatives method applied over Slovenian spending data.
Information 13 00099 g005
Figure 6. The results of the statistical analysis showing the interdependence of tender value and the number of employees of a bidder.
Information 13 00099 g006
Figure 7. The results of the Clusters method for finding previously undetected patterns.
Information 13 00099 g007
Table 1. Number of procurement data sources gathered by continent.
Data Sources by ContinentCount of Sources
Global10
Africa16
Asia29
Europe569
North America44
Oceania3
South America14
Grand total685
Publisher’s Note: MDPI stays neutral with regard to jurisdictional claims in published maps and institutional affiliations.

