Article

Detecting Learning Patterns in Tertiary Education Using K-Means Clustering

by
Emmanuel Tuyishimire
1,*,
Wadzanai Mabuto
2,
Paul Gatabazi
3 and
Sylvie Bayisingize
4
1
Department of Knowledge and Information Stewardship, University of Cape Town, Cape Town 7701, South Africa
2
Department of Accountancy, College of Business and Economics, University of Johannesburg, Johannesburg 524, South Africa
3
Department of Mathematics and Applied Mathematics, University of Johannesburg, Johannesburg 524, South Africa
4
Department of Finance and Banking, Mount Kenya University, Kigali 00100, Rwanda
*
Author to whom correspondence should be addressed.
Information 2022, 13(2), 94; https://doi.org/10.3390/info13020094
Submission received: 21 November 2021 / Revised: 27 December 2021 / Accepted: 28 December 2021 / Published: 17 February 2022
(This article belongs to the Special Issue Artificial Intelligence Applications for Education)

Abstract

:
We are in the era where various processes need to be online. However, data from digital learning platforms are still underutilised in higher education, yet, they contain student learning patterns, whose awareness would contribute to educational development. Furthermore, the knowledge of student progress would inform educators whether they would mitigate teaching conditions for critically performing students. Less knowledge of performance patterns limits the development of adaptive teaching and learning mechanisms. In this paper, a model for data exploitation to dynamically study students progress is proposed. Variables to determine current students progress are defined and are used to group students into different clusters. A model for dynamic clustering is proposed and related cluster migration is analysed to isolate poorer or higher performing students. K-means clustering is performed on real data consisting of students from a South African tertiary institution. The proposed model for cluster migration analysis is applied and the corresponding learning patterns are revealed.

1. Introduction

The 4th Industrial Revolution (4IR) has been changing existing means of production. This is due to the fact that various technological models have surfaced. These include, for example, telecommunication models, advanced data collection and transportation models, together with various data and system analysis models. Many more additional models have been developed and implemented to build various intelligent systems and this has drastically developed the global economy [1].
The world is now in the era where intelligent systems are used to enable most activities. Additionally, 2019 marked a historical year when the COVID-19 pandemic imposed social distancing on the world, and this created a need for digitizing various processes for community interaction. This is changing the model of communication among people, yet various communication means need to be facilitated by various mediating digital mechanisms.
Measures to respond to such novel and critical conditions have begun to surface. For example, the United Nations Educational, Scientific and Cultural Organisation (UNESCO) launched an initiative to (i) help countries in mobilizing resources and implementing innovative and context-appropriate solutions to provide education remotely, leveraging hi-tech, low-tech and no-tech approaches; (ii) seek equitable solutions and universal access; (iii) ensure coordinated responses and avoid overlapping efforts; and (iv) facilitate the return of students to school when they re-open to avoid an upsurge in dropout rates [2]. This indicates that the educational systems need to be re-visited to adopt the critical conditions created in a technology-driven era.
On the other side, poor understanding of student learning patterns usually limits the development of adaptive teaching and learning processes. It is known that keeping university students consistently engaged with their academic studies and taking ownership of their learning, is a widely recognised challenge for most educators [3]. The deficiencies in learner behaviour account for a significant portion of academic failure; yet, there has been limited research in mining data useful for understanding student learning patterns which can be used to predict academic performance or to optimise the teaching process. Without relying on objective evidence of student learning behaviours, educators are unable to differentiate between challenges that relate to the larger class from those specific to individual students. Therefore, some students are at risk of being left behind or being overlooked in the learning process. This is particularly relevant in the context of traditionally disadvantaged institutions, which enrol students of wide-ranging aptitude; these students are at increased risk of sub-optimal academic achievement in the absence of evidence-informed adaptive learning and teaching processes.
It is also known that data from digital learning platforms and machine learning methods are underutilised in higher education. It is known that the advent of machine learning methods and the progressive use of digital learning platforms at institutions of higher learning have created opportunities for educators to understand and modify the learning behaviours of students. However, myths around the complexity of machine learning and the slow adoption of teaching technologies often result in missed opportunities to improve efficiencies in teaching and learning processes.
This loudly calls for changes in educational systems which need to be supplemented with advanced student evaluation models. It is important to periodically and timely assess student performance in order to adjust teaching and learning strategies.

1.1. Work Done

Models for student performance evaluation have been done in various settings. For nursing students, performance evaluation has been done in [4], by following a competency-based education approach [5], i.e., students are assessed based on real-world professional performance. In this study, it has been shown that this model of assessing students outperforms other traditional models of assessments such as Grade Point Average (GPA), referred to as the most popular traditional quantitative indicator to assess academic performance. However, this model ranks students in terms of how they could professionally perform, and does not predict how students would perform in further studies. This model does not provide room for an instructor to mitigate poor performances which might impact on future learning processes.
To make the teaching-learning processes more efficient, a model to determine the relationship between teacher performance scores and student achievement has been proposed in [6]. Here, it has been found that there was a significant correlation between teacher’s performance and the whole class performance. However, this does not determine those critical students who might need additional assistance.
On the other hand, a student-centred model for evaluating student performance in laboratory applications has been proposed using fuzzy logic [7]. This Set Theory approach has been found to outperform classical models of performance evaluation, i.e., the models for performance evaluation based on exam results, which is evaluated only as success or failure. Performance levels/compartments have been extended from two (success or failure) to 5 (Very Unsuccessful, Unsuccessful, Average, Successful, Very Successful). Given the performance of a student based on a list of assessments, there is a set of logic rules ([8]) to determine which current level a student may be ranked in. However, this model of performance evaluation requires the consensus of all involved educators on the rules to be adopted. Beside, this qualitative way of ranking students does not show how much they have improved or lowered. Furthermore, this model uses only one performance score to rank students, and this might provide confusing insights on the improvement or lowering of students.
Furthermore, the factors related to student performance in a distance-learning setting have been evaluated in [9], for business communication course, and for medical students, the factors have been revealed in [10]. For private colleges, performance factors have been shown in [11]. These kinds of factors are course-related and may not necessarily be applicable generally to studying student performance in any subject.
K-means clustering has been used to group online students based on their engagement [12]. K-means has further been used in [13,14] to cluster students based on their learning behaviours, based on learning objects. The algorithm has also been used in [15] for healthcare, to design care pathways for patients, and in [16], for patient segmentation with application to hip fracture care in Ireland. On the other hand, it has been used in [17], to understand the Twitter users’ opinions on COVID-19 vaccination. Clearly, K-means is the modern machine learning model to group individual based on related scores.
There have been several data mining models to predict students performance [18,19,20,21,22,23]. However, none of them focuses on students continuous development, aiming for mitigating students learning development.

1.2. Contribution

Recently, in [24], an investigation on the variation of the level of competencies achievement in different moments (in 11 years) for tertiary student has been done. This work proposed a model for assessing the course, but does not provide insights for the ongoing (short period) learning processes, to allow immediate mitigation mechanisms. More importantly, the article concludes by calling for future complementary works including detecting new methods that may appeal to new university students, which could be aligned to the learning process of students and their assessment. Such models would be essential to assist critical students at the right time.
As of now, the article has been complemented/cited by two other works (see [25,26]), but none of these addressed the detection of learning patterns for students, based on their learning processes and assessments. This leaves this topic as a subject of research.
This paper has concentrated on students since the beginning of a year and uses consecutive assessments to influence the learning processes. We proposes a model for identifying and isolating critical students who need to be subjected to mitigating processes, for learning development.
In this article, patterns of students performance in a course are determined by analysing each student’ s marks distribution and calculating related distribution’s (independent) parameters, on the basis of which a dynamic K-means clustering is performed. The current performance level of students in the same cluster is determined by the underlying cluster heads. Inter-cluster migration is analysed to evaluate students improvement or lowering, and hence critical students.

1.3. Paper Organisation

The rest of this paper is organised as follows. The proposed performance model is described in Section 2 and related experimental results are discussed in Section 3. Lastly, the paper is concluded in Section 4.

2. Proposed Model for Students Performance Evaluation

The proposed model for learning performance patterns is described in Figure 1.
The process consists of repetitively starting from the top to the bottom, as described in Figure 1. The steps are described as follows.

2.1. Distribution Entry

Each student may be described as the schema Student below. In fact, a student is determined by his/her student number n and his sequence of marks obtained in his previous quizzes, if any.
Information 13 00094 i001
Note that each student’s number might reflect more static details such as demographic or any other recorded data which might bring insight into how the students conduct themselves in the whole learning process. Each time a new quiz/test is given, the schema above may be updated as follows.
Information 13 00094 i002
Keeping the student’s number, the student’s quizzes sequence is updated by adding (concatenating) the new quiz marks.

2.2. Compute Each Distribution Parameter

The performance evolution for each student may be determined by some parameters of his/her marks distribution. In this paper, we choose two linearly independent parameters, namely:
  • Current mean: this is to determine the expected mark for the student, and this can be used to determine whether a student may have pass or fail marks.
  • Current standard deviation: it would determine how far the student’s mark may be different from their current average marks. This would help in showing improving or lowering students.
Note that a student’s performance may be studied based on more than one parameter (two parameters have been considered in this). In common practice, only simple average (current mean) has been employed to rank students. However, this is not enough to tell whether a student’s performance is critical or not. For instance, two students would have the same mean, while one is improving and another is not. So, to isolate less improving (critical) students, standard deviation has been used to study student consistency. This would help in predicting whether a student would do better or worse in the future.
Example 1.
Consider a case of three students A, B and C, who wrote their first two quizzes, and obtained the marks as shown in Table 1.
Table 1 shows that all students have the same average, but perform differently. The performance of Student A is critical as it corresponds to a highest deviation. This is the type of students who need to be isolated and subjected to some particular mitigation measures. This example shows that the current mean alone may not be sufficient to isolate some critical students, and this would be worse when many quizzes are involved.

2.3. Distribution Clustering

Now that we have two independent parameters, a distance function may be defined on them. Here, we considered the Euclidean distance, i.e., given that s 1 ( λ 1 , σ 1 ) and s 2 ( λ 2 , σ 2 ) two students and their respective current averages λ 1 and λ 2 ; and current standard deviations σ 1 and σ 2 . The considered distance is expressed as follows.
d ( s 1 , s 2 ) = ( λ 2 λ 1 ) 2 + ( σ 2 σ 1 ) 2
The distance function shown in Equation (1) expresses the difference between two students’ performances. It can then be used to group students based on how they perform. This setting (two independent parameters and a distance function) allows the use of a K-means algorithm [27], the famous clustering model for this context; see Section 1.1. In fact, various clustering algorithms have been discussed in [28,29,30], and they use different distance functions for different purposes. In this work, we have chosen K-means clustering, since the involved distance function is Euclidean, and our proposed model has been applied to a data set with a manageable size (not so big).
It is recognised that in common practices, the optimum number k of clusters is first computed, but this is beyond this paper’s work. The main purpose of this work was to isolate students with critical performance conditions to answer the question: who needs extra care for a better performance?

2.4. Migration Analysis

After student clustering, it is important to determine whether any two students are performing differently (students in the different clusters) or are performing in the same way (students in the same cluster). Moreover, based on cluster heads, two clusters may be compared in terms of underlying student performance.
Each time a new quiz is given to students, the above mentioned process is repeated. The new clustering can then be compared with the previous clustering (if any). New marks entry clearly change the new values of parameters. Consequently, some students would eventually change their level of performance and hence clusters (migration). His/her current cluster and previous cluster may be compared to determine whether a student is improving or not.
Once critical students are discovered, mitigation processes may be applied to them. These include the use of Q-matrices [31], and additional data such demographic data, to structure special tutorials and mentoring sessions. However, these mechanisms are beyond the work covered in this paper.

3. Experimental Results

The proposed model has been applied to real data from second year students at the University of Johannesburg, whose faculty and department are omitted in this paper. We consider a class of 703 students. Marks for 9 consecutive quizzes (out of 20 marks each) have been recorded for each student. We compute the mean and standard deviation for each student, and these two parameters have been used as independent dimensions for clustering the students. As shown in Table 2, Python packages have been used for data management, clustering and visualisation.
On the other hand, students’ performances have been done in three major steps:
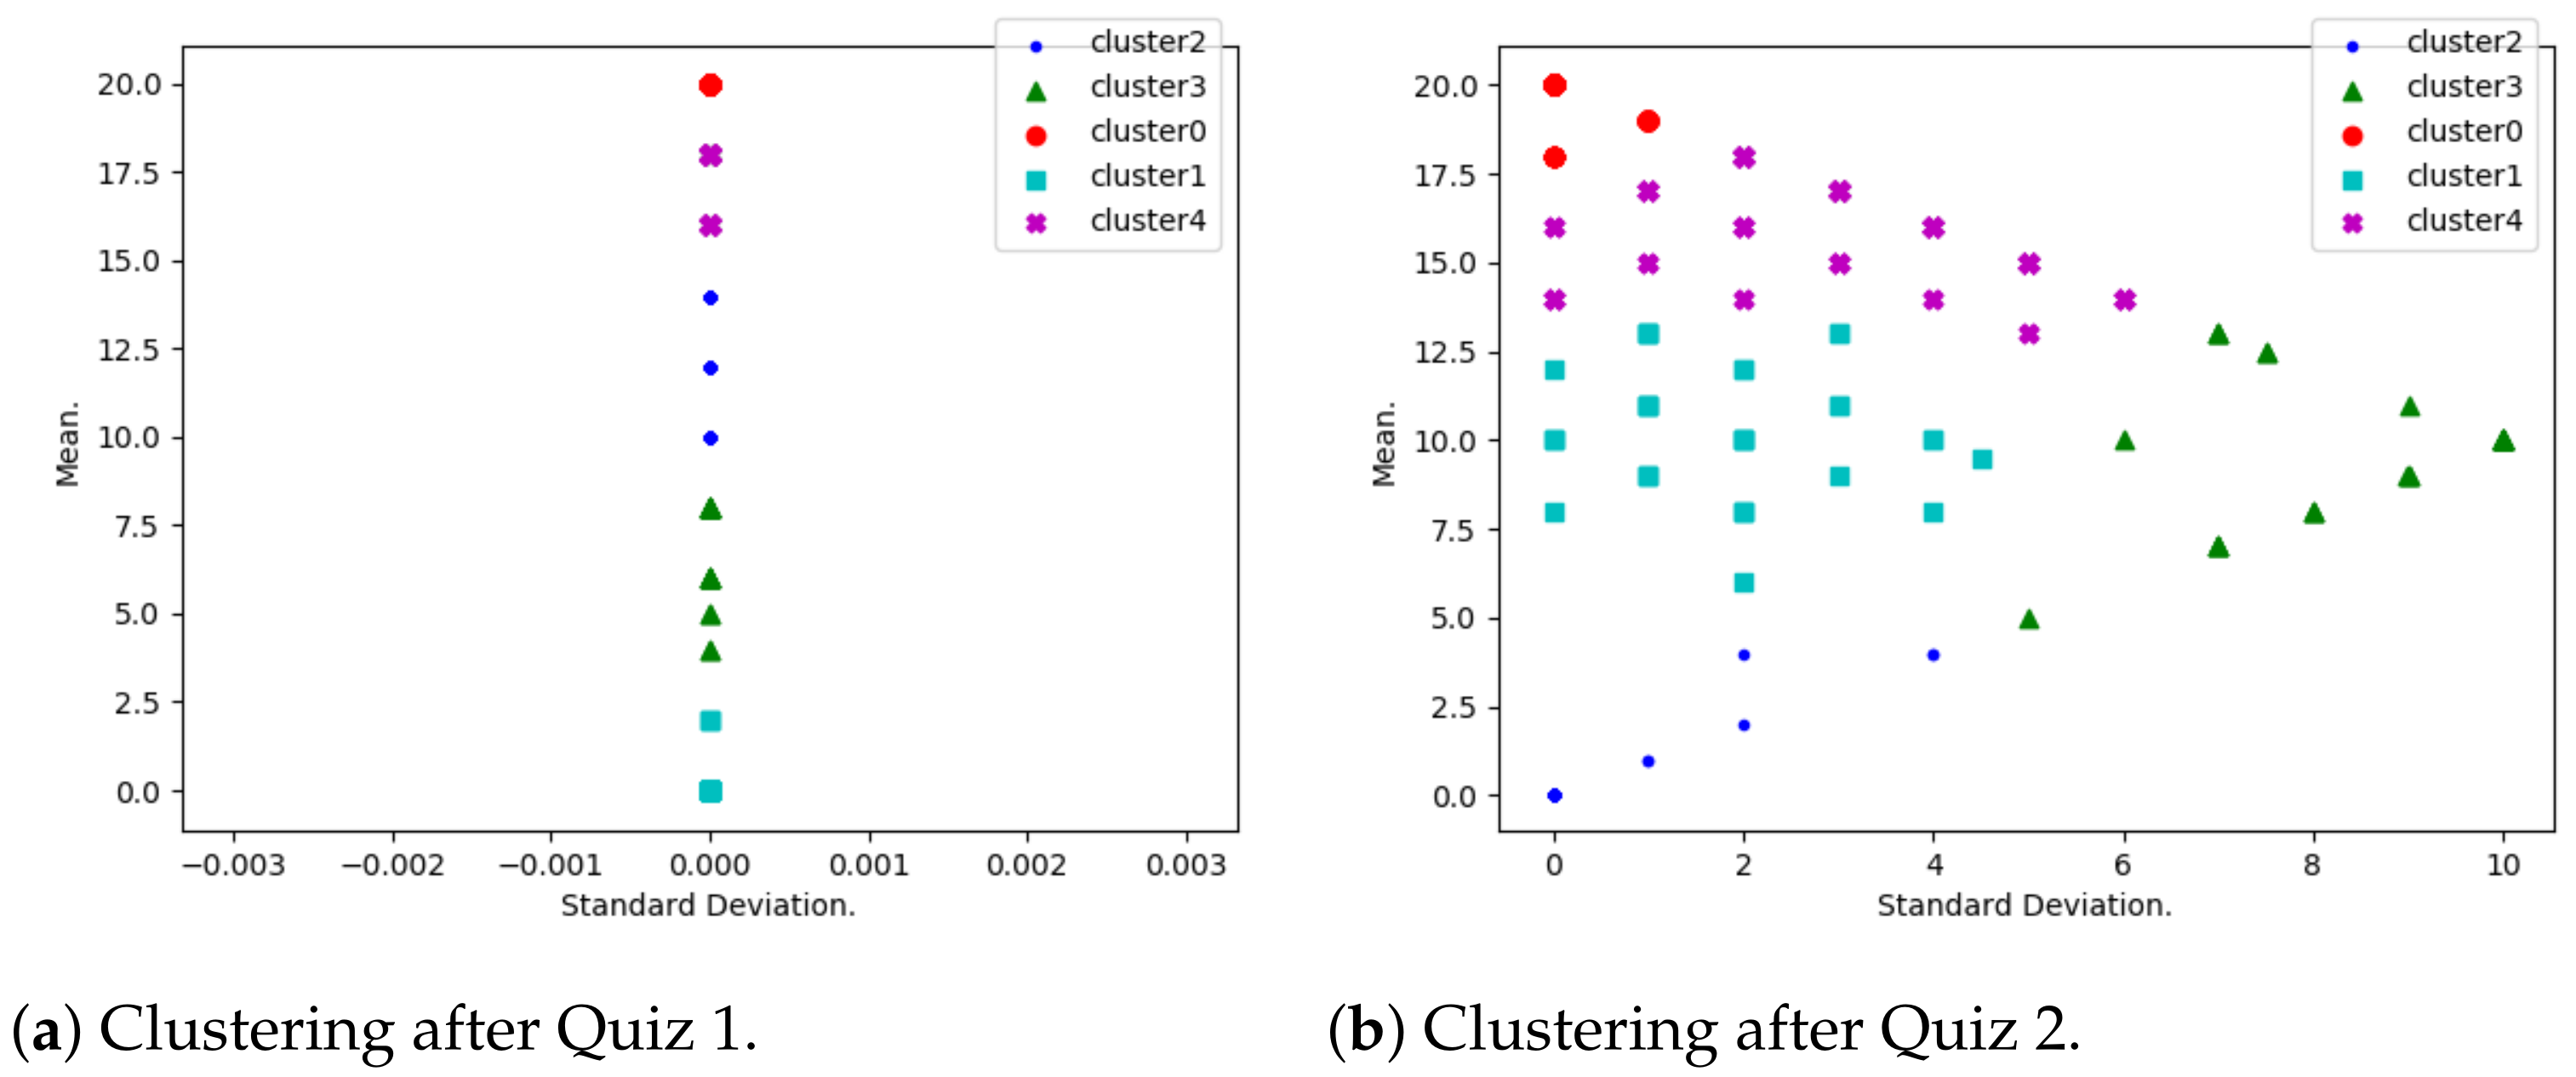
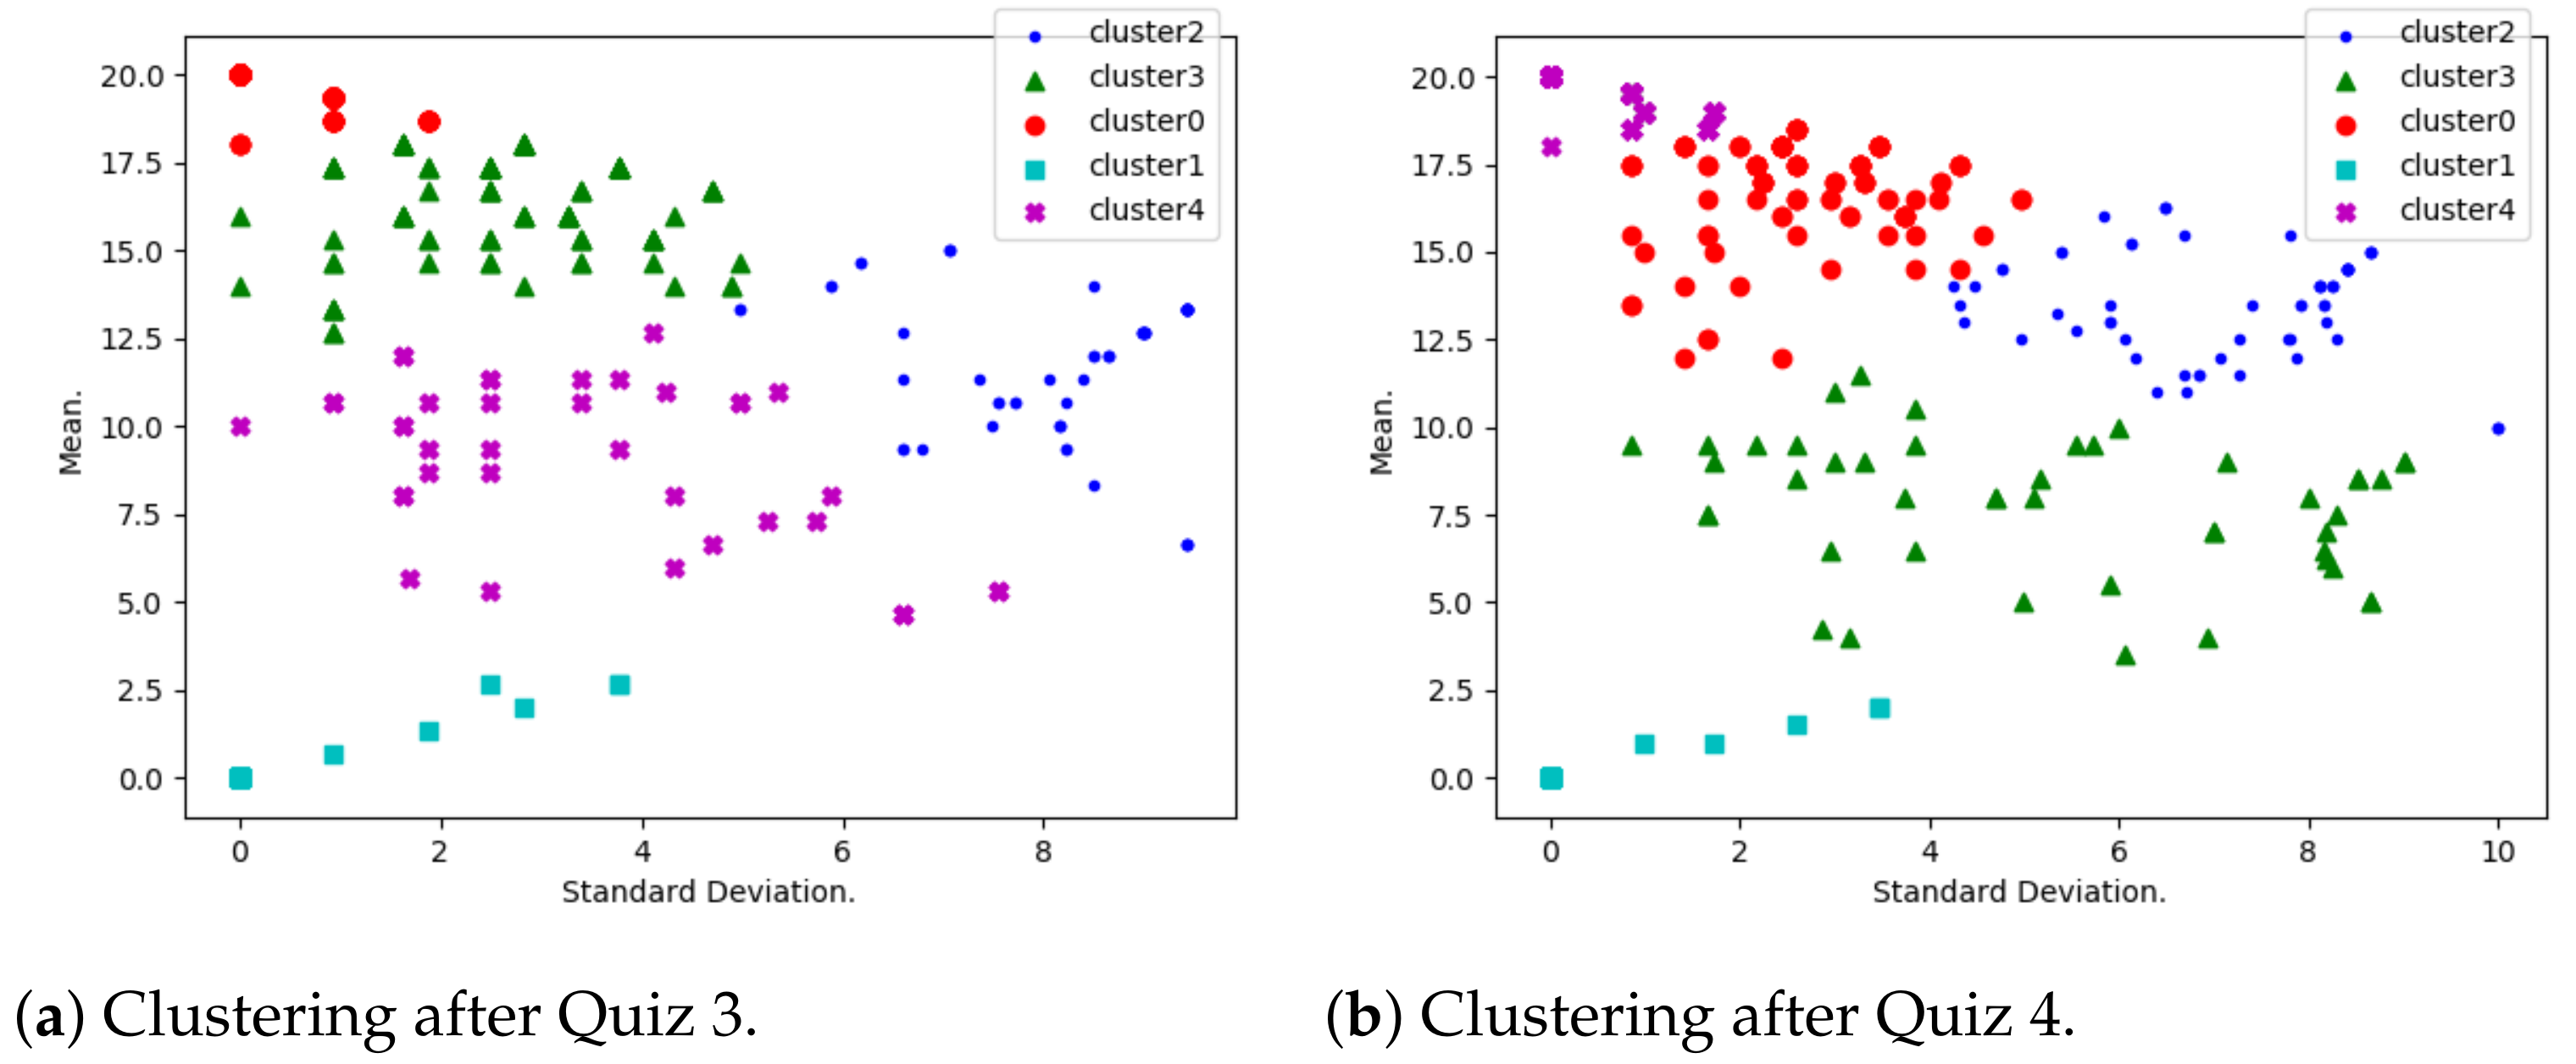
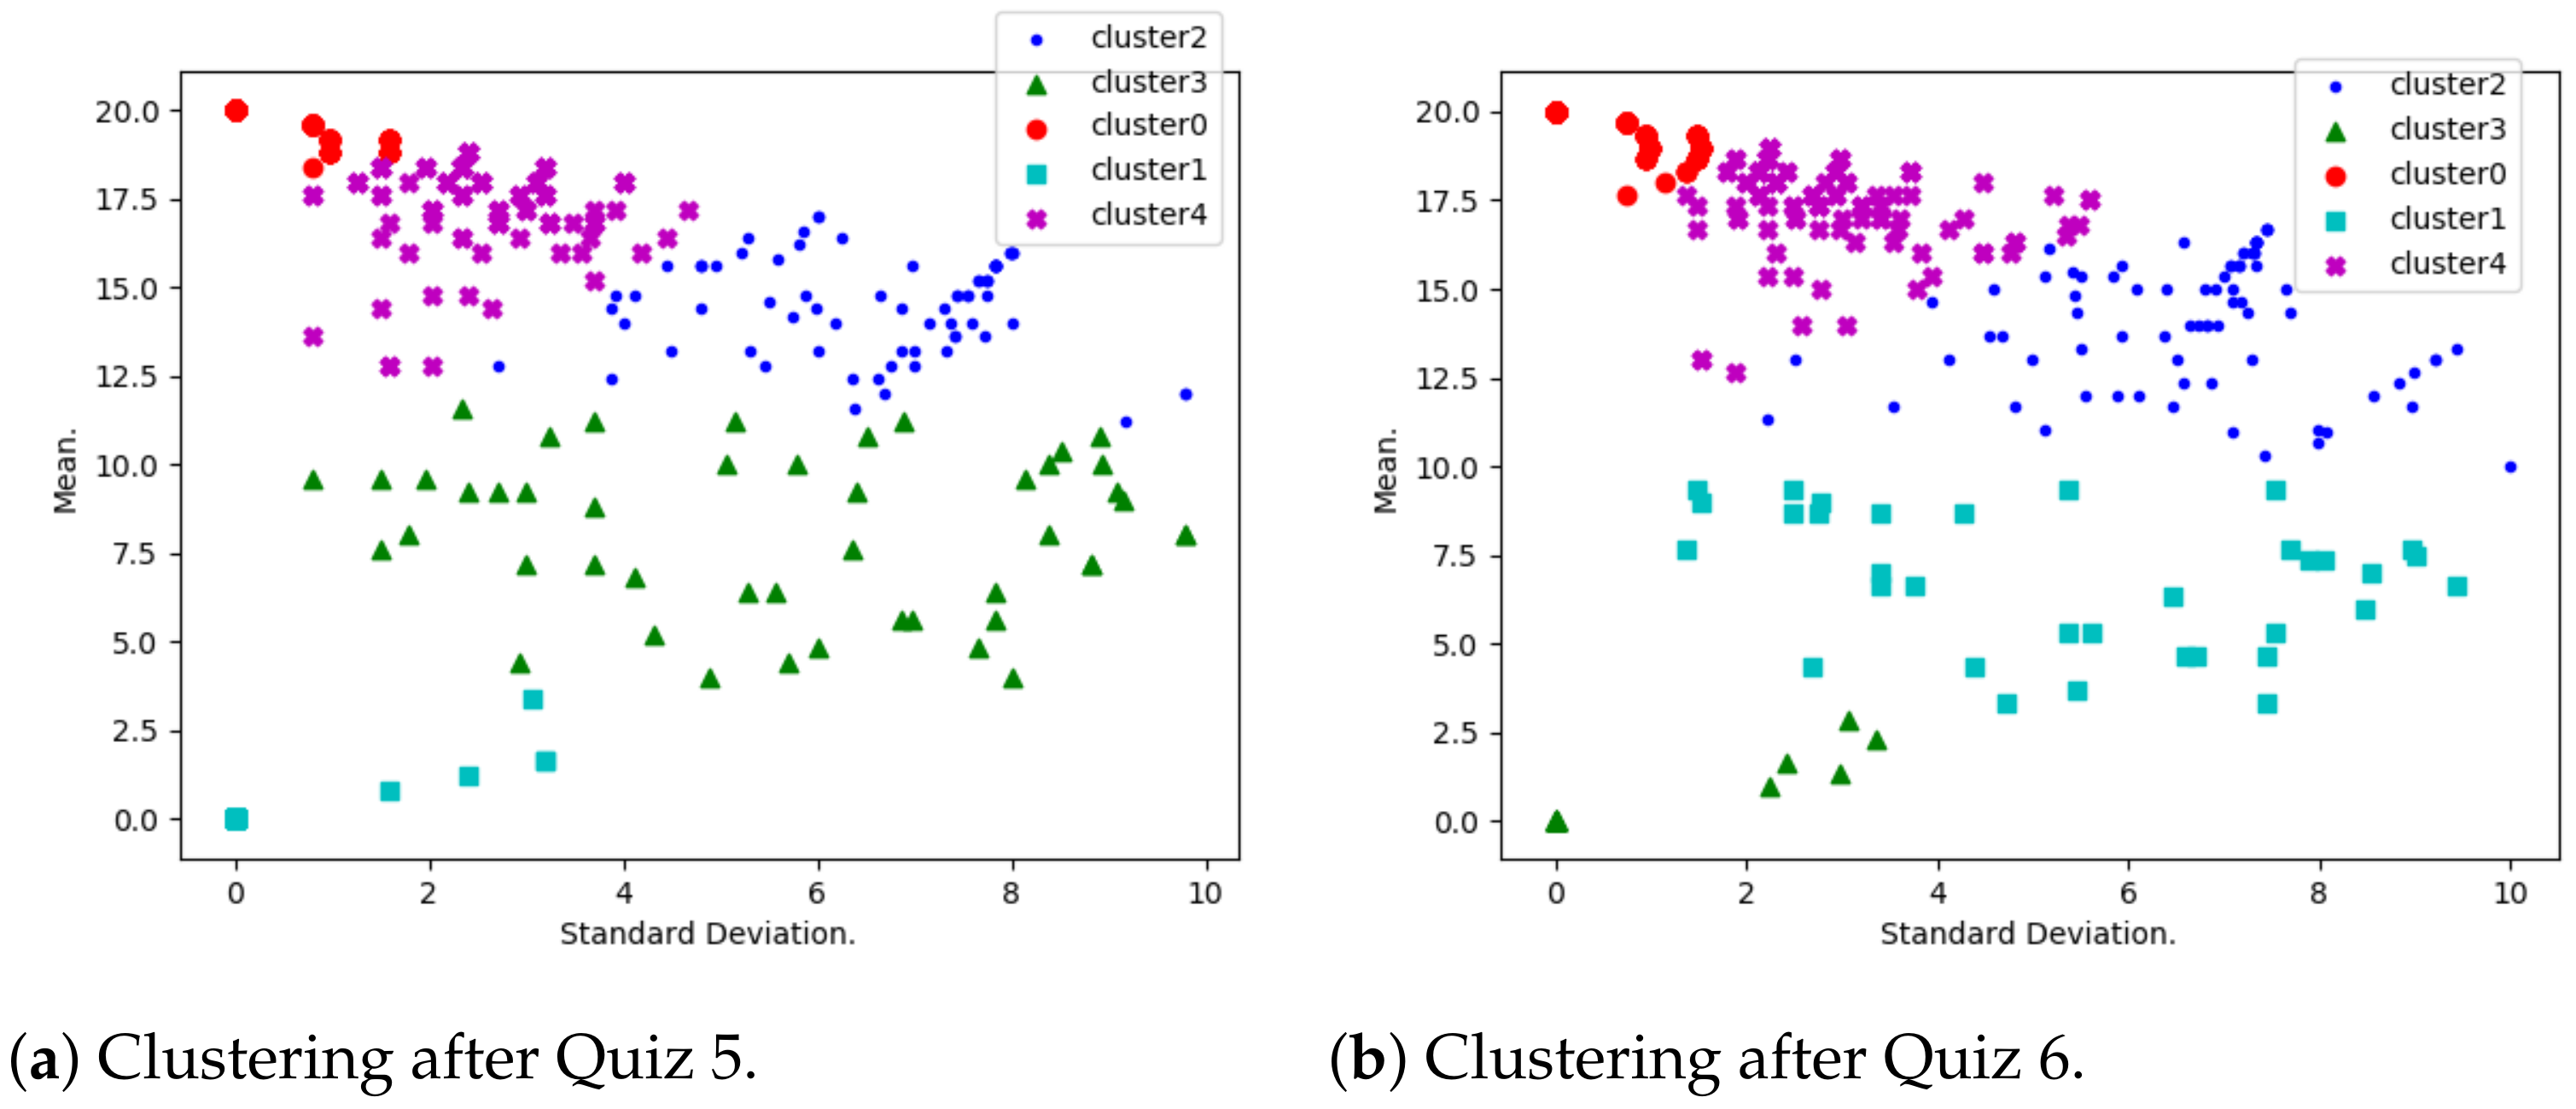
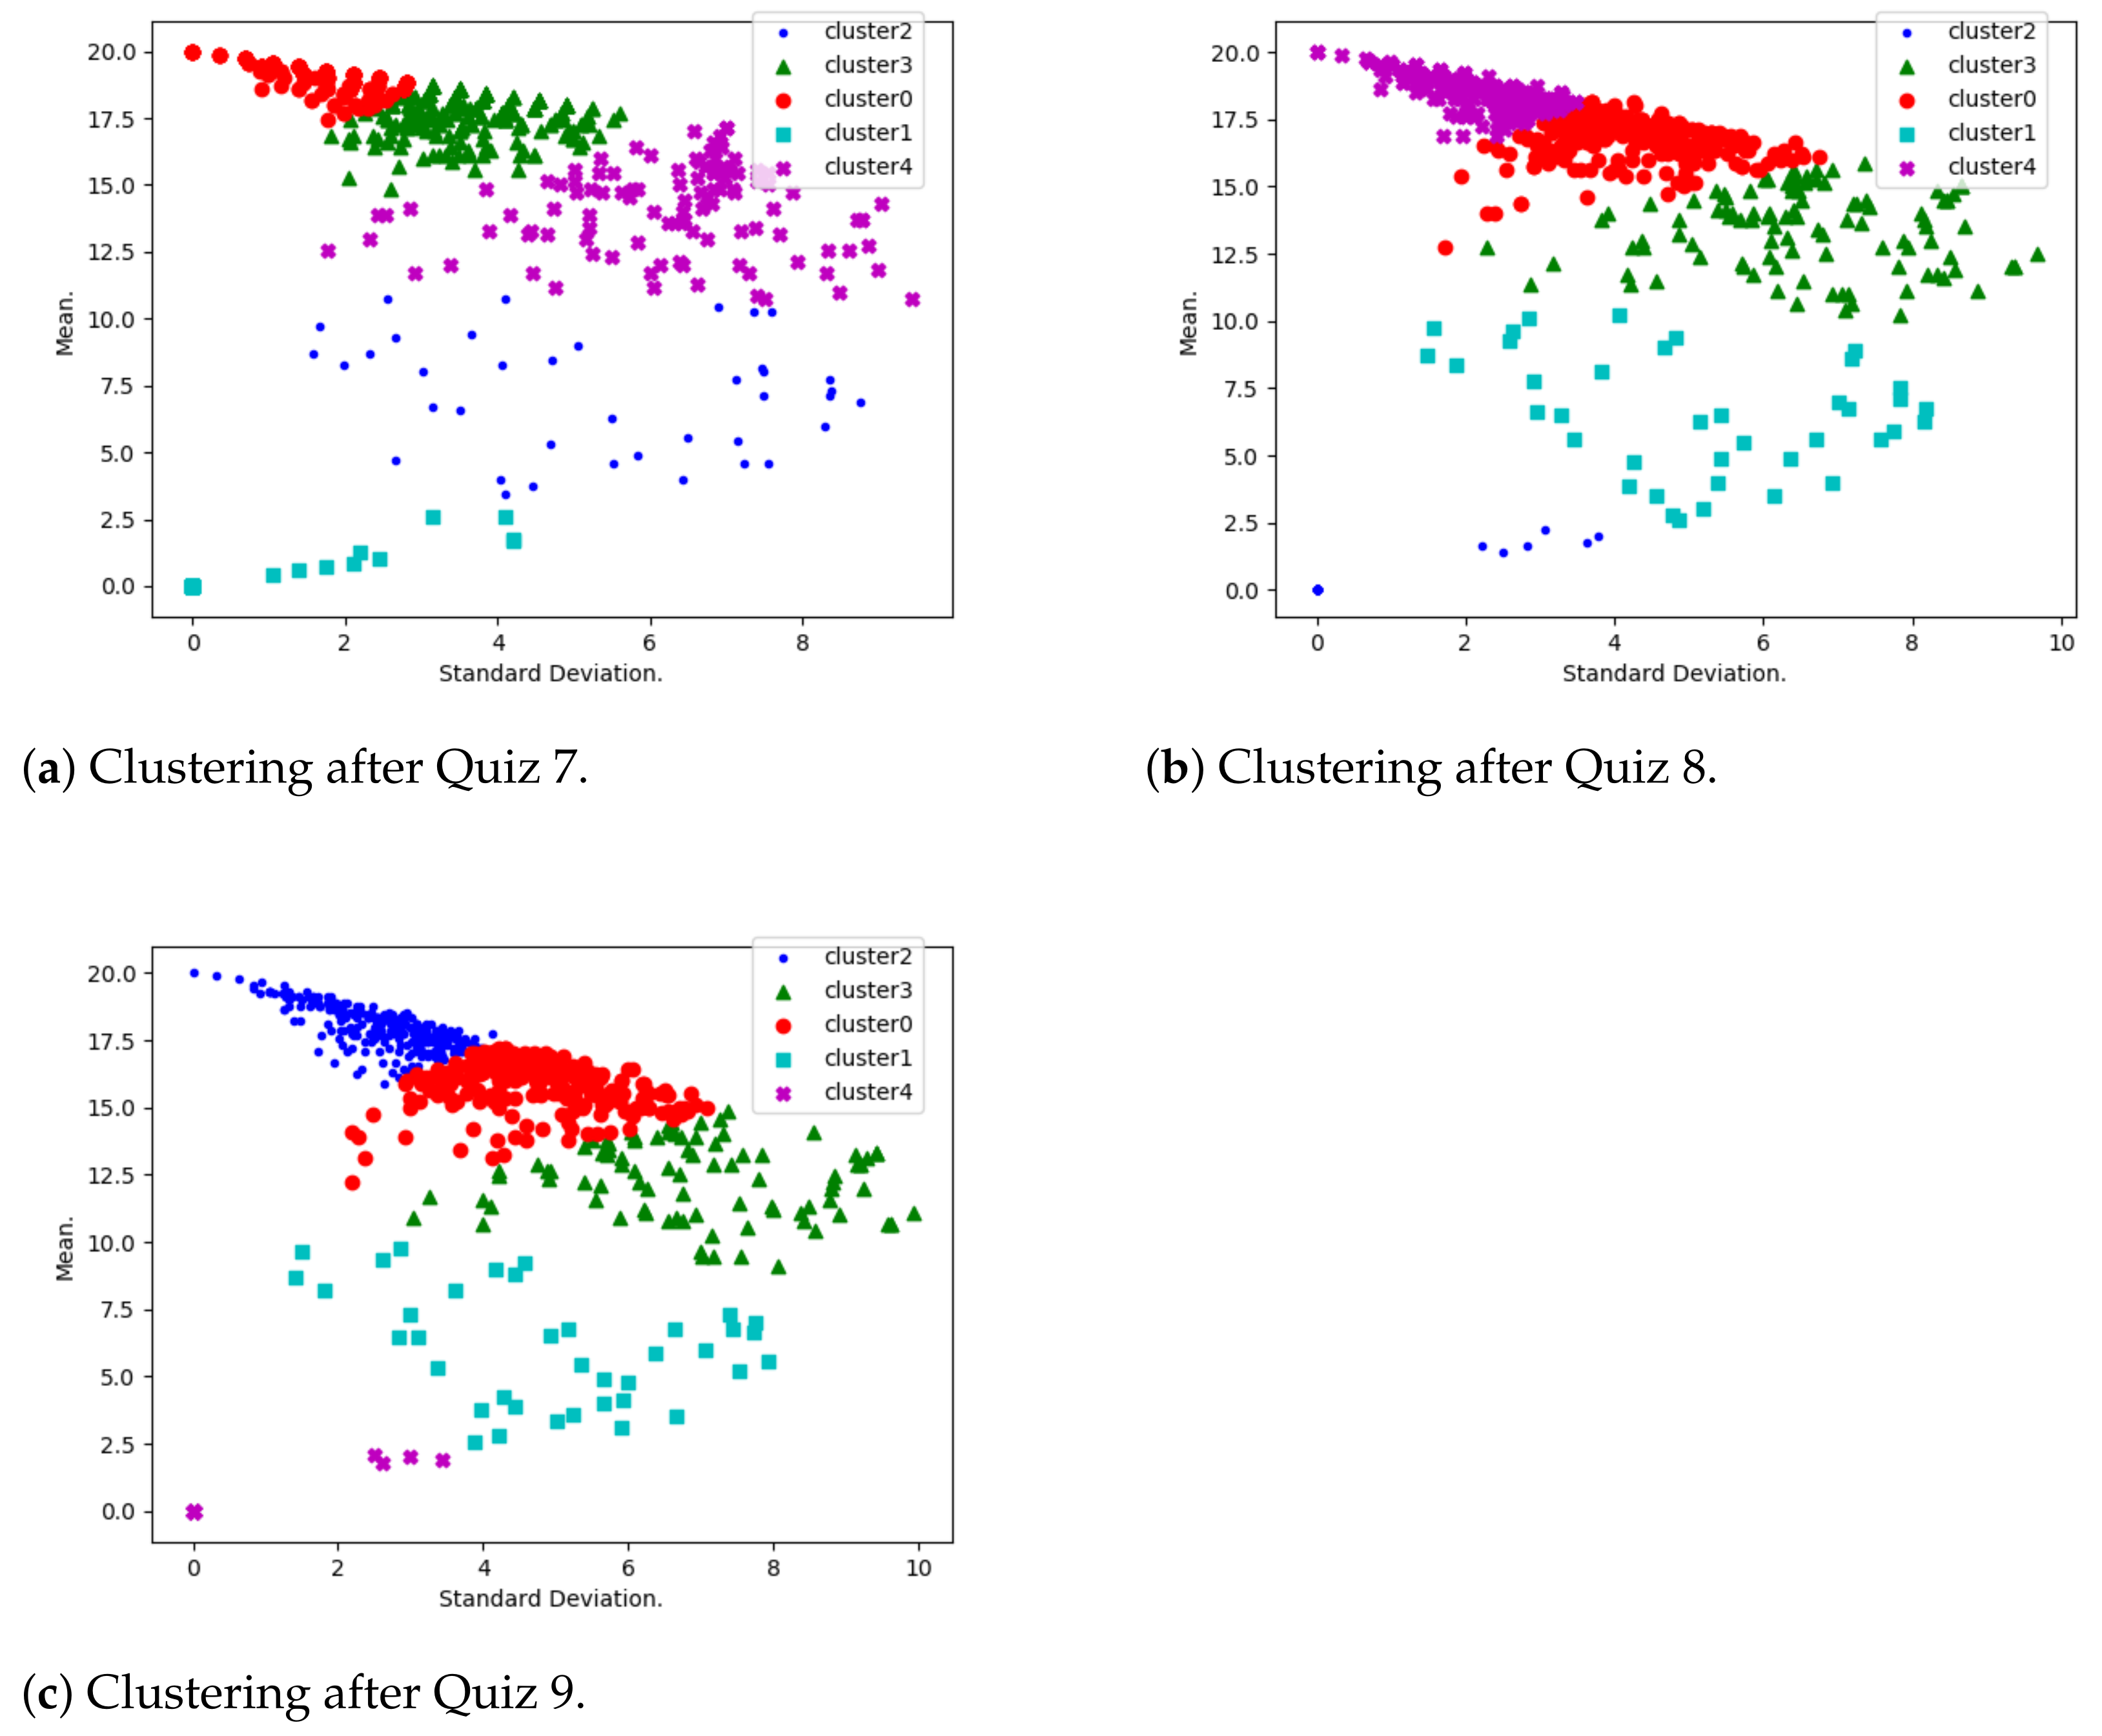
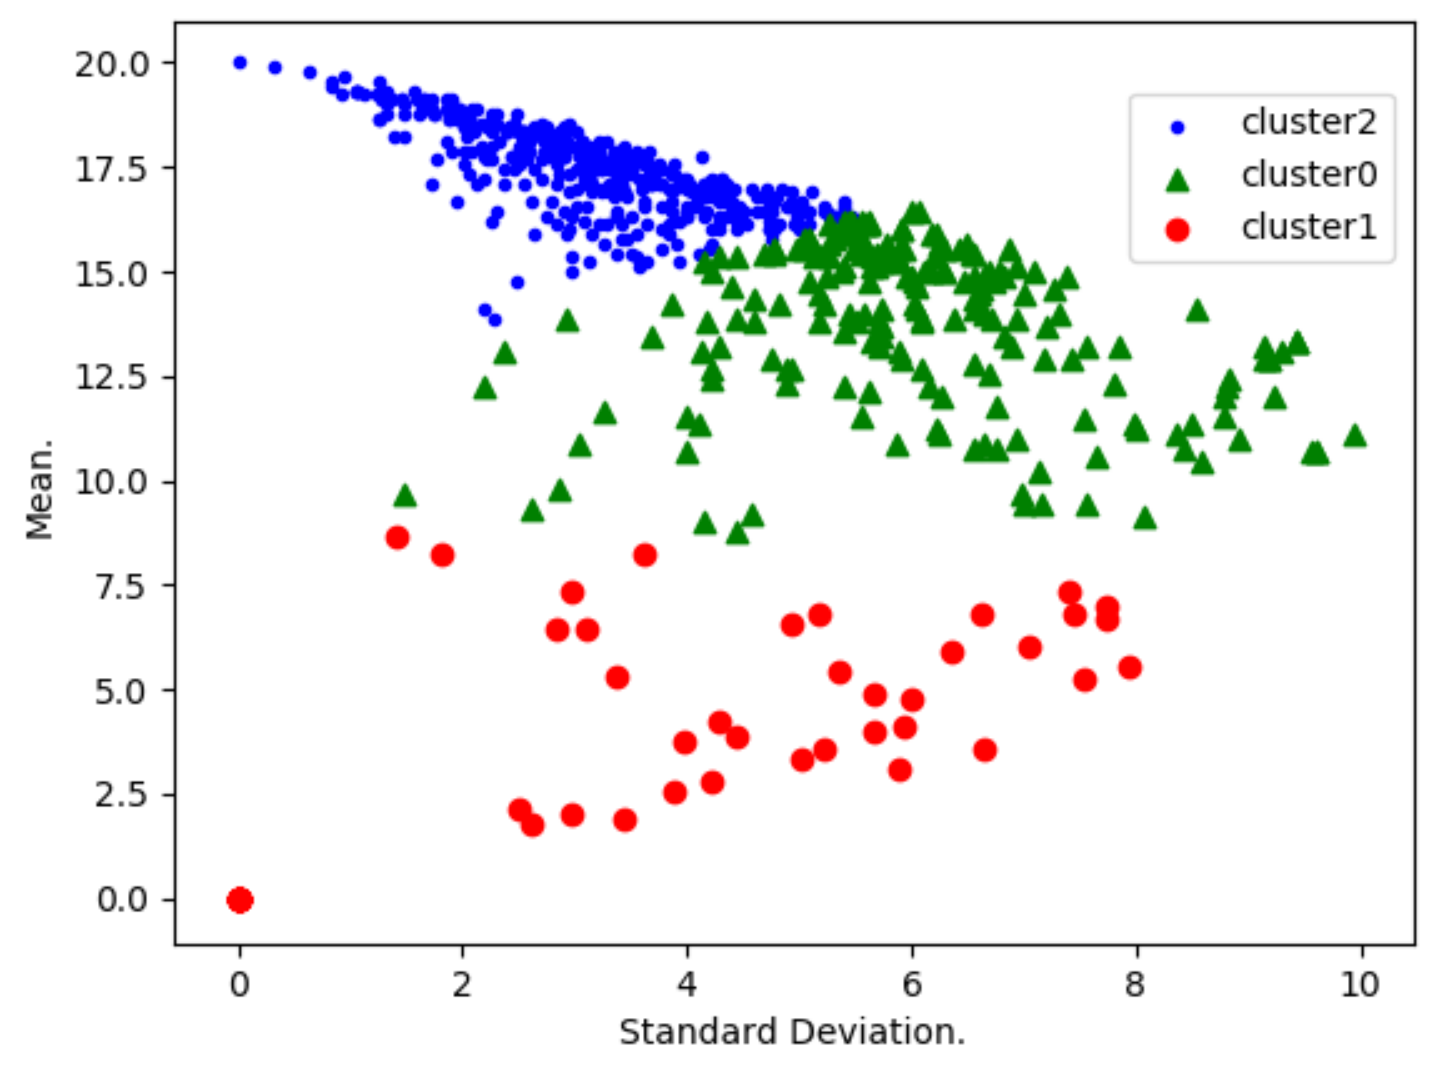
  • Performance evolution. A K-means algorithm has been used to group students according to their mean and standard deviation.
    As shown by Table 3, several default values have been considered for the Python-Sklearn function “sklearn.cluster.KMeans”. The considered number of cluster is first 5 (with a silhouette score calculated to be 0.39) and later 3 (with a silhouette score calculated to be 0.58). Many clusters reflect a situation where few critical students need to be isolated, and a smaller number of clusters reflects a situation where more critical students need to be isolated.
    When using K-means, it is a common practice to use optimum number K of clusters (see [28,29] for example). This number is determined by minimizing a cost function, and a great example of such a function is the Silhouette Score, which is expressed in terms of the considered independent parameters. However, in this study, the optimal number K truly depends on various parameters (other than the mean and standard deviation used in this study), such as demographic and historical ones. This is why we believe that the optimum number of clusters, in this context, needs to be determined in future research.
    Students with a highest mean and least standard deviation are considered to be consistently motivated; those with a lowest mean and least standard deviation are the ones who are consistently discouraged. High standard deviation shows that the corresponding students have diverse marks, due to either encouragement or discouragement.
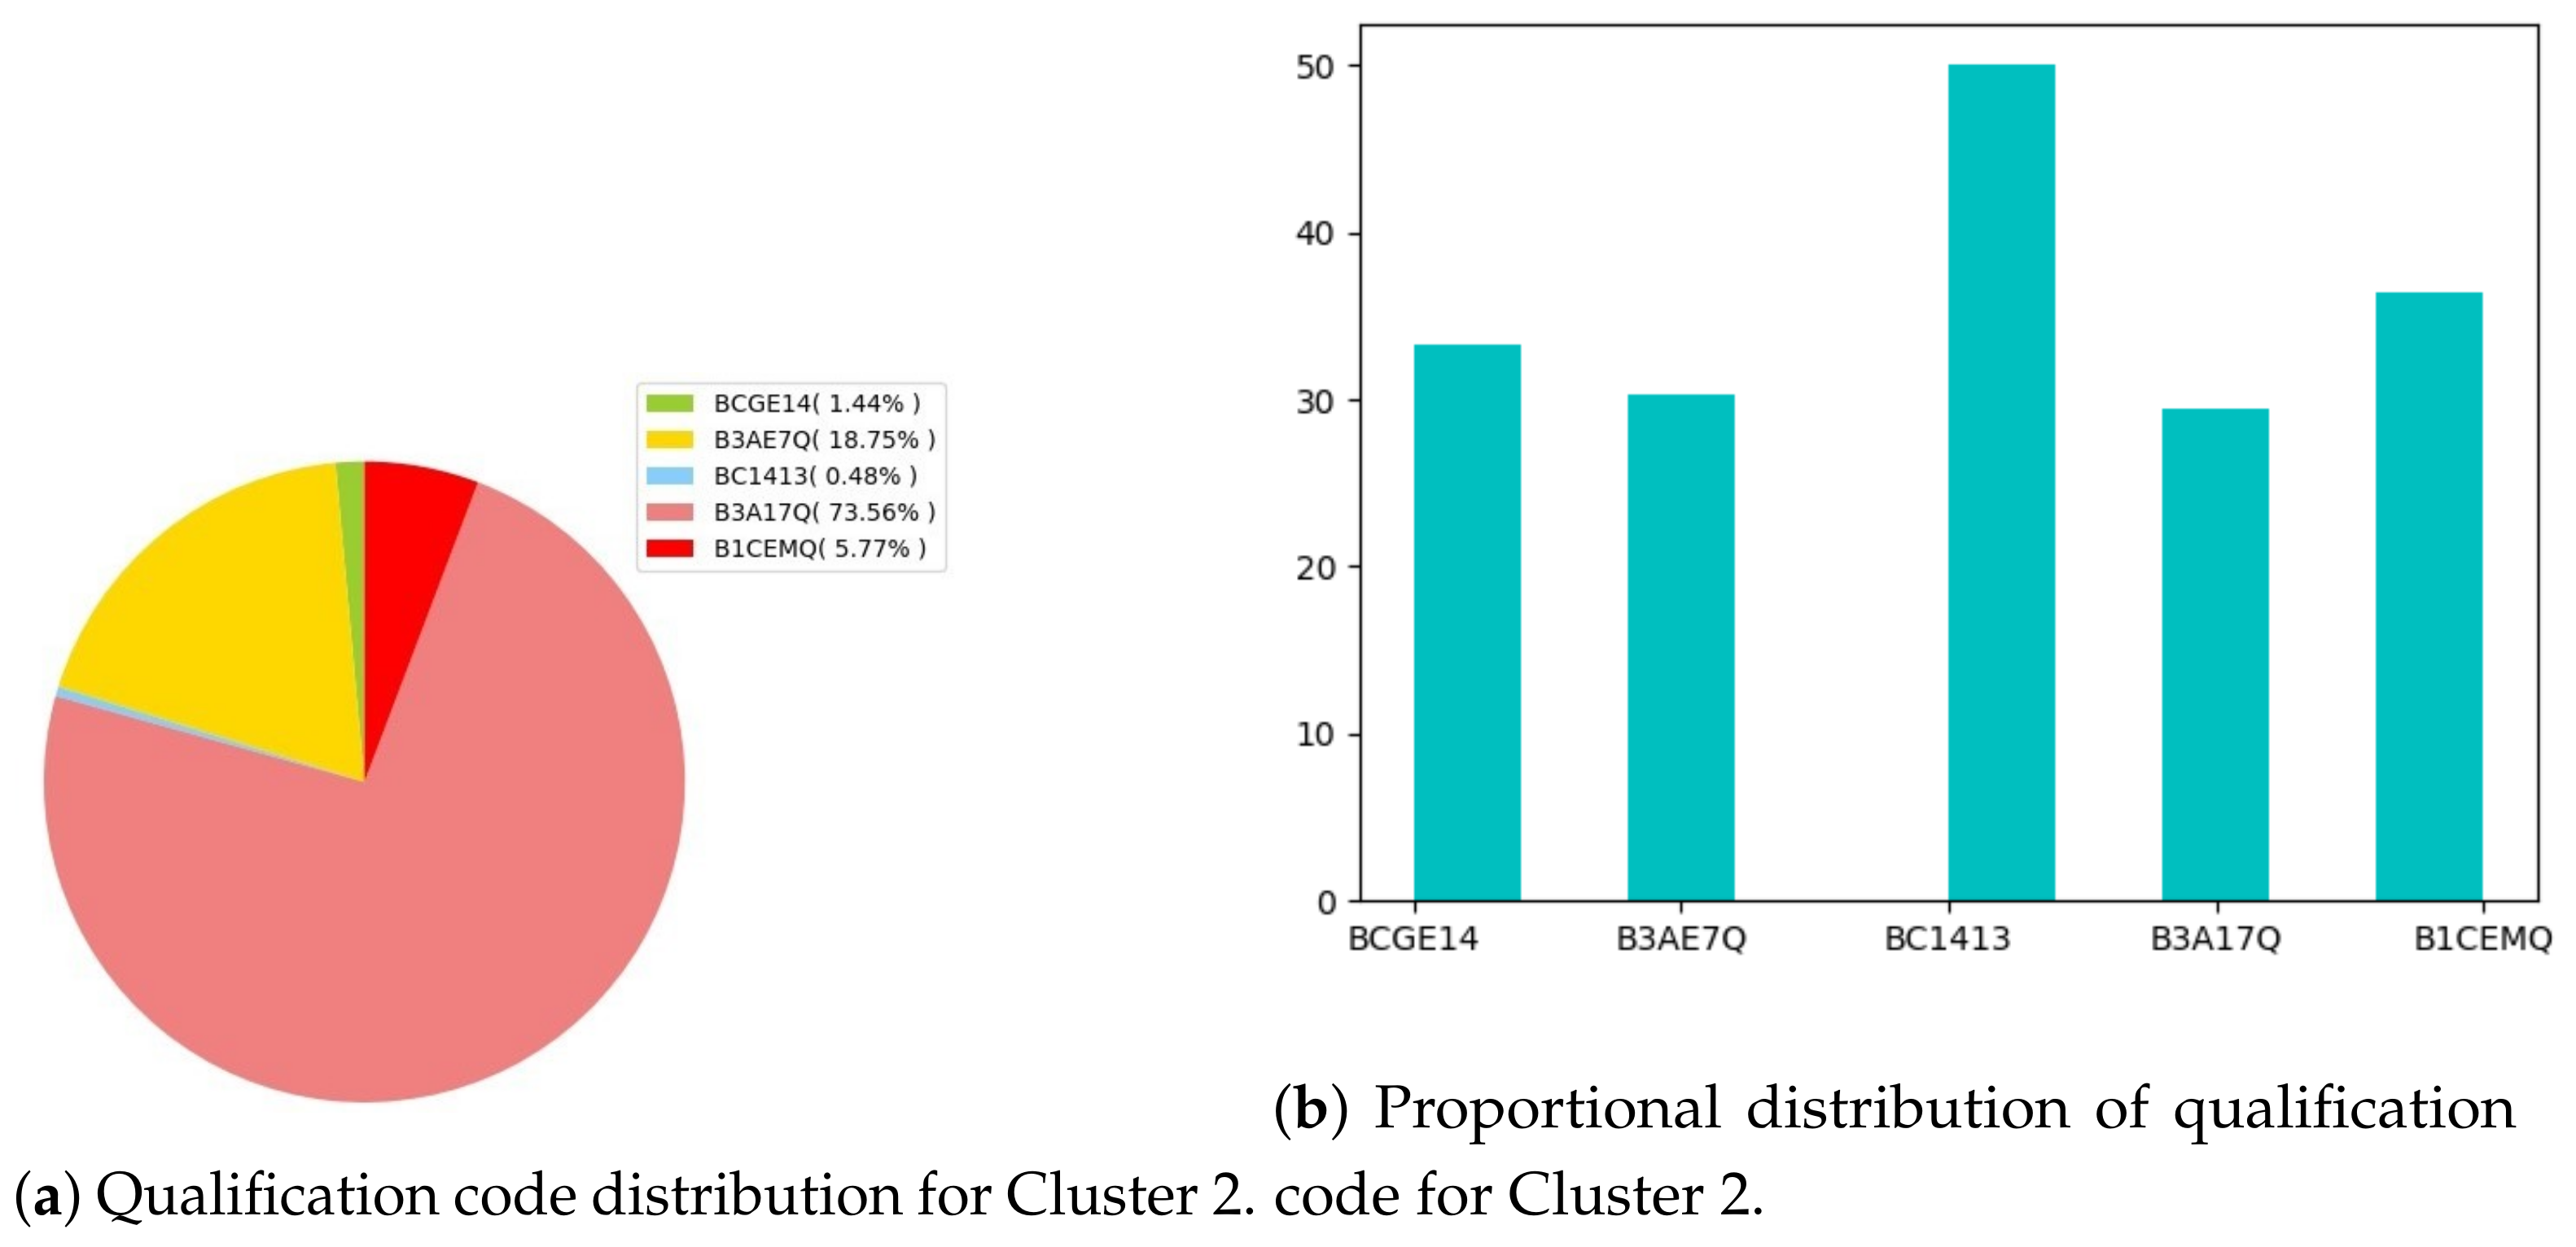
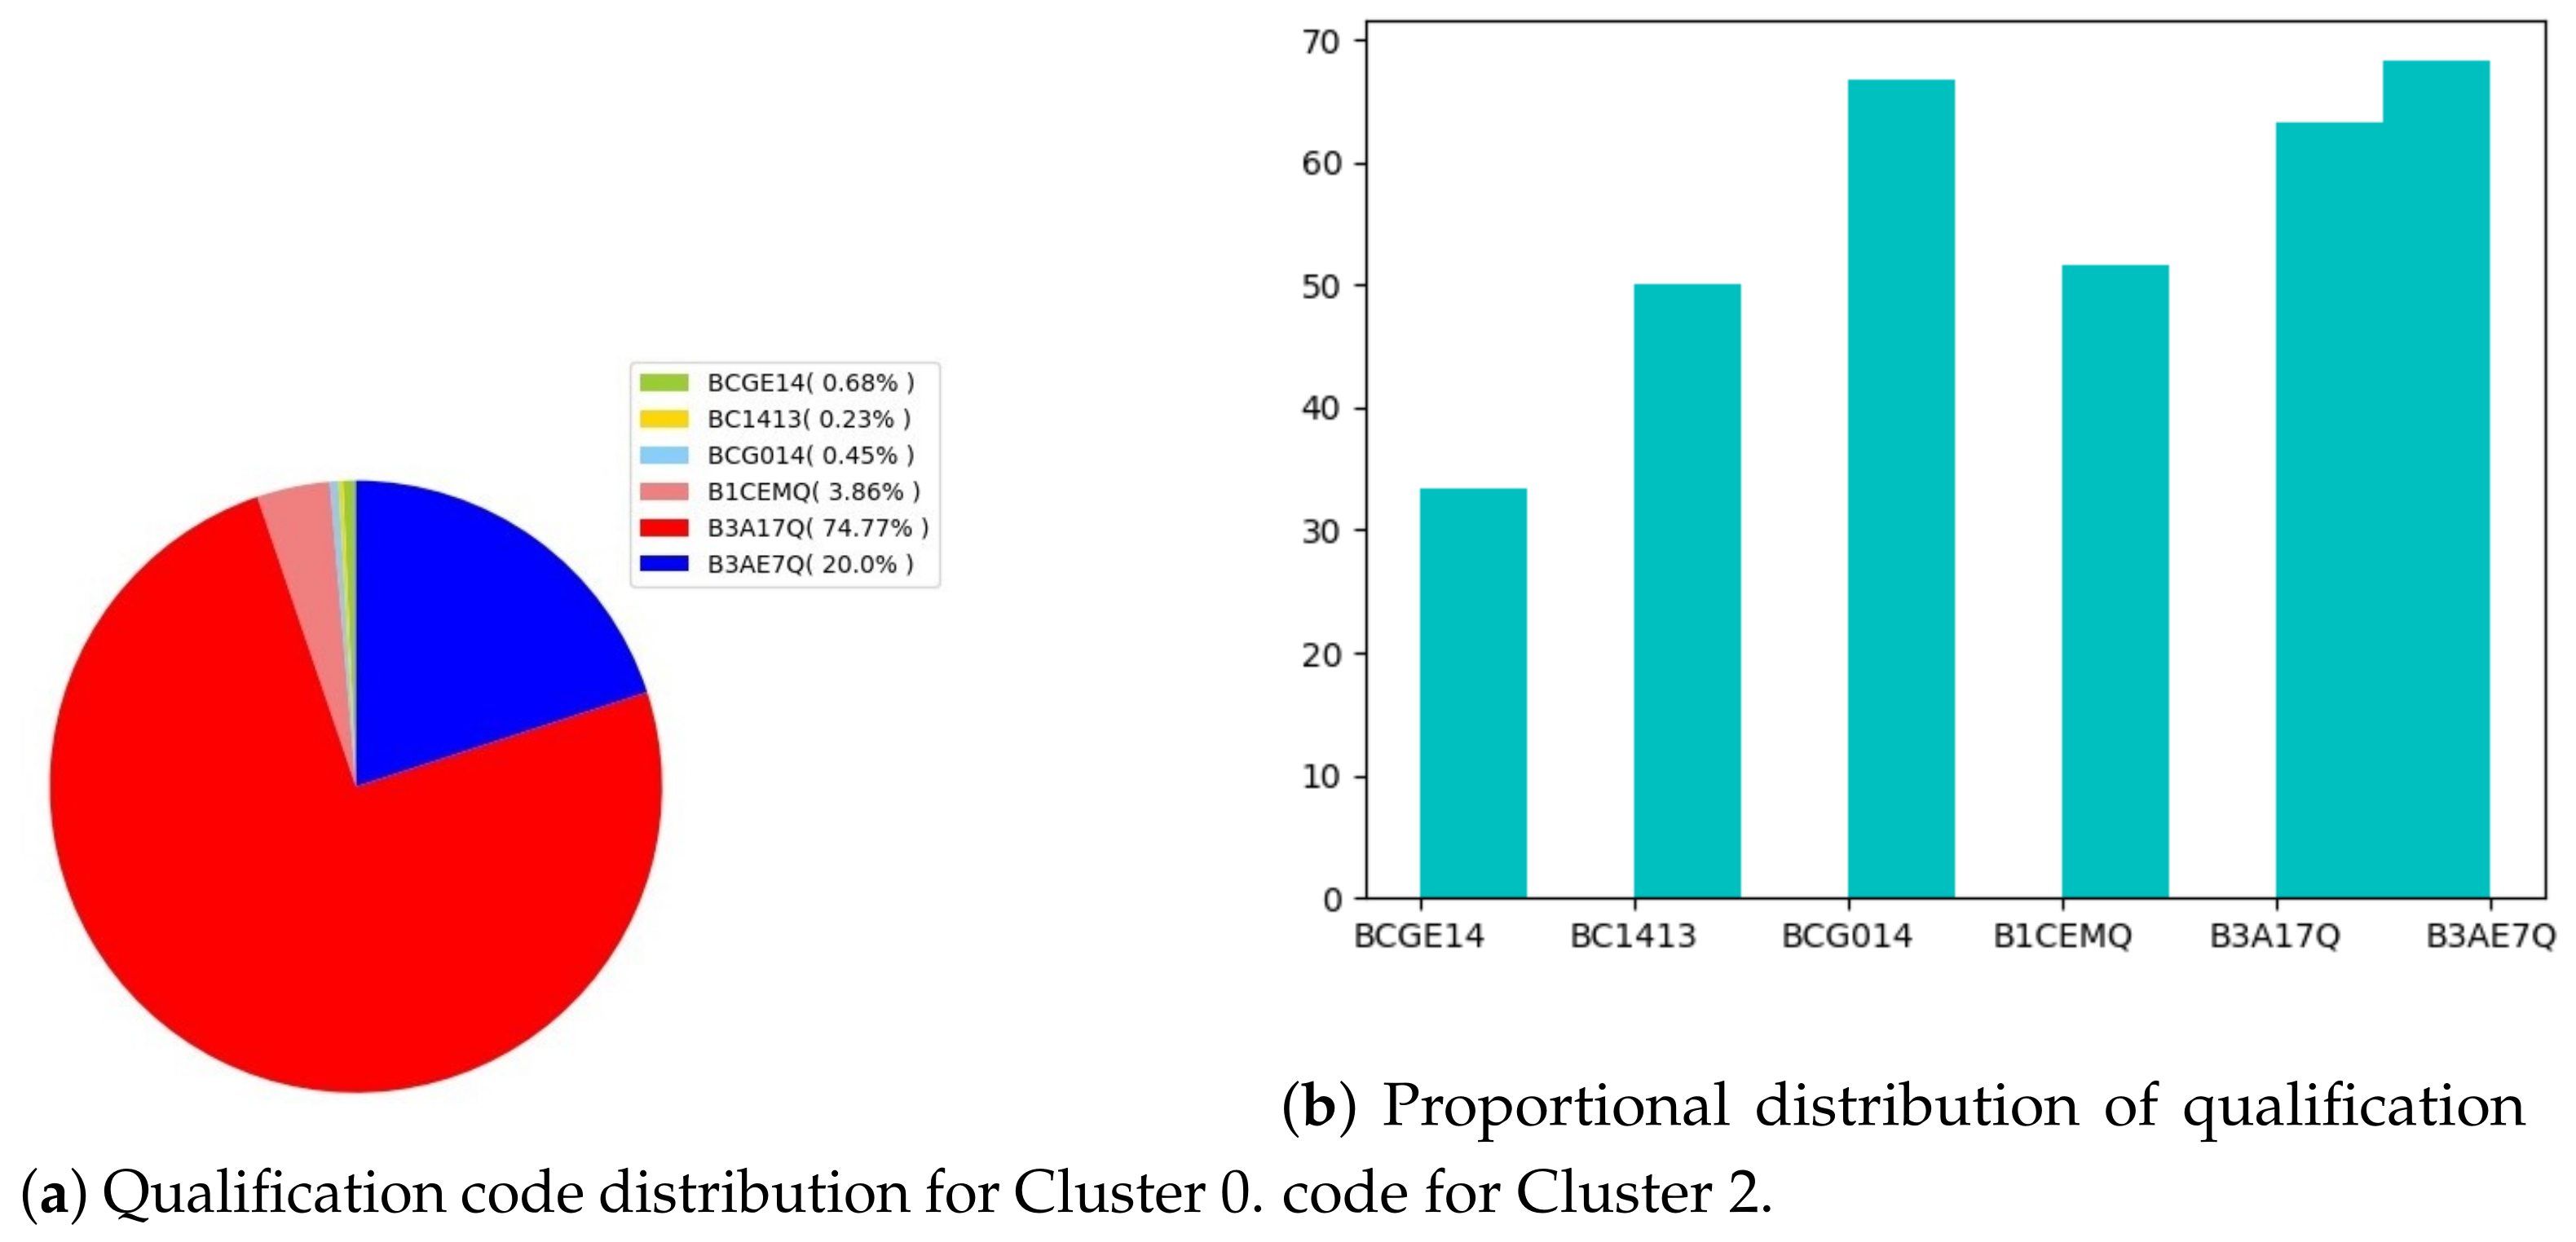
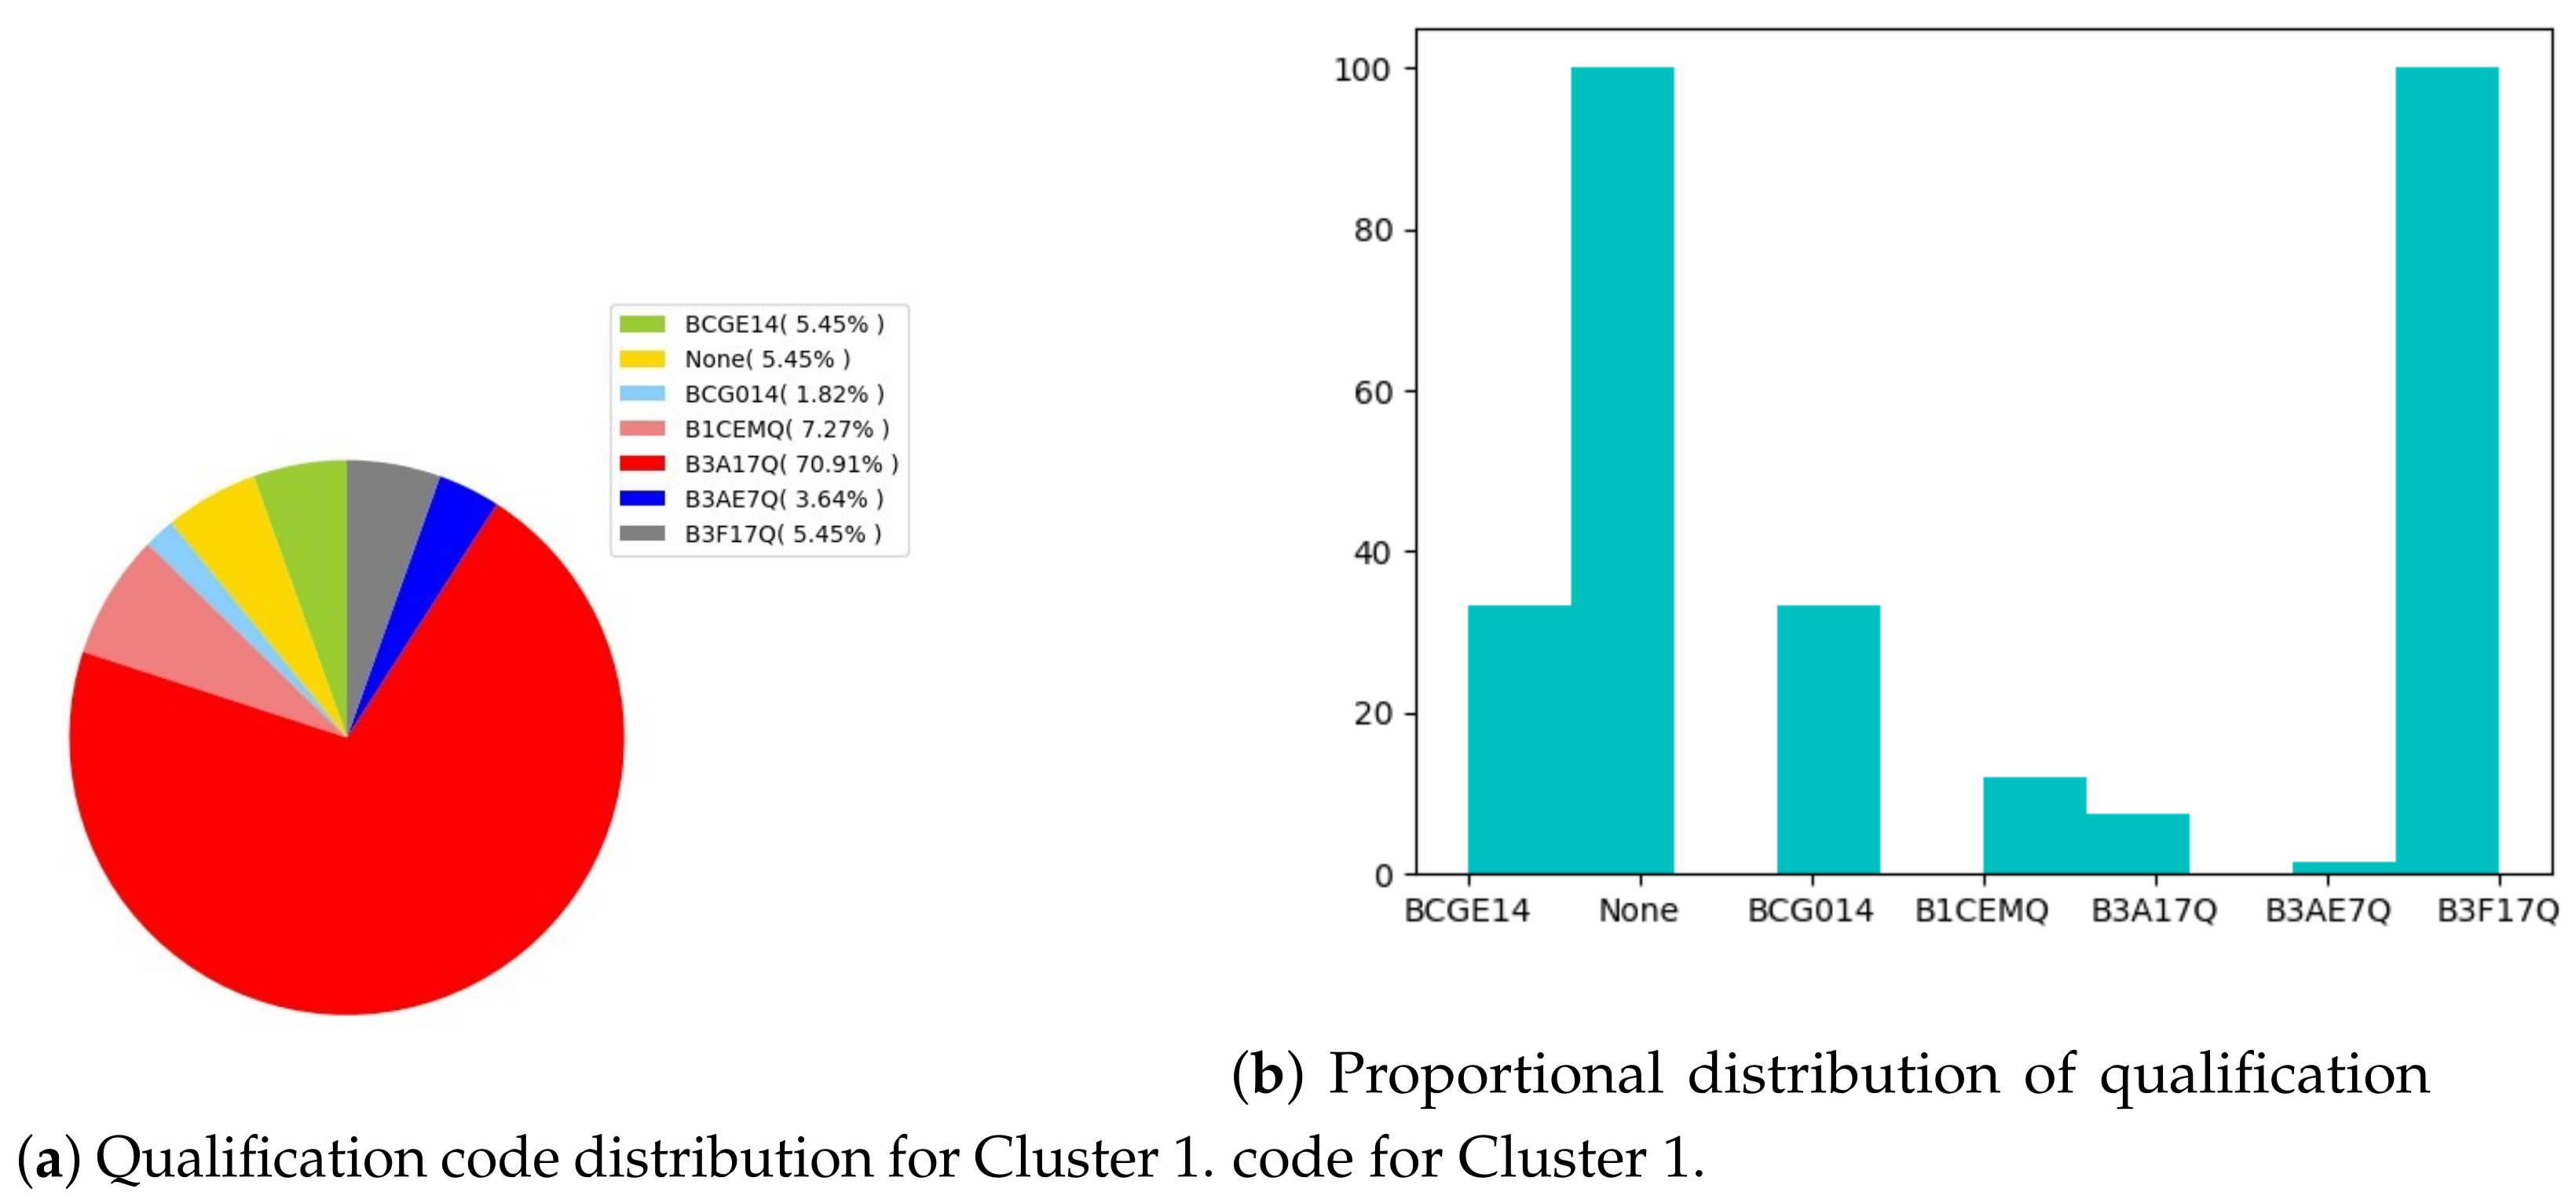
  • Performance distribution. At this stage, students have been grouped into five performance clusters. For each of the clusters, qualification codes have been interpreted. These are
    B1CEMQ: Bachelor of Commerce in Entrepreneurial Management.
    B3A17Q: Bachelor of Commerce in Accounting.
    B3AE7Q: Extended Bachelor of Commerce in Accounting.
    B3F17Q: Bachelor of Commerce in Finance.
    BC1413: Bachelor of Commerce in Entrepreneurial. Management (qualification phasing out).
    BCG014: Bachelor of Commerce in Accounting (qualification phasing out).
    BCGE14: Extended Bachelor of Commerce in Accounting (qualification phasing out).
    None: no information shown.
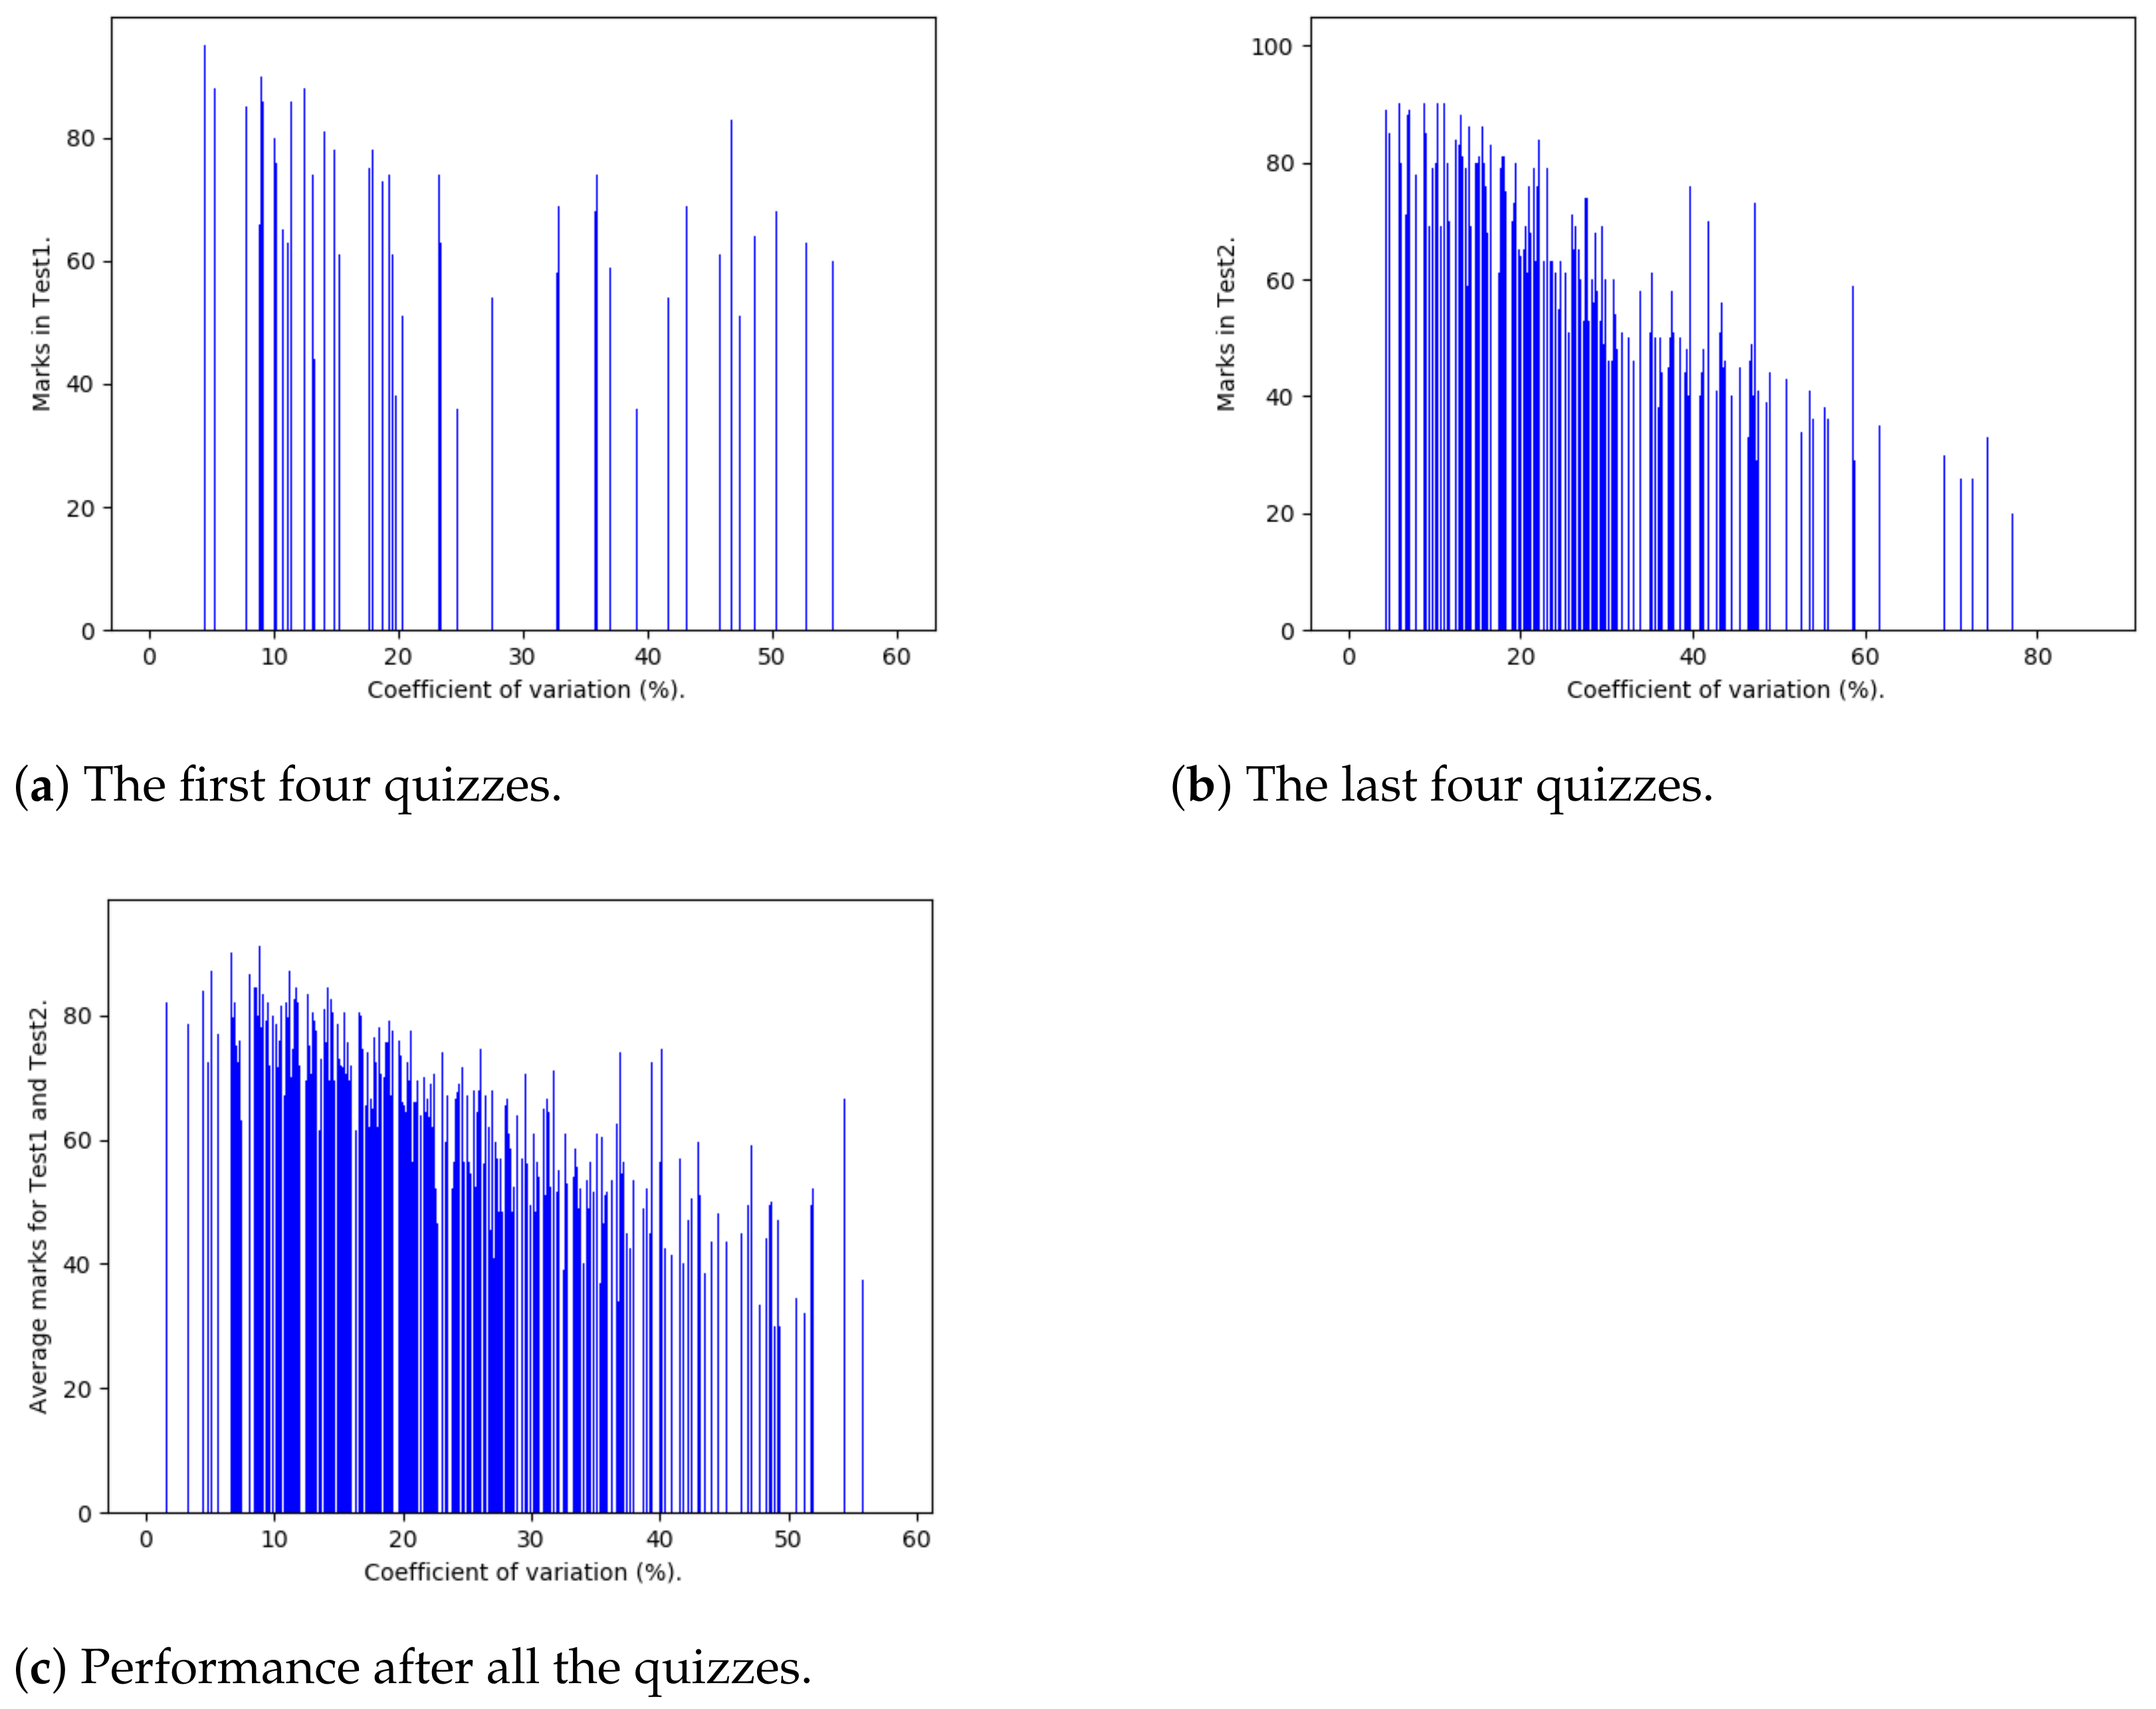
  • Consistency. We study the relevance of the quizzes-based performance and succeeding in written tests, for fully engaged students. Test 1 has been written after the first four quizzes and Test 2 after the next/last four. Here, the coefficient of variation has been employed to measure each student’s performance based on a series of marks obtained in the considered quizzes.

3.1. Performance Evolution

After each quiz, 5 clusters have been computed. The following figures show how students have been dynamically grouped into performance clusters.
Figure 2a shows that after the first quiz, all 703 students have one of 12 different shown marks. The figure shows that only one mark indicates a highest performance level and two marks indicate a least performance level. As it is the very first quiz, the standard deviation for each student is zero. This figure does not reveal any revolution details as it reflects the outcome for the very first quiz. It is rather a starting point on which comparisons are to be founded on.
Figure 2b reveals a case where the standard deviation may differ from zero. It shows an instance where a student could deviate from his/her previous marks (his/her current mean). This high deviation may be caused by the fact that the student(s) might have missed the previous quiz (and thus has 0/20) and when s/he showed up for the second quiz, s/he gets a very high mark.
Apart from this, the students might be highly encouraged or discouraged after the first quiz. In this latter case, such students would be assisted by commenting on their performance.
The figure also shows that after the second quiz, student performance is more highly scattered (compared with the case of the first quiz). This is caused by the fact that the difference of two students’ performance depends on two dimensions: the mean and standard deviation. So, any change in any direction expresses a different evolution status.
Figure 3a,b show the performance statuses after the third and fourth quizzes, respectively. They both show that student statuses become more diverse as the number of quizzes increases (more data points). This is happening in each cluster except the cluster of underperforming students (Cluster 1 for both figures). Students in this cluster are the most discouraged and need some encouragement. Note that details of these critical students have been identified and communicated to the ethical party (the course convener in this case). This has been achieved by defining each student as an object whose attributes are student number and a sequence of the student’s marks (see Schema Student in Section 2).
Figure 4a,b and Figure 5a,b show the same trend as Figure 3a,b, as discussed above. It is important to note that the distribution of the data points after each quiz shows a poor correlation between the mean and standard deviation, and this highlights the fact that the two variables are indeed independent. The least performing students are very isolated (the cluster closest to (0,0)) from other clusters, and such students clearly need to be subjected to some encouragement measures. They have also been identified and have been communicated to the ethical party in the university for possible mitigation processes.

3.2. Performance Distribution

After the 10th quiz, the clustered distribution is represented in Figure 6.
We categorise 703 students in three categories/clusters (see Figure 6): More Encouraged Students (MESs) refereed as Cluster2, Encouraged Students (ESs) refereed as Cluster0 and discouraged or Less Encouraged Students (LESs) refereed as Cluster1. We study the clusters based distribution of qualification codes and this is complemented by the study of proportional distribution to study the expectedness of code distributions. Qualification codes.
It is important to note that, at this stage, we have reduced the number of clusters to three. This is because students only wrote 10 quizzes. In this situation, at the end of the last quizzes, ranking students would be more important than isolating/identifying critical ones, as we assume that there are no more mitigation mechanisms to assist students. Performance ranks would help to evaluate how the course went. We would highlight that a larger number of clusters would be important for the first few quizzes, as this would clarify different performance deficits, and each would be handled according to its severity. However, when quizzes are over, there is less to be done to encourage students.
Figure 7a shows that the majority of MESs are the ones whose qualification code is B3A17Q and the minority corresponds to BC1413. However, 50 % (highest percentage on Figure 7b) of BC1413 students in the MESs cluster, whereas only about 30 % (the least percentage on the figure) of B3A17Q students are in the cluster. This means that BC1413 students are expected to be the most encouraged. This is due to the fact that the total number of students whose qualification code is BC1413, is relatively small, yet half of them are found in MESs.
Figure 8a shows that 74.77 % of ESs are B3A17Q, 20 % B2AE7Q and clearly, these code qualifications represent the majority of Cluster0. On the other hand, Figure 8b shows that BCG014 and B3AE7Q students are expected to be the most encouraged.
Figure 9a shows that most discouraged students are B3A17Q and Figure 9b, which shows that all students corresponding to that qualification code are the least encouraged.
Figure 7, Figure 8 and Figure 9 represent the in-cluster analysis for the MESs, ESs and LESs. The general observation is that the most represented groups of students (based on their program codes) does not necessarily mean that such a class is expectedly encouraged. The proportional distribution of students in related program code has been important to define the encouragement expectedness for various classes. This has been caused by the differently sized groups.

3.3. Consistency

Figure 10a shows the correspondence between the performance in the first four quizzes and the first test. The correlation coefficient has been calculated to be r = 0.03 , which is small. This means that good performing in the first four quizzes would not significantly imply good performance in Test1.
However, Figure 10b shows that the performance in the last four tests is highly correlated ( r = 0.84 ) with the performance in Test2. This is why Figure 10c shows that the overall performance in all quizzes has a high correlation with the performance in the average of Test1 and Test2 (r = −0.75).
The first four quizzes have been written before the university adopted COVID-19 measures, which include the teaching and assessing online. Test1 was written online, but the first four quizzes were not. This shows that the first four quizzes did not really prepare the students for Test 1. However, on the other hand, the last four quizzes and Test2 were all written online, as they occurred when the university had adopted the pandemic policies. At this time, students were prepared for the new mode of teaching-learning and assessment, and this is why the marks in the last four quizzes correlated with those of Test2.
It is important to observe that, for the first four quizzes, many students could have the same sequences of marks. This is shown by the fact that 579 students are distributed in only 59 different sequences of marks (coefficient of variations). On the other hand, For the last four quizzes, 399 different values of coefficient of variation have been found, and this shows that students are expected to have significantly different sequences of marks.

4. Conclusions

This paper has proposed a novel model for evaluating student performance. This has been achieved by introducing the performance distance, which is measured using the mean and standard deviation of each student’s marks distribution. This has been accompanied by using the K-means clustering to group students in performance groups, and later, the cluster migration was analysed. This model has been experimented on real data collected from the University of Johannesburg. The number of clusters considered in this work is not necessarily optimal. Future works need to cover the the optimal number of clusters in this type of setting.

Author Contributions

Conceptualization, E.T.; methodology, E.T.; software, E.T.; validation, E.T. and W.M.; formal analysis, E.T. and P.G.; investigation, E.T. and S.B.; resources, W.M. and S.B.; data curation, W.M., P.G. and S.B.; writing—original draft preparation, E.T.; writing—review and editing, E.T. and S.B.; visualization, E.T.; supervision, W.M.; project administration, W.M., P.G. and S.B.; funding acquisition, W.M. All authors have read and agreed to the published version of the manuscript.

Funding

This research received no external funding.

Institutional Review Board Statement

Not applicable.

Informed Consent Statement

Not applicable.

Data Availability Statement

Not applicable.

Conflicts of Interest

The authors declare no conflict of interest.

References

  1. Schwab, K. The Fourth Industrial Revolution; Currency: Danvers, MA, USA, 2017. [Google Scholar]
  2. Mohamed, A. UNESCO Rallies International Organizations, Civil Society and Private Sector Partners in a Broad Coalition to Ensure# LearningNeverStops. 2020. Available online: https://en.unesco.org/news/unesco-rallies-international-organizations-civil-society-and-private-sector-partners-broad (accessed on 20 November 2021).
  3. Wanner, T.; Palmer, E. Personalising learning: Exploring student and teacher perceptions about flexible learning and assessment in a flipped university course. Comput. Educ. 2015, 88, 354–369. [Google Scholar] [CrossRef]
  4. Fan, J.Y.; Wang, Y.H.; Chao, L.F.; Jane, S.W.; Hsu, L.L. Performance evaluation of nursing students following competency-based education. Nurse Educ. Today 2015, 35, 97–103. [Google Scholar] [CrossRef]
  5. Anema, M.; McCoy, J. Competency Based Nursing Education: Guide to Achieving Outstanding Learner Outcomes; Springer Publishing Company: New York, NY, USA, 2009. [Google Scholar]
  6. Milanowski, A. The relationship between teacher performance evaluation scores and student achievement: Evidence from Cincinnati. Peabody J. Educ. 2004, 79, 33–53. [Google Scholar] [CrossRef]
  7. Gokmen, G.; Akinci, T.Ç.; Tektaş, M.; Onat, N.; Kocyigit, G.; Tektaş, N. Evaluation of student performance in laboratory applications using fuzzy logic. Procedia-Soc. Behav. Sci. 2010, 2, 902–909. [Google Scholar] [CrossRef] [Green Version]
  8. Yen, J.; Langari, R.; Zadeh, L.A. Industrial Applications of Fuzzy Logic and Intelligent Systems; IEEE Press: New York, NY, USA, 1995. [Google Scholar]
  9. Cheung, L.L.; Kan, A.C. Evaluation of factors related to student performance in a distance-learning business communication course. J. Educ. Bus. 2002, 77, 257–263. [Google Scholar] [CrossRef]
  10. Pulito, A.R.; Donnelly, M.B.; Plymale, M. Factors in faculty evaluation of medical students’ performance. Med Educ. 2007, 41, 667–675. [Google Scholar] [CrossRef]
  11. Mortada, L.; Bolbol, J.; Kadry, S. Factors Affecting Students’ Performance a Case of Private Colleges in Lebanon. J. Math. Stat. Anal. 2018, 1, 105. [Google Scholar]
  12. Moubayed, A.; Injadat, M.; Shami, A.; Lutfiyya, H. Student engagement level in an e-learning environment: Clustering using k-means. Am. J. Distance Educ. 2020, 34, 137–156. [Google Scholar] [CrossRef]
  13. Kuo, R.; Krahn, T.; Chang, M. Behaviour Analytics-A Moodle Plug-in to Visualize Students’ Learning Patterns. In Proceedings of the International Conference on Intelligent Tutoring Systems, Virtual Event, 7–11 June 2021; Springer: Cham, Switzerland, 2021; pp. 232–238. [Google Scholar]
  14. Li, X.; Zhang, Y.; Cheng, H.; Zhou, F.; Yin, B. An Unsupervised Ensemble Clustering Approach for the Analysis of Student Behavioral Patterns. IEEE Access 2021, 9, 7076–7091. [Google Scholar] [CrossRef]
  15. Elbattah, M.; Molloy, O.; Zeigler, B.P. Designing care pathways using simulation modeling and machine learning. In Proceedings of the 2018 Winter Simulation Conference (WSC), Gothenburg, Sweden, 9–12 December 2018; pp. 1452–1463. [Google Scholar]
  16. Elbattah, M.; Molloy, O. Data-Driven patient segmentation using K-Means clustering: The case of hip fracture care in Ireland. In Proceedings of the Australasian Computer Science Week Multiconference, Geelong, Australia, 30 January–3 February 2017; pp. 1–8. [Google Scholar]
  17. Wang, G.; Kwok, S.W.H. Using K-Means Clustering Method with Doc2Vec to Understand the Twitter Users’ Opinions on COVID-19 Vaccination. In Proceedings of the 2021 IEEE EMBS International Conference on Biomedical and Health Informatics (BHI), Athens, Greece, 27–30 July 2021; pp. 1–4. [Google Scholar]
  18. Cortez, P.; Silva, A.M.G. Using data mining to predict secondary school student performance. In Proceedings of the 5th Annual Future Business Technology Conference, Porto, Portugal, 9–11 April 2008. [Google Scholar]
  19. Osmanbegovic, E.; Suljic, M. Data mining approach for predicting student performance. Econ. Rev. J. Econ. Bus. 2012, 10, 3–12. [Google Scholar]
  20. Kabakchieva, D. Predicting student performance by using data mining methods for classification. Cybern. Inf. Technol. 2013, 13, 61–72. [Google Scholar] [CrossRef]
  21. Ramesh, V.; Parkavi, P.; Ramar, K. Predicting student performance: A statistical and data mining approach. Int. J. Comput. Appl. 2013, 63, 35–39. [Google Scholar] [CrossRef]
  22. Kabakchieva, D. Student performance prediction by using data mining classification algorithms. Int. J. Comput. Sci. Manag. Res. 2012, 1, 686–690. [Google Scholar]
  23. Mengash, H.A. Using data mining techniques to predict student performance to support decision making in university admission systems. IEEE Access 2020, 8, 55462–55470. [Google Scholar] [CrossRef]
  24. Sánchez-Ruiz, L.M.; Moll-López, S.; Moraño-Fernández, J.A.; Roselló, M.D. Dynamical continuous discrete assessment of competencies achievement: An approach to continuous assessment. Mathematics 2021, 9, 2082. [Google Scholar] [CrossRef]
  25. Kim, D.J.; Choi, S.H.; Lee, Y.; Lim, W. Secondary Teacher Candidates’ Mathematical Modeling Task Design and Revision. Mathematics 2021, 9, 2933. [Google Scholar] [CrossRef]
  26. Lenkauskaitė, J.; Bubnys, R.; Masiliauskienė, E.; Malinauskienė, D. Participation in the Assessment Processes in Problem-Based Learning: Experiences of the Students of Social Sciences in Lithuania. Educ. Sci. 2021, 11, 678. [Google Scholar] [CrossRef]
  27. Likas, A.; Vlassis, N.; Verbeek, J.J. The global k-means clustering algorithm. Pattern Recognit. 2003, 36, 451–461. [Google Scholar] [CrossRef] [Green Version]
  28. Tuyishimire, E.; Bagula, A.; Ismail, A. Clustered data muling in the internet of things in motion. Sensors 2019, 19, 484. [Google Scholar] [CrossRef] [Green Version]
  29. Tuyishimire, E.; Bagula, B.A.; Ismail, A. Optimal clustering for efficient data muling in the internet-of-things in motion. In International Symposium on Ubiquitous Networking; Springer: Cham, Switzerland, 2018; pp. 359–371. [Google Scholar]
  30. Xu, R.; Wunsch, D. Survey of clustering algorithms. IEEE Trans. Neural Netw. 2005, 16, 645–678. [Google Scholar] [CrossRef] [Green Version]
  31. Barnes, T. The Q-matrix method: Mining student response data for knowledge. In American Association for Artificial Intelligence 2005 Educational Data Mining Workshop; AAAI Press: Pittsburgh, PA, USA, 2005; pp. 1–8. [Google Scholar]
  32. McKinney, W. pandas: A foundational Python library for data analysis and statistics. Python High Perform. Sci. Comput. 2011, 14, 1–9. [Google Scholar]
  33. Oliphant, T.E. A Guide to NumPy; Trelgol Publishing: New York, NY, USA, 2006; Volume 1. [Google Scholar]
  34. Pedregosa, F.; Varoquaux, G.; Gramfort, A.; Michel, V.; Thirion, B.; Grisel, O.; Blondel, M.; Prettenhofer, P.; Weiss, R.; Dubourg, V.; et al. Scikit-learn: Machine learning in Python. J. Mach. Learn. Res. 2011, 12, 2825–2830. [Google Scholar]
  35. Hunter, J.D. Matplotlib: A 2D graphics environment. Comput. Sci. Eng. 2007, 9, 90–95. [Google Scholar] [CrossRef]
Figure 1. The proposed model.
Information 13 00094 g001
Figure 2. Clustering after Quiz 1 and 2.
Information 13 00094 g002
Figure 3. Clustering after Quiz 3 and 4.
Information 13 00094 g003
Figure 4. Clustering after Quiz 5 and 6.
Information 13 00094 g004
Figure 5. Clustering after Quiz 7, 8, and 9.
Information 13 00094 g005
Figure 6. Clustering after Quiz 10.
Information 13 00094 g006
Figure 7. Performance distribution for MESs.
Information 13 00094 g007
Figure 8. Qualification codes for ESs.
Information 13 00094 g008
Figure 9. Qualification codes for LESs.
Information 13 00094 g009
Figure 10. Consistency analysis.
Information 13 00094 g010
Table 1. Marks for the first three quizzes.
StudentQuiz 1Quiz 2MeanStandard Deviation
A8253
B5550
C4651
Table 2. Key Python packages.
Name and CitationRole
Pandas [32] and Numpy [33]Data handling
Scikit-Learn [34]Data clustering
Matplotlib [35]Data visualisation
Table 3. Values of k-means hyper-parameters.
Parameter NameParameter Value
n _ c l u s t e r s 5 or 3
i n i t ‘k-means++’
n _ i n i t 10
M a x _ i t e r 300
t o l 0.0001
p r e c o m p u t e _ d i s t a n c e s ‘auto’
V e r b o s e 0
r a n d o m _ s t a t e None
c o p y _ x True
n _ j o b s None
a l g o r i t h m ‘auto’
Publisher’s Note: MDPI stays neutral with regard to jurisdictional claims in published maps and institutional affiliations.

