1. A Controversial Dating
The Shroud of Turin (hereafter denoted the Shroud for brevity) appeared publicly for the first time in 1354 in the hands of Geoffroy de Charny. In 1350, he built a small church in Lirey (France), where he was the lord, with the purpose of hosting several relics, among which the Shroud was likely included. In 1453, his granddaughter Marguerite gave the Shroud to the Savoy, a noble family based in Chambéry, where it was damaged by fire in 1532. It was moved to the new Savoyard capital, Turin, in 1578, where it is still kept. Since 2000, the Shroud has been preserved in a reliquary with a controlled atmosphere of 99.5% Argon and 0.5% Oxygen, at equalized atmospheric pressure, at 50% relative humidity, and a temperature of 19–20 °C [
1].
This is the documented history of the Shroud. Before 1354, there is no clearly documented information, although several icons, paintings, and coins, made long before, seem to allude to the somatic characteristics of the Man of the Shroud [
2]. In 1988, the Shroud was radiocarbon-dated by three laboratories [
3] and its origin was attributed to the year 1325 Anno Domini (AD), with an uncertainty of
years and a 95% confidence level, implying that the fabric should be a medieval artifact, with only seven centuries of European history. However, other techniques [
4,
5,
6,
7,
8,
9] have shown that the Shroud could also be 2000 years old. Moreover, its radiocarbon dating is very controversial, especially because of the incorrect statistical treatment of the data [
10,
11], which are spatially inhomogeneous, probably due to the significant carbon contamination of the textile. In conclusion, the Shroud’s dating is still considered an open question, and other methods independent of the content of radiocarbon isotopes should be adopted to assess the aging of the Shroud, such as the Wide-Angle-X-ray-Scattering (WAXS) method [
8,
9].
Indeed, the natural aging of the cellulose constituting textile fibers, such as the Shroud, depends on temperature, relative humidity, and the years of aging. The natural aging of linen fabrics can be estimated by means of the WAXS-dating method, as shown in [
8]. The theoretical formula developed in [
8] leads to a dimensionless parameter,
, namely, the fraction of maximum chain breaks, ranging from 0–no aging (i.e., minimum number of chain breaks in the cellulose polymer, when the fabric is made) to 1 (maximum aging, i.e., maximum number of chain breaks reached), which can be converted into the age of the sample.
In [
9], the WAXS-dating method [
8] was applied to a sample of the Shroud, namely, a thread taken in the proximity of the 1988/radiocarbon area (the corner of the Shroud corresponding to the feet area of the frontal image, near the so-called Raes sample). The size of the linen sample was
. One-dimensional integrated WAXS data profiles were fully compatible with the analogous measurements on a linen sample whose established age, though radio-carbon method’s and historical-record’s dating, is 55–74 AD (siege of Masada, Israel), thereby also implying that the Shroud is about 2000 years old.
Against this dating, it could be argued that the Shroud has not only suffered natural aging, but also the effects of the fire of 1532 at Chambéry. This fire’s possible effect on cellulose degradation was discussed and assessed in [
9,
12]. It is known that the increase in temperature accelerates the depolymerization rate, but it does so only for a few minutes because the associated reduction in relative humidity slows and almost stops the depolymerization, as it was verified in laboratory [
9]. Since linen is a poor heat conductor, it has been excluded that the sample used for the WAXS dating was subjected to high temperatures because it was located far from the burned areas and the still bright color of the linen thread demonstrates the absence of exposure to temperatures greater than about 200 °C [
12]. After the use of water to stop the fire of 1532, within a few seconds, the temperature of the linen was already below 100 °C, and in another few minutes the linen’s temperature reached a few degrees above room temperature. Even if the relative humidity had remained at 100% for weeks, its effect on linen degradation would have been very limited. Indeed, the theoretical formula developed in [
8] allows us to conclude that 30 min at 100% relative humidity and 100 °C temperature would have increased the degree of aging by only about 0.6% (
. In addition, a full year at 100% relative humidity and room temperature would have increased the degree of aging by less than 0.1% (
. Thus, the increment of the aging is in both cases negligible, because a degree of aging of
(
has been measured on the Shroud’s sample [
9].
Other causes, e.g., the presence of possible catalysts such as acids or bases, the activity of microorganisms, et cetera, could cause an increment of the natural aging of a textile. However, most of these agents induce changes in the external appearance of linen that are observable even with the naked eye. Raymond Rogers, who inspected the Shroud in 1978 and later observed fibers from the Shroud under the microscope, ruled out many of these hypothetical agents [
1]. In particular, the sample of the Shroud analyzed by WAXS [
9] to date the fabric, seen by means of an optical microscope, did not show any evident deterioration due to chemical action, mechanical friction, auto-catalytic decomposition, microbiological attack, or fire damage. Finally, the Shroud’s exposure to sunlight can be assumed to have been limited during eventual religious processions, whose duration can be surely neglected with respect to a time scale of many centuries. A year lasts almost 9000 h; a religious procession lasts a few hours. Therefore, the direct contribution of cellulose degradation due to direct sunlight can also be considered negligible with respect to the Shroud’s natural aging due to many centuries.
Therefore, it should be concluded that most of the aging of the Shroud’s sample is due only to the passage of time, to the effect of temperature and relative humidity, i.e., to natural aging. And the measured degree of natural aging of the cellulose of the Shroud indicates that it is much older than 7 centuries. Indeed, the experimental results supported the hypothesis that the Shroud is 2000 years old, under the condition that it was kept during the 13 centuries of its unknown history at an average secular temperature in the range of 20.0 to 22.5 °C and a relative humidity in the range of 55% to 75% [
9].
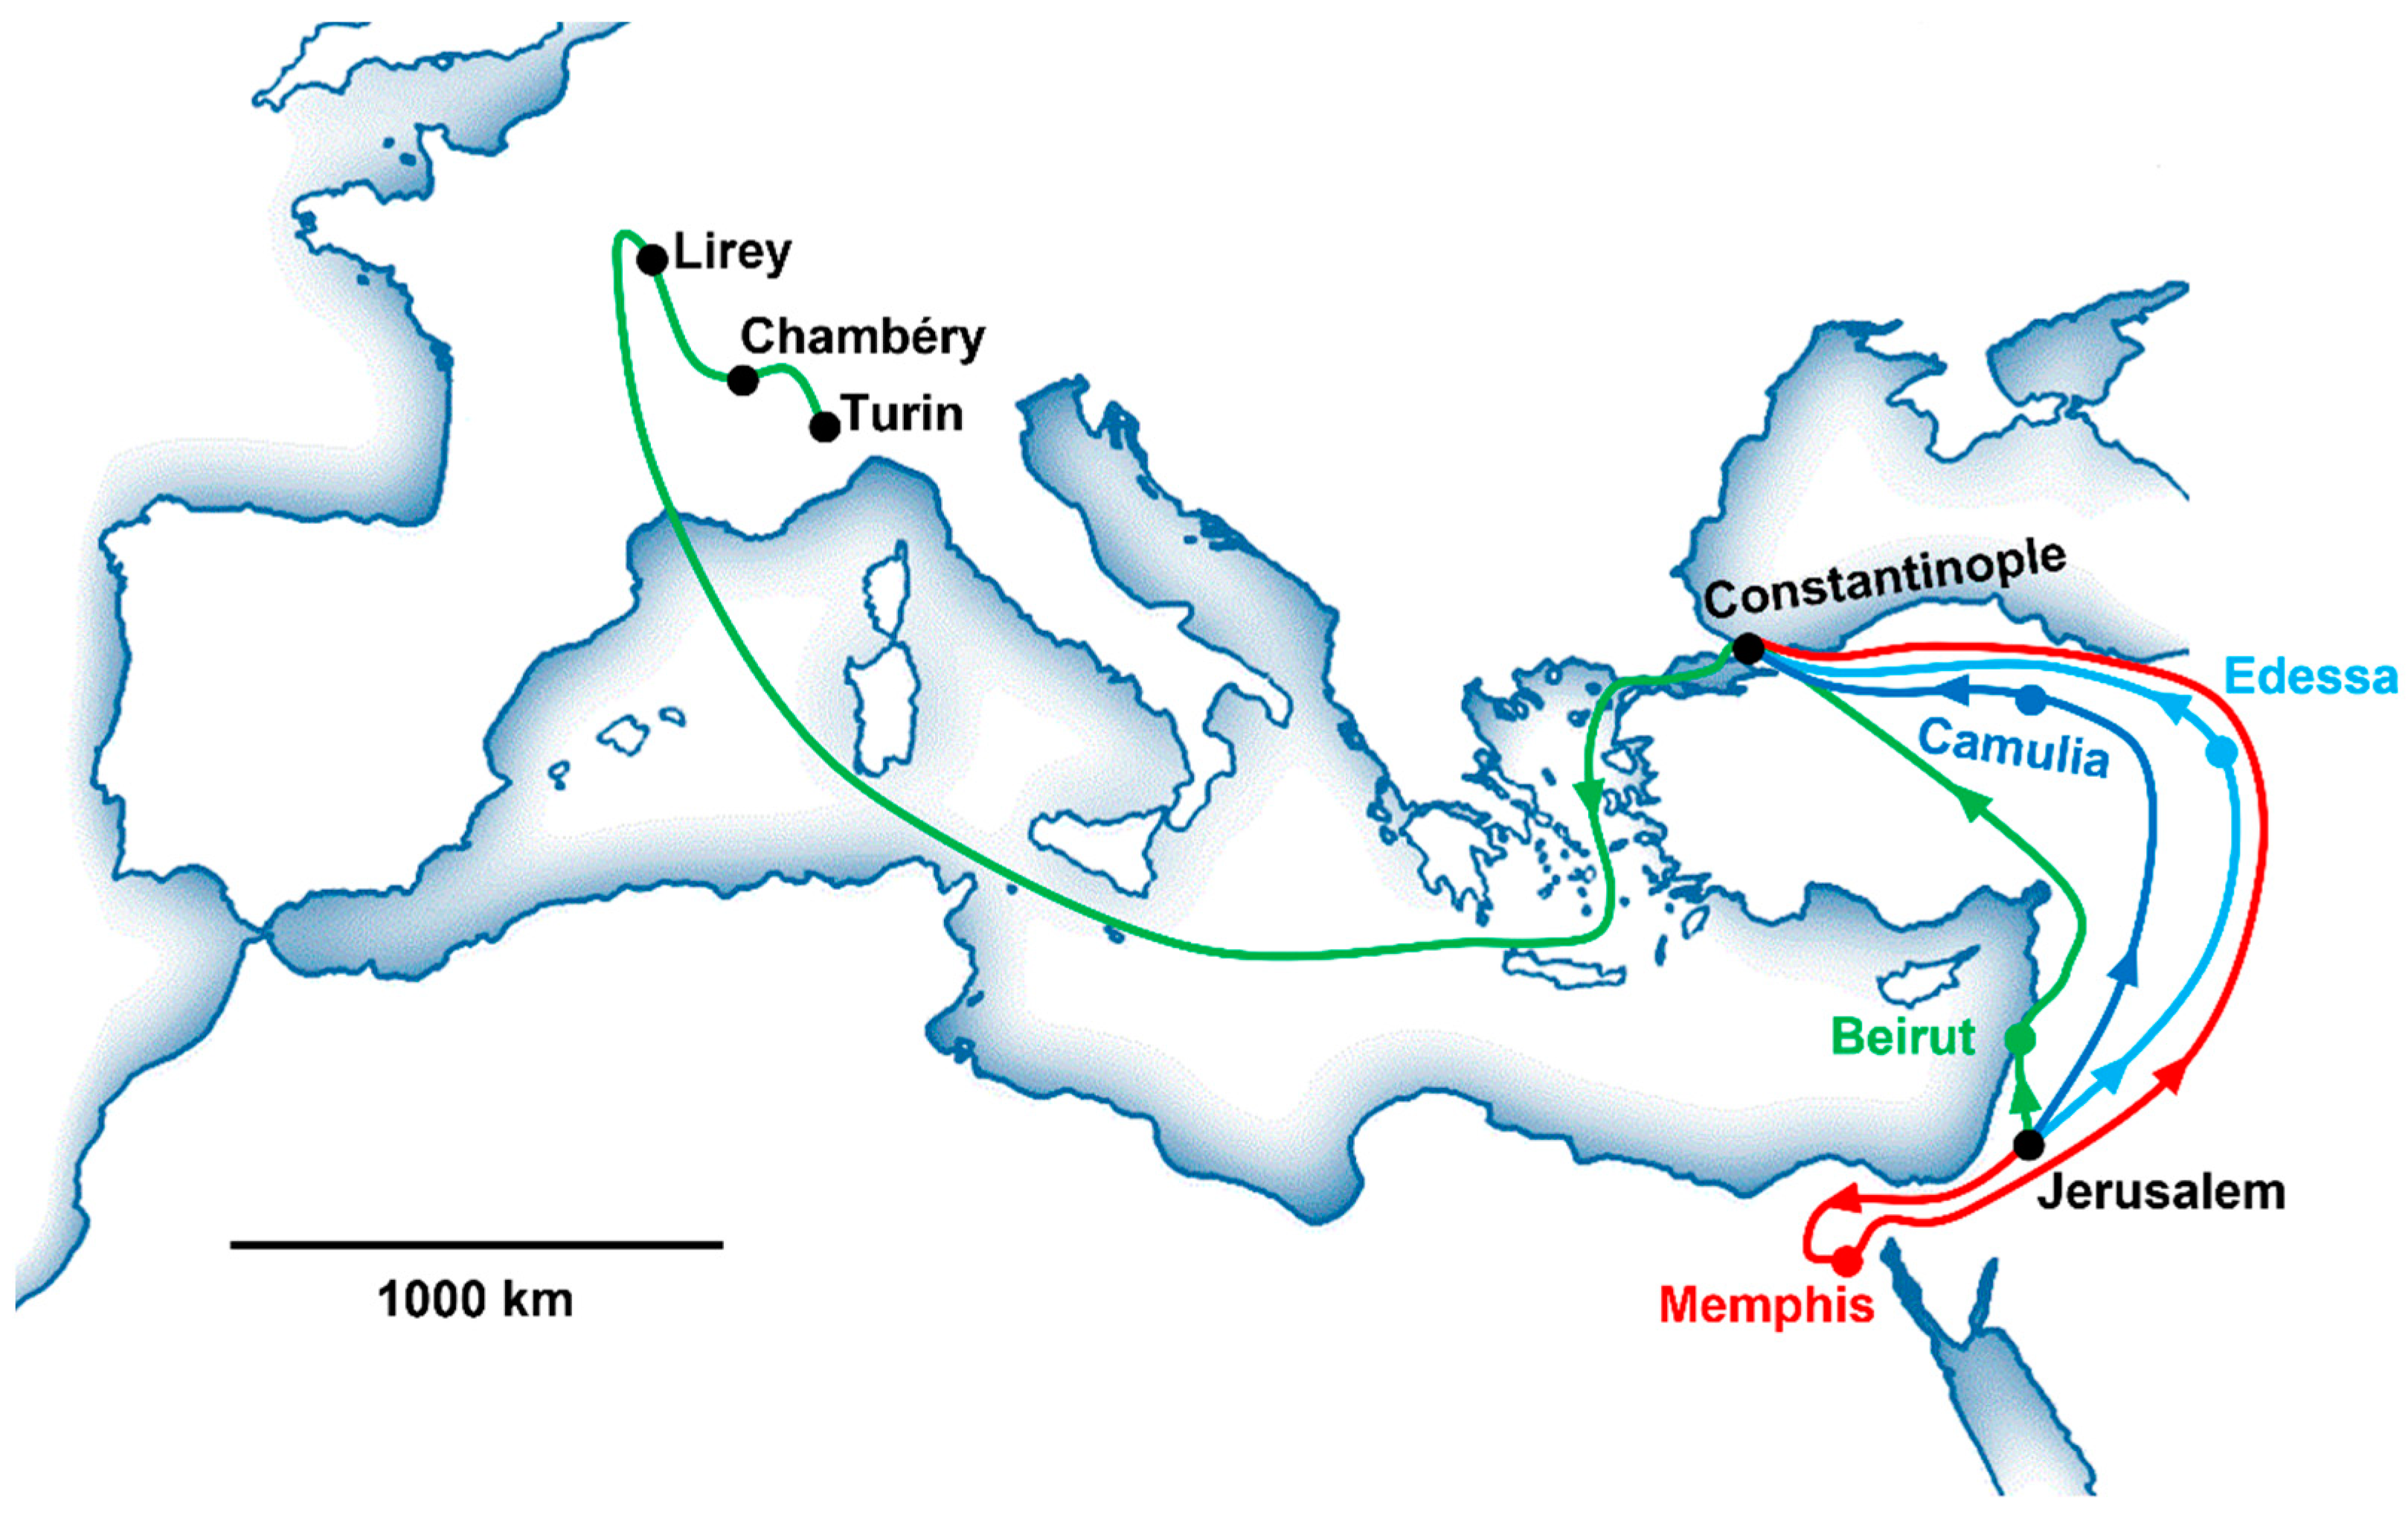
However, the Shroud was probably not kept in a tomb for centuries, where mean temperatures and relative humidity are more similar to secular averages. Moreover, if the Shroud has 2000 years of history, where was it kept before 1354, when its presence can be attested at Lirey, in France? The hypothesis of many scholars is that the ancient traditions about acheiropoieton images (images not made by human hands) of Jesus Christ could be related to the Shroud. Indeed, there are historical sources about these images present in several localities, almost from the beginning of the Christian Era [
13,
14,
15,
16]. The most important are Memphis (Egypt), Edessa (today, Şanlıurfa, in Turkey), Camulia (Cappadocia, Turkey), Beirut (Lebanon), and Constantinople (today, Istanbul, in Turkey).
To account for the early years of the Shroud, it has been proposed that the image of Edessa, known as the Mandylion, and the Shroud are the same object [
14,
17]. Today, this conjecture is considered unsustainable by many scholars [
18,
19,
20,
21] because there are documents that contradict it. In any case, there is still an open debate on this point. For this reason, other scholars [
22] have proposed that the Shroud traveled from Jerusalem to Constantinople through Beirut, not Edessa. According to these studies, the Shroud should be related to the Icon of Beirut rather than to the Mandylion of Edessa. The Icon of Beirut was described as an image representing the entire body of Jesus Christ—with the wounds endured during the Passion—by Anastasius the Librarian in the year 873, who also narrated its origin and travel from Jerusalem to Beirut, where it remained until the year 975 [
22].
Besides the path through Beirut or Edessa, before the Shroud reached Constantinople, there are the alternative paths related either to the Icon of Memphis or to the Icon of Camulia, because in both cities there are descriptions of ancient acheiropoieton images of Jesus Christ [
16], which could be related to another interesting Icon of Jesus Christ, namely, the Veil of Manoppello [
23], also studied in relation to the Shroud [
24,
25,
26,
27].
The purpose of the present paper is to estimate the natural aging of the Shroud in the year 2021, assuming a 2000-year existence and comparing this prediction with the actual 2021 WAXS measurements [
9], by considering different alleged paths traveled before the Shroud is attested in Europe. The theoretical estimated value of
will be compared to the experimental value
obtained in 2021 with WAXS [
9]. If the two values agree, the corresponding path could be a possible path traveled by the Shroud. Of course, this agreement is only a necessary condition to conjecture a possible path, and not a sufficient one, because other unknown paths could give the same 2021 value
. In other words, the results of our investigation will exclude some paths for which
, or
and, at the same time, propose candidates for the actual path traveled by the Shroud before arriving in France in its alleged 2000 years of existence.
After this introductory section, in
Section 2, the different conjectures about the alleged historical-geographical paths and estimated sojourns of the Shroud are described.
Section 3 reports the mathematical formulae for theoretically estimating the natural aging of linen from monthly average temperature and relative humidity of localities where traditions of acheiropoieton images of Jesus Christ are attested.
Section 4 discusses the time scale and meteorological parameters affecting linen natural aging.
Section 5 estimates the long-term aging for each alleged path and compares the theoretically predicted degree of aging with the experimental value obtained by WAXS [
9] to select the most likely alleged path of the Shroud in its 13 centuries of history before its arrival in Europe.
Section 6 evaluates the future aging of the Shroud kept in its reliquary with a controlled atmosphere [
1]. Our calculations show that even in the controlled atmosphere of the reliquary, the cellulose depolymerization and yellowing of the linen will proceed at a high enough rate, thereby suggesting the need for some suitable modification in the controlled atmosphere to avoid the disappearance of the image visible on it in the next centuries, i.e., that of a tortured man, who was scourged, crowned with thorns, crucified, and pierced by a spear in the chest, which is the reason why many Christians believe the Shroud is the most important relic of history. Finally, the conclusions are given in
Section 7.
2. Alleged Paths of the Shroud before Its Arrival in Europe
Following the two main conjectures, namely, the Icon of Beirut and the Mandylion of Edessa, and the other two paths, through Camulia or Memphis, discussed in
Section 1,
Table 1 summarizes the four paths considered in this study, together with the duration of the alleged sojourns of the Shroud.
The starting year, 34, is related to the Crucifixion of Jesus. This is the only Crucifixion date that allows for the chronological harmonization the different Synoptic and Johannine traditions on the Last Supper [
28]. Even if the linen fabric was weaved a short time before, the difference with respect to assessing its aging would be negligible. In fact, even if Jesus’ Crucifixion is set in the year 30 or 33, as it is by most scholars [
29], the theoretical estimation of linen aging would change only on the third decimal digit, an order of magnitude that is smaller than the experimental error with which the natural aging of the Shroud’s sample has been determined by WAXS [
9].
In Jerusalem, the Shroud could not have been kept for long because of the outbreak of the revolt of the Palestinian Jews against Rome. According to Eusebius (Hist. eccl., III, 5), the Christians of Jerusalem escaped to Pella, bringing with them all the relics and main religious objects. Their escape occurred before the destruction of the temple (70), probably at the beginning of the revolt, in the year 66, because Eusebius mentions the presence of a comet in the sky for a whole year, an unfavorable sign preceding the war (Hist. eccl., III, 8). This astronomical datum could be related to Halley’s Comet, which was visible in the year 66.
Under the hypothesis that the Shroud is just the Mandylion of Edessa, the year when it reached this city,
, is not known. On the contrary, its journey from Edessa to Constantinople can be set with good confidence in the year 944, when Edessa was conquered by the Muslims. In this circumstance, Gregory, the Archdeacon of the basilica Hagia Sophia, delivered a sermon in the imperial palace of Constantinople on the 16th of August, 944 [
14,
21].
The year when the Shroud reached Europe,
, is not known. However,
should range from 1204—the year of the Sack of Constantinople during the fourth Crusade, when it was allegedly stolen by crusaders—to the year 1354, when its presence is attested at Lirey, in France [
13,
14,
15,
16]. Therefore, in
Table 1, we have set
.
The alleged different paths of the Shroud differ for a long sojourn either in Edessa or in other localities (Memphis or Camulia), or for a slightly different temporal path under the hypothesis that the Shroud could be Beirut’s Icon [
22]. In the year 525, the Mandylion is attested in Edessa because, after a flood, its cult was publicly attested [
14,
21]. However, other sources seem to attest the possible presence of the Mandylion at Edessa also before 525 [
21,
23]. Therefore, under the hypothesis that the Mandylion is just the Shroud, its arrival at Edessa can be placed just after the departure from Jerusalem. The alleged path for Beirut is described in [
22]. In the case of Memphis and Camulia, the arrival at Constantinople can be assumed in the middle of the X century, i.e., in 950, a hypothesis compatible with the historical sources that describe an acheiropoieton image of Jesus Christ at Constantinople [
14,
21]. All these alleged historical–geographical paths of the Shroud and its sojourns are reported in
Table 1 and are schematically shown in
Figure 1 with different colors.
Table 2 shows the monthly mean temperatures (°C) and relative humidity (%) of the localities indicated in
Table 1. The last row reports average values. These data are needed to estimate
, as discussed in the next Section.
In
Table 2, it can be noted that average temperature and relative humidity are different enough to contribute differently to the natural aging of linen on the scale of centuries [
8]. Notice, however, that the presence of the Shroud for a few tens of years in a specific locality not mentioned in
Table 1 affects its natural aging less than the accuracy of 3% estimated in the actual measurements on the Shroud’s sample [
9]. Indeed, the Shroud was kept for 29 years at or near Saint Hippolyte sur Doubs, where the weather is more similar to Chambéry than to Lirey. Moreover, during the period assigned to Chambéry, the Shroud was often in Turin or near Turin for 13 years, namely, in Vercelli, Moncalieri, and Savigliano. A few tens of years over a history of 2000 years would change the overall aging by at most 0.1%; therefore, these finer details on localities and sojourns can be neglected. In the next Section, the theoretical formula of
, previously presented in [
8], will be updated.
3. Dependence on the Temperature and Relative Humidity of Linen’s Natural Aging
Cellulose is made of linear, polymeric chains of cyclic units whose number per chain is called the Degree of Polymerization (
) [
31]. These chains are organized in both crystalline and amorphous regions in micro-fibrils, which are finally organized in fibers. The phenomenon of depolymerization, i.e., the increase in the number of Chain Breaks (
), is the main mechanism of cellulose degradation and it leads to the natural secular aging of textile fibers, mainly because of the combined action of temperature and relative humidity. For experimental laboratory studies, the natural aging process can be accelerated in suitable ovens by increasing the temperature for reaching the maximum number of
CB in only a few thousands of hours instead of thousands of years [
32].
Recently [
8,
9], it has been shown that the natural aging of the cellulose contained in linen fibers can be estimated by means of Wide-Angle X-ray Scattering (WAXS). Our results have shown that by adopting an average secular temperature, the WAXS-dating results can agree with other dating methods, such as radiocarbon dating and historical records [
8]. However, this new dating method can only be applied when the following conditions are met: (a) when the fibers are not older than about 3000 years, because at this age the structural degradation has probably reached its maximum (saturation effect); (b) when the cellulose degradation of the fibers is mainly due to natural aging arising from thermal, hydrolytic, photolytic, photochemical, and oxidative processes.
It has been shown that X-ray dating of a textile sample can be performed nondestructively on a submillimeter area, e.g.,
, by using new table-top X-ray micro–sources. The
at time
can be theoretically calculated, allowing to define a very useful normalized parameter,
namely, the fraction of the maximum
, given by the ratio between the
at time
and its asymptote found at
, which is practically reached after several thousands of years [
8]:
In Equation (1),
(K) is the temperature at which the fibers have been stored until time
.
is the relative humidity,
is the reaction rate, and
is the
maximum fractional loss for linen [
8]. Notice that
is a nonlinear exponential function of
and
, both of which are time varying, and the resulting time dependence of
is strongly nonlinear, particularly due to its dependence on
, as it will be shown in the following.
Moreover, there is another nonlinear dependence, now with temperature
, in
. The actual value of the reaction rate
is obtained by first measuring its value
at a reference oven temperature
K and at a constant relative humidity
; then, this reference value is scaled to the actual temperature
according to [
8,
31,
32]:
In Equation (2),
J/mol/K is the gas constant;
is the
activation energy for linen [
8]. Now, inserting Equation (2) into Equation (1), because of the two exponential functions, the natural aging of the fibers is affected by a very strong nonlinear dependence on temperature
.
In our previous works [
8,
9], the actual dependence of
on the relative humidity
H was approximated through a linear equation, since variations of secular average values of
H are much smaller around the value of 50%:
However, as reported in
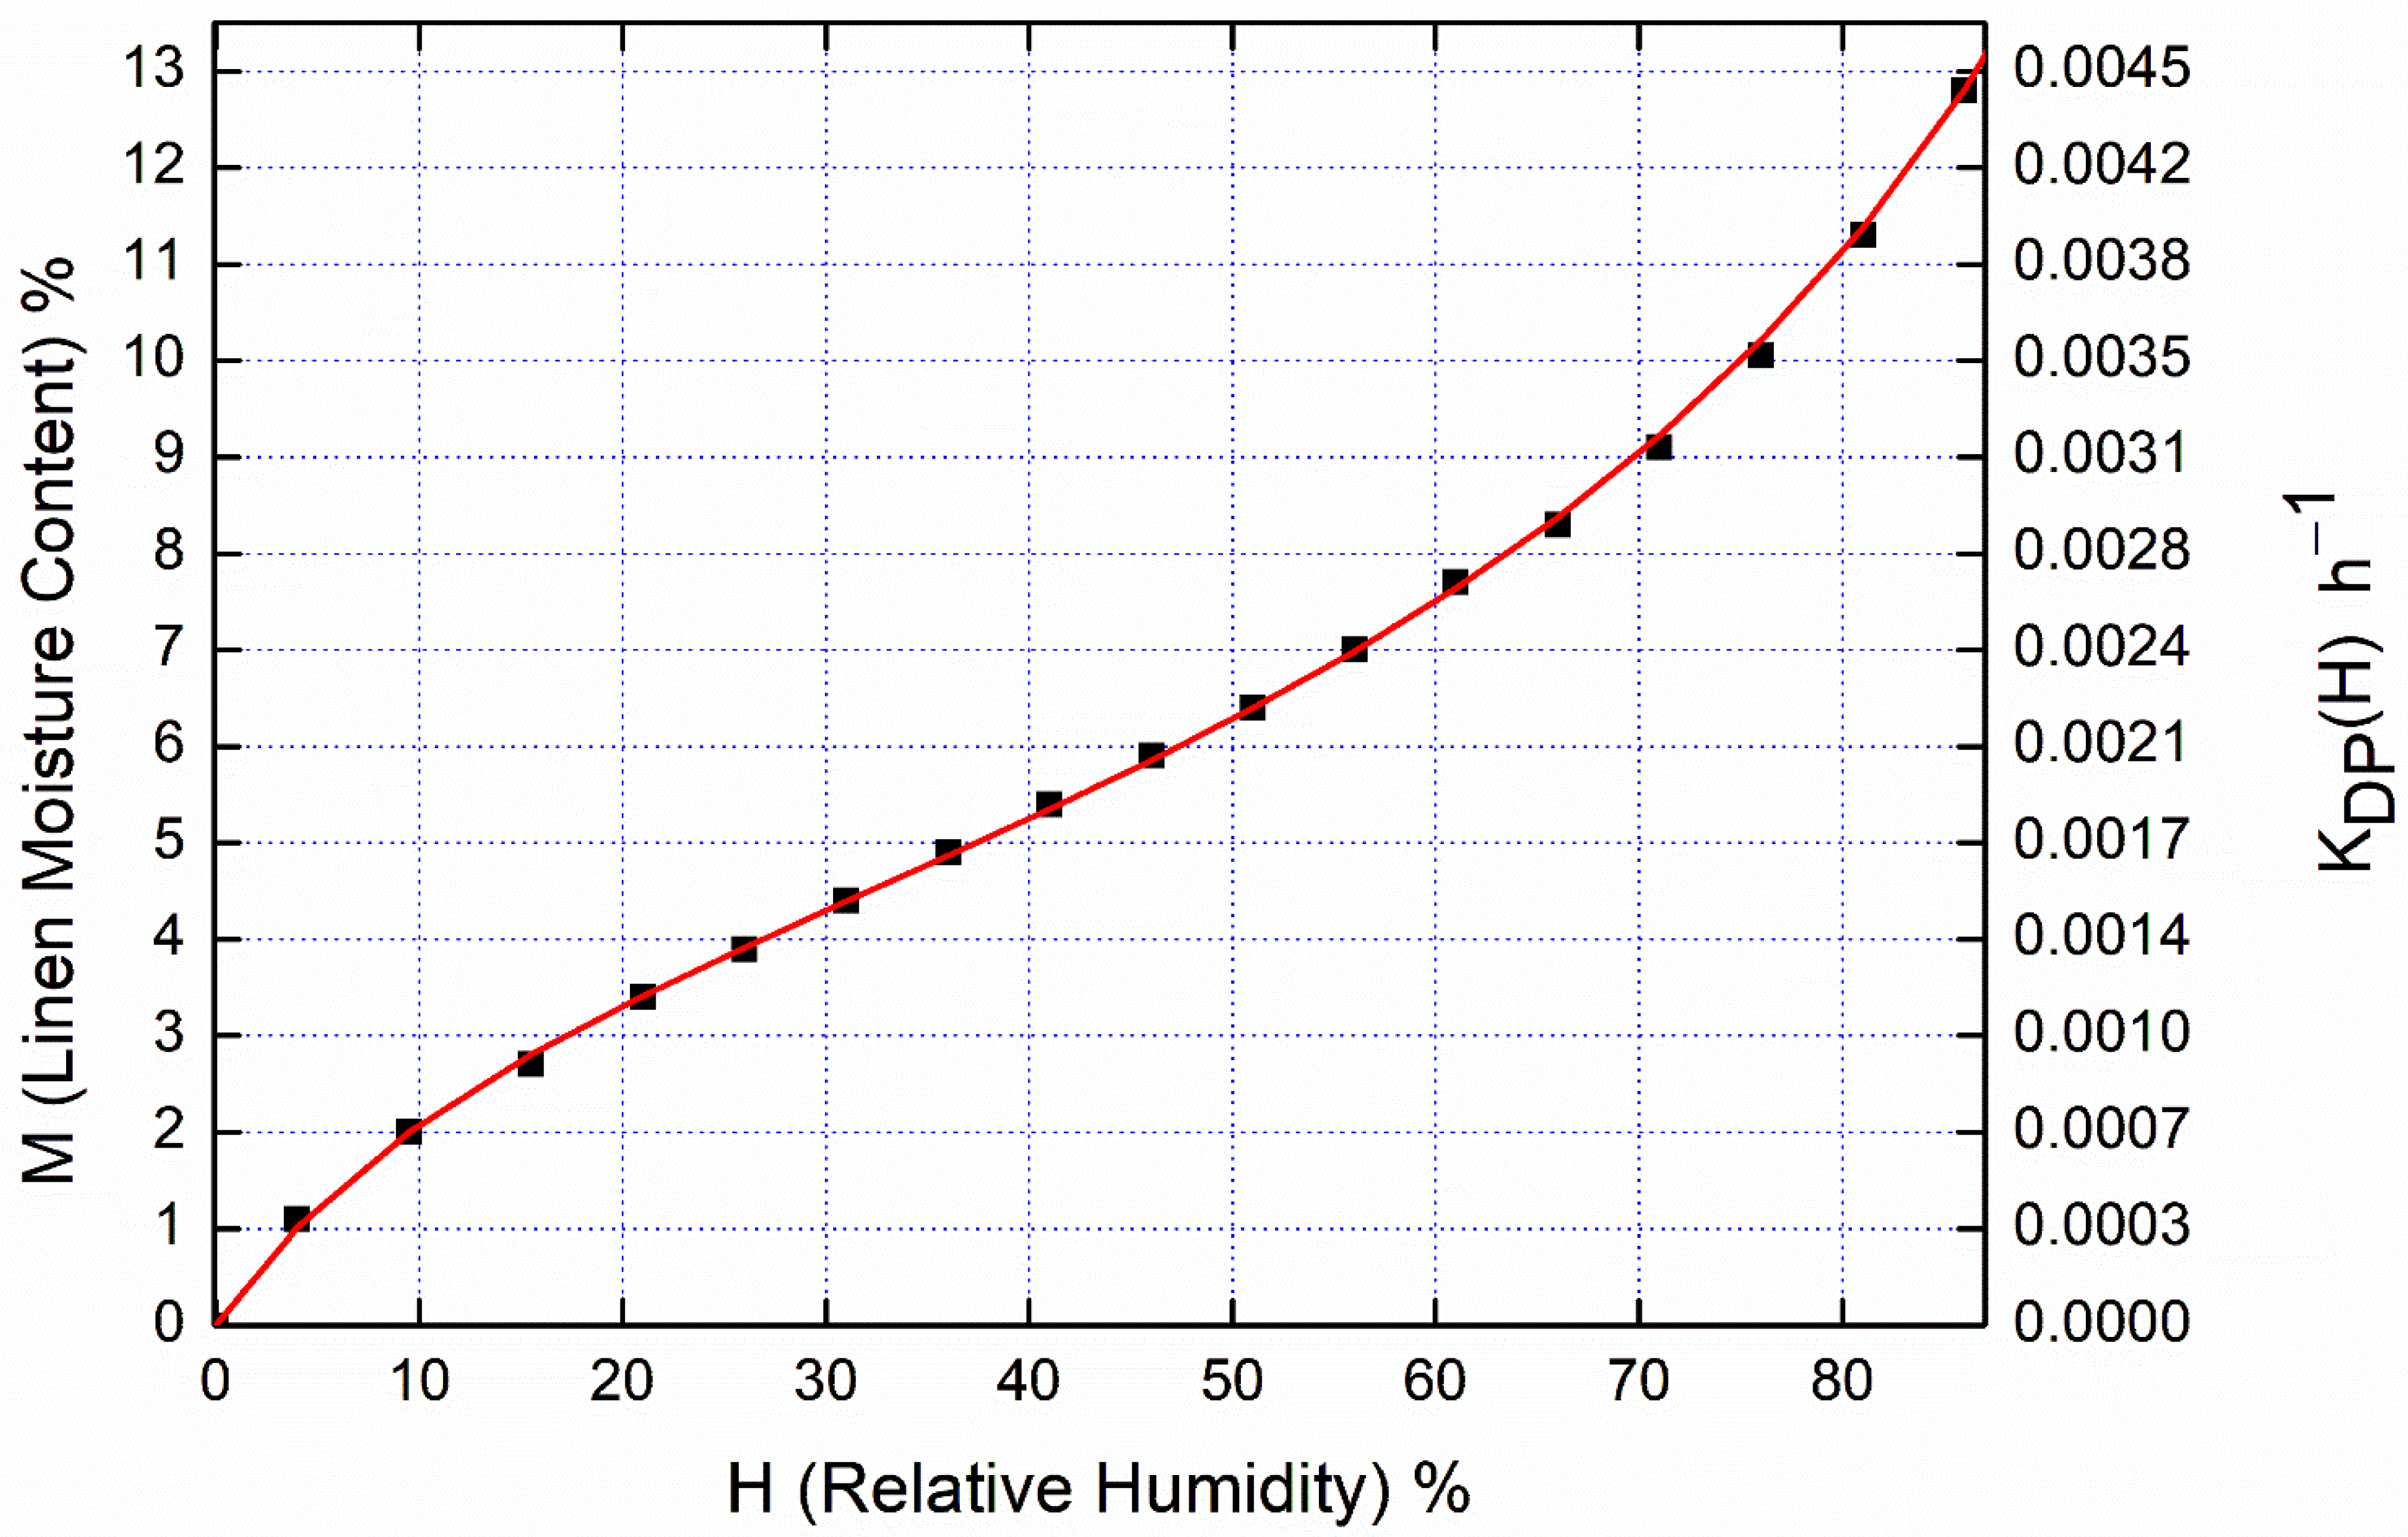
Table 2, the monthly relative humidity can differ significantly from 50% during the year and in different localities. Moreover, the natural aging of linen depends on the relative humidity through the moisture content
M of the textile [
33], which is a function of
H and
. The dependence of
M on
H is not linear and is described by the water sorption isotherm that, for linen at a temperature of about 25 °C, is shown in
Figure 2. However, linen is the textile with the lowest hysteresis loop, caused by the difference in the moisture content increment and decrement resulting from the changes of
H [
34]. If extreme
H values are excluded, e.g.,
or
, the dependence of
on
H for linen is almost linear. This behavior is evident in
Figure 2. The black squares in
Figure 2 are average experimental values of this loop (see [
34], (Figure 8)). The
M values shown on the left ordinate scale have been fitted in the range of
H from 0% to 85%—a range wide enough to account for all the values reported in
Table 2—with the Guggenheim–Anderson–de Boer (GAB) model [
35]. The
values, shown on the right ordinate scale, can be assumed proportional to the
M values. The proportionality constant can be set to recover at
, the same value measured for linen in an oven at
, i.e.,
[
32], thus obtaining the following equation, namely, the red curve shown in
Figure 2:
Here,
are the parameters of the GAB model [
35]. Inserting
into Equation (4) gives 0.0022 [
[
32], as imposed.
To assess how
changes by taking into account the nonlinearity of the water sorption isotherm of linen, at
, Equation (3) gives
while Equation (4) gives
. Taking the maximum and minimum values of the parameters
,
and
leads to a variation in
of the order of
, which is less than the indetermination of
with which
was determined in [
32]. Thus, Equation (4) is accurate enough to describe, for linen, the actual nonlinearity of
as a function of
H.
Now, our aim is to compare the theoretical aging, predicted by
and calculated according to Equation (1), for the sojourns in the localities reported in
Table 1, with the meteorological data reported in
Table 2, with the experimental value
, determined by WAXS for the Shroud sample [
9]. This comparison might assess which historical–geographical path was more likely, a necessary but not sufficient condition, as discussed in
Section 1. However, before this assessment, both the time scale of linen’s natural aging and some meteorological parameters that affect it must be established.
5. Long Term Aging Predicted for the Different Paths of the Shroud
In this section,
is calculated by Equation (5), for all the different alleged paths of
Table 1, using the temperatures and relative humidity of
Table 2. The values of
,
, and
have been derived for linen within an uncertainty of
,
, and
, respectively. This causes an indetermination in the theoretical estimated value of
.
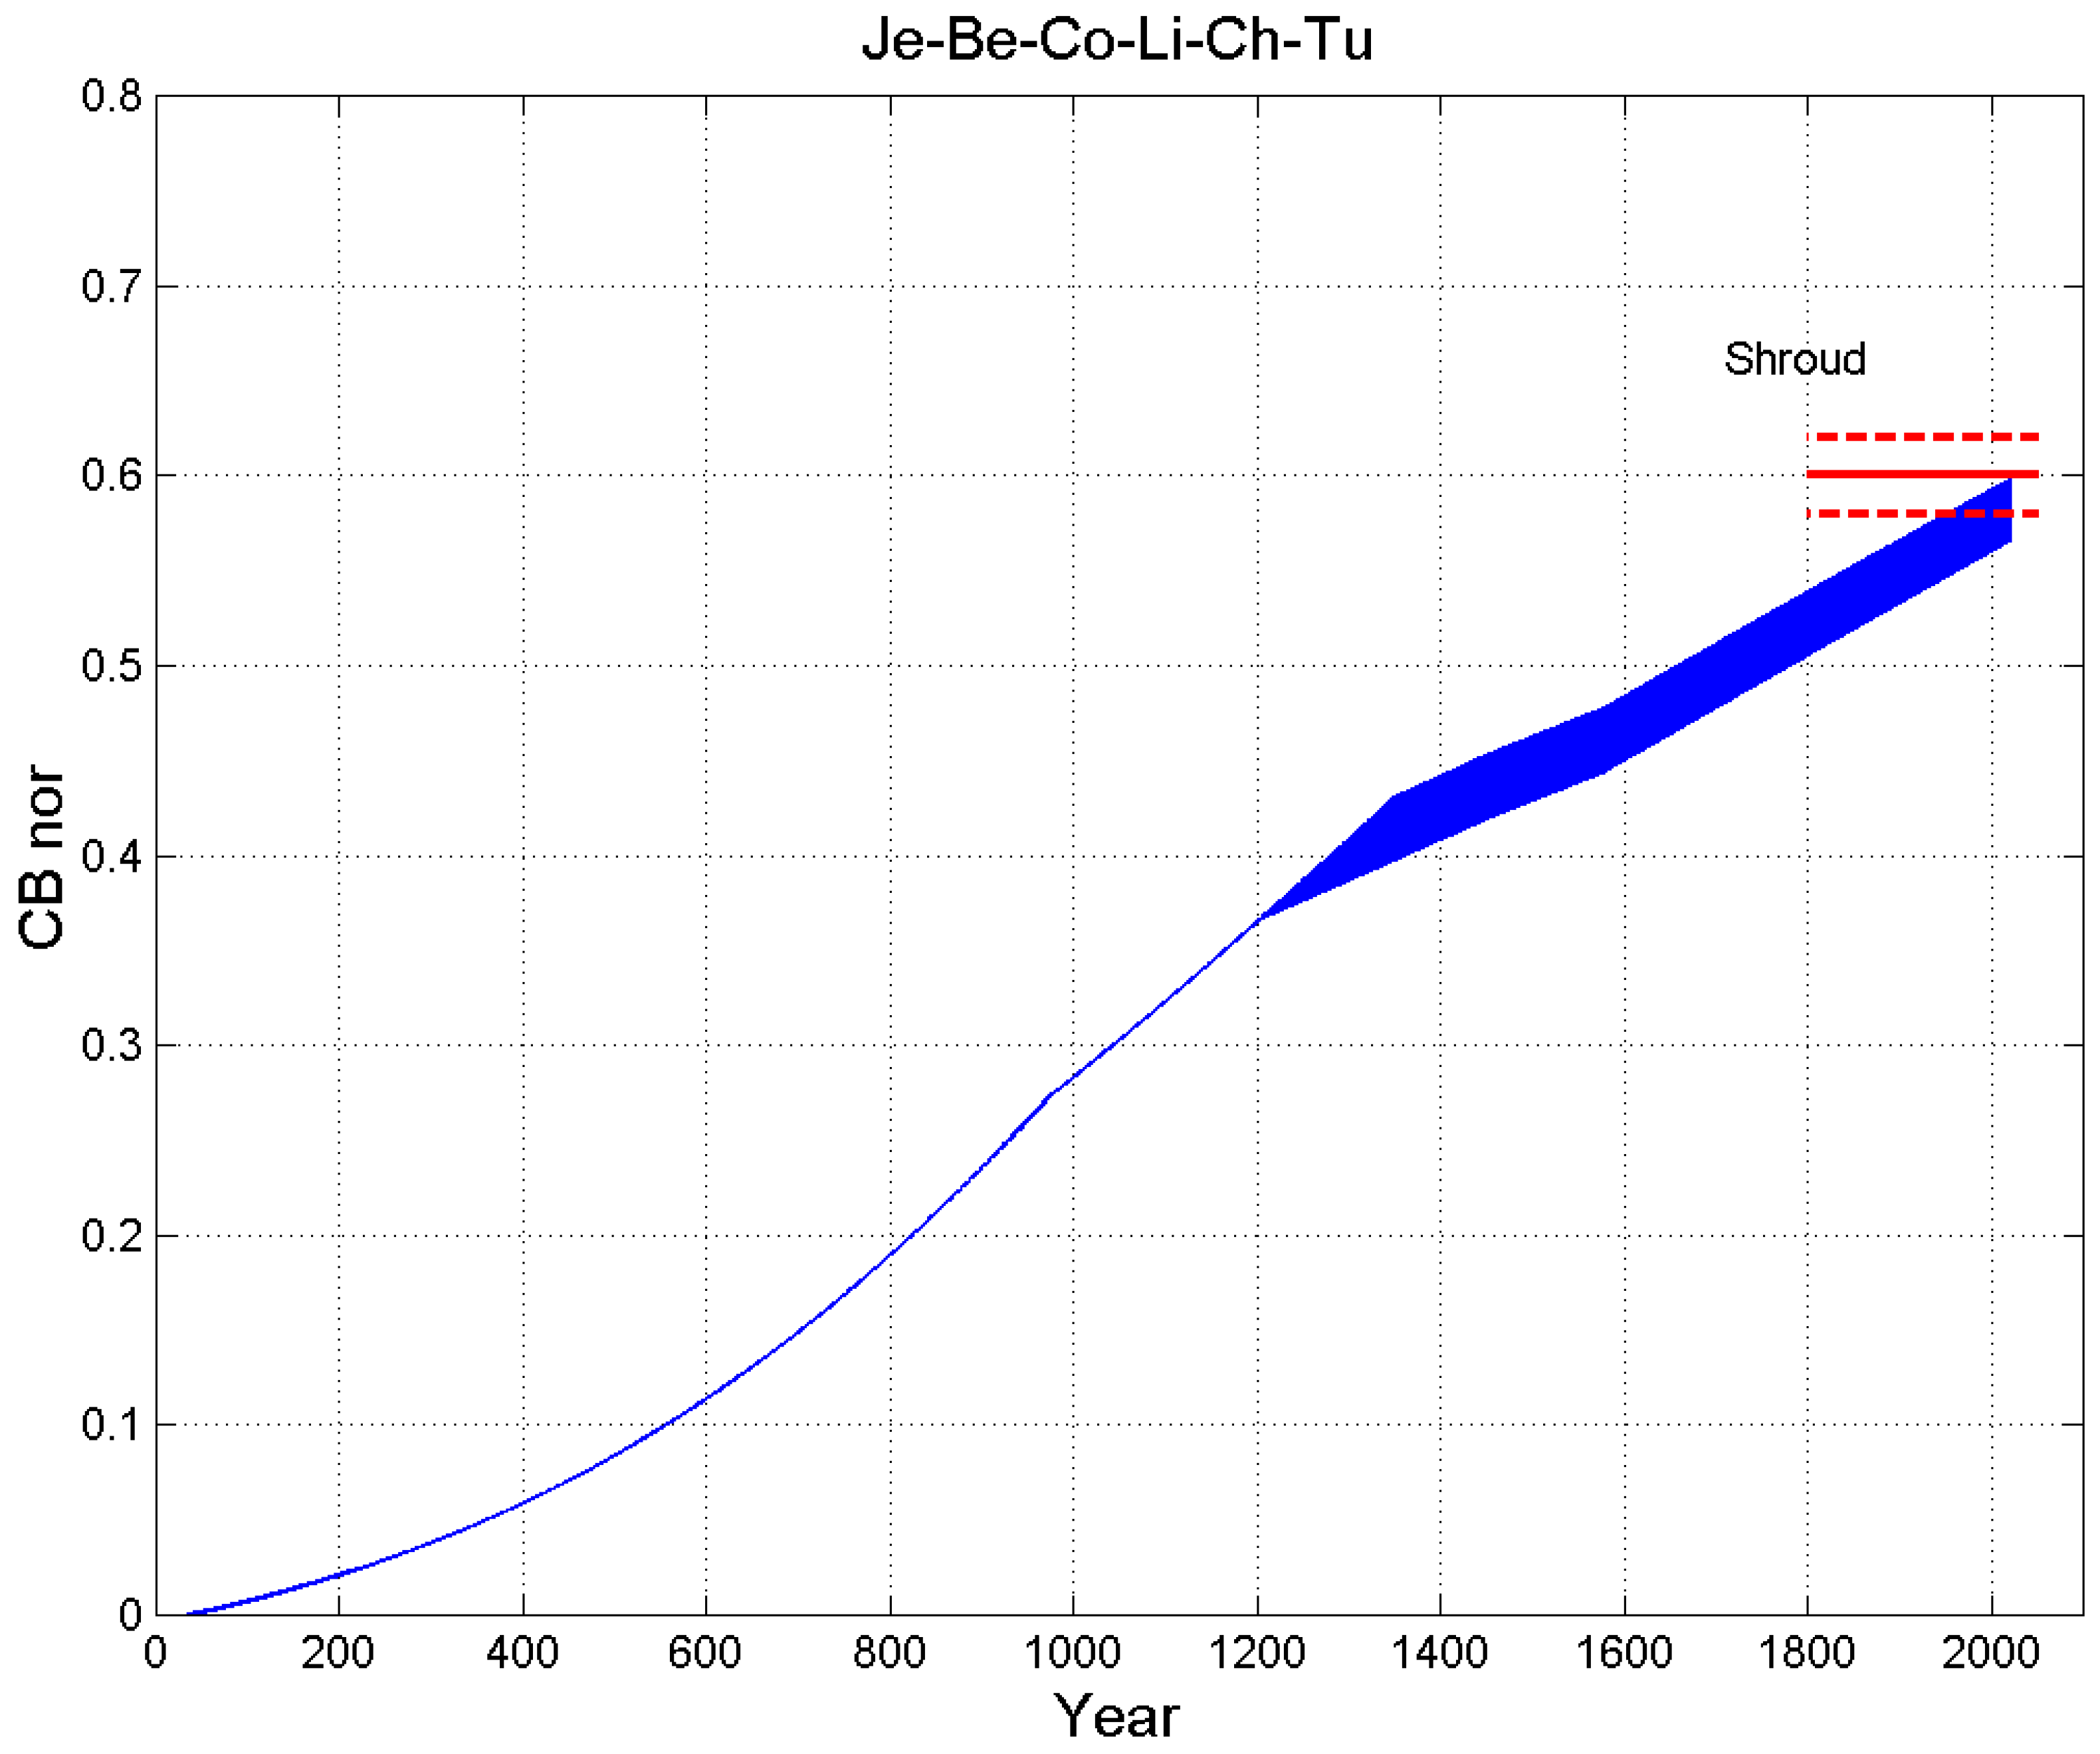
Figure 5 shows the
versus year in the Jerusalem–Beirut–Constantinople–Lirey–Chambéry–Turin path 1 (
Table 1 and
Table 2,
Figure 1) until the year 2021. Each curve assumes a different arrival year in Europe,
, randomly generated from a uniform distribution (Monte Carlo simulation) in the interval
. The upper curve assumes
, and for the lowest curve
.
Table 3 reports the full statistics with error bounds due to uncertainty in the constants assumed in its calculations. In
,
,
, and
. Notice that the value measured for the Shroud sample by WAXS is
[
9]; therefore, it is compatible, within experimental errors and accuracies, with the theoretically estimated value.
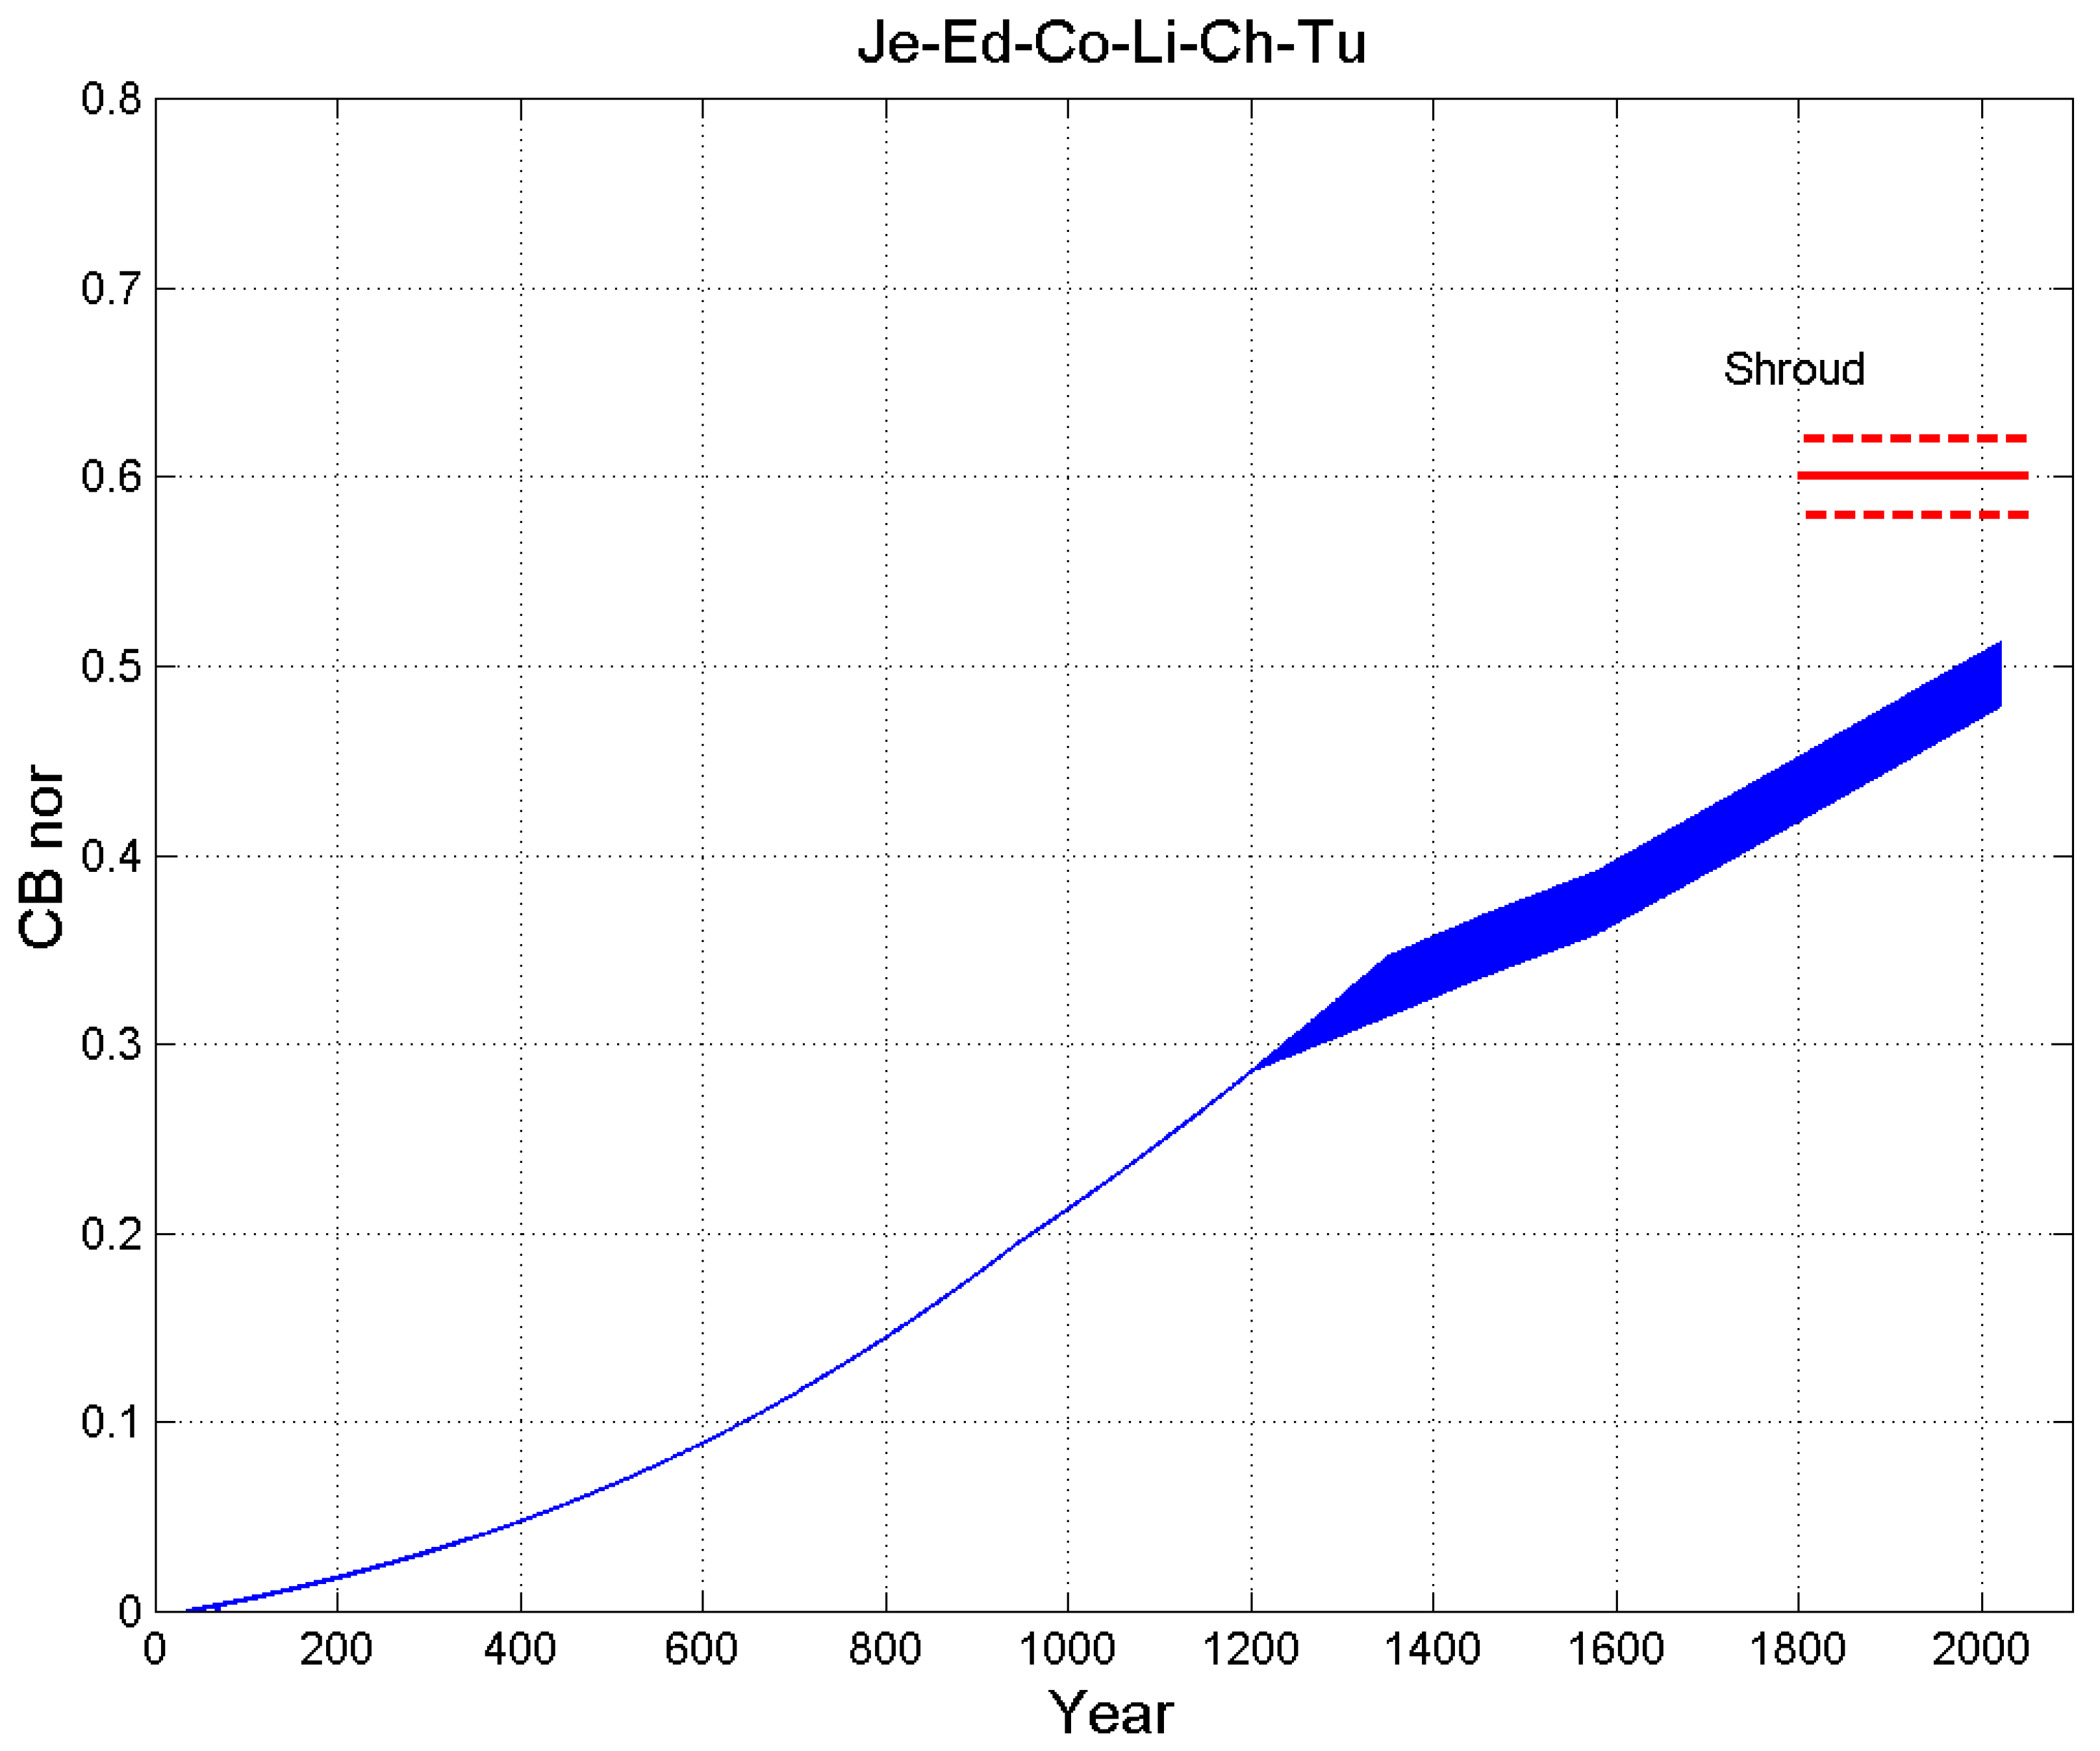
Figure 6 shows the
versus the year in the Jerusalem–Edessa–Constantinople–Lirey–Chambéry–Turin path 2 (
Table 1 and
Table 2,
Figure 1) until the year 2021. Each curve assumes a different arrival year in Europe,
, randomly generated from a uniform distribution in the interval
. The upper curve assumes
, while for the lowest curve
.
Table 3 reports the full statistics with error bounds due to uncertainty in the constants assumed in its calculations. Notice that
is low if compared to the experimental value
, measured for the Shroud.
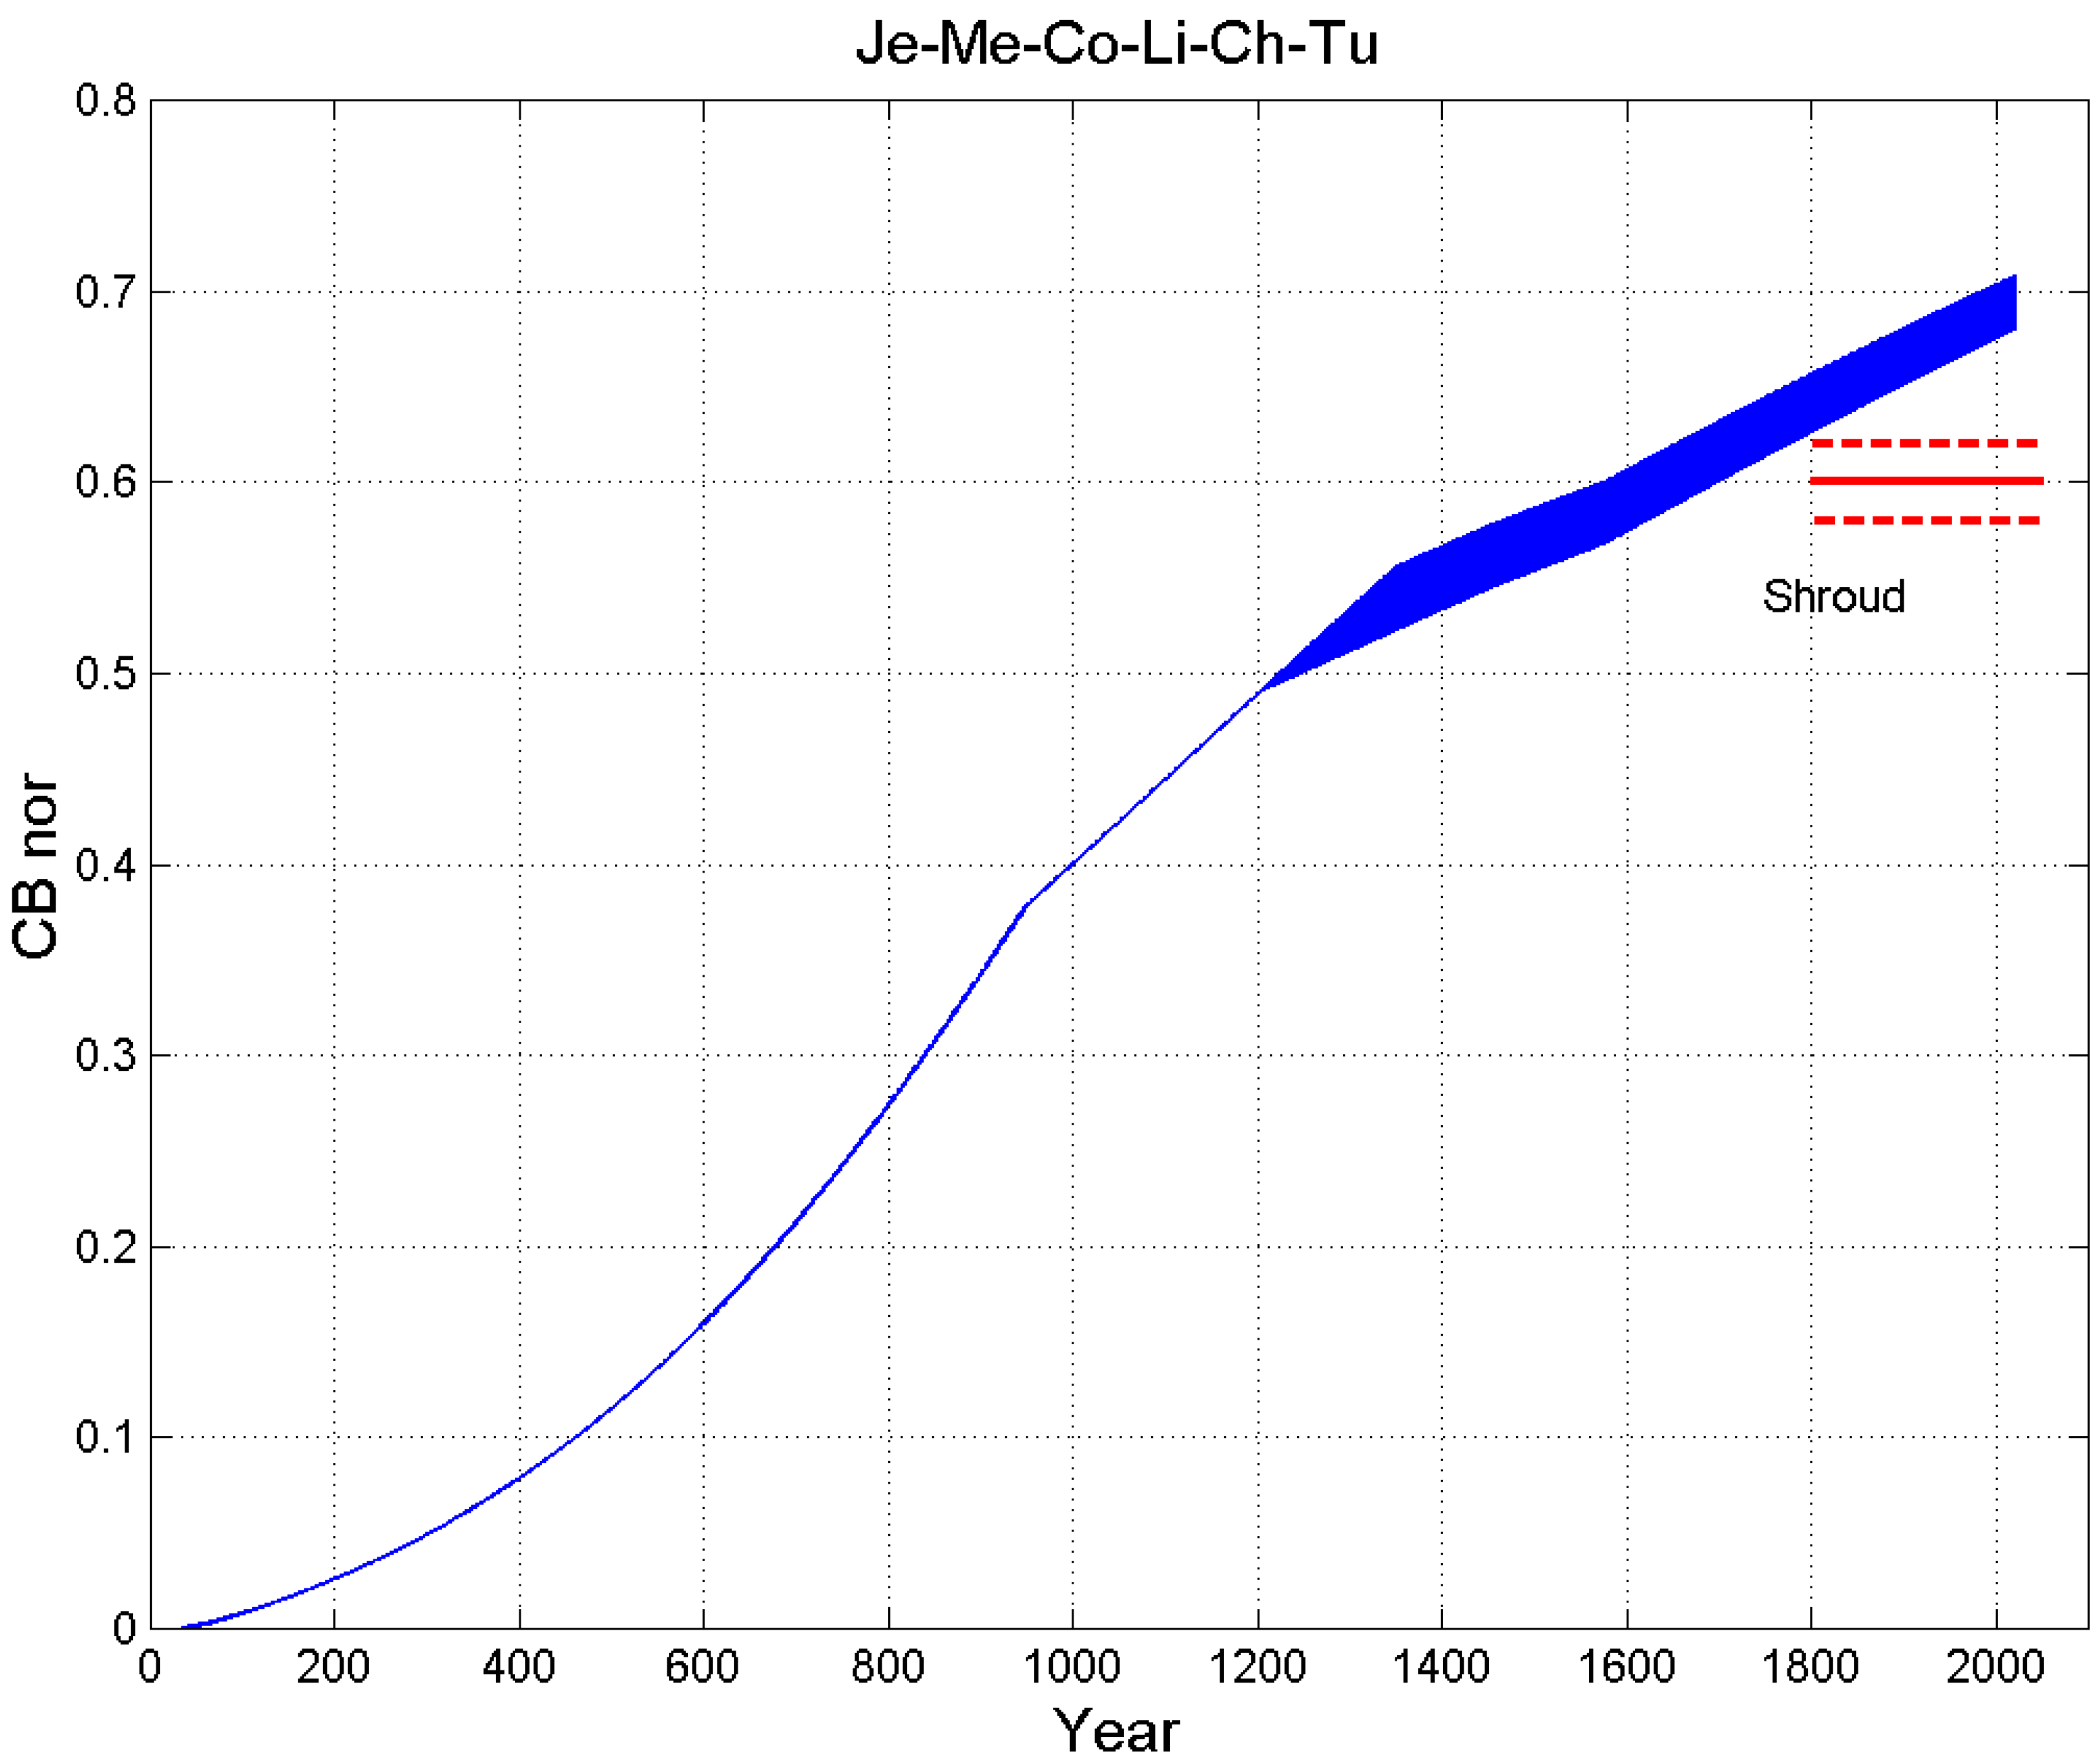
Figure 7 shows the
versus the year in the Jerusalem–Memphis–Constantinople–Lirey–Chambéry–Turin path 3 (
Table 1 and
Table 2,
Figure 1) until the year 2021. Each curve assumes a different arrival year in Europe,
, randomly generated from a uniform distribution in the interval
. The upper curve assumes
, while for the lowest curve
.
Table 3 reports the full statistics with error bounds due to uncertainty in the constants assumed in its calculations. Notice that all the values in 2021 are larger than the experimental value
; therefore, this path may not be correct.
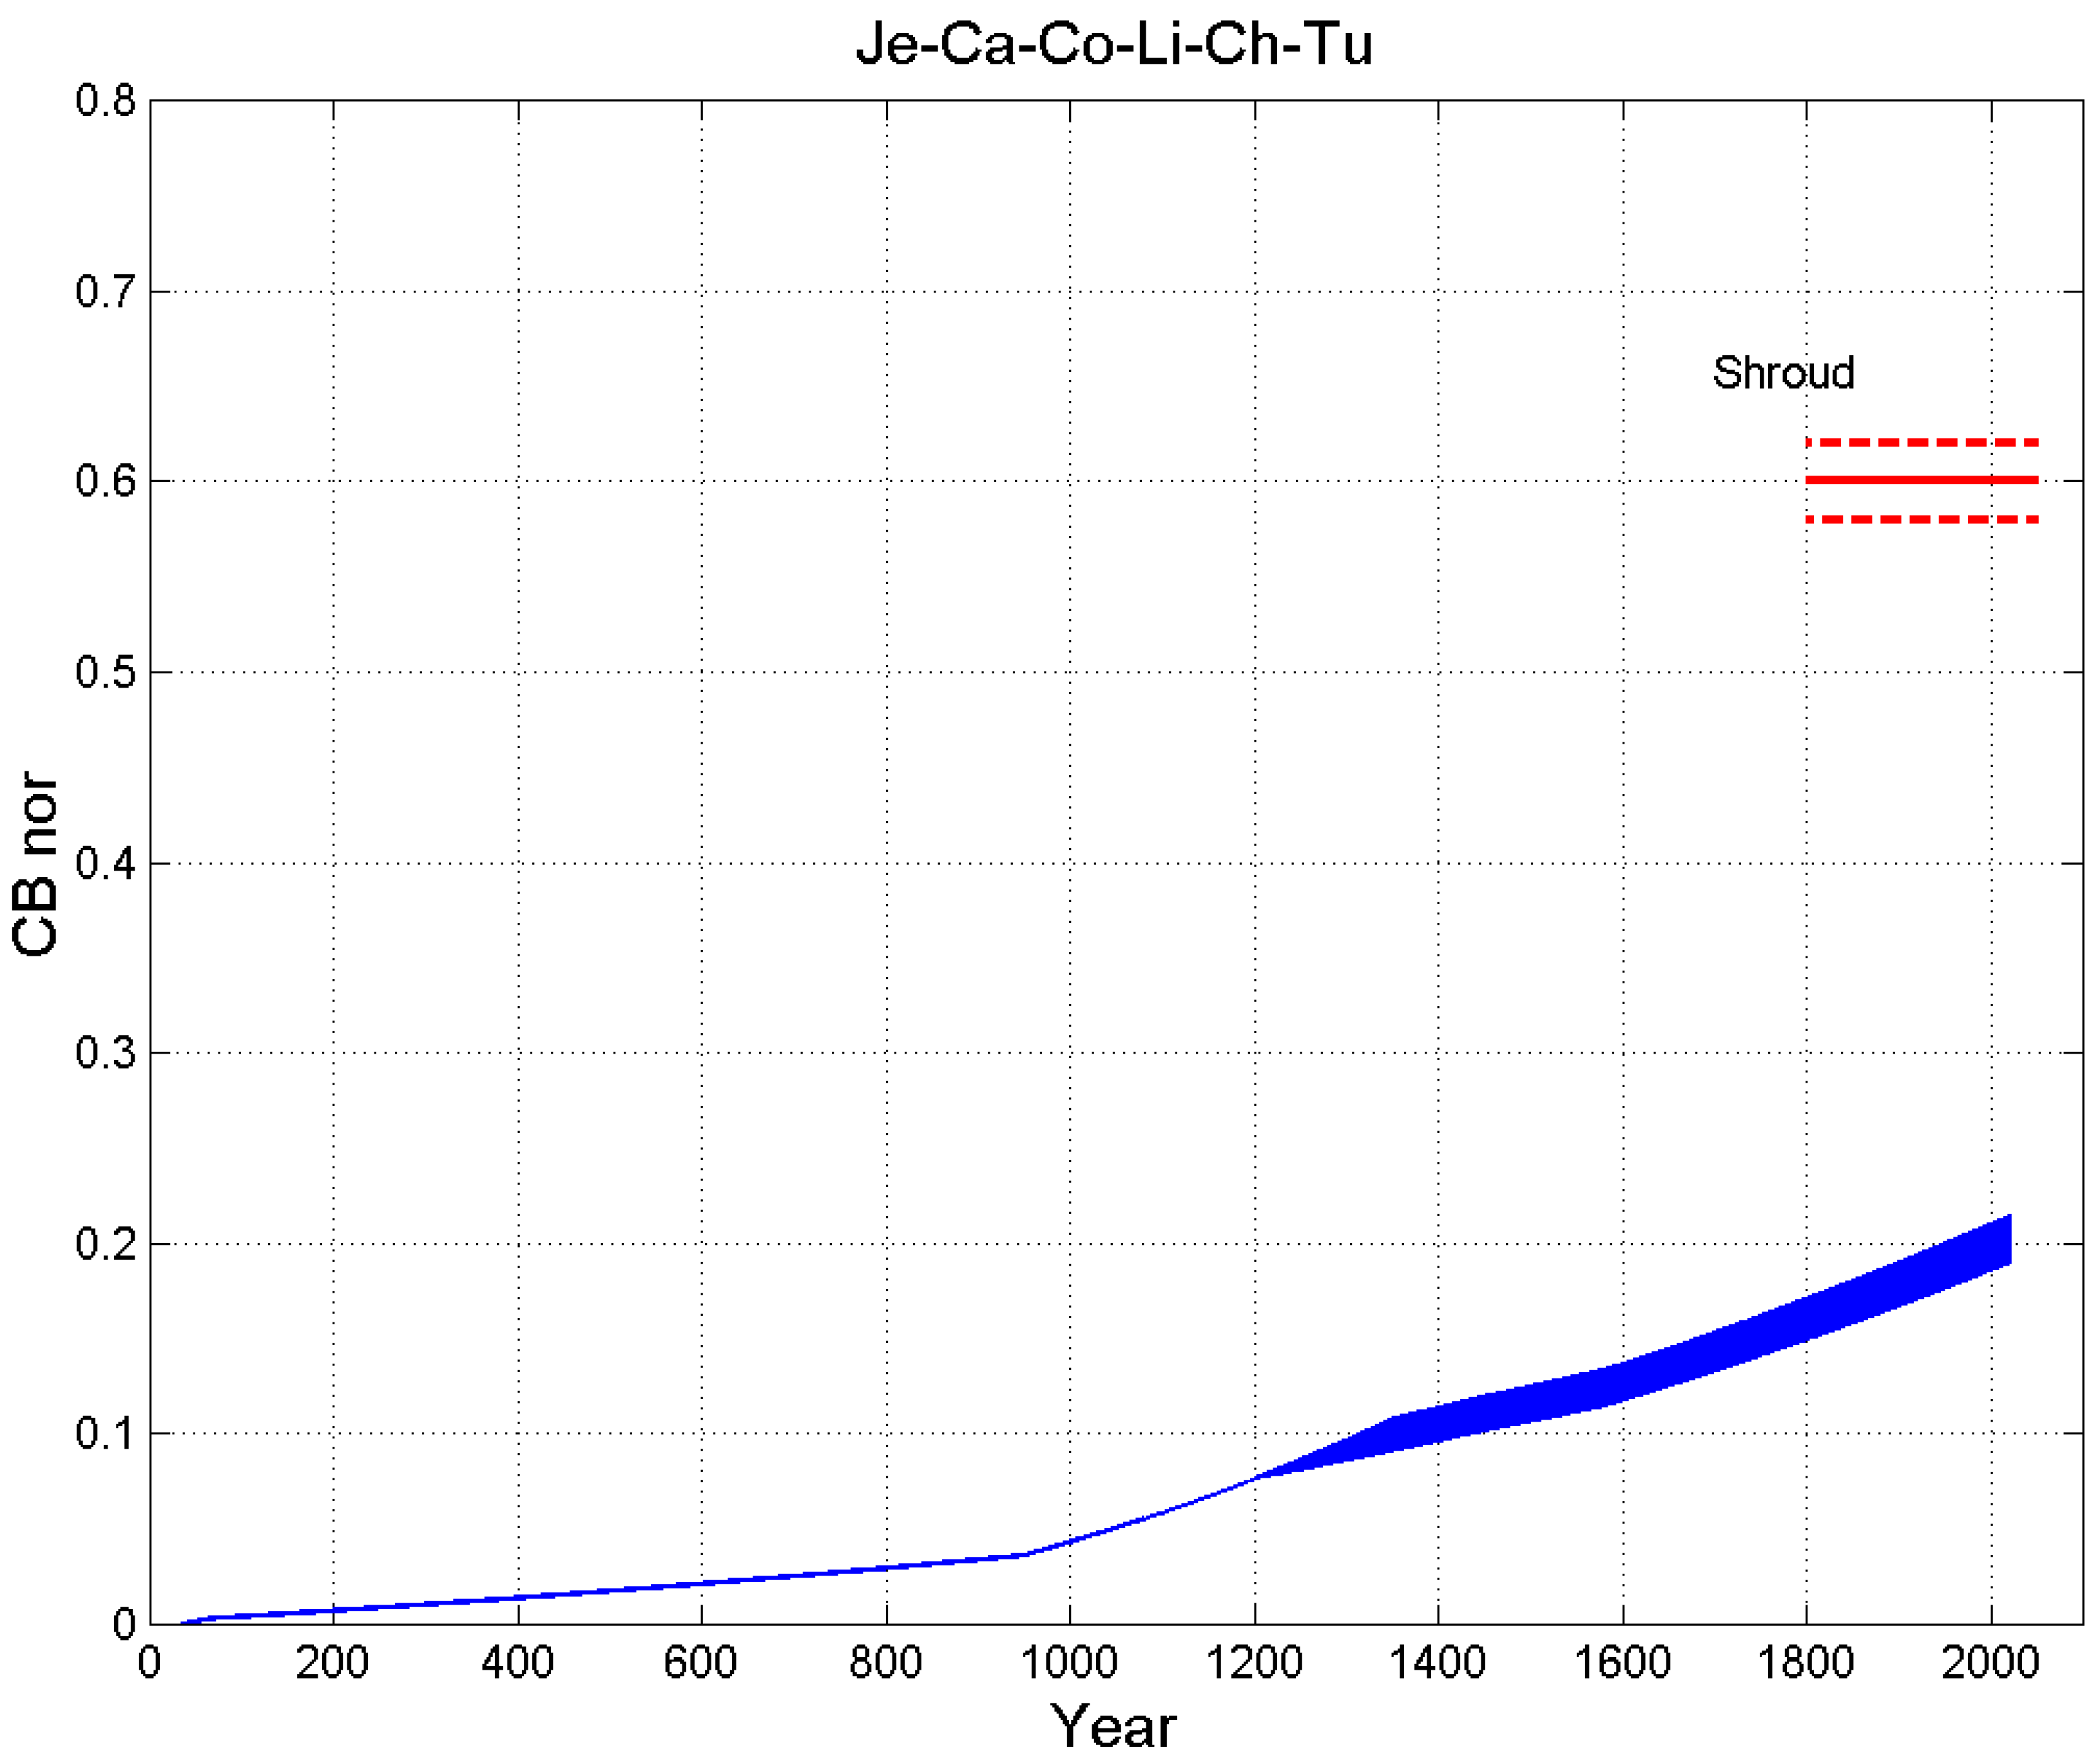
Figure 8 shows the
versus year in the Jerusalem–Camulia–Constantinople–Lirey–Chambéry–Turin path4 (
Table 1 and
Table 2,
Figure 1) until the year 2021. Each curve assumes a different arrival year in Europe,
, randomly generated from a uniform distribution in the interval
. The upper curve assumes
, while for the lowest curve
. In
,
,
, and
.
Table 3 reports the full statistics with error bounds due to uncertainty in the constants assumed in its calculations. Notice that all the values are much smaller than the experimental value
; therefore, this path must be also excluded.
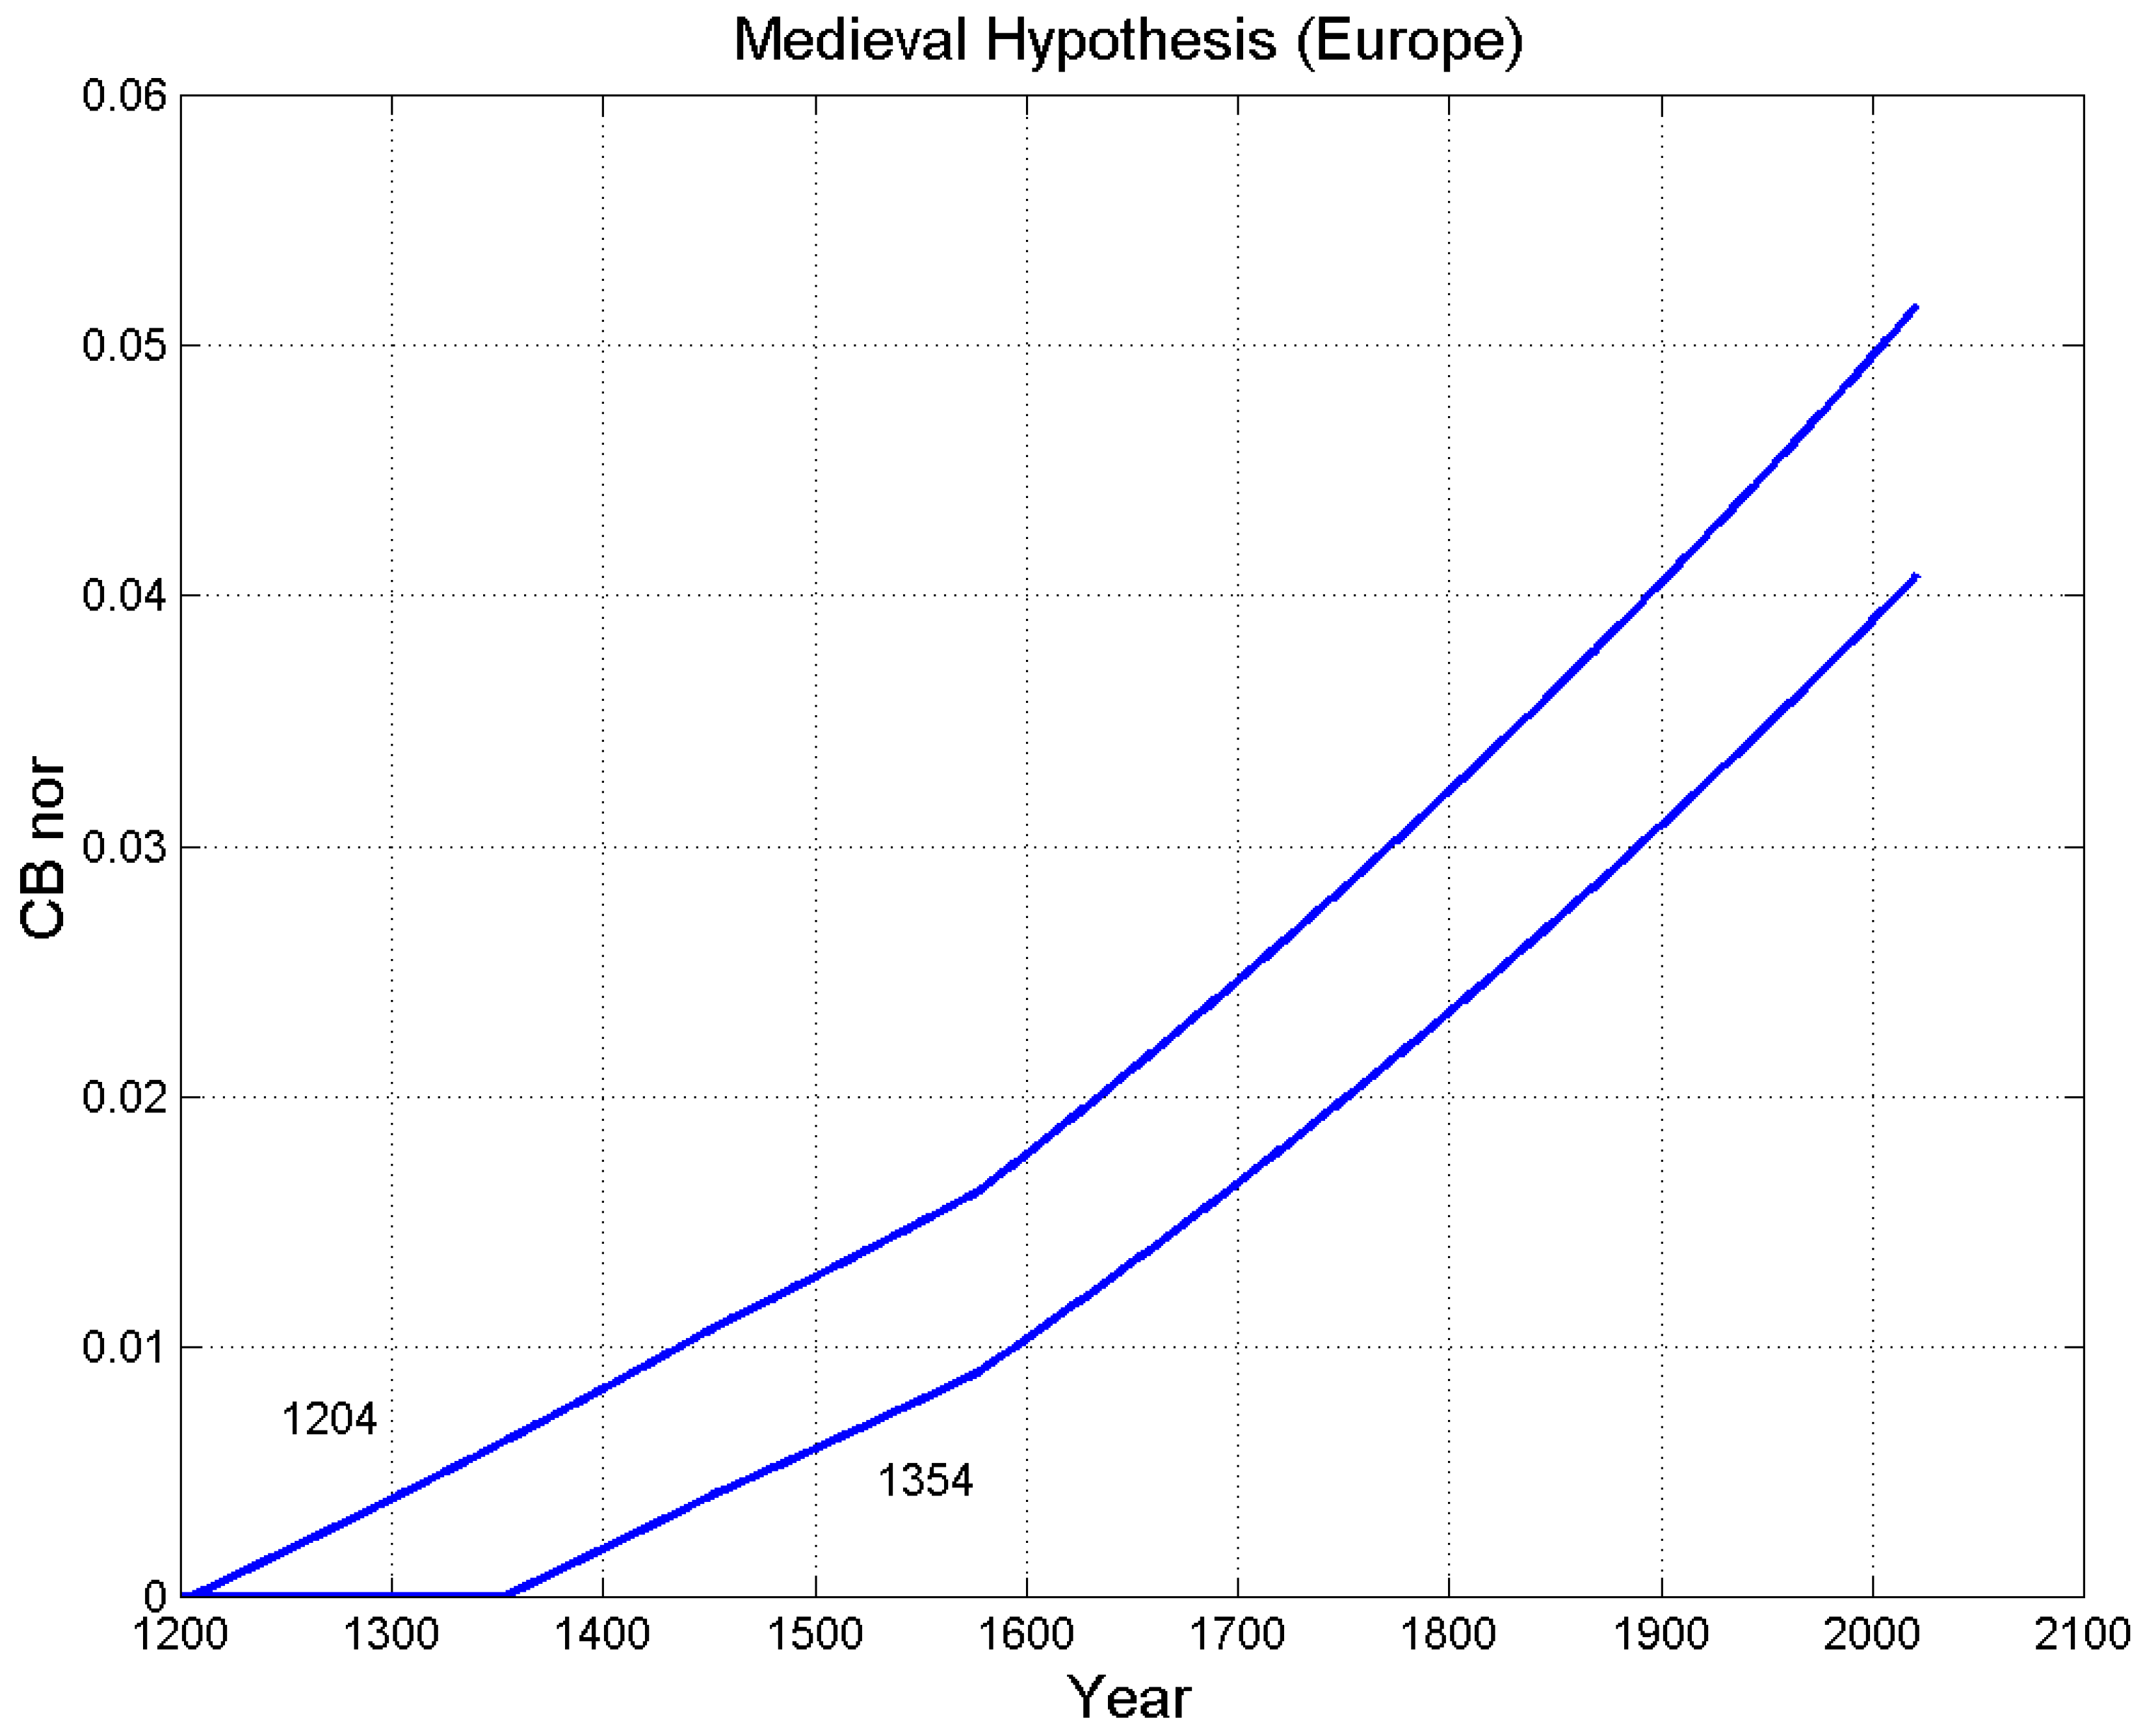
Finally, if Equation (5) is applied to the known history of the Shroud, by calculating the natural aging of linen starting from 14th century, we obtain the theoretical natural aging that accumulated only during this period.
Figure 9 shows the
versus year in the Constantinople–Lirey–Chambéry–Turin path until the year 2021, under the hypothesis that the Shroud is a medieval linen fabric. The two curves differ for the different arrival years in Europe,
, either 1204 (Sack of Constantinople during the fourth Crusade) or 1354 (attested presence at Lirey). The result is as follows:
and
This result allows for the exclusion of the possibility that the experimental value of
for the Shroud, determined by WAXS [
9], could be caused by the natural aging of linen if only its known European history constraint is considered.
In conclusion, the Jerusalem –Beirut–Constantinople–Lirey–Chambéry–Turin path 1 (green in
Figure 1) seems to be the most credible when the theoretical predictions of linen’s natural aging are compared with the experimental value determined for the Shroud sample by WAXS [
9].
The above results have been obtained by considering monthly variations in temperature and relative humidity, since the Shroud would have been kept either in churches or in other private buildings, suffering the effects of these variations. Moreover, the dependence of a textile’s moisture on the relative humidity is not linear and is described by the water sorption isotherm. Considering all these effects, an alleged keeping in Beirut for about nine centuries, characterized by an annual average temperature of 18.6 °C and an annual average relative humidity of 66%, is enough to explain the level of natural aging measured by WAXS on a linen sample of the Shroud [
9]. In this previous work, neglecting these nonlinear effects, a secular average temperature of 20.0 °C and a secular average relative humidity of 75% were estimated for the alleged non-European history of the Shroud, to explain the experimental value. The comparison with the Beirut average values allows for the conclusion that all the nonlinear natural aging effects introduced herein, due to monthly variations and water sorption, are strong enough to cause the same linen natural aging at a 7% lower temperature and a 12% lower relative humidity, with respect to secular average values. In other words, the overall underestimation of the natural aging caused by the approximation of using secular averages instead of monthly averages is of the order of 10%.
7. Conclusions
It is probable that for the entirety of its history, the Shroud has been kept either in churches or in other private buildings, thereby suffering the natural aging of linen due to monthly variations in temperature and relative humidity. Moreover, water sorption non-linear effects in the moisture of textiles could have also contributed to the depolymerization of the linen’s cellulose. Therefore, in this work, to perform a more reliable theoretical estimation of the natural aging of cellulose, the approximation of the average secular temperature and relative humidity, used in our previous works [
8,
9], has been abandoned, generalizing the theoretical model by introducing all the above sources of nonlinearity.
With the new model, the different natural aging process of the linen of the Shroud has been theoretically estimated versus different alleged historical–geographical paths along with the estimation of its sojourns before its arrival in Turin. Many scholars think that the ancient traditions of acheiropoieton images of Jesus Christ could be related to the Shroud. There are historical sources for these images present in several localities. The most important are Memphis (Egypt), Edessa (today, Şanliurfa, in Turkey), Camulia (Cappadocia, Turkey), Beirut (Lebanon), and Constantinople (today, Istanbul, in Turkey). Our Monte–Carlo simulations have shown that the Jerusalem–Beirut–Constantinople–Lirey–Chambéry–Turin path (green path in
Figure 1) is more compatible with the natural aging of linen determined for the Shroud sample by WAXS than the other alleged paths.
This is a necessary but insufficient condition for determining the actual path. Indeed, the Jerusalem–Edessa–Constantinople–Lirey–Chambéry–Turin path—chosen by some scholars by supposing that the Mandylion and the Shroud were the same object—also does not seem to be the best candidate. However, other more articulated paths, e.g., Jerusalem–Memphis–Edessa–Constantinople–Lirey–Chambéry–Turin, could lead to a simulated natural aging process of linen that is fully compatible with the value obtained for the sample of the Shroud [
9]. Indeed, some centuries in the heat of Memphis, before the Shroud’s arrival at Edessa, could increase the theoretical estimate of the
up to the value determined by WAXS. Therefore, a possible sojourn of the Shroud at Edessa for some centuries cannot be excluded, which would have occurred just before the sojourn at Constantinople. In any case, the theoretical simulations show that the WAXS evaluation of the natural aging of the Shroud is compatible with a 2000-year history, even if all possible geographical and historical—both known and alleged—constraints are considered.
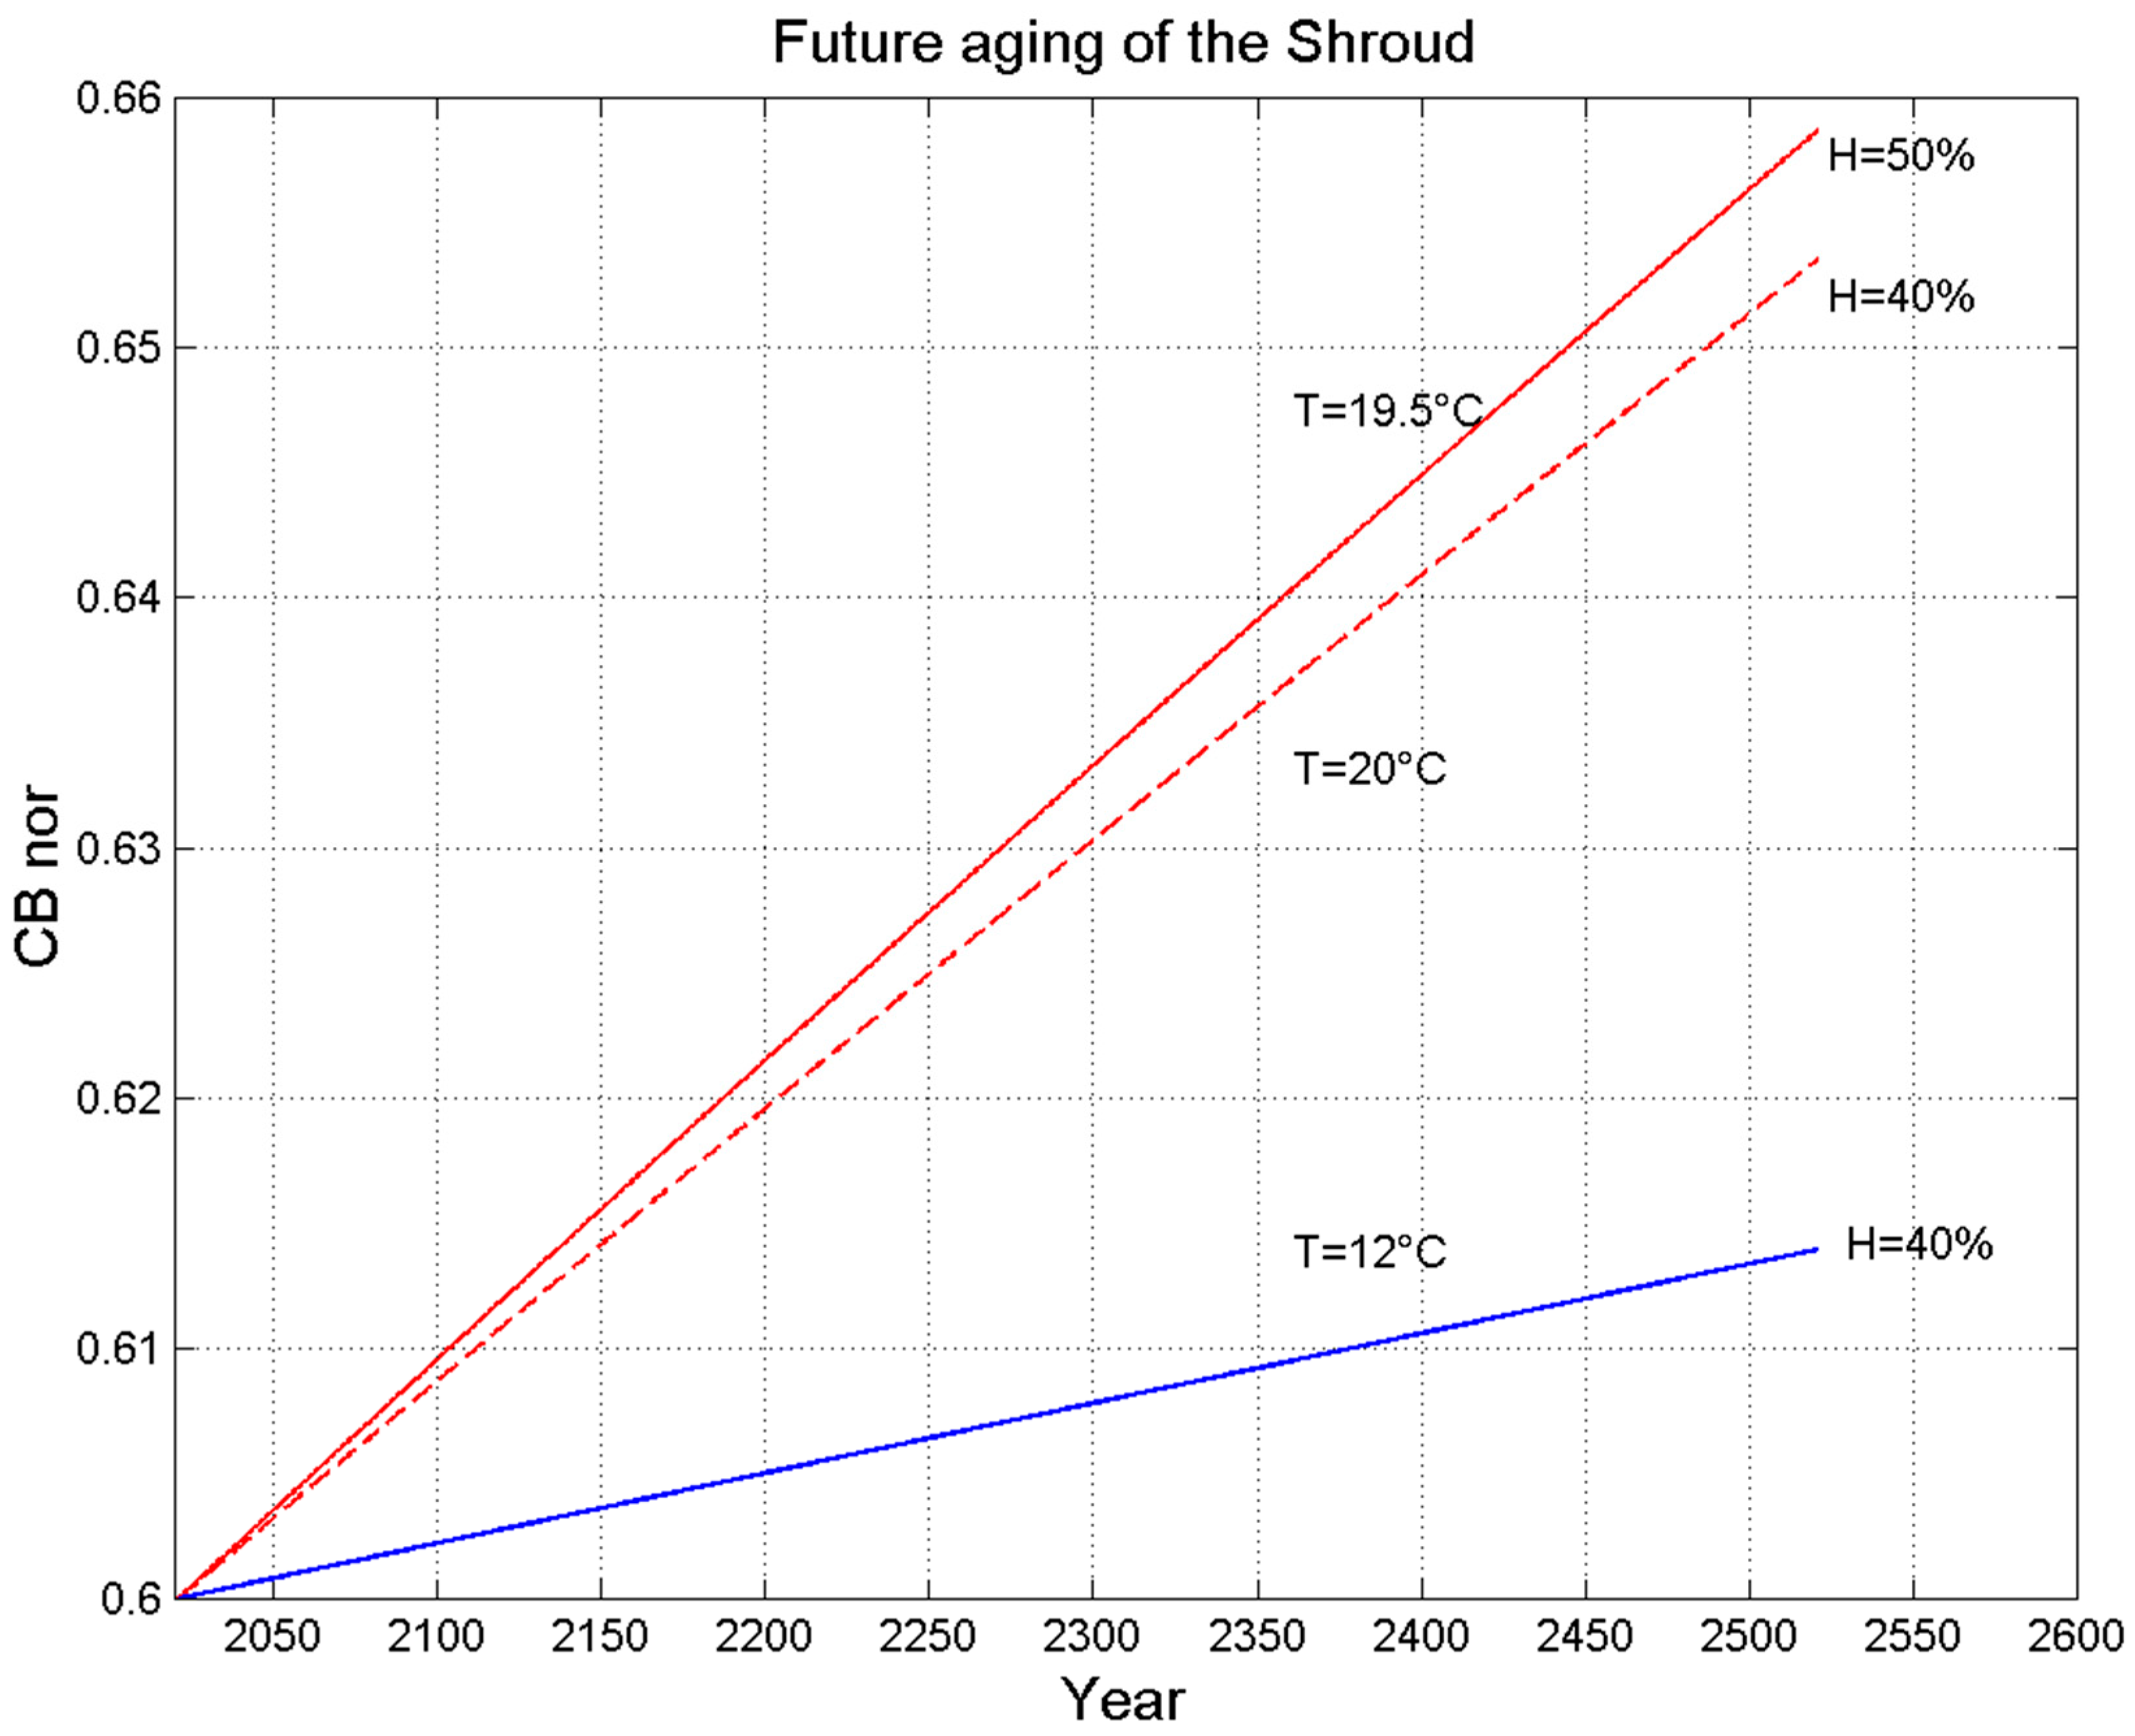
Today, the Shroud is kept in the Duomo of Turin inside a reliquary, with a controlled atmosphere of 99.5% Argon and 0.5% Oxygen, a pressure equalized to the atmospheric value, and at 50% relative humidity and
temperature [
1]. Considering that natural aging can also occur without oxygen, e.g., in a nitrogen atmosphere, although with a reduced depolymerization reaction rate, the future aging of the Shroud’s linen has been simulated under several hypotheses. Our calculations show that under the controlled atmosphere of the reliquary, five centuries will cause an increment of about 9%—given by
—of the fraction of maximum chain breaks. Instead, suitable values of relative humidity, such as 40%, and a suitable temperature, such as 12 °C, the average annual value for Turin, in five centuries would cause an increment of natural aging of only 2%. This is an important aspect because the incrementation of the cellulose chain breaks increases the yellowness index [
32], leading to a slowly but inexorable reduction in the contrast of the image, which is now visible on the Shroud. This entails the risk of preventing future generations from studying this image, whose genesis and microscopic and macroscopic characteristics have already been detailed by science, but whose formation has not been explained yet [
1,
7].
As already stated in [
9], a more systematic X-ray investigation of more samples of the Shroud’s linen could confirm the conclusion of our WAXS study, namely, that the Shroud is 2000 years old. Other laboratories could repeat the X-ray dating of the same samples, and the procedure could also be easily realized under blinded conditions, because the sub–millimetric or millimetric samples of linen fabric needed for WAXS characterization are indistinguishable. Indeed, larger sizes of the textile samples could reveal the uncommon Z-twist of the Shroud yarns.
In future works, to accelerate the natural aging of cellulose in a controlled atmosphere, suitable experiments should be performed in ovens to further validate the predictions obtained with our simulations. The results will be useful to preserve, as best as possible, ancient paper documents or other ancient fabrics from deterioration due to natural aging.


 ,
, 


