Article

Interfaces for Searching and Triaging Large Document Sets: An Ontology-Supported Visual Analytics Approach

Department of Computer Science, Western University, London, ON N6A 3K7, Canada
*
Author to whom correspondence should be addressed.
Information 2022, 13(1), 8; https://doi.org/10.3390/info13010008
Submission received: 26 November 2021 / Revised: 14 December 2021 / Accepted: 21 December 2021 / Published: 27 December 2021

Abstract

:
We investigate the design of ontology-supported, progressively disclosed visual analytics interfaces for searching and triaging large document sets. The goal is to distill a set of criteria that can help guide the design of such systems. We begin with a background of information search, triage, machine learning, and ontologies. We review research on the multi-stage information-seeking process to distill the criteria. To demonstrate their utility, we apply the criteria to the design of a prototype visual analytics interface: VisualQUEST (Visual interface for QUEry, Search, and Triage). VisualQUEST allows users to plug-and-play document sets and expert-defined ontology files within a domain-independent environment for multi-stage information search and triage tasks. We describe VisualQUEST through a functional workflow and culminate with a discussion of ongoing formative evaluations, limitations, future work, and summary.

1. Introduction

Visual analytics combines the strengths of machine learning (ML) techniques, visualizations, and interaction to help users explore data/information and achieve their analytic tasks [1]. This joint human–computer coupling is more complicated than an internal automated analysis augmented with an external visualization of results seen by users. It is both data-driven and user-driven and requires re-computation when users manipulate the information through the visual interface [2,3]. Visual analytics tools (VATs) help users form valuable connections with their information and be more active participants in the analysis process [4,5]. They can be used to support a wide variety of domain tasks, such as making sense of misinformation, searching large document sets, and making decisions regarding health data, to name a few [6,7,8,9]. More than ever, researchers are investigating strategies to combat the rising computational needs of analytic tasks [10]. ML technologies can be helpful in increasing the computational power of VATs; however, their utilization can often come at the cost of clarity and usability for users. Recent studies [11,12,13] have found that traditional interface designs that integrate ML technologies limit user participation in the information analysis process and can lead to reduced user satisfaction. That is, users may struggle to understand and control ML when performing their tasks. In response, there is a growing desire to strengthen “human-in-the-loop” engagement when designing interfaces [11,14,15].
Users perform information search by communicating their information-seeking needs through a tool’s interface, which then generates a document set mapping used to direct document encounters in analytic tasks. This generation of document set mappings arises from the results of the computational search, where investigations are concerned with the design of algorithms and processes which improve computational power. Yet, for information search, investigations usually center on how users can better participate in the computational search through the interface of their tools. While there is great value in novel computational investigations, this paper focuses solely on investigating the design of visual interfaces and how active human reasoning strengthens the human-computer coupling during task performance.
In addition, when information search results are too numerous to be immediately useful, the need for information triage arises. That is, document sets must sometimes be further triaged into more manageable sets for the overall task—just as doctors must perform an initial, rapid triage of their intake before their concentration can shift to the details of individual cases. During information triage, users inspect, contextualize, and make timely relevance decisions on documents to produce a reduced, task-relevant set. However, information search and triage can be challenging for users, particularly in analytic tasks involving large document sets. Harvey et al. [14] have found that when using traditional interfaces for search and triage, such as those with multiple input profiles, paged sets of documents, and linear inspection flows, users struggle to complete their domain tasks. Specifically, users routinely struggle to understand the domain being searched, to apply their expertise, to communicate their objectives during query building, and to assess the relevance of search results during information triage.
To address these concerns, we believe and suggest that users can benefit from VAT interfaces that promote a novel combination of two design considerations: (1) the use of progressive disclosure in the multi-stage information-seeking process and (2) the use of ontologies to bridge the gap between user and task vocabularies. For the former, research [15] suggests that information seeking should be understood as a multi-stage process with distinct functional roles and human-centered requirements. Progressive disclosure is an organizational design technique that manages the visual space of an interface by occluding unnecessary elements of past and future stages, allowing users to concentrate on the task at hand. For multi-stage tasks, such as those involved in the information-seeking process, progressive disclosure can be effective in supporting users to perceive and plan task performances, hence being beneficial when searching and triaging [16]. Regarding the second consideration, users must understand and apply domain-specific vocabulary when communicating their information-seeking objectives. Yet, task vocabularies typically do not align with user vocabularies, particularly in tasks within complex domains such as health [17]. Ontologies are created by domain experts to provide a standardized mapping of knowledge that can be leveraged both by computational and human-facing systems. Thus, ontologies can be valuable mediating resources to assist users in bridging the gap between their vocabulary and that of the task vocabulary [18,19]. To incorporate these considerations into the design of VAT interfaces to enable effective search and triage of large document sets, we are in need of high-level design criteria.
Therefore, in this paper, we set out to investigate the following research questions:
  • What are the criteria for the design of VAT interfaces that support the process of searching and triaging large document sets?
  • If these criteria can be distilled, can they be used to help guide the design of a VAT interface that integrates progressive disclosure and ontology support elements in multi-stage information-seeking tasks?
The rest of this paper is organized as follows. We begin with a background section on information search, information triage, ML, and ontologies. We review research on the multi-stage information-seeking process to distill a set of design criteria. To illustrate the utility of the design criteria, we apply them to the design of a demonstrative prototype: VisualQUEST (Visual interface for QUEry, Search, and Triage). VisualQUEST enables users to build queries, search, and triage document sets. Users can plug-and-play document sets and expert-defined ontology files within domain-independent, progressively disclosed environment for multi-stage information search and triage tasks. We describe VisualQUEST through a functional workflow and conclude with a discussion of ongoing formative evaluations, limitations, future work, and summary.

2. Background

This section provides some conceptual and terminological background. We begin with a discussion of information search and triage, explore the ML pipeline, and conclude with an examination of ontologies.

2.1. Information Search and Triage

Numerous models exist which describe operational, temporal, and sequential frameworks of the information-seeking process [20]. We mention two here. Kuhlthau’s six-part model describes the stages of initiation, selection, exploration, formulation, collection, and presentation. This model was refined by Vakkari into a three-part model of pre-focus (initiation, selection, exploration), focus formulation (formulation), and post-formulation (collection and presentation) [15].
When using a VAT interface to search a document set, users’ primary objective is to encounter documents that are most relevant to their task. For this, users must first communicate their information-seeking needs via the VAT interface. Computational components of the VAT generate a mapping between users’ input and the qualified and relevant documents in the document set and then present it to users at the interface level of the tool [21]. Existing research [14] describes user requirements and, in turn, design considerations of interfaces that mediate information search on document sets. Namely, users must first establish an understanding of the document set and how it relates to their existing domain knowledge. Next, users must learn how to effectively communicate their objectives in a way that can be understood by the tool. Finally, users must comprehend how the VAT applied their input in its computational component so that they can effectively assess and guide their analytics process.
However, as document sets increase in size within analytic reasoning tasks, it has become more challenging for users to arrive at a final set of relevant documents without additional intervention. That is, even after computational components have reduced the document set down to a subset of documents, these subsets are still too large to be of value to users. For this issue, information triage may be required to further reduce the number of documents into a usable collection of task-relevant documents. During information triage, a user’s primary objective is to inspect, contextualize, and make timely relevance decisions on search results [22]. For this to occur, existing research [23,24,25] suggests that, while still able to assess document relevance to information-seeking objectives, tools must allow users to encounter and perform rapid triaging on large sets of documents in a non-linear fashion. Notably, supporting information triage within tools can also help users assess the quality of their search and triage tasks and inform them on how to improve further information seeking [26].

2.2. Machine Learning

ML technologies are increasingly being applied to challenging analytic problems, once considered too complex to solve in an effective and timely manner [10]. For instance, ML is used in developing pathways for drug discovery, rapid design and analysis within materials science, and improvement of the performance of search tasks on large document sets [27,28,29].
ML processes are traditionally described as a three-stage pipeline covering the preparation, utilization, and assessment of models [12]. The primary objective when preparing a model is to analyze and sanitize incoming data. During this stage, responsibilities include data reformatting, minimizing signal noise, organizing common feature labels, and removing features that misalign with the task domain [30].
The next stage in the process is the utilization of a selected ML algorithm. There are many ML algorithms, typically categorized under either supervised or unsupervised learning [13]. With supervised ML, labeled data are typically ingested and fit to train the model to optimally arrive at a gold standard output. The objective is that, given the same task and a new dataset with similar labels, a trained model can then repeat its performance [31]. Supervised models are best used in ML pipelines that require repeated predictions of label classification or the regression of numerical data points. Examples of supervised learning algorithms are Support Vector Machines, Naïve Bayes, and K-Nearest Neighbor [32]. Unsupervised models rely on probabilistic adjustment techniques rather than training to a specific gold standard. The most common application of unsupervised learning is when an algorithm can analyze data points to learn of their shared associations within the structure of the input space. Thus, unsupervised models are best applied in ML pipelines whose goal is to make sense of data-point clusters and densities within the input space, such as mapping inputs to document sets to generate document groupings during information search [13]. Examples of unsupervised learning models are hierarchical clustering algorithms which calculate distances between data points, centroid-based clustering (e.g., K-means), which converge data points to centralized nodes, and density-based clustering (e.g., MeanShift), which re-weight data points based on proximity to densities within the input space [32,33].
In the final stage in the ML pipeline, users assess the effectiveness of the selected model so as to conclude their task or provide feedback to their tool. A research area receiving much attention is how to design interactive ML interfaces such that a balance is struck between the computational power of the machine and the perceptual and decision-making power of humans—that is, support the “human-in-the-loop” aspects of the design appropriately. Through the lens of visual analytics, such ML pipelines can further expand to a five-stage pipeline: data collection, cleaning, storage, analysis, and data visualization in both macro and micro forms depending on analytic task needs [34]. A generalized and human-centered interaction loop for interactive ML involves a set of stages where [35]:
  • Users specify their needs as a set of terms understood by the tool.
  • Users ask the tool to apply them as input features within its computational components.
  • The tool performs computation to map the features against the document set.
  • The tool displays the computational results and how they arrived at them.
  • Users assess if they are satisfied with the results or if they would like to adjust their set of terms to generate an alternate mapping.
  • Users either restart the interaction loop or complete the task.
Despite knowledge of the above-mentioned stages, there are still many challenges in supporting effective engagement with ML components of tools, such as those within VATs. One challenge is the design of interfaces that can help users engage with ML processes effectively [35]. For instance, if users cannot understand ML characteristics and requirements of their tool, they cannot perform their tasks effectively or maximally. Another significant challenge is supporting users in communicating their information-seeking objectives to a VAT’s ML components. This is especially a concern in visual analytic tasks which involve direct interaction with ML processes [36,37,38,39].

2.3. Ontologies

When using VATs for searching and triaging large document sets, both the human and computational components can only perform optimally if their communication is strong [40]. Simply put, users can only perform well if they understand what their tool’s interface is presenting to them. Furthermore, a tool can only optimize its computational components if the user-expressed vocabulary and instruction truly align with their intended information-seeking objectives. Tools are not typically designed to adapt to changing vocabularies. That is, when searching and triaging a specific document set, tools are traditionally designed to fit a singular vocabulary and task. It is often up to the users to understand the tool’s domain-specific vocabulary and use that understanding to communicate their information-seeking objectives. Yet, learning the often unfamiliar vocabulary of the tool can be a significant challenge for users, particularly in complex task domains (e.g., health), which encapsulate terminology, relationships, axioms, and knowledge structures that diverge from a common vocabulary of general users [17].
To address this challenge, expert-defined ontologies are increasingly being used as mediating resources within human- and system-facing interfaces [41]. Within his seminal research, Gruber succinctly defined an ontology as an “explicit specification of a conceptualization” that reflects a set of objects describing knowledge through a representational vocabulary [42]. Ontologies are created by domain experts to provide a standardized mapping of knowledge. This can be leveraged both by computational and human-facing resources [18]. A wide variety of domains have begun to integrate ontologies into tasks, such as information extraction of unstructured text and behavior modeling of intellectual agents. Furthermore, ontologies are seeing increased use both within critical and non-critical health-related domains such as decision support systems within critical care environments, telehealth systems, as well as general human-facing visualization tasks [43,44,45,46,47]. Ontologies can be classified as one of three types: traditional ontologies that describe the structure of reality, expert-created ontologies that describe the entities, relations, and structures of a given domain, and top-level ontologies that interface domain ontologies [40]. Ontologies can provide flexibility, extensibility, generality, and expressiveness that are necessary when trying to effectively bridge domain knowledge between humans and computational tools [19].
Comprehensive investigations of ontology engineering exist, which provide systematic reviews and methodologies. From these works, ontology engineers can find guidance in their efforts when formulating, creating, and validating ontologies [48,49]. After transcribing an ontology, designers prepare its entities, relations, and other descriptive attributes into standardized data file formats (e.g., W3C-endorsed languages OWL, RDF, RDFS). These data files can be shared among knowledge users and used in domain-specific tasks. In simple terms, it can be said that when creating a domain ontology, experts must navigate the terms and characteristics of their domain to conceptualize a generalized and universal mapping of their knowledge [40]. During the creation process, experts construct a structured network formed largely of ontology entities and relations [50,51]. Ontology entities reflect the conceptual objects of a domain and will typically encode information about their role in the vocabulary, definitions, descriptions, contexts, as well as metadata that can inform the performance of future ontology engineering tasks [52]. Ontology relations express the type and quality of interactions among entities and unfold numerous unique interoperability of axioms within a domain [53]. As regards this, Arp et al. [40] distinguish three relations: universal–universal (e.g., a rabbit “is a” animal), particular–universal (e.g., this rabbit is an “instance of” a rabbit), and particular–particular (e.g., this rabbit is a “continuant parts” of this grouping of rabbits).

3. Methods

In this section, we provide an analysis of leading research within the task space. We begin with a specification of the literature search, followed by task analysis. We conclude by using this analysis to distill design criteria to guide the creation of VAT interfaces for searching and triaging large document sets.

3.1. Literature Search

Our objective in this systematic search was to identify relevant research articles that describe the information-seeking process, its stages, and how designs can account for the unique characteristics and requirements of supporting user tasks.

3.1.1. Search Strategy

The literature search was divided into four categories: information-seeking process, information search interface, information triage interface, and ontologies within user-facing interfaces (Table 1). With these keywords, using Google Scholar and IEEE Xplore, a literature search was conducted for articles published between 2015 and 2021.

3.1.2. Inclusion and Exclusion Criteria

We used the following criteria to include papers from the literature in our review: (1) published in a peer-reviewed journal; (2) accessible in full, with empirical evidence; (3) published within the specified scope of time; and (4) aligned with the research direction. Namely, we included papers that present considerations for designs of user-facing information-seeking visual interfaces and, in particular, the generalized task performances of information search and triage on document sets.
Exclusions were made if the papers (1) presented deeply domain-specific user, task, or interface requirements which would not hold as generalized information-seeking processes (e.g., domain-specific datasets, AR, VR, mobile-exclusive, etc.); (2) described ontology integrations that are not user-facing (e.g., system-facing integration); (3) involved ontology integrations for tasks not related to the information-seeking process; (4) concerned system-facing issues, such as computational search, machine learning algorithms, indexing, storage, networking, and the like, rather than user-facing information search or triage processes; or (5) were not in English.

3.1.3. Selection and Analysis

Through search interfaces and their available filtering functionality (e.g., keyword entry, date range, article type, etc.), we performed screening on metadata using the inclusion and exclusion criteria on the journal, title, and year of publication of available literature. If a paper passed metadata screening and the inclusion and exclusion criteria, we accessed the full article along with its abstract and any available summarizing content. We gathered and reviewed in full papers that passed the second screening.

3.1.4. Results

After completing metadata screening using search engine interfaces, a combined total of 539 papers were produced. From this set, we removed duplicates (n = 1). We performed a second abstract screening on the set using inclusion and exclusion criteria, removing 502 papers (Table 1). Hand-searched references extending from encountered literature resulted in the inclusion of 18 additional papers. This produced a total of 54 papers available for task analysis.

3.2. Task Analysis

We divide our analysis of the collected literature into three topic sections. First, we summarize leading research on the models of the information-seeking process and the importance of progressive disclosure for supporting multi-stage tasks. Next, we examine the substages of information search: query building and search. Afterward, we discuss the substages of information triage: high-level and low-level triage.

3.2.1. Models of Information-Seeking Process and Progressive Disclosure

Huurdeman [15] suggests that information seeking should be understood as a multi-stage process with distinct functional requirements. This research explores existing models of the information-seeking process, beginning with a summary of a six-stage model: initiation, selection, exploration, formulation, collection, and presentation. This is further refined and summarized as a three-stage model: pre-focus (initiation, selection, and exploration), focus formulation (formulation), and post-formulation (collection and presentation). Huurdeman concludes with an analysis of each of these stages, stating that “information sought for evolves during different stages”. Specifically, Huurdeman describes how users in the pre-focus stage concentrate on conceptualizing their topic using search tactics like browsing, querying, and deciding on search models. Next, the focus formulation stage investigates the broad concepts that are being searched. Finally, during the post-focus stage, users are concerned with searching for specific information, increasing from low specificity (high-level assessments of relevance) to high specificity (low-level assessments of relevance). For our purposes, we can use the above-mentioned analysis to break down the information search and triage tasks into four stages: query building, search, high-level triage, and low-level triage (see Table 2).
Progressive disclosure is a technique for organizing and managing the visual space of an interface. When implementing the technique, designers abstract and sequence the stages of a complex task. Afterward, views can be generated with information encodings and controls to promote the performance of each individual stage. Views can be placed in sequence in the visual space, with controls to direct their activation. This enables unnecessary interface elements, reflecting past and future stages, to be minimized while still maintaining the transparency of other relevant stages [54]. The goal of progressive disclosure is to minimize user distraction, allowing them to concentrate on the critical decisions of the task at hand [55]. When designed well, the technique can effectively support users to perceive, plan, and navigate complex, multi-stage tasks [16].
Early research on progressive disclosure insisted on full occlusion of future stages. The belief was that in cases when future stages do not directly support a current, active stage, they should be fully concealed and only be accessible by request [55]. However, recent research suggests otherwise. Specifically, user studies [54] have compared full occlusion strategies with strategies that do not fully occlude future stages. These studies find that the former strategies distract users, lack information transparency, and reduce user opportunity for feedback. This suggests that effective progressive disclosure strategies should maintain balanced transparency between performances of previous stages and the impact of the current stage on future stages.
An example of a progressively disclosed interface is WebMD’s Symptom Checker. This interface used by the general public supports the task of health diagnosis—a complex, multi-stage task. In particular, WebMD’s Symptom Checker’s implementation provides hints for how current task decisions may impact the performance of future stages within the diagnosis sequence. In this example, a progressive disclosure implementation of a task, users are guided along with a series of query building opportunities, inputting symptoms, and personal health criteria (see Figure 1).
Next, we review research on the individual stages of information search and triage.

3.2.2. Stages of Query Building and Search

When searching for information in the document sets of unfamiliar domains, users generally possess some level of knowledge deficiency. This makes it difficult to formulate and communicate their problem, a challenge that users must overcome. According to Harvey et al. [14], this is because users consistently suffer from four major issues during the search:
  • Difficulty understanding the domain being searched.
  • Inability to apply domain expertise.
  • Inability to accurately formulate queries matching information-seeking objectives.
  • Deficiency assessing and determining if search results satisfy objectives or if adjustments are required.
We now explore these in more depth.
While searching information, users must learn about the searched domain, understand how their information-seeking objectives align, and formulate how to communicate their knowledge in a way that can be understood by computational tools. Thus, designers must provide users with the opportunity to understand the explored document set. Huurdeman [15] highlights that search interface designers must consider, both novices and experts. Yet, studies by Harvey et al. [14] show that in domains with complex vocabularies (e.g., health and medicine), the disparity of prior domain knowledge in potential users is extreme—that is, users routinely do not possess enough domain knowledge to satisfy their information-seeking needs. This can cause significant problems during query formulation for both domain experts and non-expert users. As a result, non-expert users must first step away from their tool to learn to express their knowledge using specialized domain vocabulary before they can begin query building. Both Soldaini and Anderson [56,57] note that even experts can be negatively affected by this challenge. This is because they must often make assumptions regarding the appropriateness and specificity of their information-seeking communications and/or inputs to the tool.
Another commonly cited challenge for users is their inability to perceive how their query decisions impact, relate, and interact with the document set being searched. This is a particularly important consideration for users who want and need to adjust their previously communicated query to better align with their information-seeking objectives. Huurdeman [15] describes potential strategies to address these concerns, prescribing the use of query corrections, autocomplete, and suggestions. Yet, these strategies can be ineffective if they do not allow users to be cognizant of how their query-making decisions achieve the results that they seek.
Seha et al. [58] examine considerations for designing ontology-supported information retrieval systems. They suggest that natural-language interfaces to information sources provide novice users with a pathway to avoid complex tool-dependent query languages. They highlight the benefit of shifting the vocabulary of query building away from the tool and towards the semantics of the domain being searched. Munir et al. [59] summarize the benefits of computational strategies that integrate ontologies into information retrieval systems for tasks involving both information search and triage. They state that ontology-supported information retrieval can be an advantageous strategy for supporting domain-specific over tool-specific vocabulary. This is due to their better and more effective human–computer communication. Using the medical domain as a context, Soldaini et al. [48] investigate the use of novel, ontology-supported query computation strategies in improving the quality of literature retrieval during search tasks. They apply combinations of algorithms, vocabularies, and feature weights to assess the computational performance of different query-reformulation techniques. Their findings suggest that the utilization of bridged vocabularies within ML components improves retrieval performance.
In a systematic review of search interfaces that have ML components, Amershi et al. [60] compile a set of principles that must be taken into consideration:
  • Users are people, not oracles.
  • Users should not be expected to repeatedly answer if ML results are right or wrong without an opportunity to explore and understand the results.
  • Users tend to give more positive than negative feedback to interactive ML.
  • Users need a demonstration of the behavior of ML components.
  • Users value transparency in ML components of tools, as transparency helps users provide better labels to ML components.
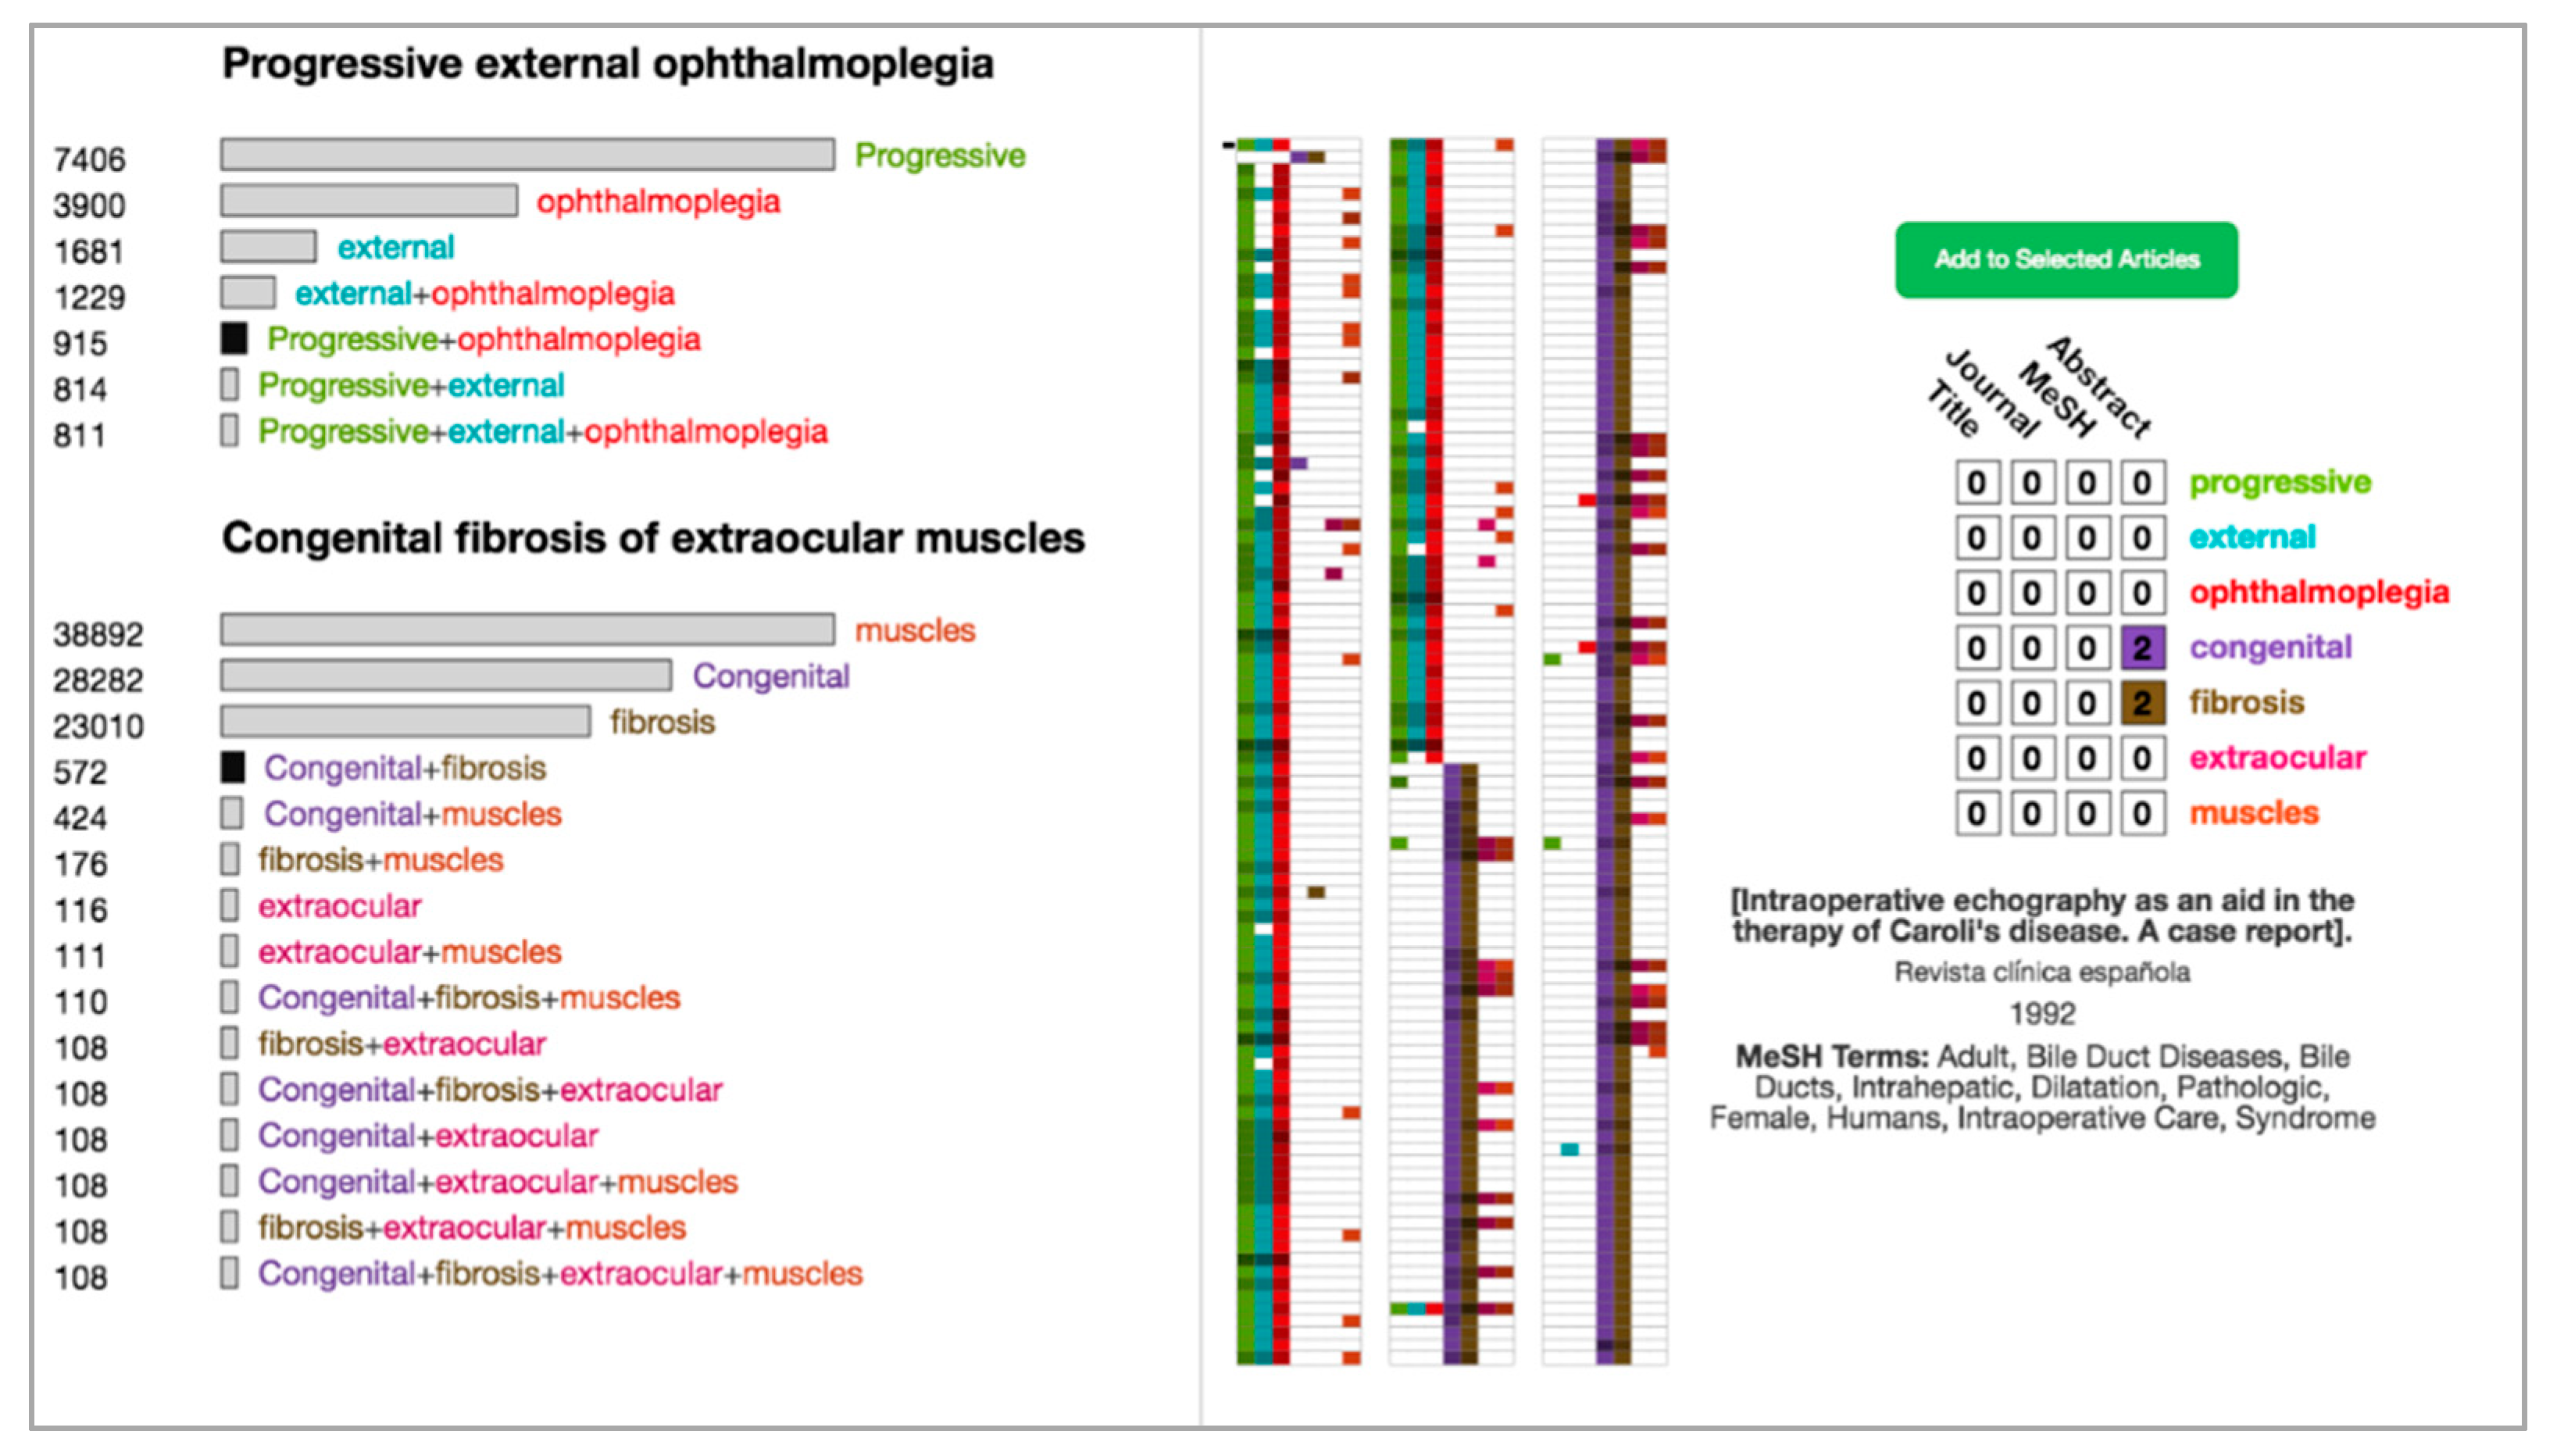
The application of sensitivity encoding within human-facing interface design can also be of benefit to users when searching and triaging [61]. Sensitivity encoding is a design strategy to provide a visual preview of possible results if particular actions are taken [62]. Within query building interfaces with sensitivity encoding, a visual interface can provide the number of current query search results against ones with minor adjustments. In such cases, users can relax one query item, thereby changing the size of the result set. By providing such meaningful context cues, sensitivity encoding can guide query building and search formulation, hence enhancing the perceived value of the search results, particularly when used in combination with techniques like progressive disclosure [63,64]. An example of sensitivity encoding in a search and triage tool interface is OVERT-MED [7]. This tool uses sensitivity encoding to provide alignment cues within its query generator between the expressed vocabulary and the search space. A screen capture of OVERT-MED is shown in Figure 2 with the result of users comparing the queries of “Progressive + ophthalmoplegia” and “congenital + fibrosis”.

3.2.3. Stages of High-Level and Low-Level Triage

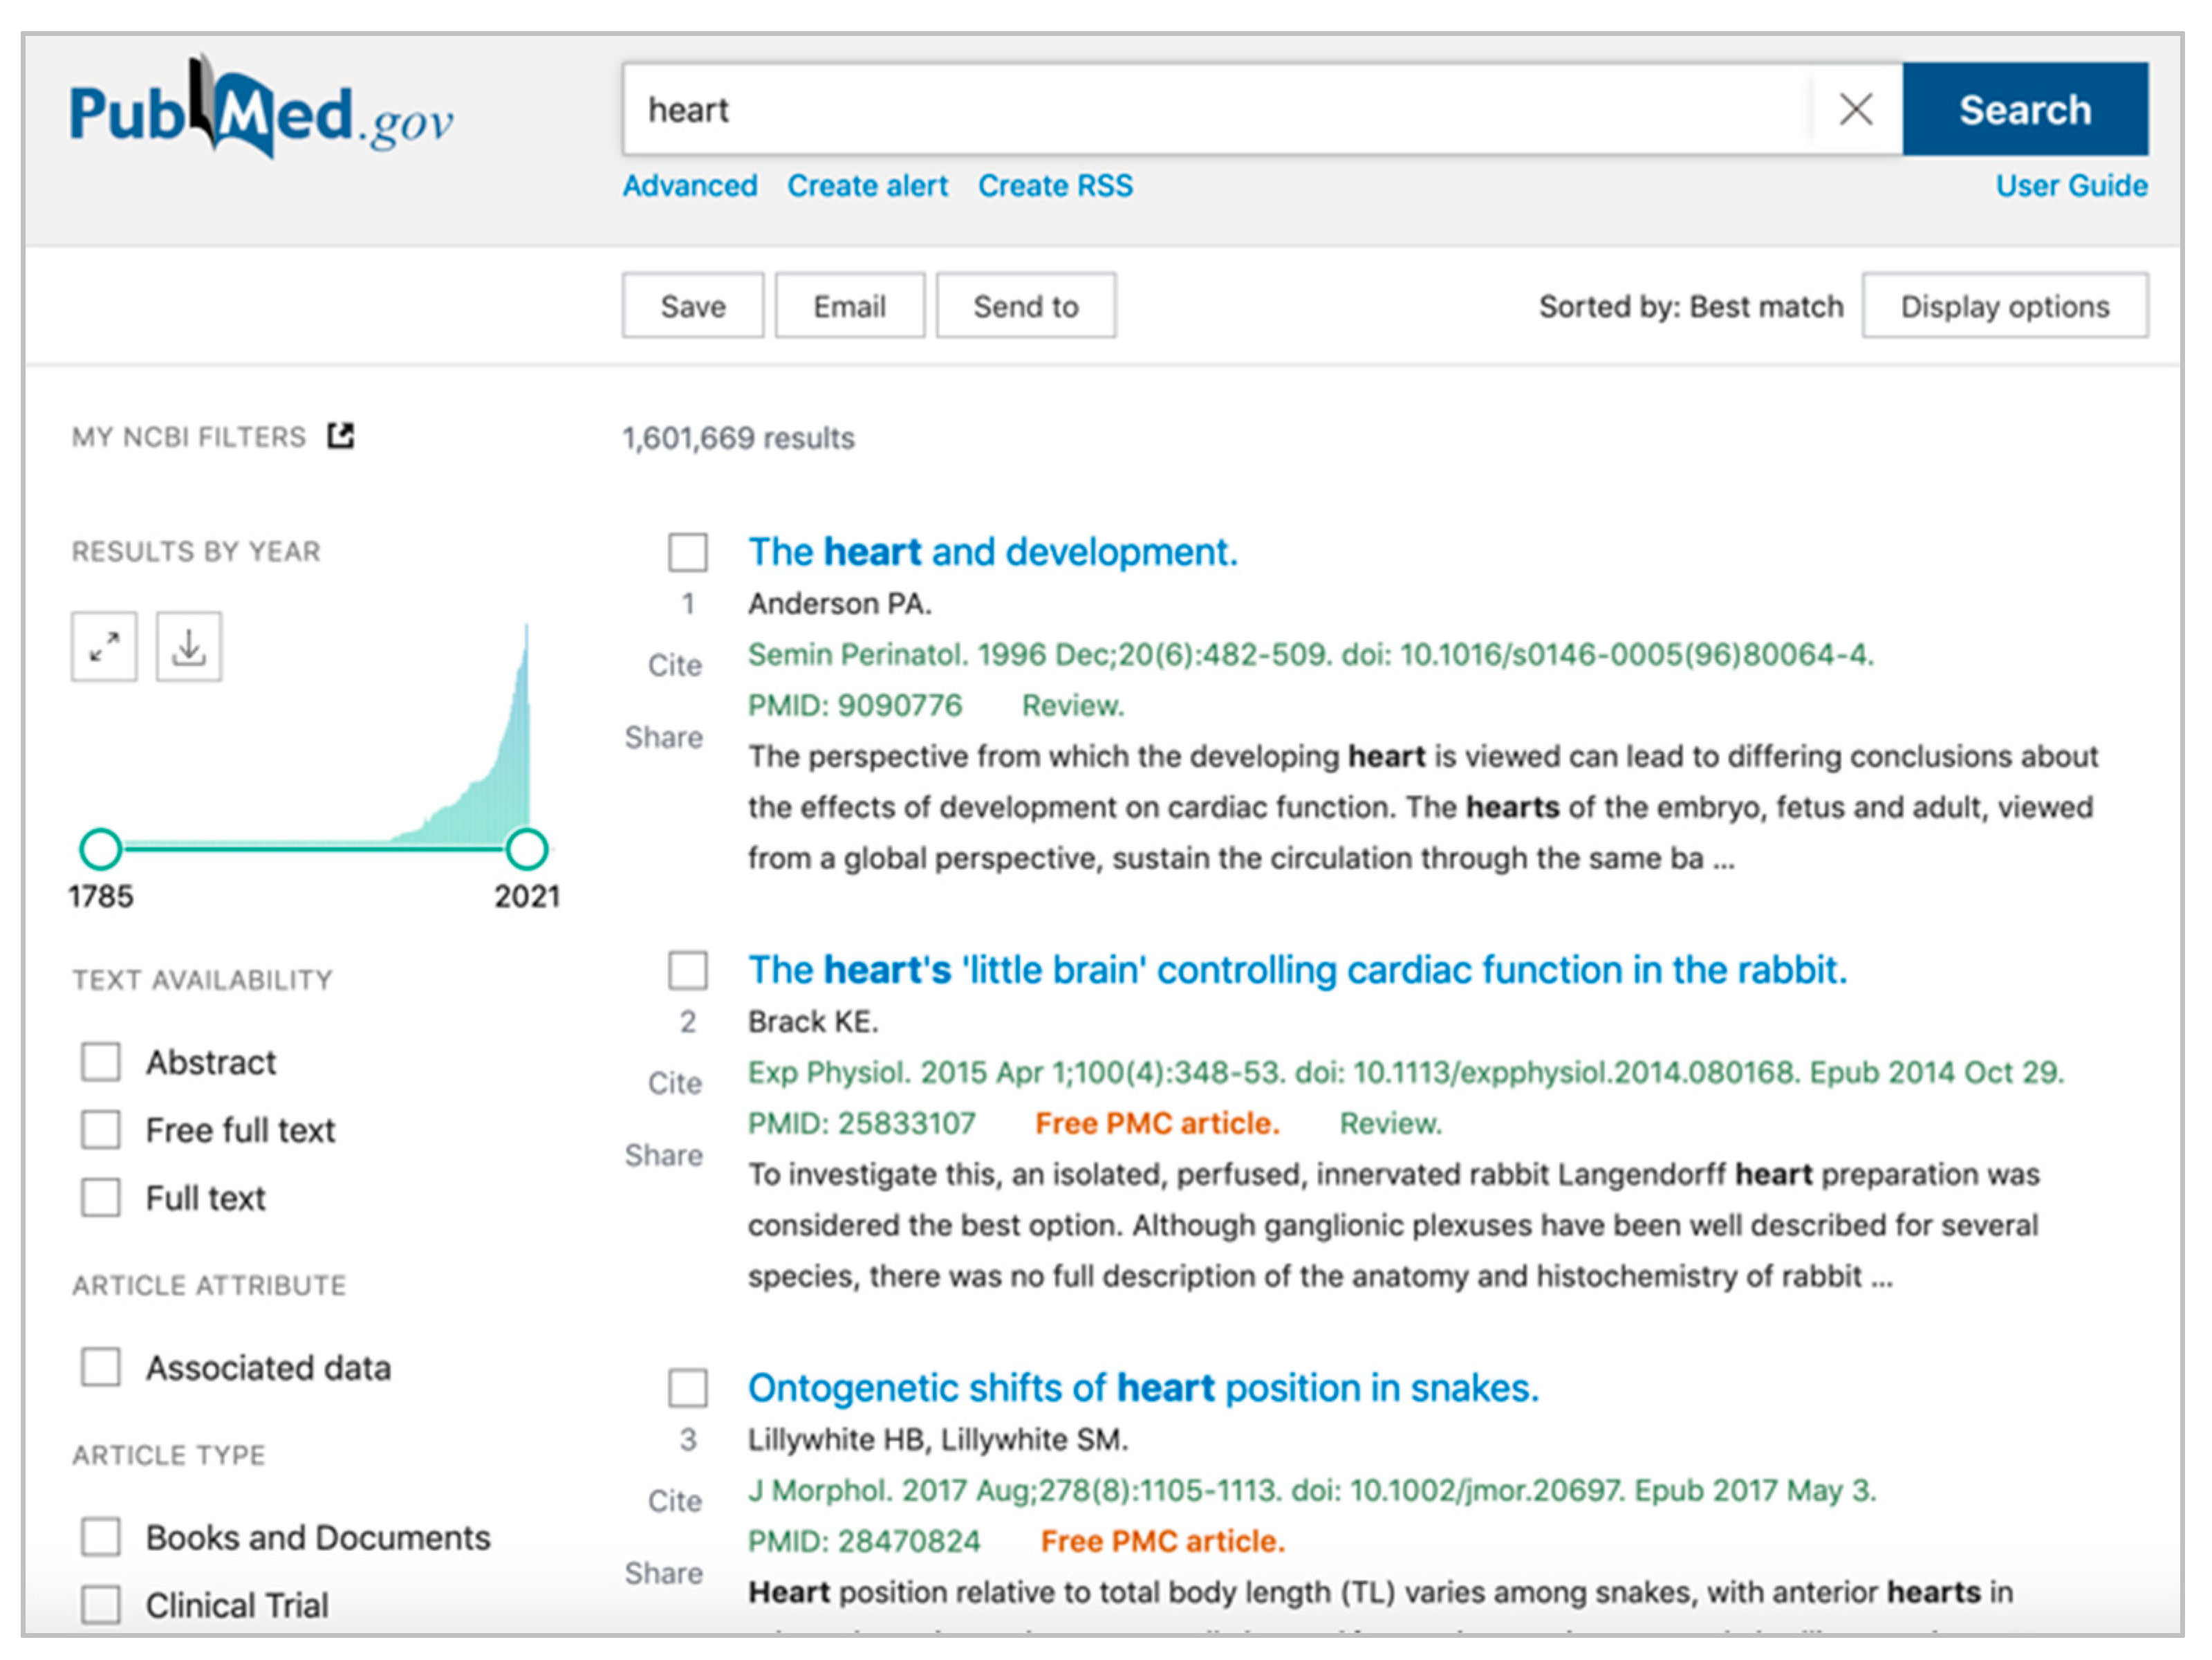
When performing information search on large document sets, the result set can remain large and overwhelming, even after significant refinement efforts by users during query building. To make the result set smaller and more manageable, information triage is often a necessary extra step in the information-seeking process. Research by Azzopardi et al. [65] indicates that the prevailing design language for triage interfaces provides users with linear inspection of long lists of documents. That is, traditional triage interfaces present document search results as ordered sets of individual documents. However, this type of interface presentation has been found to significantly hamper both efficiency and effectiveness of making relevant decisions using the result sets and does not scale for tasks with large document sets [24]. Poorly designed interfaces typically attempt to hide their scaling weaknesses by paging away large percentages of their results, implementing smooth scrolling interactions, or worse, by showing only the first result in an attempt to avoid triaging altogether. Yet, tools cannot ignore information triage, as it is critical in helping users assess the quality of search results [26]. An example of a tool that forces a linear inspection of document results within a paged system is PubMed (see Figure 3 for a scenario where a search is performed on the MEDLINE document set for “heart”. This provides a linear triaging interface of over 1.5 million results spread over 100,000 pages within a ten-per-page system).
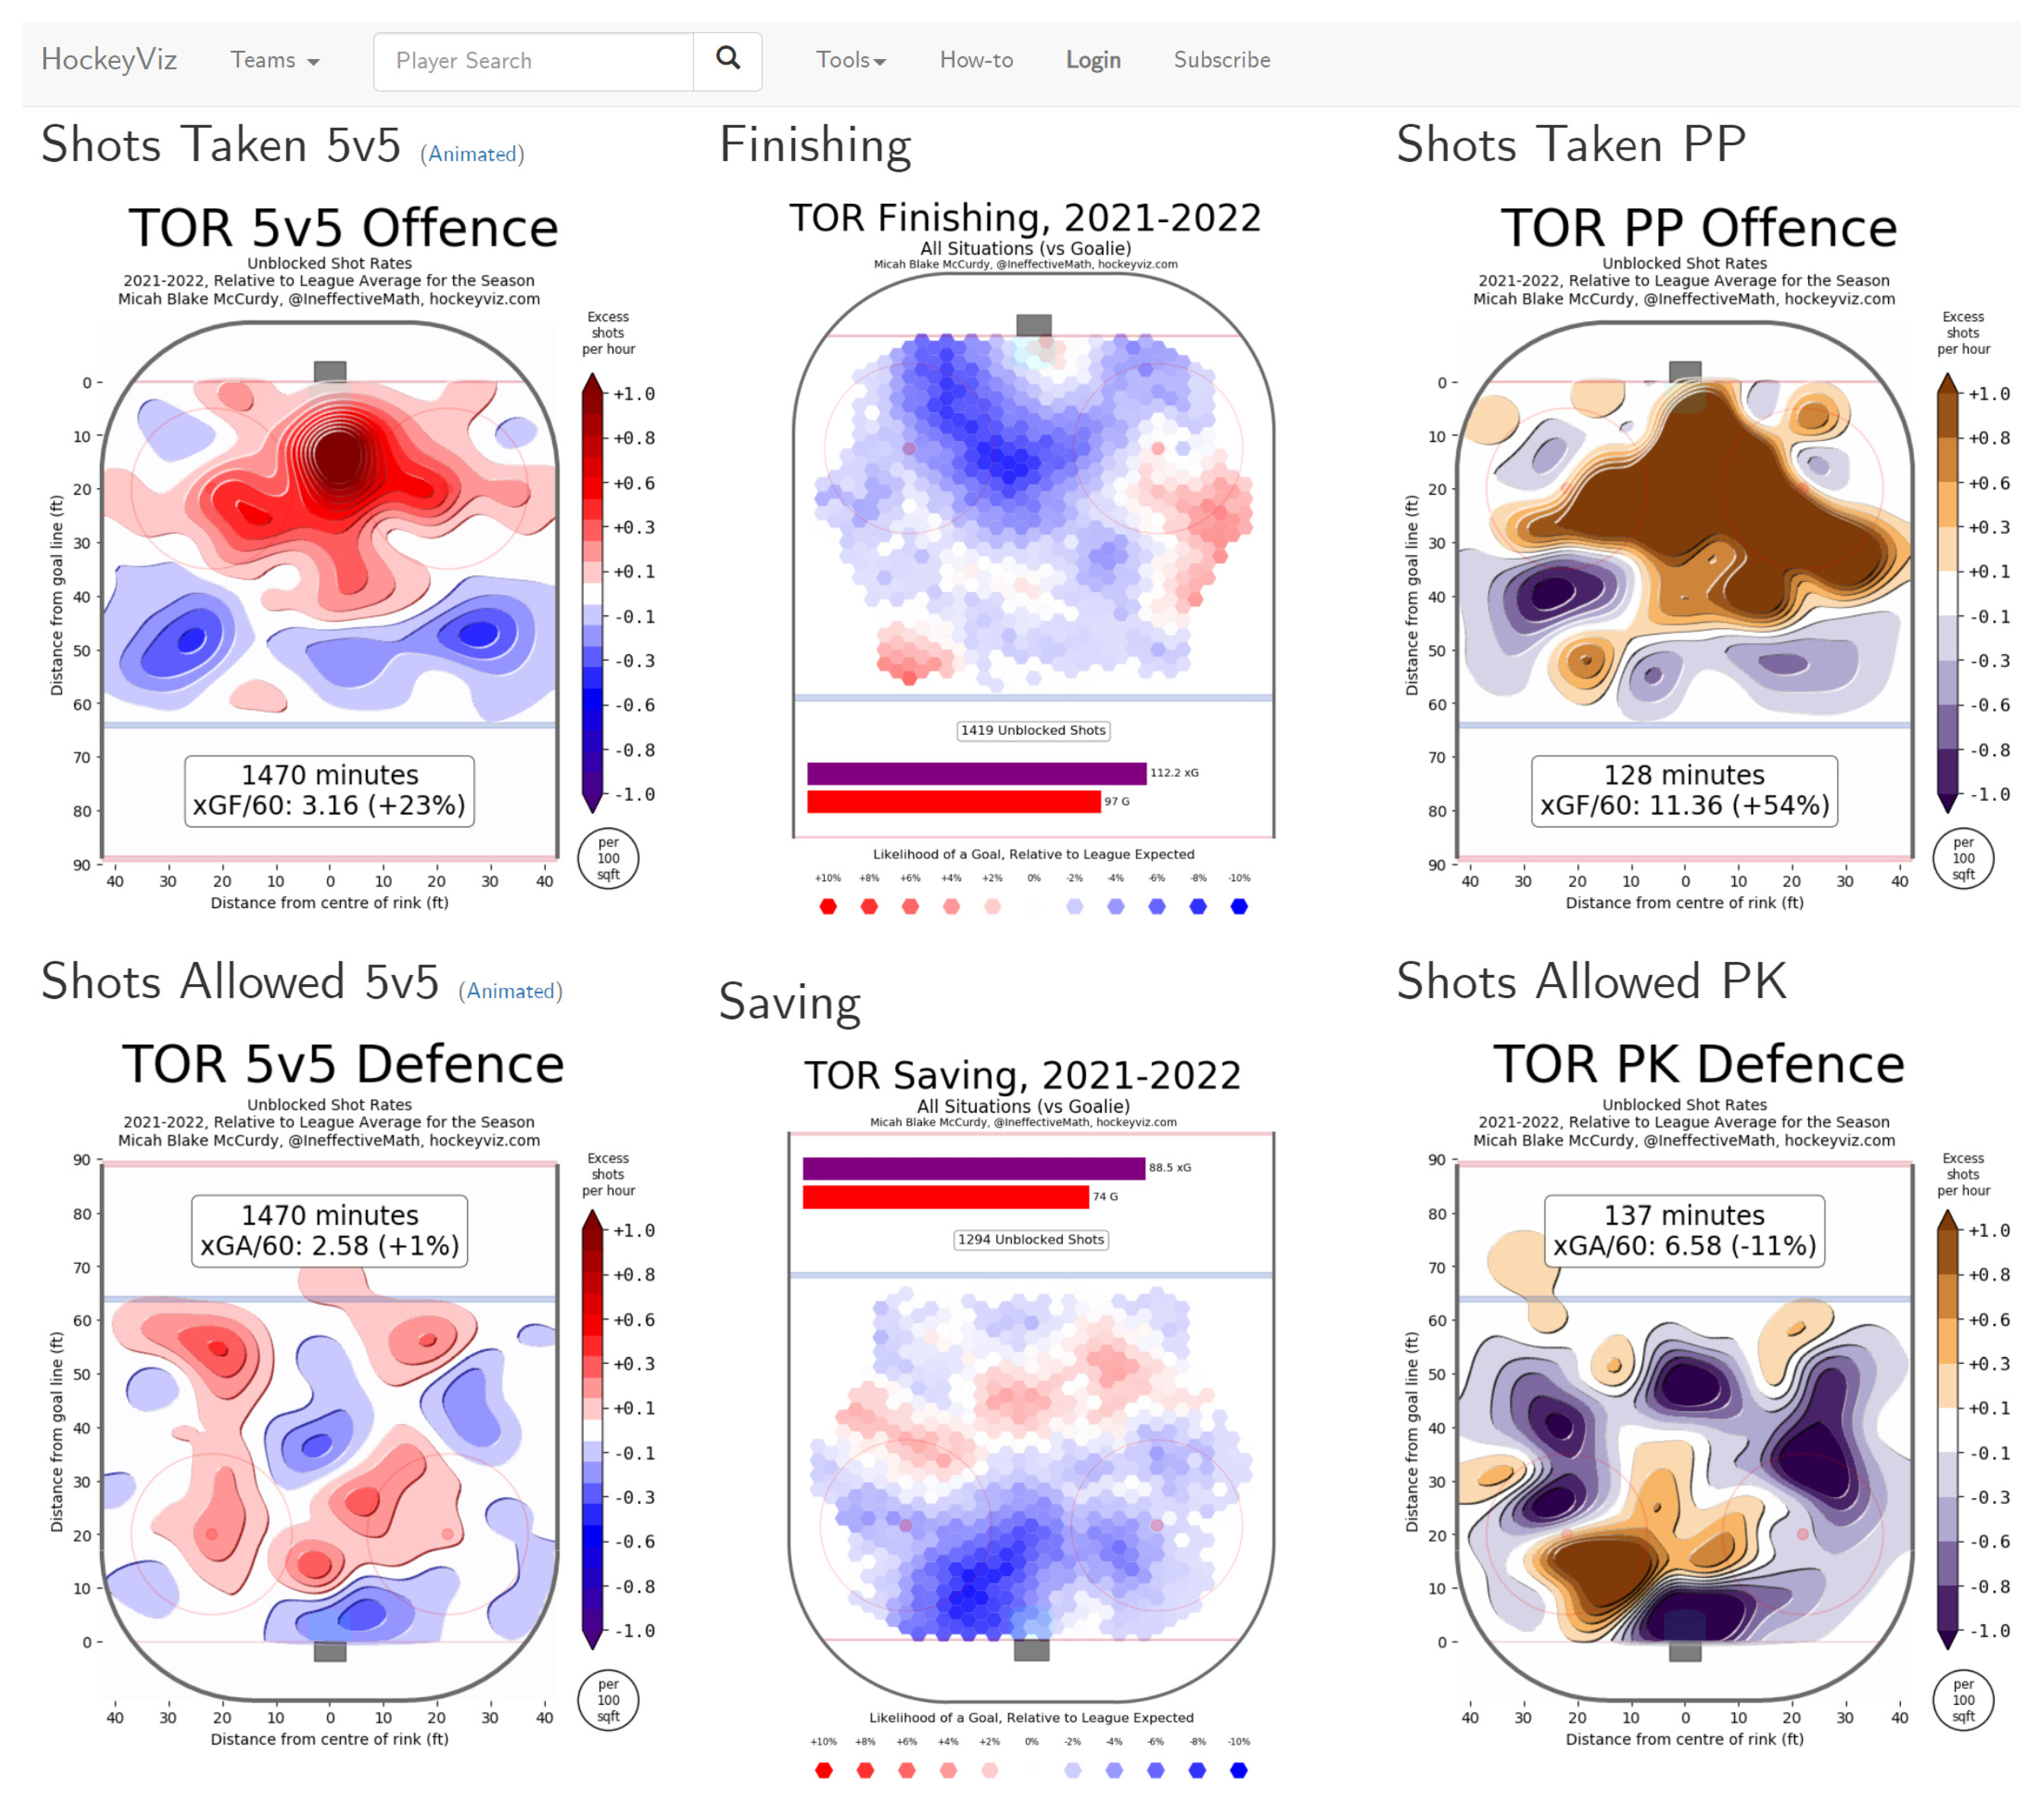
When designing information triage interfaces that provide non-linear inspection flows, the two primary concerns for designers are how best to represent documents to users and how users can interact with those documents to further their information-seeking objectives. Critically, designers must re-approach triaging as a part of the multi-stage information-seeking process. In this regard, Chandrasegaran et al. [66] describe the value of high-level triage of full document sets prior to individual document inspection. Specifically, they suggest that designers should avoid having users open individual documents in full initially and instead create visual abstractions which provide an overview display of all documents for high-level relevance assessment. Anderson [57] agrees with this, stating that ideal high-level triage strategies should abstract out shared characteristics to structure groupings of comparable documents. Users can be provided interactions that allow them to simultaneously traverse, preview, contrast, and judge relevance for groupings of documents at a time, rather than individually. Figure 4 shows the HockeyViz Team Assessment interface for non-linear triaging team performance within the NHL. This is different from a traditional linear approach, where statistical data is ordered in a listed fashion. This example shows how the high-level triage stage of information-seeking task can be supported using a visual interface.
After high-level triaging, users should be able to perform low-level triaging—that is, assess the contents of document groupings at the individual document level. For low-level triaging, Huurdeman et al. [22] suggest that users should be aided by displays that allow them to save, annotate, and/or provide other personalized interactions. Other useful strategies include displaying document metadata, titles, and short snippets of result sets [15]. Oftentimes, traditional interfaces do not provide scaffolding supports that help users make distinctions between the high-level and low-level triage stages. Huurdeman [15] states that interfaces use one of three strategies when displaying search results:
  • Underload documents: little to no content of each document is displayed, making it difficult to compare documents.
  • Overload documents: too much of each document is displayed, making it difficult to rapidly understand each document.
  • Distort documents: a summarization, weighting, or filtering strategy is used to either demote or promote certain document attributes, providing different tradeoffs: making some attributes easier to perceive, creating poor decontextualized generalizations, hiding away value, and sometimes promoting harmful attributes.
The design of low-level triage interfaces can be challenging. Namely, designers must consider the characteristics of the information to be represented, the knowledge domain of users, the task to be performed, and the interactions that can effectively support the former [26,28,67]. When designing document displays, it is important that any summarization, weighting, and filtering techniques highlight attributes that best assist in the application of domain expertise for relevance judgement. For this, both Loizides and Mavri [68,69] suggest some best-practice design strategies. They note that factors such as section types, content positioning, font weight, and font size, among other factors, influence final document relevance decision-making. Furthermore, document titles, captions, abstracts, section snippets, conclusions, and a decreasing valuation for document pages are the most important factors that affect decision-making regarding relevance of documents [69,70]. Simply put, an interface that supports effective document triaging should maximize and highlight important content and minimize elements that do not support rapid decision making.

3.3. Design Criteria

Using the task-analysis review in the previous section, we distill the following set of design criteria, presented in Table 3.

4. Materials

In this section, we describe VisualQUEST, an ontology-supported and progressively disclosed VAT interface created to demonstrate the utility of the design criteria that support searching and triaging of large document sets. Next, we describe the technical scope and functional workflow of VisualQUEST.

4.1. Technical Scope

VisualQUEST is a web-based generalized plug-and-play interface with user-provided ontology files and document sets. VisualQUEST provides cross-browser (Firefox, Chrome, Opera) and cross-platform support. VisualQUEST’s front-end views use HTML5, CSS, and JavaScript. D3.js JavaScript visualization library is used in VisualQUEST’s interactive displays [67]. A custom Python Flask-based server is used for data storage and ML computations. VisualQUEST also uses Apache’s Solr system as its indexer and search engine [71].

4.2. VisualQUEST Functional Workflow

VisualQUEST’s workflow encompasses several system and view components. The front-end interface of VisualQUEST maintains an accordion-like design that sequences view stages using the progressive disclosure technique (DC1). Only one VisualQUEST subview is active at a time, assigning it the majority of the visual interface. Following progressive disclosure best practices, inactive stages are not occluded. Instead, they are assigned reduced yet still present display space which highlights any task-relevant value generated within the stage.
We now describe the overall workflow of VisualQUEST and its parts. Figure 5 provides a depiction of the VisualQUEST workflow. Labeled arrows reflect transitional actions of systems and users. Users begin by uploading their ontology files and document sets (bottom center). These activate their respective Ontology and Document Process Systems (brown boxes), which prepare their content for back-end storage (blue boxes) and activation (pink boxes). Once achieved, the front-end interface activates its various subview functionalities (yellow boxes). The user can act upon the interface (green box). The system processes those actions, formulates adjustments to its display, and returns a visual response to be perceived by users. Sometimes, these adjustments must connect with back-end systems and ask computations to be performed, and the results of those computations are sent back to the display level.

4.3. Back-End Systems

VisualQUEST is supported by two servers that move heavy computation away from the browser: Analytics Server and Document Server.

4.3.1. Analytics Server

Analytics Server is built using the Python-based Flask framework. It is accessed through an API that offers two functionalities: (1) uploading user-provided document sets and (2) performing ML computations. Document sets are uploaded from users’ computer file system to Analytics Server. This server validates the type, format, size, and encoding of uploaded documents and then stores them into a temporary PostgreSQL database. This database is accessed by Document Server (a Solr server) during indexing procedures. Analytics Server can request Document Server to index all new documents. When users request ML computations during the search, Analytics Server assesses the selected algorithm, the document set, and the search formulation generated by users during query building and search. It then performs sanitization and query expansion. During this process, query items within the search formulation are expanded using user-provided ontology files and WordNet for synonym ring analysis. The search formulation in both its original and expanded form is packaged and applied within ML computations. The resulting clusters are propagated back to VisualQUEST. These ML computation services are facilitated by the Scikit-Learn library, which we do not express to be a part of the novel contributions in this research [72]. That is, we connect with existing ML toolsets to enable the required ML computation in support of our investigations of the design of visual interfaces for searching and triaging large document sets. We include the pseudocode describing this process (Algorithm 1).
Algorithm 1 Pseudocode of clustering functionality spanning the workflow of VisualQUEST (front-end), Analytics Server, and Document Server.
Input: A set Q of user inputted queries.
Output: Signal to update interface with cluster assignments
targets ← chain(Q).unique().difference(getStopWords())
documents ← getDocuments()

/* Prepare bag of words using target, related entities, and their generated WordNet synsets */

for i = 0 to targets.length do
         target = targets[i]
         targetCoverage ← target + target.getDirectlyRelatedEntities()
         targetSpread[target] ← targetCoverage + targetCoverage.getWordNetSynsets()
         targetSpread[target] ← targetSpread[target].unique().difference(getStopWords())

/* Gather counts from pre-indexed documents, then fit and
predict clusters using Scikit.Learn KMeans clustering */

documentCounts ← getIndexesFromSolrAPI(targetSpread, documents).scaleRange(0, 1)reducedPCA ← SciKitLearn.PCA(nComponents = 2).fit_transform(documentCounts)
kmeansPCA ← SciKitLearn.KMeans(init =’k-means++’, nClusters = 7, nInit = 10)
clusterAssignments ← kmeansPCA.fit_predict(reducedPCA)
for i = 0 to targets.length do
         target = targets[i]
         for j = 0 to clusterAssignments.length do
               cluster = clusterAssignments[j]
               yPred = cluster.yPred[target]
               /* Generate weighting scale using x5 multiplier */
               clusterAssignments[j].weighting[target] ← generateClusterWeighting(yPred)
return signalInterfaceUpdate(clusterAssignments)

4.3.2. Document Server

VisualQUEST’s Document Server is a cloud-based Solr server for indexing, storing, and serving documents from user-provided document sets. Solr is a prepackaged, scalable indexing solution developed by The Apache Software Foundation. It provides a valuable array of features like a REST-like API that support numerous HTTP-based communication interfaces. Solr also supports a wide range of customizable settings and schemas for storing, searching, filtering, analyzing, optimizing, and monitoring tasks [71]. During indexing procedures, Document Server uses a prepared schema to extract new documents from a temporary PostgreSQL database hosted by Solr. These documents are then treated and stored within an index. Document Server also handles document serving requests. When VisualQUEST is displaying documents, Document Server provides metadata such as titles, word counts, and content for document-level displays (See Apache’s official website and document for more information on Solr [71]).

4.4. Front-End Subviews

This section describes VisualQUEST’s subviews with reference to relevant design criteria (DC#) discussed before.

4.4.1. Query Building Subview

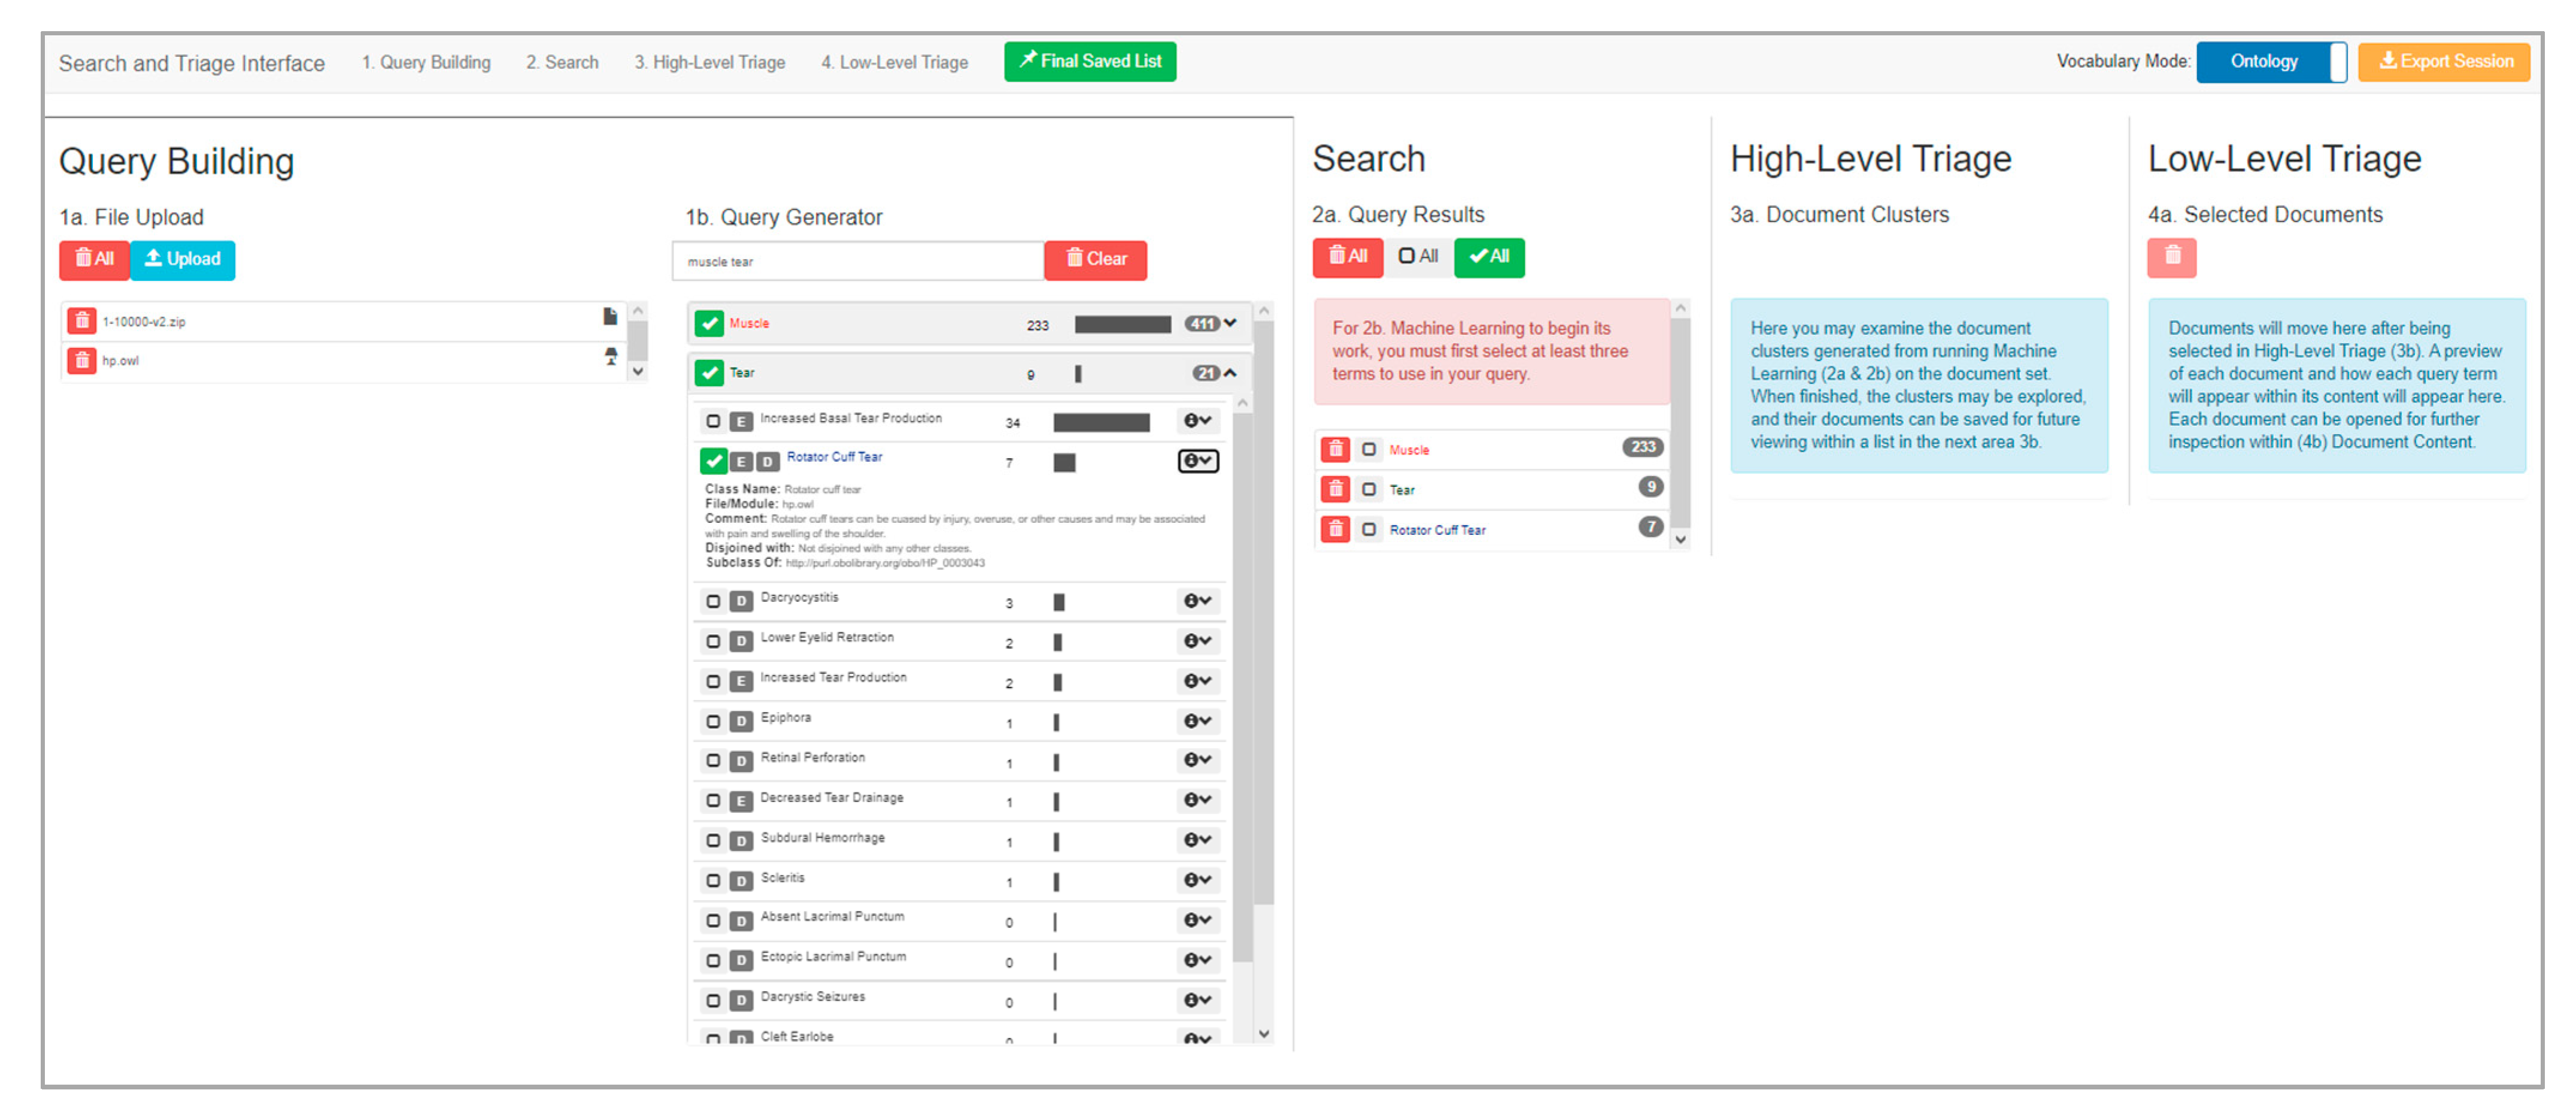
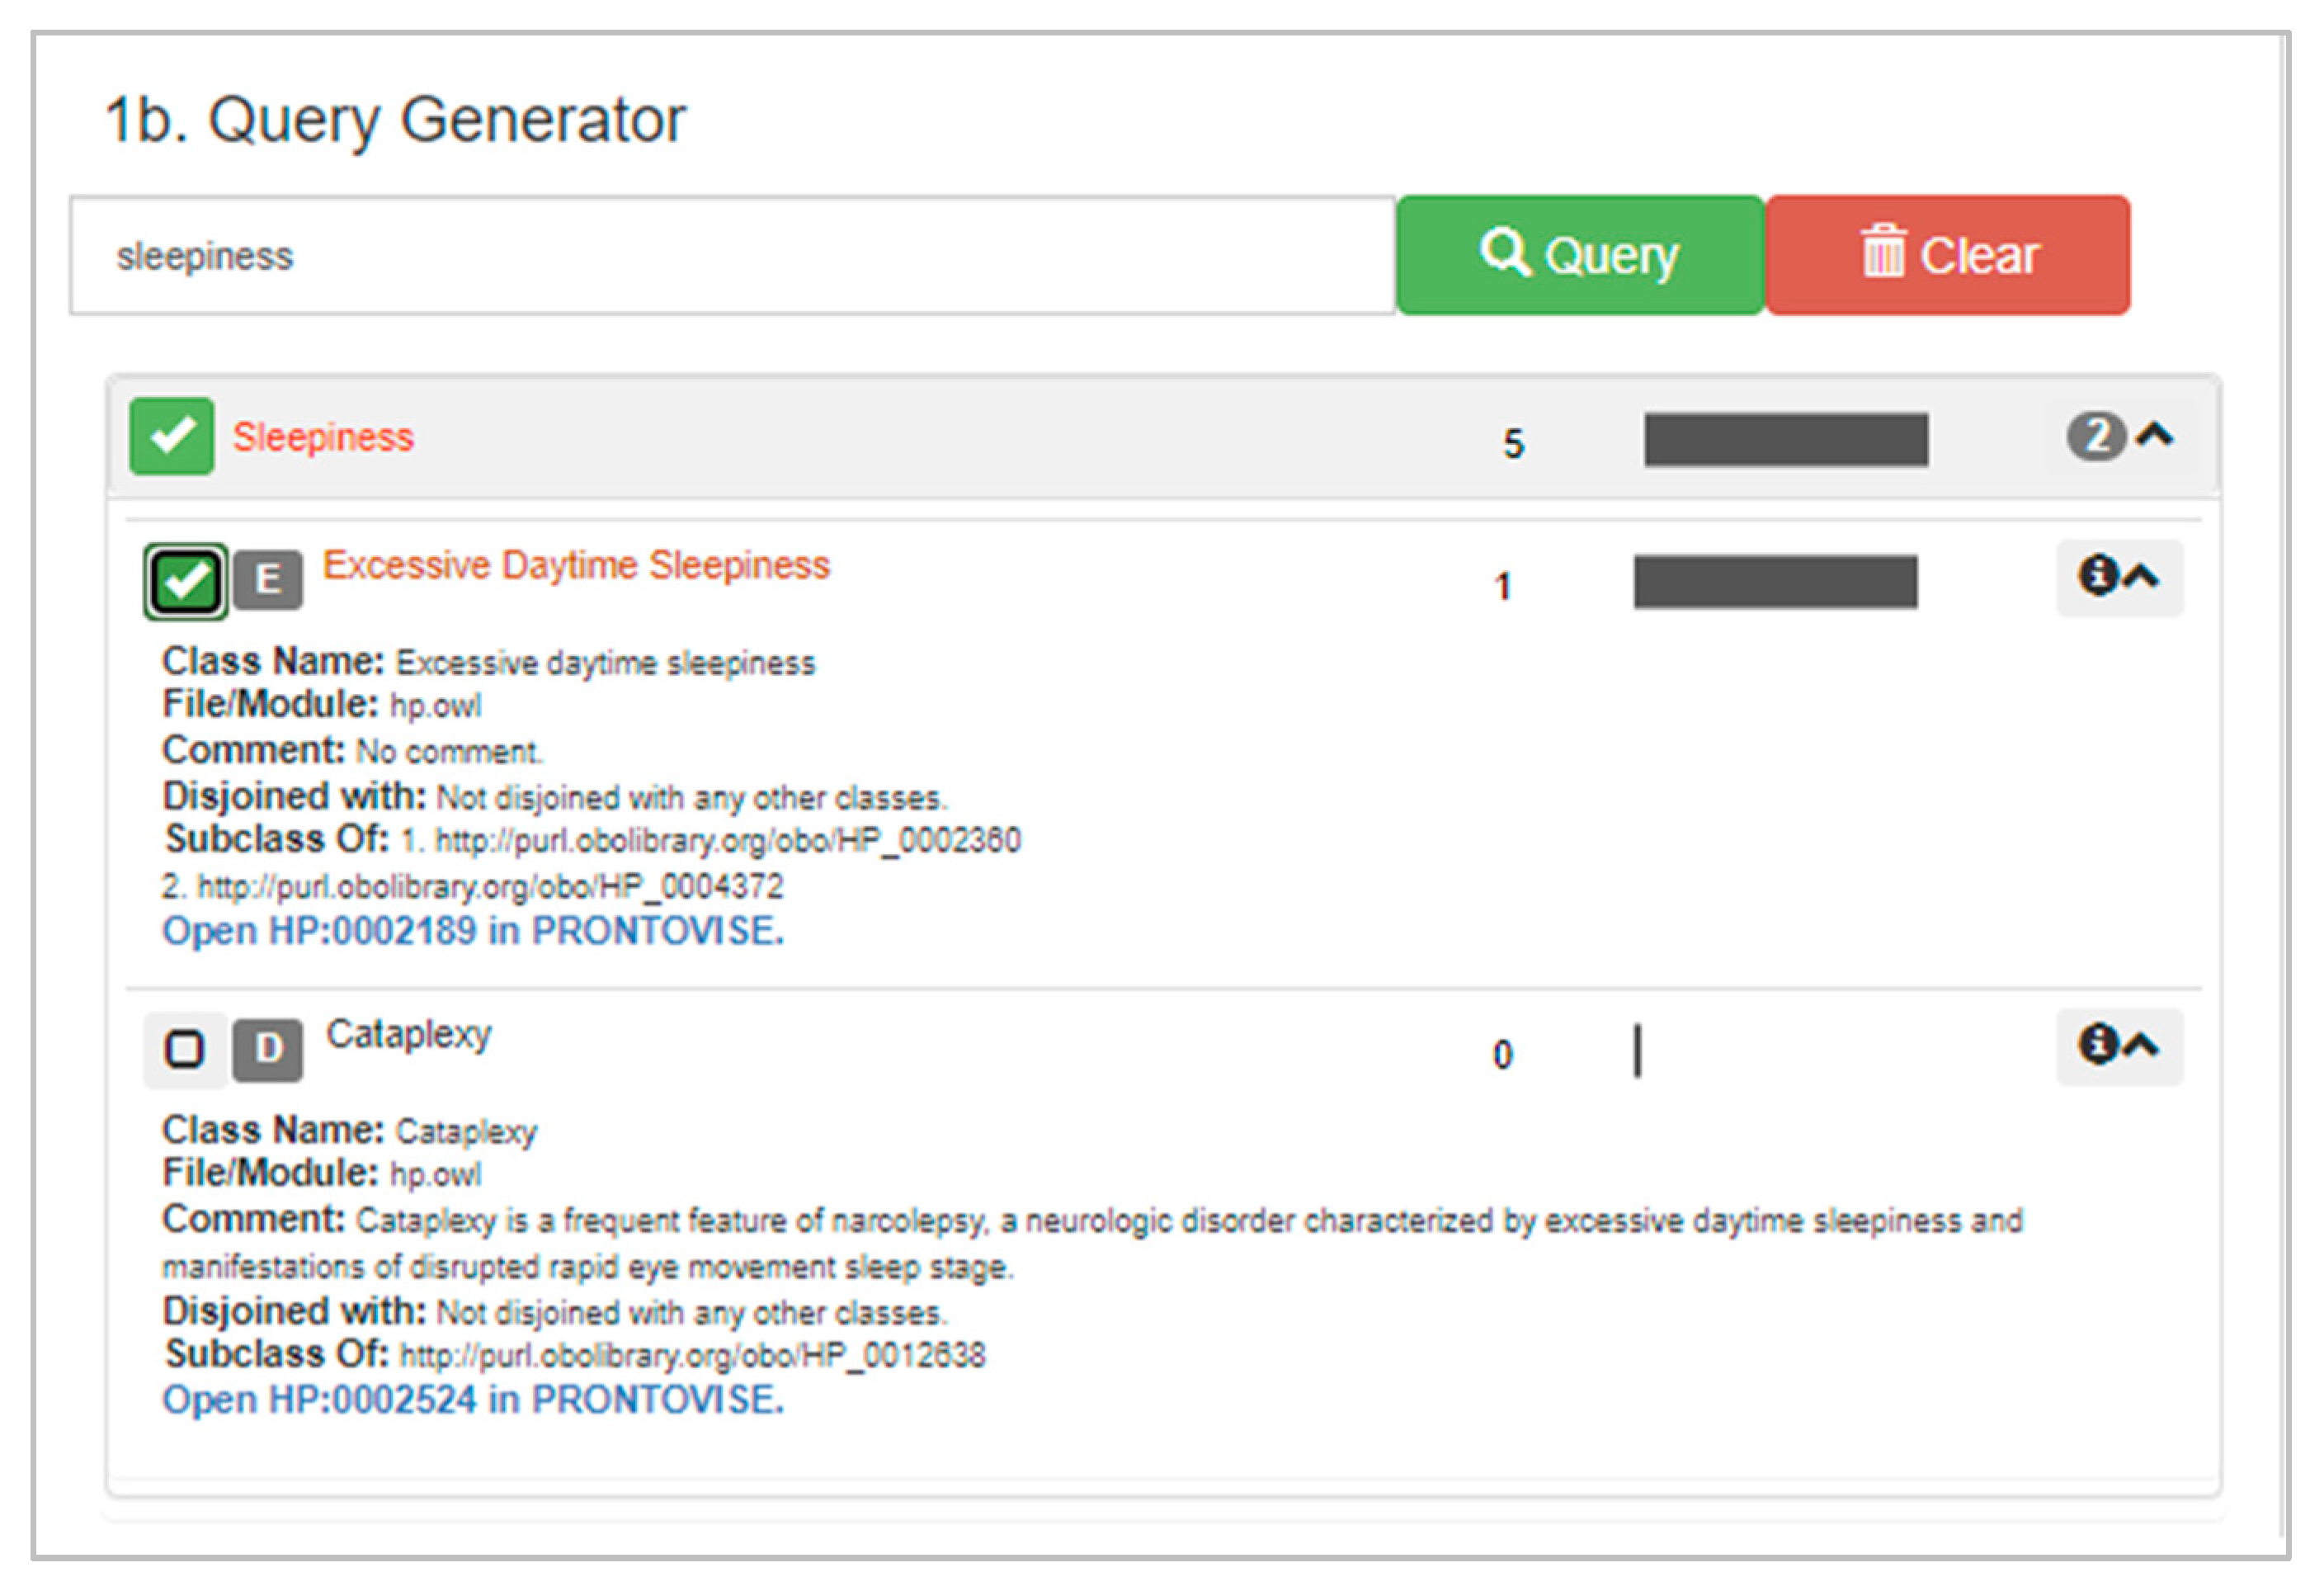
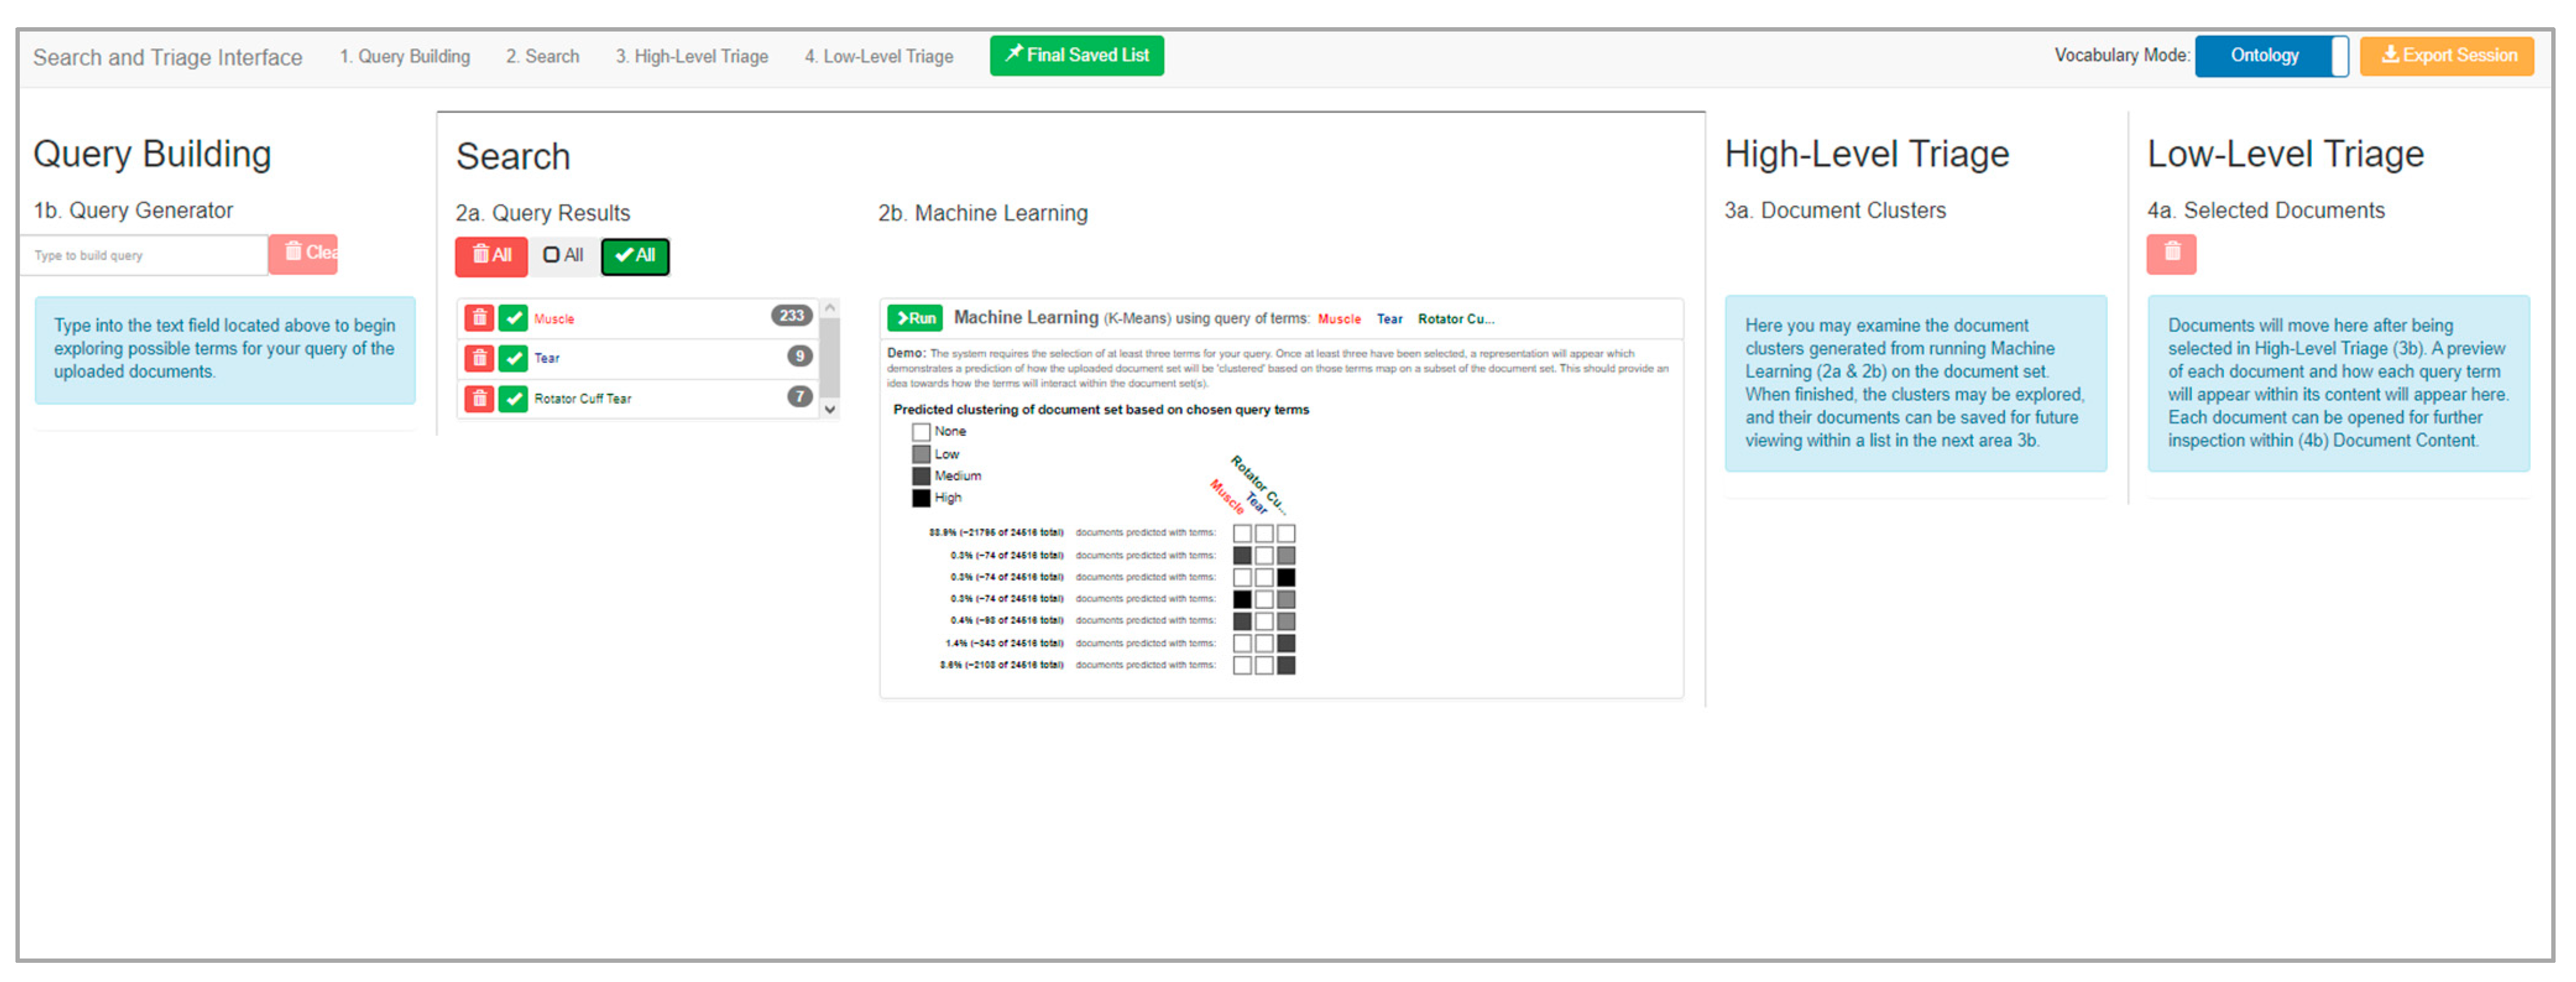
Query Building is the first subview within VisualQUEST (DC1). Figure 6 provides a depiction of an ontology and document set having been uploaded, from which a set of query items have been generated with a subset of those added in Search.
In this subview, two functions are performed: uploading user-provided files and query building. Upon clicking the upload button, users can select ontology files and document sets which are then inserted into a file management listing, accompanied by file name, type, and any available descriptions. Once a document set has been uploaded, users can begin query building by inputting text into a search bar. This leads to the generation of query items from all combinations of the inputted words (DC2). For instance, if a two-word input is provided, a query item is generated for each, as well as two-word query items in both possible orders (e.g., A, B, A B, B A). Each query item is accompanied by a count of its verbatim presence within the document set (DC10). Furthermore, VisualQUEST analyzes the alignment of query items with the entities, relations, and descriptions of user-provided ontology files. If a feature of the ontology is found to align with a query item, it is placed within a drop-down menu attached to the listing (DC3). In this menu, users are presented with ontology terms that are conceptually similar to that query item (Figure 7).
Encountering these terms, users can learn more about the domain vocabulary, appraise how their research problem may or may not align with their document set, and adjust their query item selections (DC2). Both direct-input and ontology-mediated query items can be saved and are assigned unique colors that are used throughout all subviews (DC11).

4.4.2. Search Subview

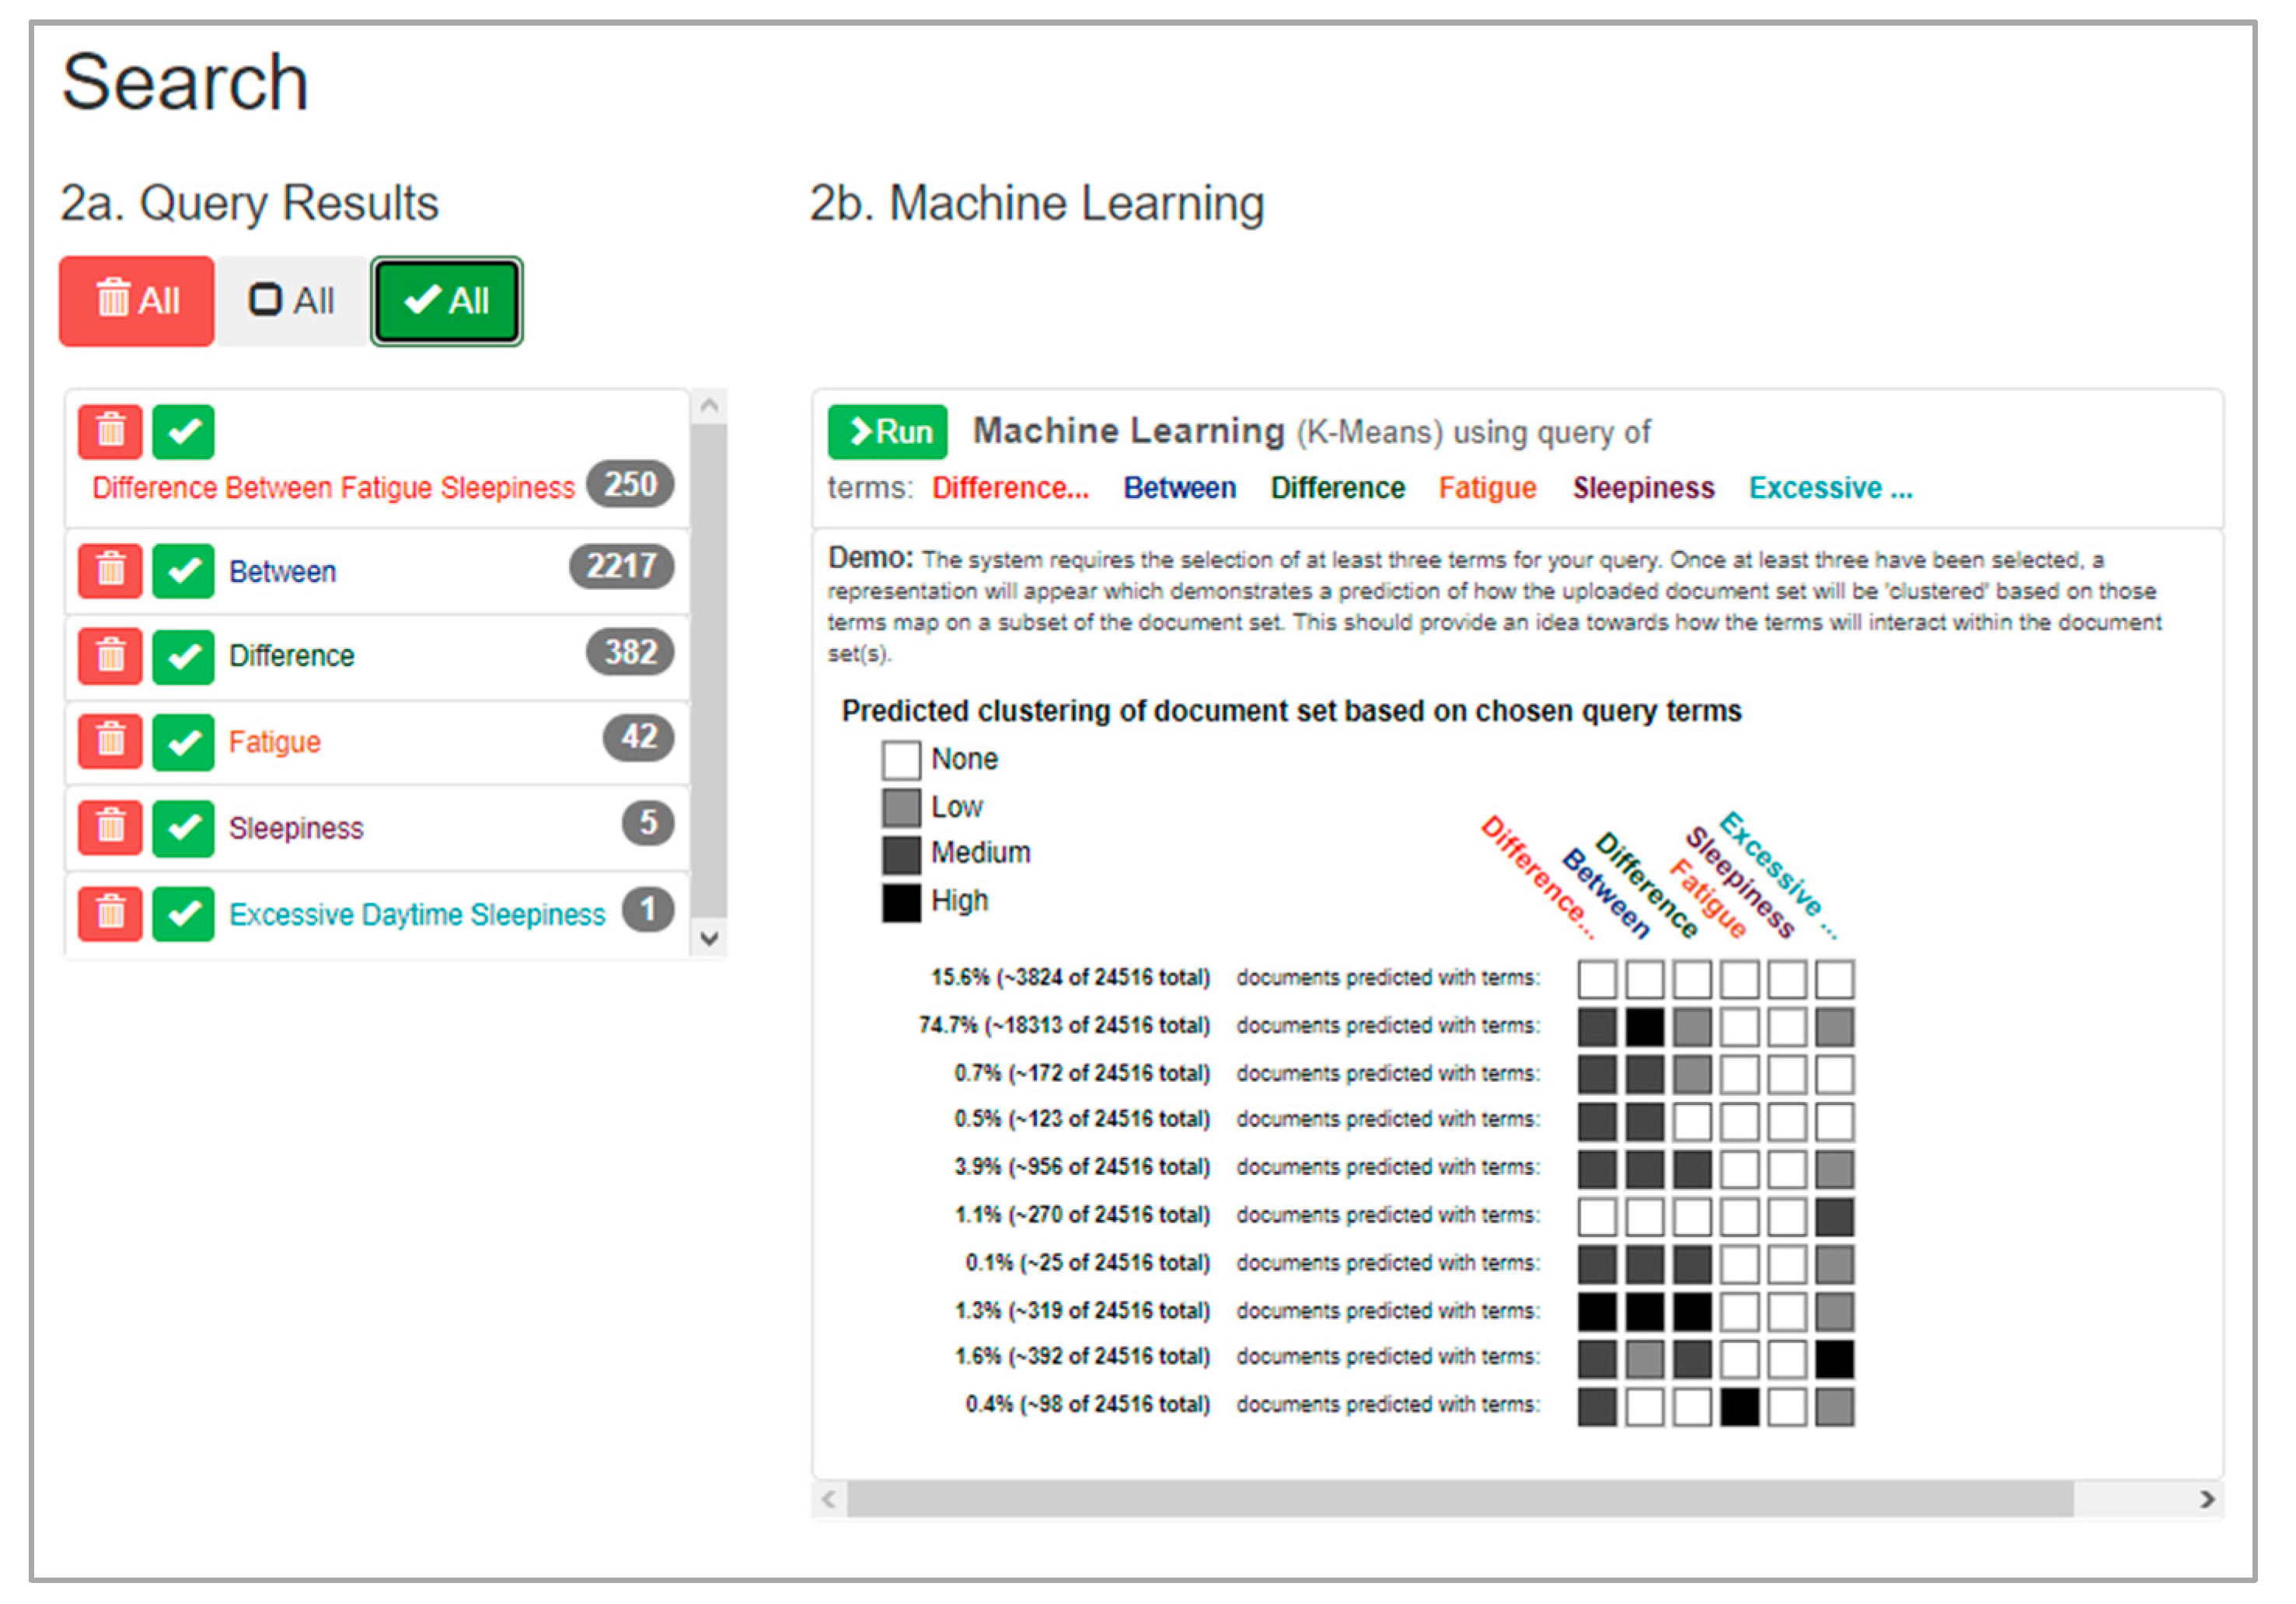
Search is the second subview within VisualQUEST (DC1). Figure 8 provides a depiction where prior query building has produced a set of query items; these have been inserted into the search formulation for preview.
In this subview, users can control the formulation of search queries, encounter sensitivity-encoded previews of the formulation, and initialize the search on the full document set (DC4). In the Search subview, a list allows users to manage query items, including insertion into the search formulation (DC11). After at least one query item has been selected, a preview of the current search formulation is activated (Figure 9).
This preview is a matrix-like heatmap display describing a cluster analysis of document groupings within the document set (DC5, DC10). By adding and removing query items from the search formulation, users can investigate: (1) how individual query items align with the document set, (2) how differing query item combinations change document grouping arrangements, and (3) estimate how many documents may be found in a full search. If not satisfied, users can refine their formulation using existing query items or generate new query items within Query Building (DC4, DC10). Finally, users can initialize a full search, with the results of ML computations sent to the triage stages (DC11).

4.4.3. High-Level Triage Subview

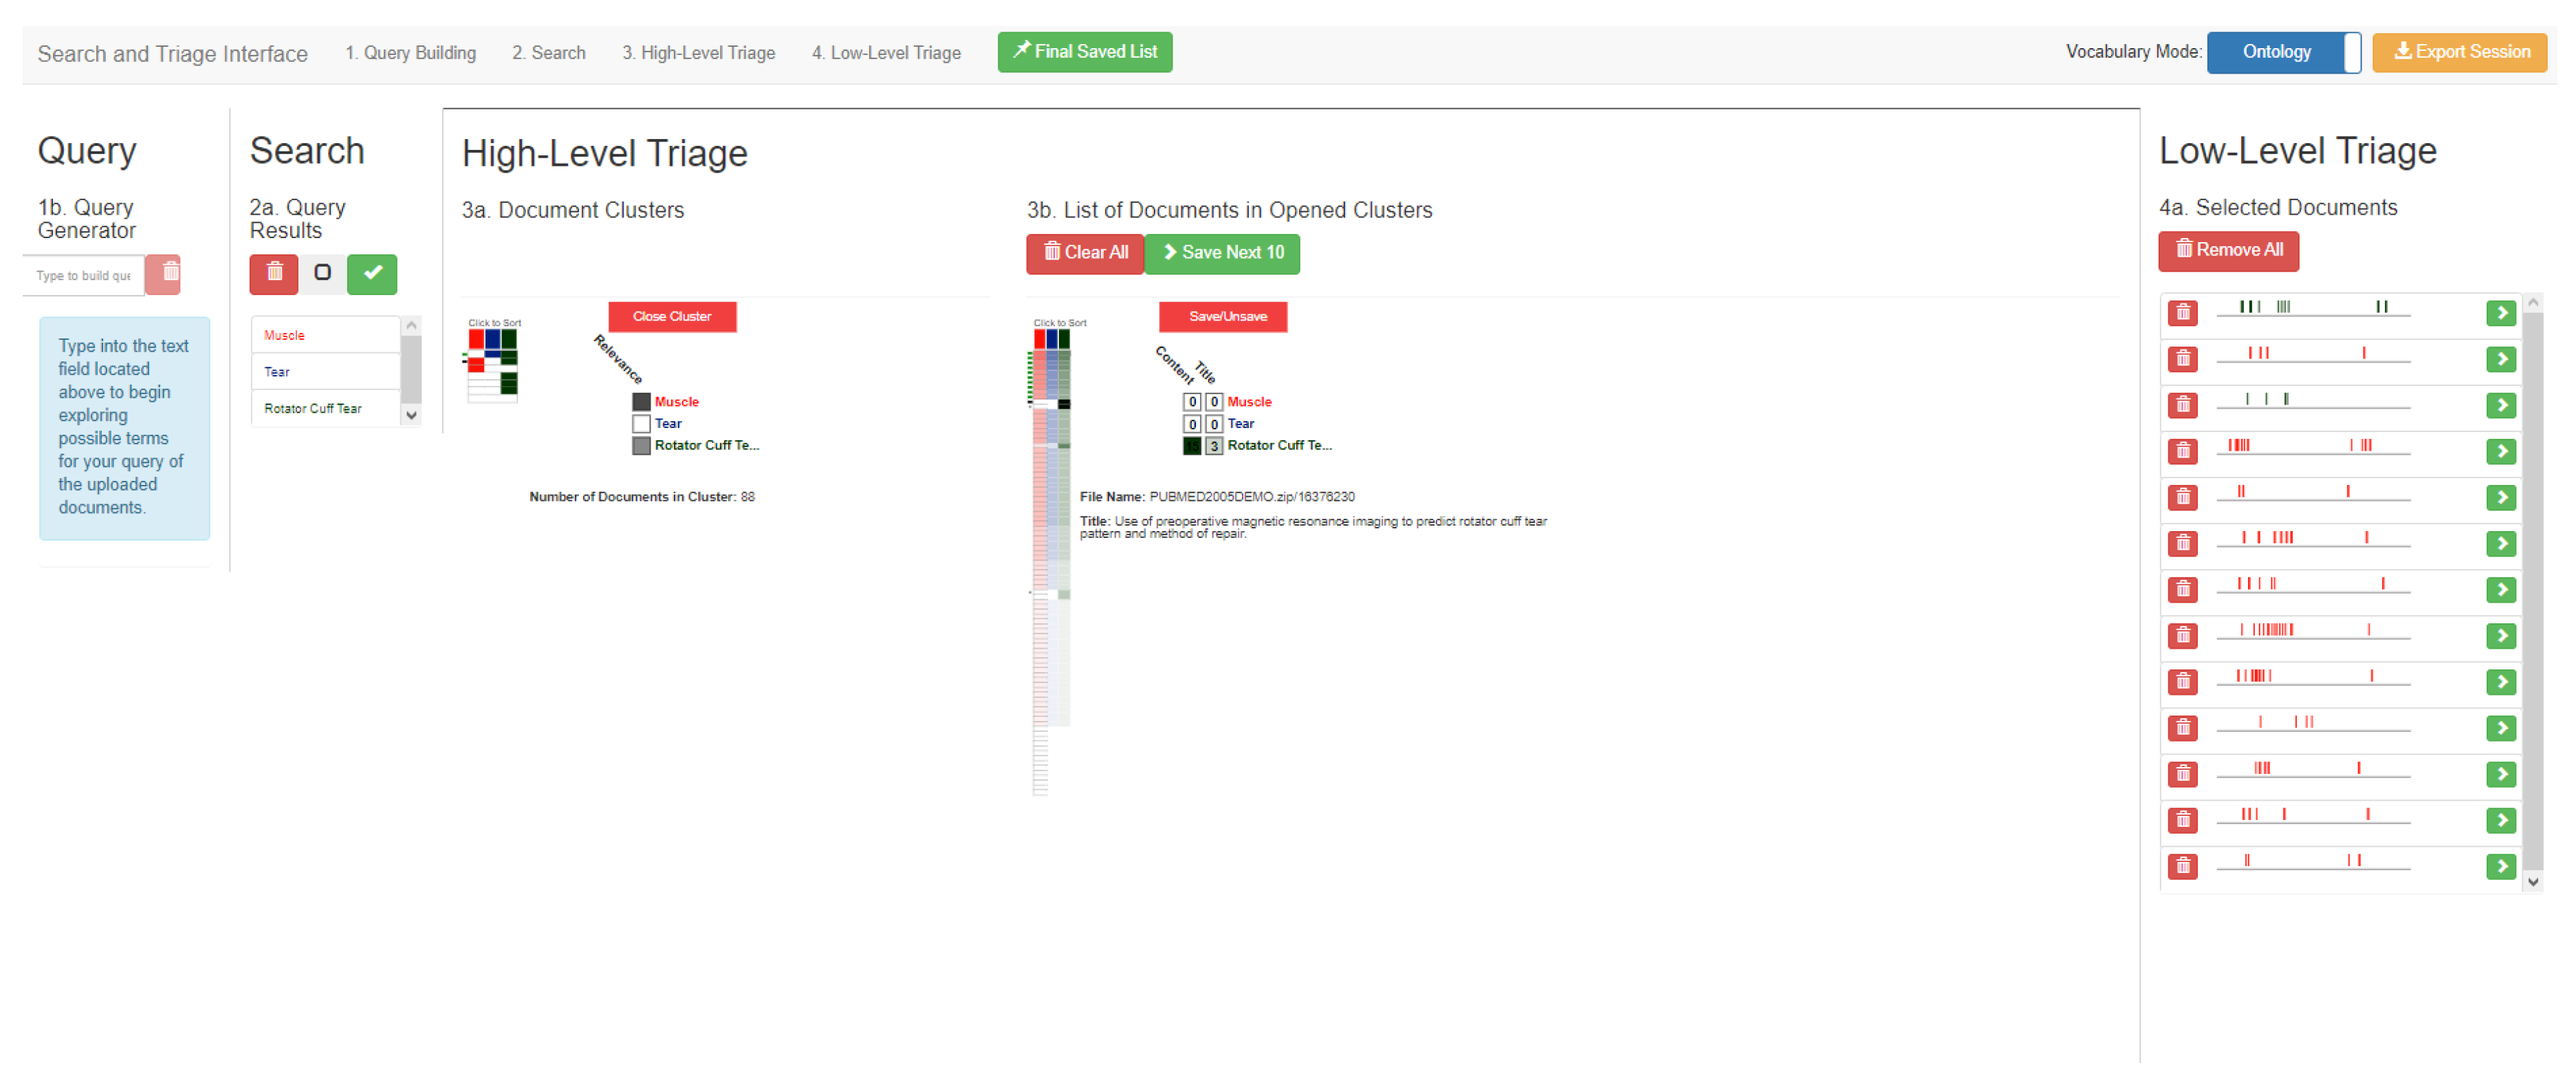
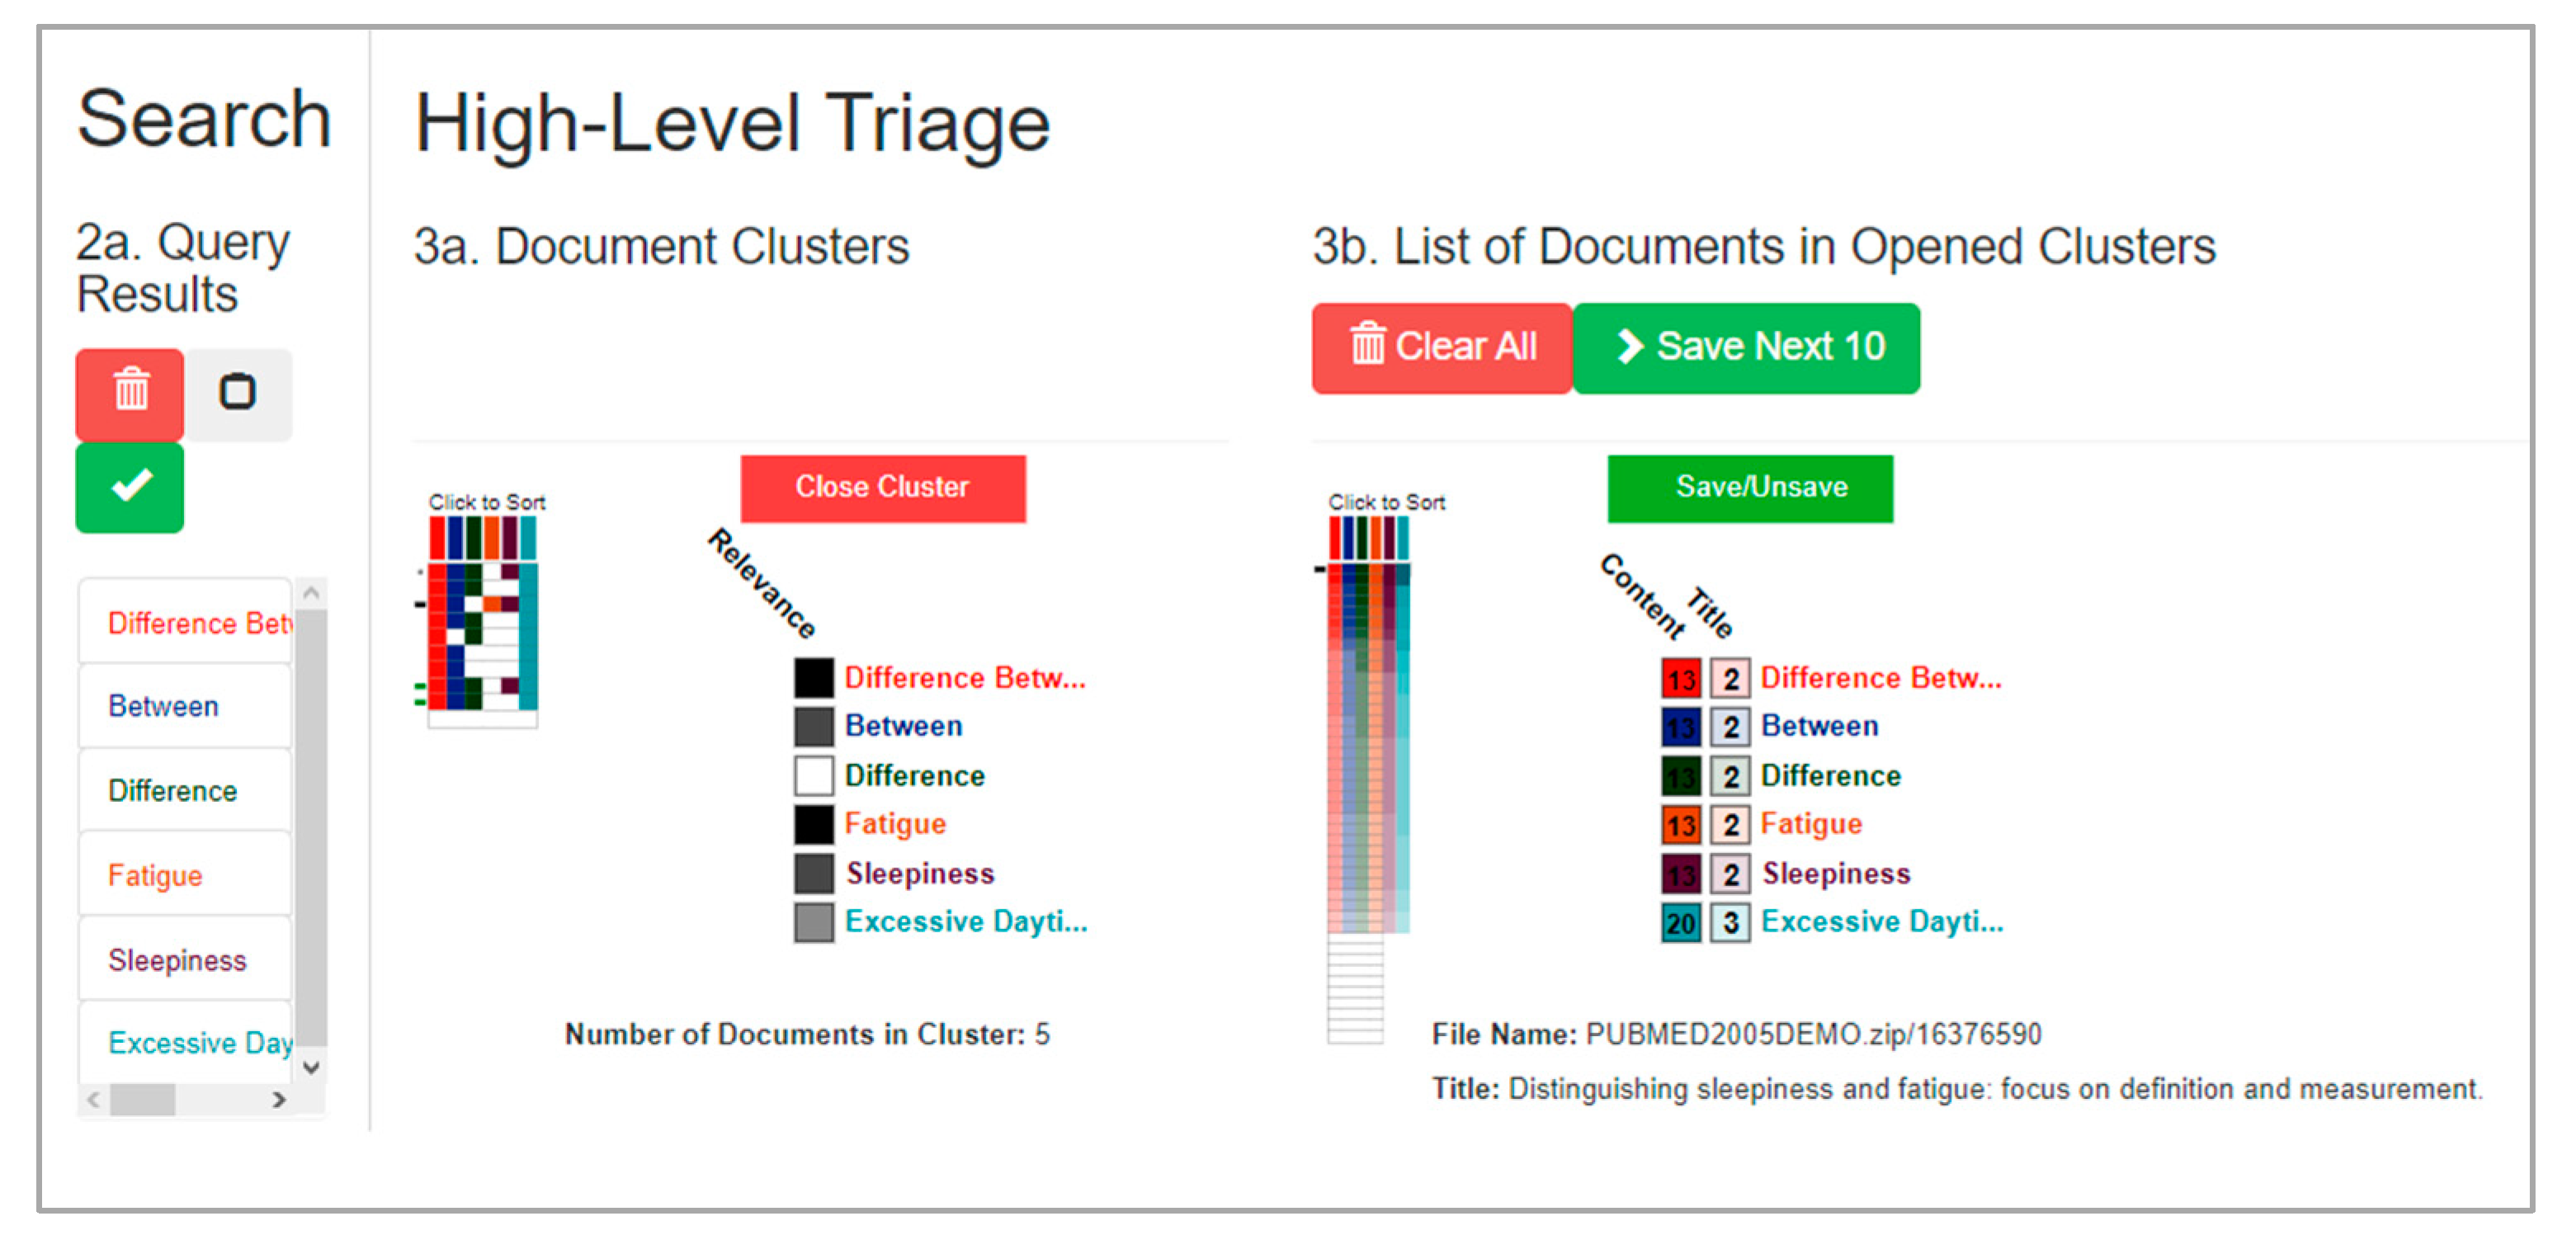
High-Level Triage is the third subview within VisualQUEST (DC1). Figure 10 provides a depiction of where the previous searching has produced groupings of the document set. A subset of those groupings has been selected, producing a further listing of their contained documents. Some of these documents have been inspected and added into low-level triage.
In this subview, users triage the results of ML computations at the grouping level. A full document mapping is displayed within Query Result Heatmap, providing users with a high-level abstraction of the document set (Figure 11, DC6, DC10) [65].
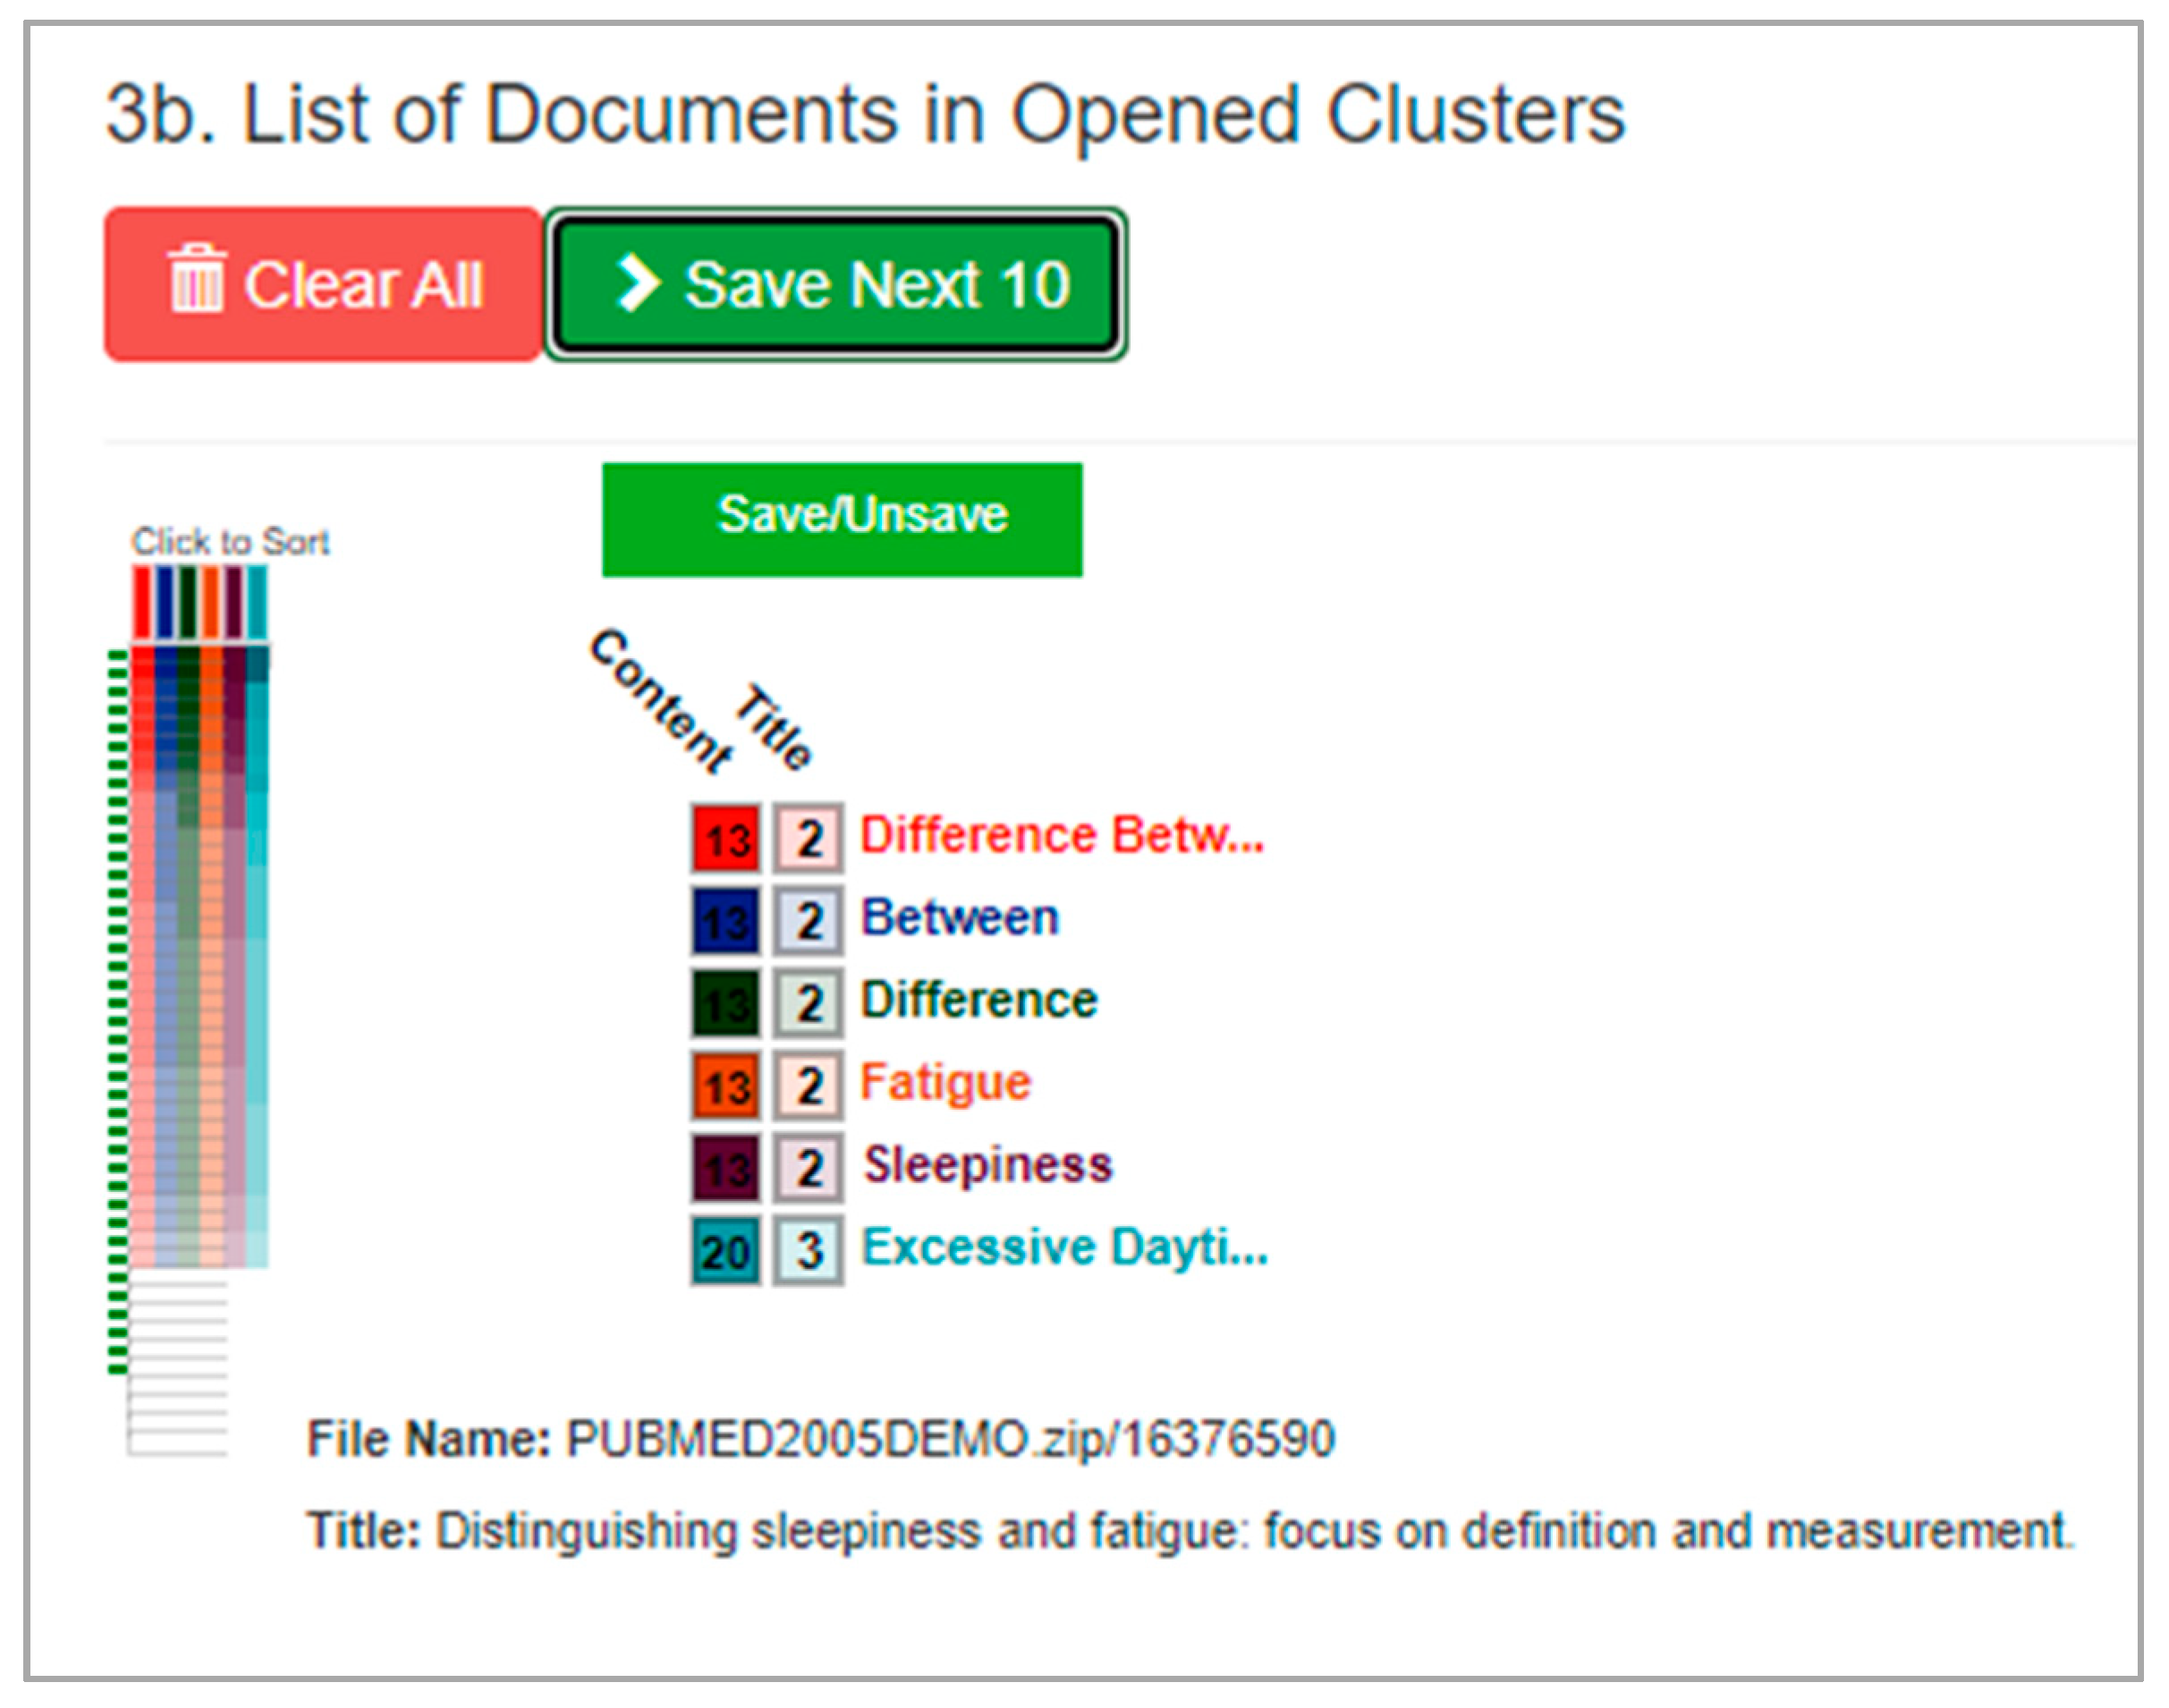
This visual abstraction is divided into horizontal slices representing document groupings. For each document grouping, a set of color cues highlight query item presence. Users can inspect each document grouping to assess its size and alignment with the search formulation. Listings can be re-ordered to prioritize specific query items. A cursor marks the current position, trailing dots mark previously viewed listings, and a green mark for those selected for further triaging. Document groupings can be opened within an additional Query Result Heatmap, which provides high-level abstractions of individual documents from selected groupings (Figure 12, DC7).
Users can use this additional collection of documents to individually assess alignment with the search formulation, as well as inspect metadata such as titles and document-specific counts (DC6). Documents can then be saved to Low-Level Triage (DC7, DC11).

4.4.4. Low-Level Triage Subview

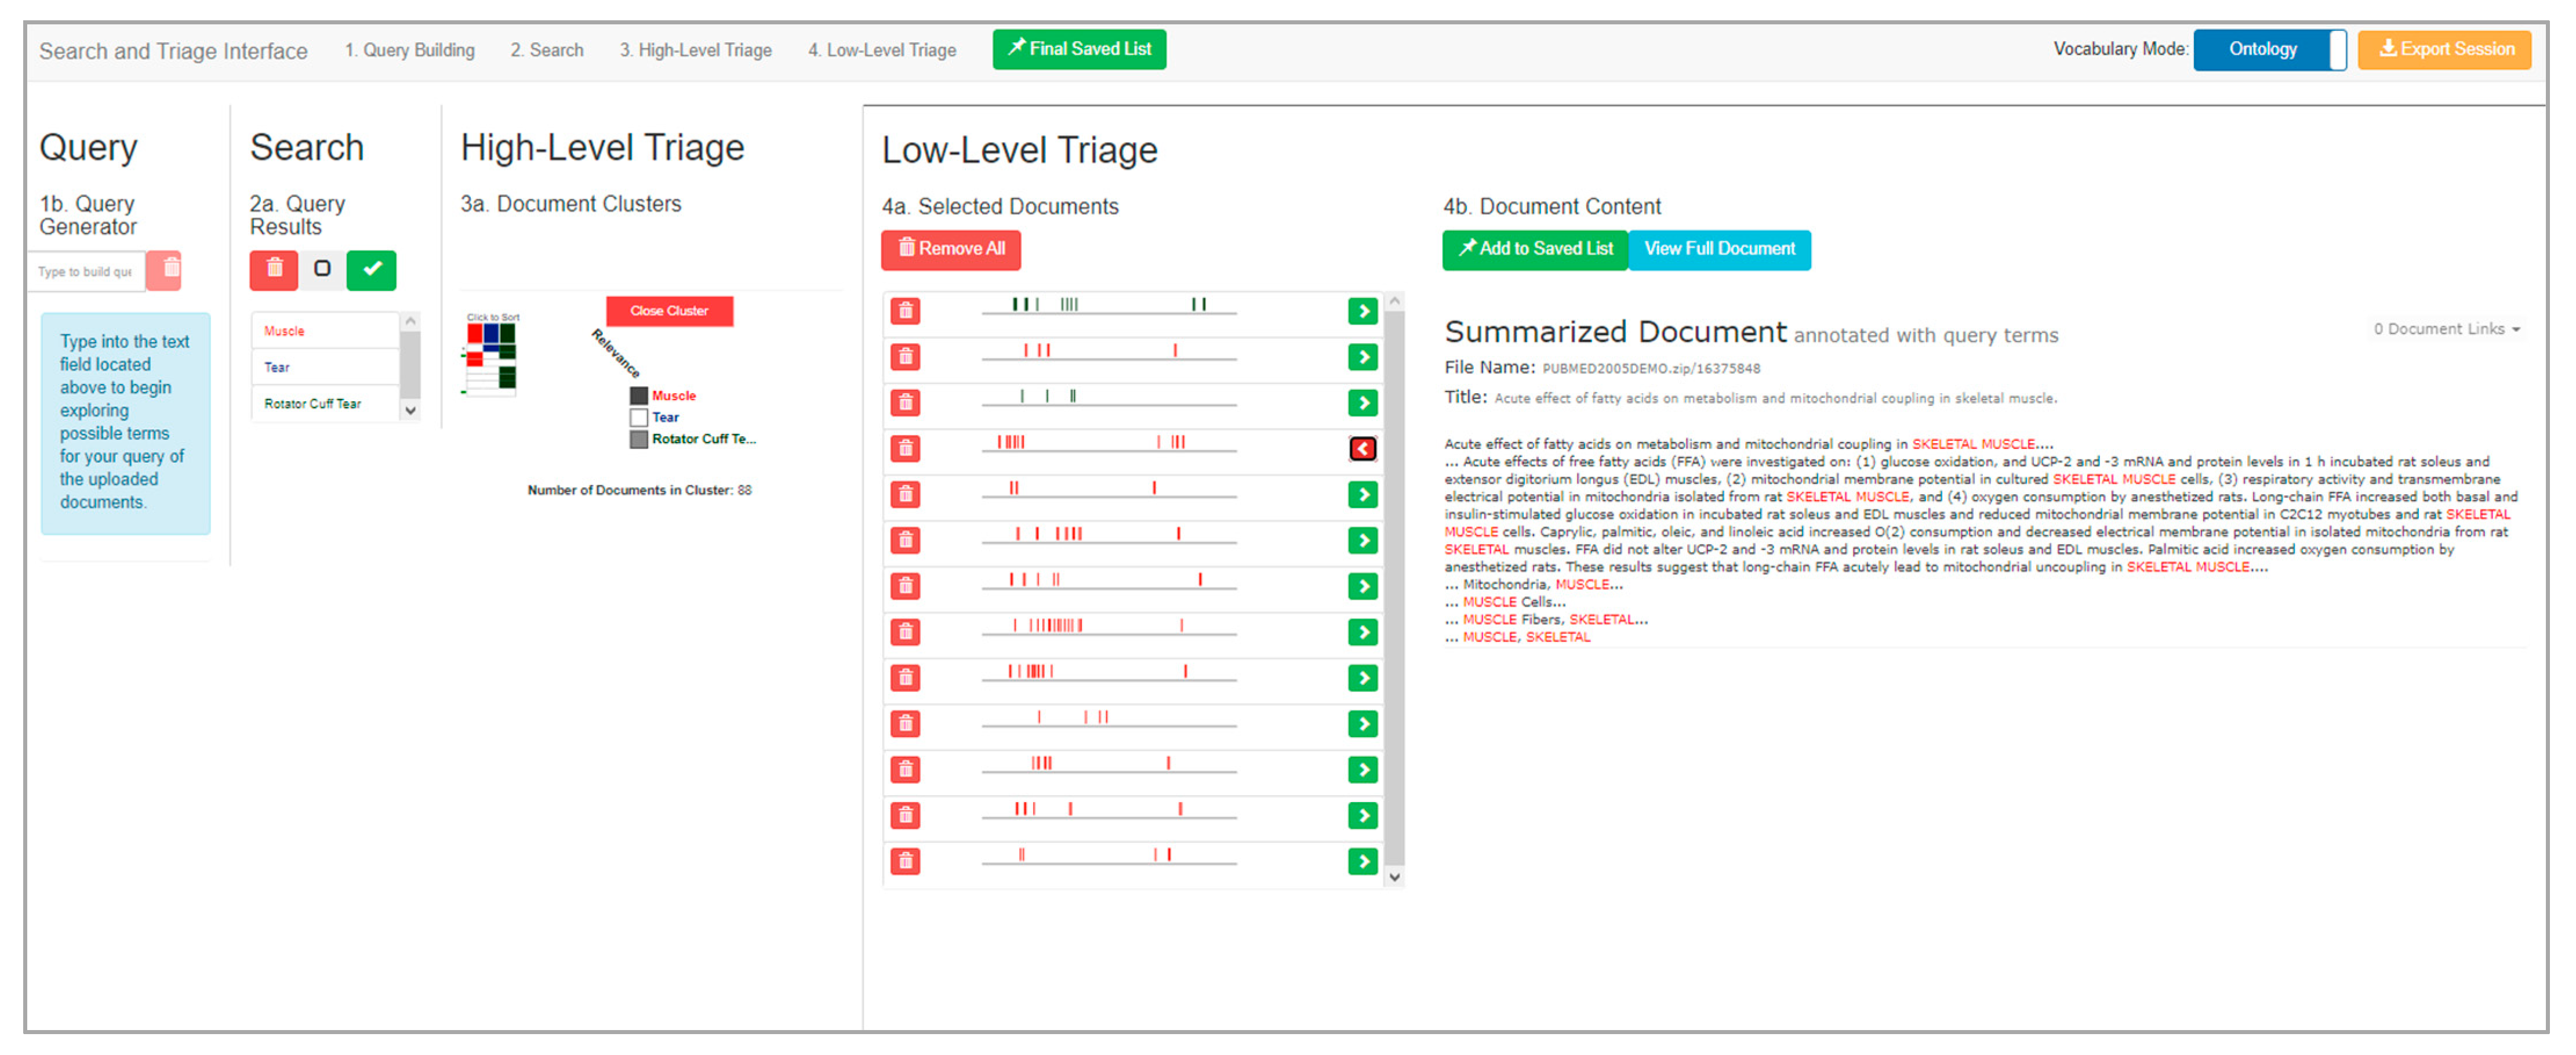
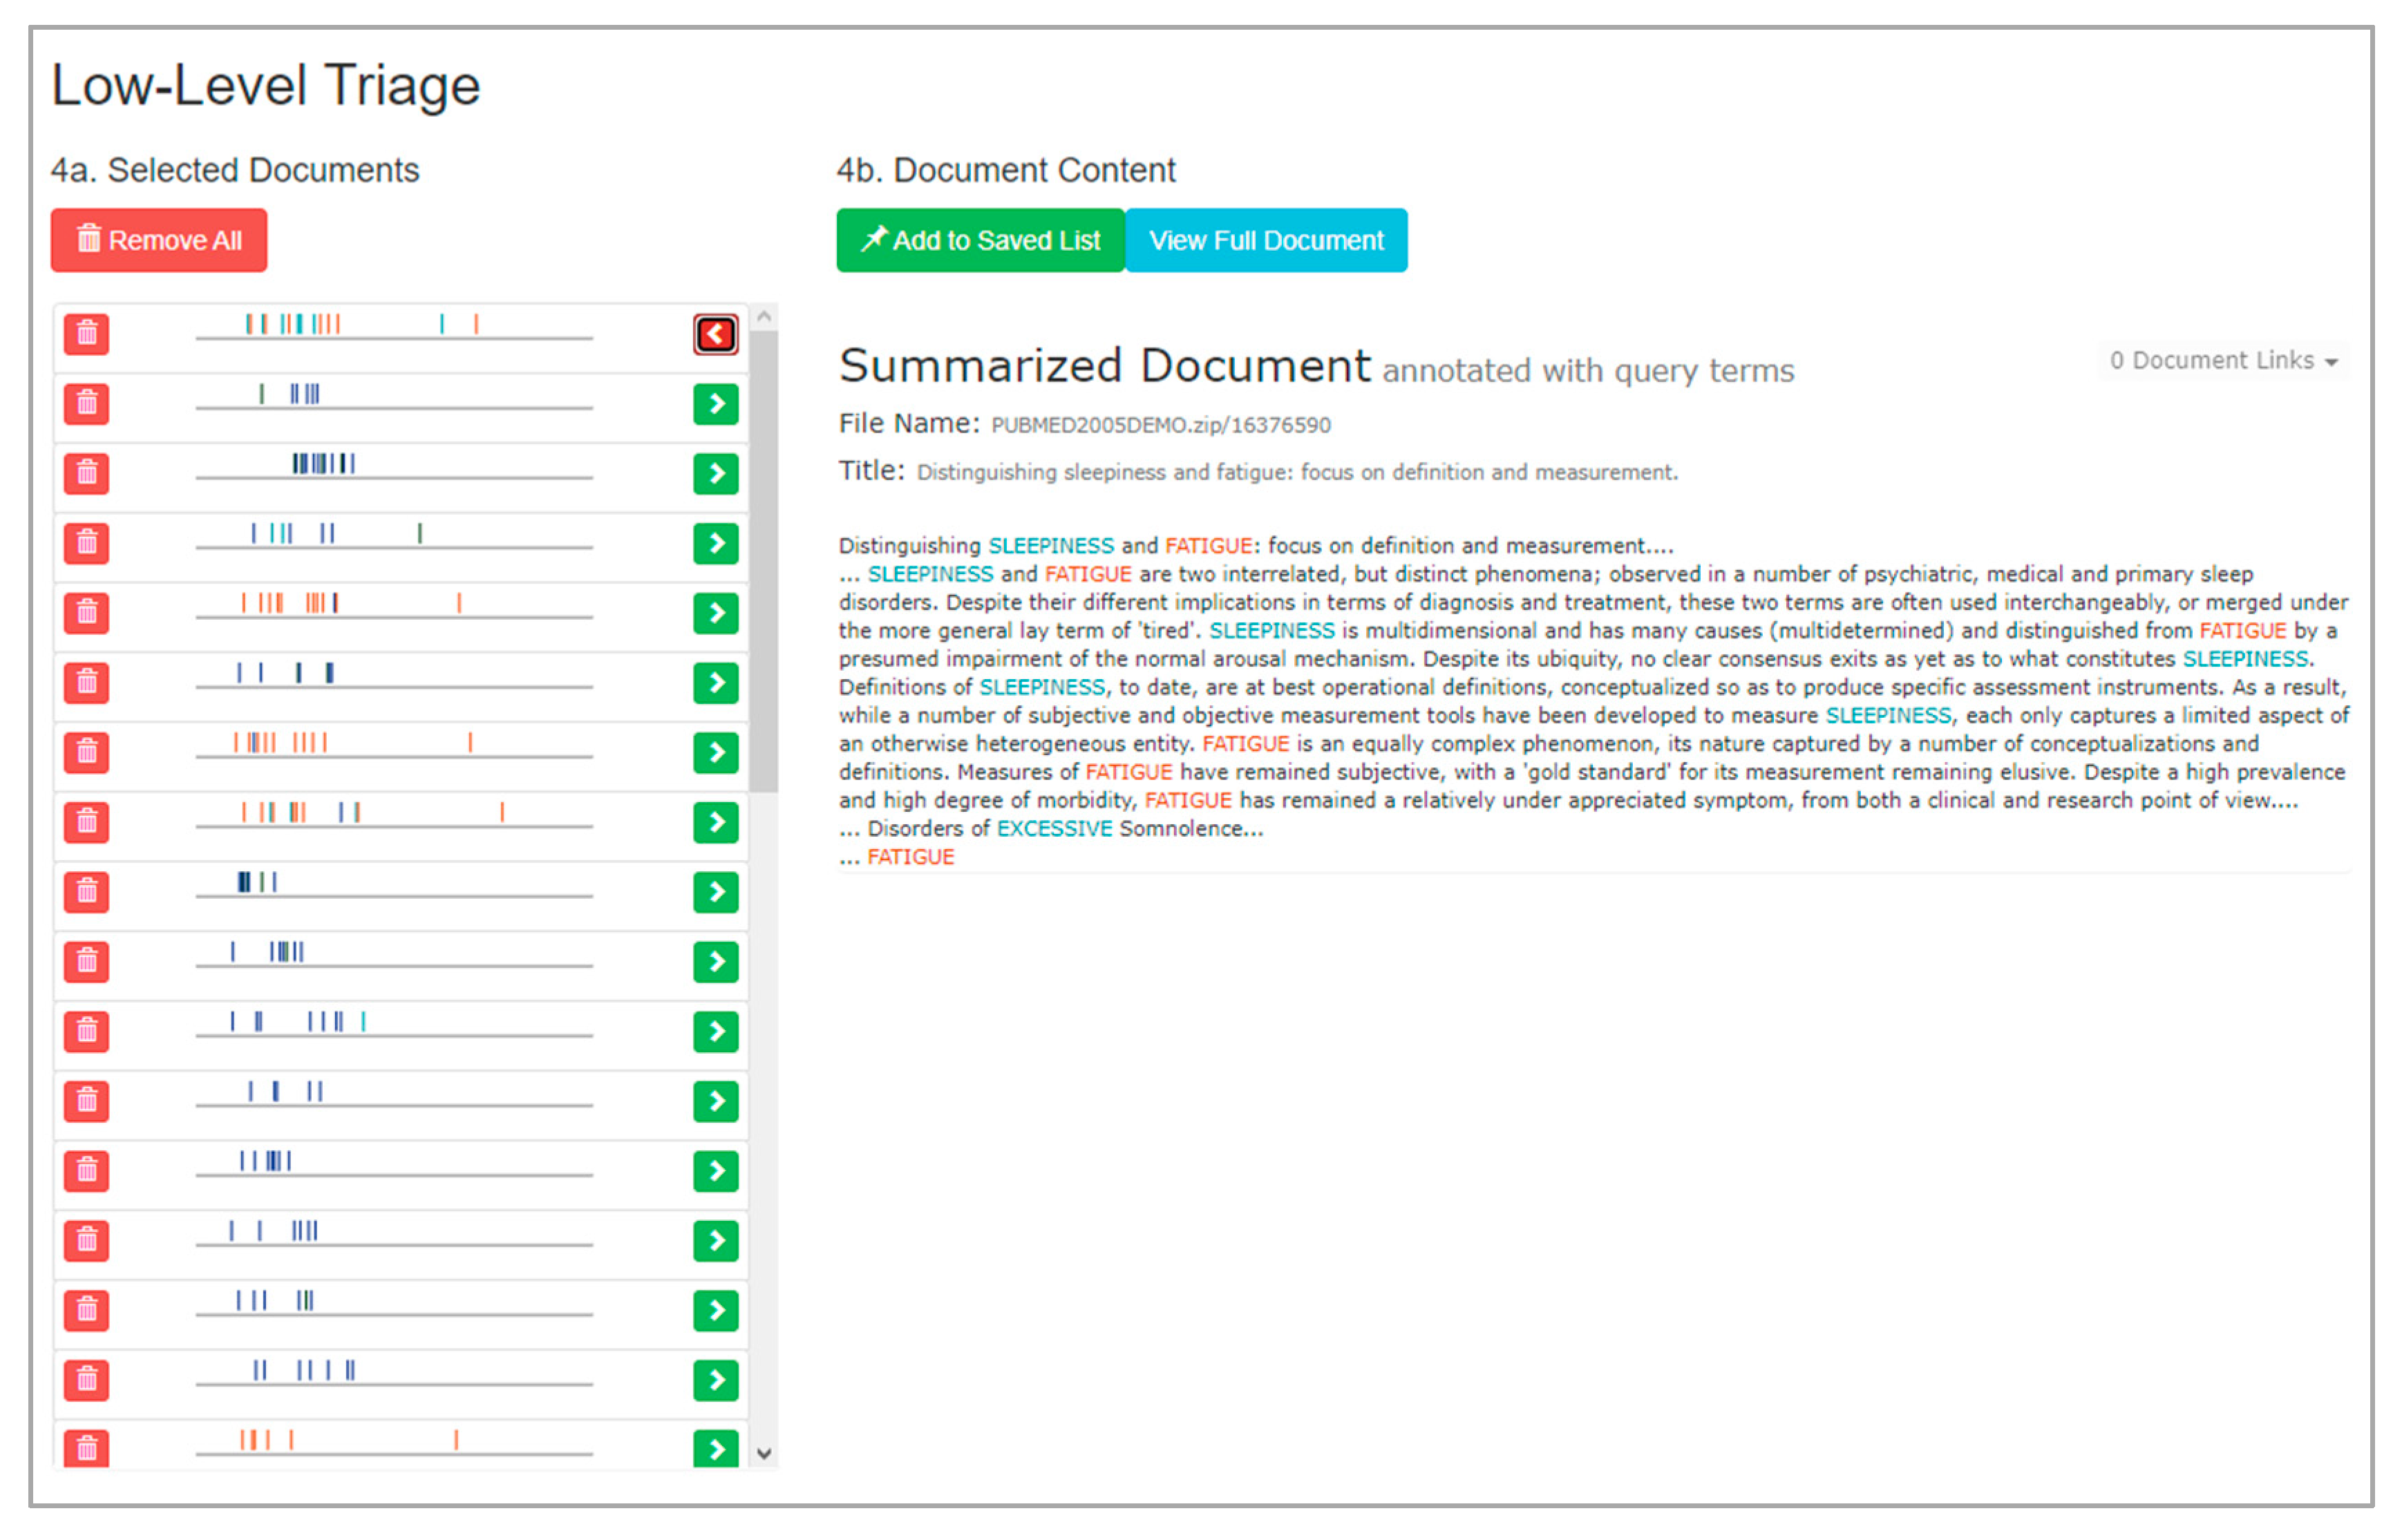
Low-level triage is the fourth subview within VisualQUEST (DC1). Figure 13 provides a depiction of where a set of saved documents have been produced in prior triaging. Each of these documents has been provided a timeline-like summary reflecting words or phrases aligning with the search formulation within its content. When selected, the Document Content viewer depicts the document itself, either in the summarized or full document mode. The summarized mode is shown.
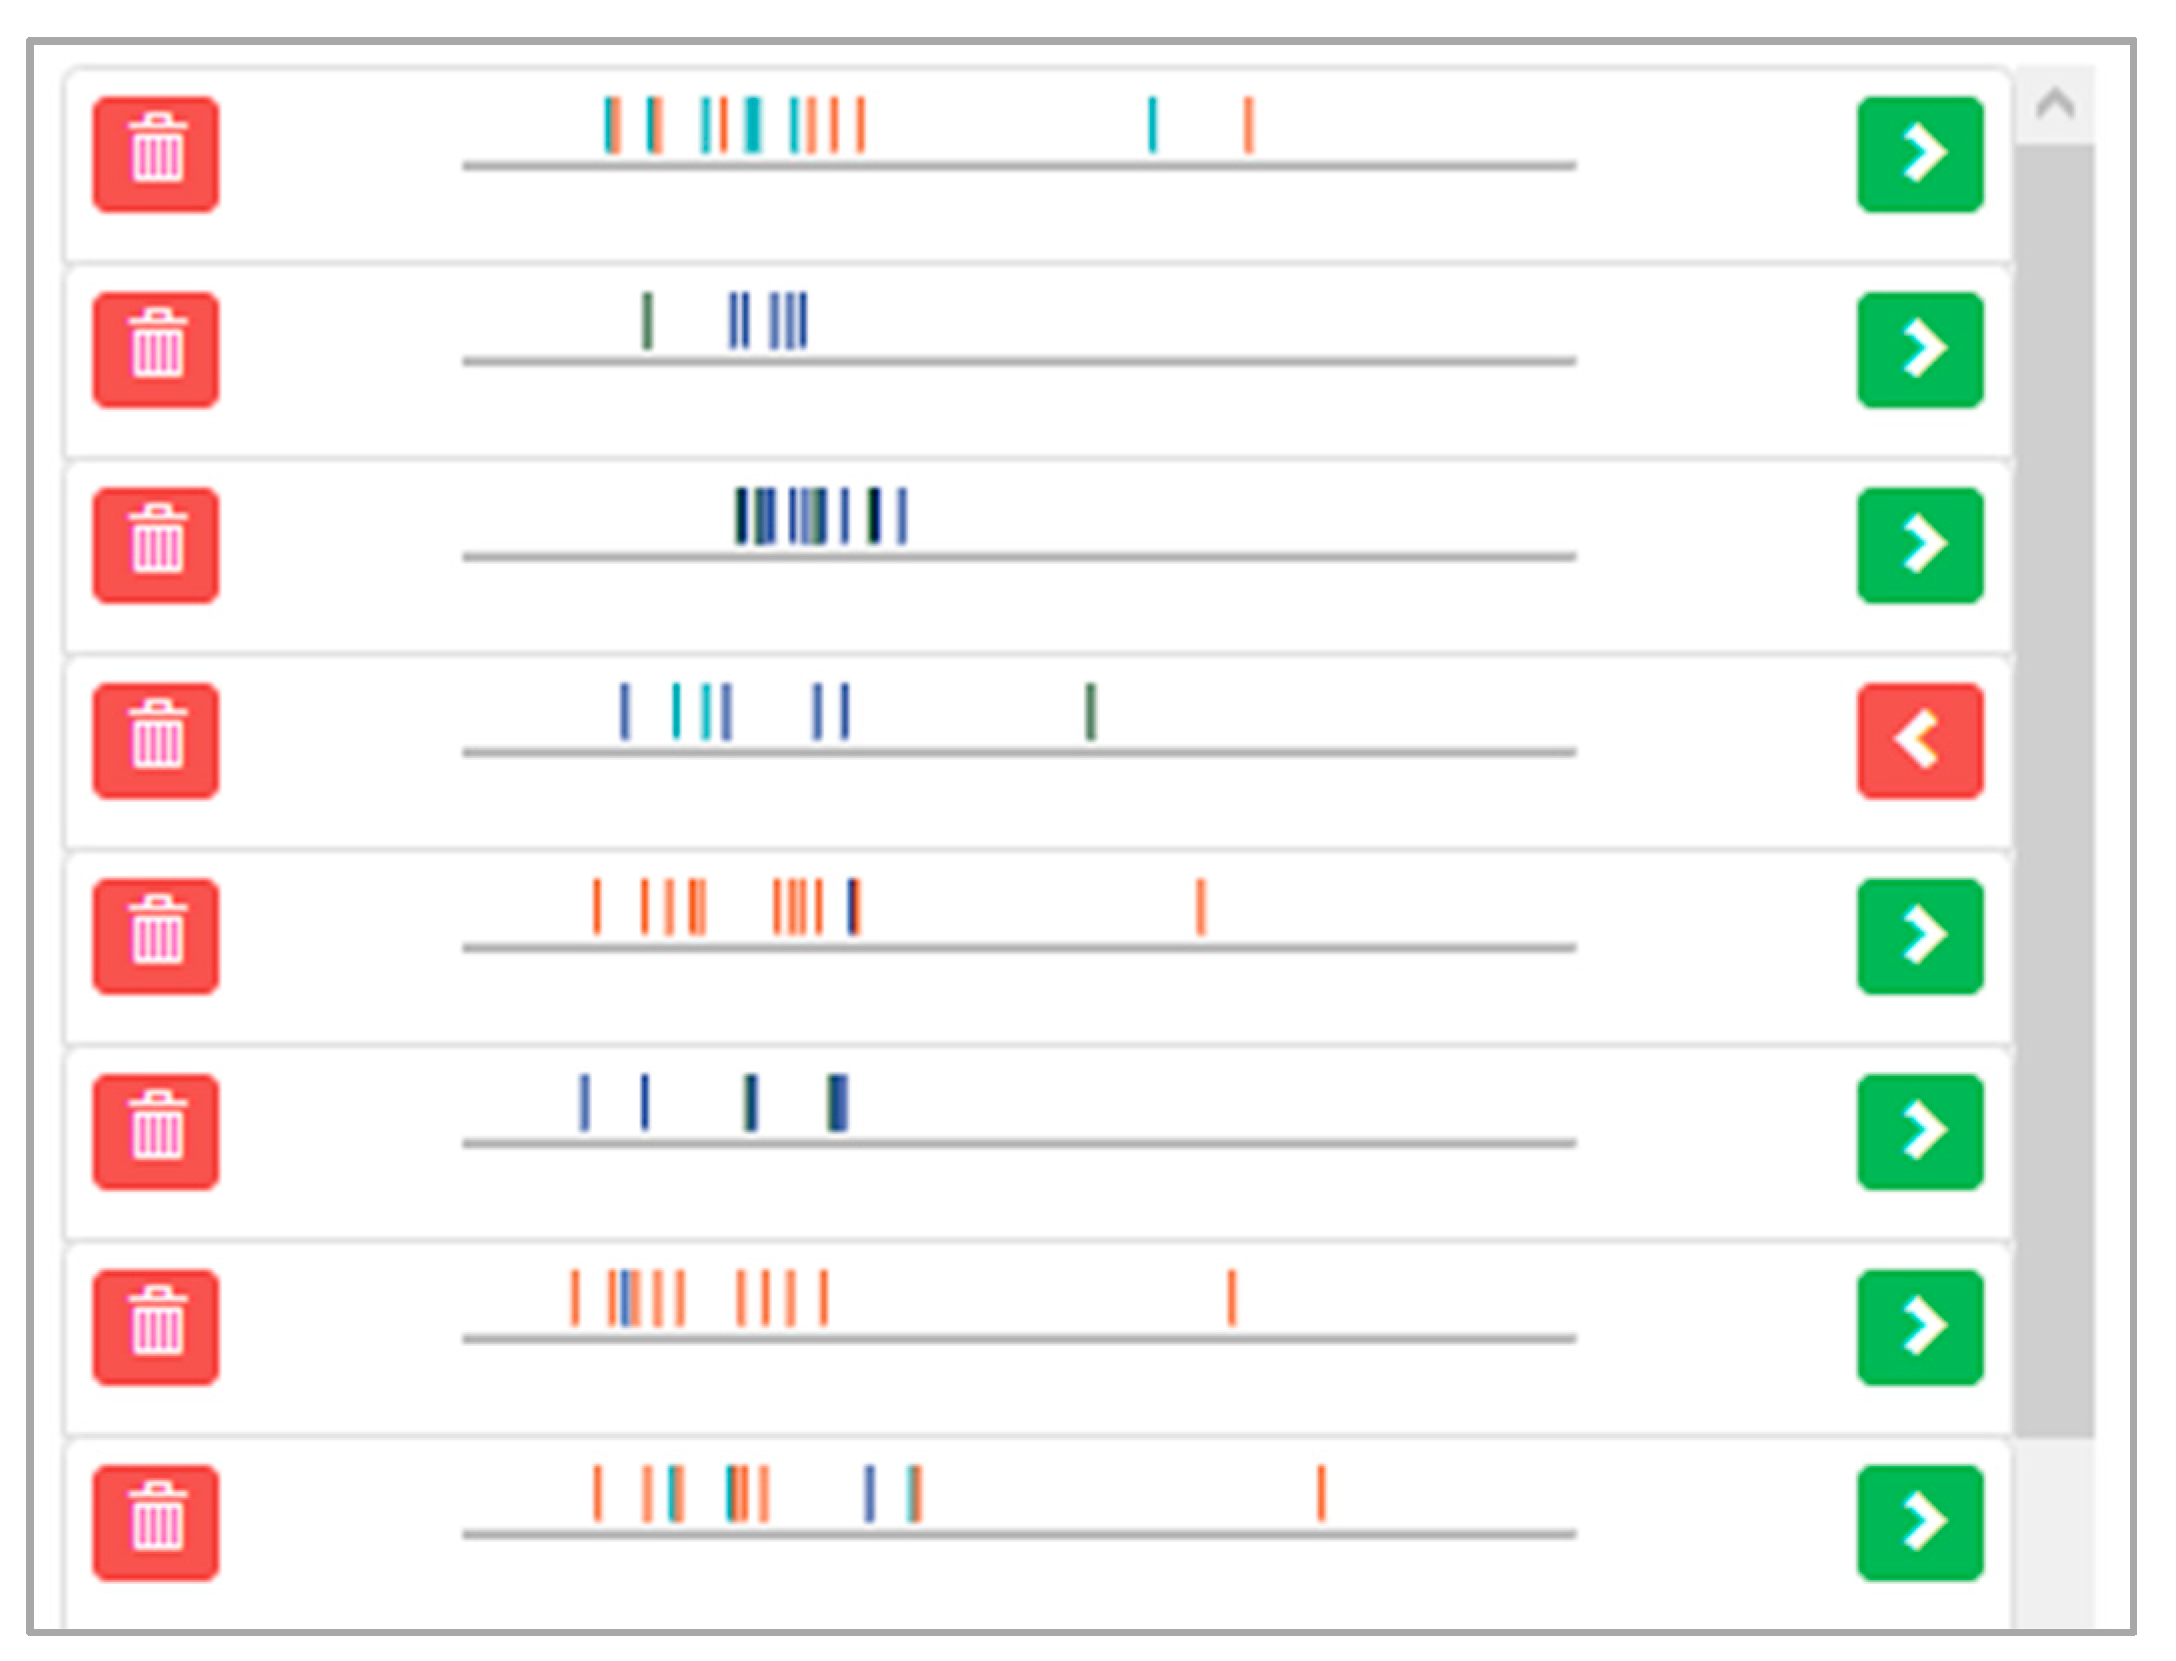
In this subview, users triage the documents produced in high-level triage. Users are provided a timeline-like visual abstraction of individual documents (Figure 14).
In this visual abstraction, colored marks are placed along a timeline to reflect the position of words or phrases which align with the query items of the search formulation. Documents with strong alignment will produce numerous markings, resulting in color-heavy and densely marked timelines. Utilizing the timelines, users can perform rapid analysis of the themes of individual documents. Namely, users can assess the presence of query items used within the search formulation, where in the document they are, and the density of their usage (DC8, DC10). The Document Content viewer is activated after selecting a document for deeper inspection (Figure 15, DC10, DC11).
This viewer presents all available document content, such as document text, title, authors, file name, URLs, and published date. Users can toggle between a full document and a summarized mode. The full document mode displays all available information, annotated to reflect alignment with the search formulation. The summarized mode condenses documents to just content in proximity to aligning words or phrases (DC8, DC10). Users may open documents to inspect, compare, and make final relevance decisions on its content. Relevant documents can be added to a persistently saved list, allowing users to continue searching and triaging without the risk of losing progress (DC9).

5. Discussion and Summary

In this section, we provide a discussion of ongoing formative evaluations of VisualQUEST and some preliminary findings; in addition, we discuss the limitations of the current work, highlight some future work, and provide a summary.

5.1. Formative Evaluations of VisualQUEST

We had formative user evaluations of VisualQUEST—that is, ongoing, task-driven assessments of the effectiveness of the search and triage interface. These evaluations have been informal, involving volunteers associated with our research lab. The feedback from these users helped us gain some insights into how the design of ontology-supported and progressively disclosed VAT interfaces can be guided by the collection of design criteria that we discussed in this paper. We learned that criteria-driven designs can help users perform complex, multi-stage information-seeking tasks on large document sets. In these evaluations, users performed tasks aligning with the stages of the information-seeking process, including the fulfillment of a research, question-driven scoping review. The restrictions of the ongoing COVID-19 pandemic placed significant limitations on us performing formal empirical user studies, which we highlight in the Limitations section. Our research objectives for expanded empirical evaluations are described within the Future Work section.

5.1.1. Tasks

Given the same document set (MEDLINE database) and ontology (Human Phenotype Ontology), and directed through an automated task set, users performed seven tasks with VisualQUEST. Given their current level of knowledge and vocabulary, users explored the interface to perform a set of information-seeking tasks: including building queries, assessing how their queries aligned with the document set, conducting high-level triage on search results, and doing low-level triage. The exploration culminated with the completion of a task involving all stages of information search and triage. We provide a general description of each task within the task set (Table 4).

5.1.2. Formative Evaluations and Findings

In total, 10 users affiliated with our research lab interacted with VisualQUEST during task performance. The gender split was 80% male and 20% female. The information-seeking domain was medicine, using the MEDLINE as the document set with over 25 million documents in it, and Human Phenotype Ontology (HPO) with over 11 thousand items as the vocabulary meditation ontology. On average, these users stated that they liked to try new software tools and learn how tools work by exploring them rather than reading instructions. They also stated that they frequently use tools for information search and are generally confident in their ability to communicate their information-seeking needs using search interfaces. Furthermore, they noted that they generally trust that their search tools capture all relevant information. Most of them (>60%) stated that they are frequently satisfied with their results after a single round of search, with greater than 30% occasionally or rarely being satisfied after a single round. Users reported that they possessed low to average knowledge of the medical domain, as it rarely impacts their lives on a weekly basis. Finally, the majority of users were aware of what ontologies were prior to using VisualQUEST.
During ongoing formative evaluations, all users completed all assigned tasks. Furthermore, they reported their general experiences after using VisualQUEST. They described their experiences with progressive disclosure, the use of novel visual abstractions, view sequences, and ontology mediations. We itemize initial, general findings below, followed by some informal quotes on which these findings are based (A … J):
(1)
Users were able to learn how to use VisualQUEST without much difficulty (e.g., A, B).
(2)
Users were able to interpret the visual abstractions in VisualQUEST to engage with the ML component of the tool (e.g., C, D).
(3)
Users were able to differentiate between the individual stages of the information-seeking process and used VisualQUEST’s domain-independent, progressively disclosed interface to search and triage MEDLINE’s large document set (e.g., E, F, G).
(4)
Users were able to use Human Phenotype Ontology to align their vocabulary with the vocabulary of the medical domain, even while they were not initially familiar with the ontology’s domain or its structure and content (e.g., H, I, J).
(5)
Users felt that mediating ontologies make search tasks more manageable and easier and not having them would negatively affect their task performance (e.g., H, I, J).
The following are excerpts from these informal sessions:
(A) “Once I understood what it was showing me, it helped me. Usually with new tools I tend to read through the documentation or watch videos. And then it still takes me like a while to pick up on them. Like, just running through them and using them a few times. Once you get the hang of it, usually you find success in whatever it’s providing you.”
(B) “It’s a tool that I’m not used to and I’m kind of going back and forth and for me when there’s kind of a lot of little moving parts. I mean it, it feels that way right now because I’m not familiar with the tool and I’m kind of taking in this information and figure out how the way different pieces of information needs to go together.”
(C) “If I was using [VisualQUEST] against other search (interfaces), I would just use [VisualQUEST] constantly. Being able to really filter down exactly what I need… like that’s really on point. Especially with like the different colorings of the words. It’s like telling you like what each document (grouping) is like. It gives me the ability to better align with the documents and gives me more confidence when I’m creating my queries. I’m making the correct query decision even before even running the search.”
(D) “A lot of other tools you use, they kind of do predictive searches for you. They build a filter. So, for example, like Google doing a predictive search. It’s predicting based on top results from previous searches, so with that, it can be finagled with. Where you know you could have a bot farm or whatever finagling those search results and making them be what they want them to be. Whereas with [VisualQUEST] you get to parse those results and make your own educated decisions versus the search engine doing it for you. So, I feel more control in the experience than you would typically. I feel more certain in the end goal.”
(E) “[With VisualQUEST], going through low-level triage and seeing and reading the abstract and the actual documents… I wanted to check and have a comparison between the documents that I chose… (because) usually my style of choosing is that I usually choose more than what I have to choose and then I remove that and the extra ones.”
(F) “At first, I just copy and pasted the entire keywords … and my first thought I wasn’t really seeing the results of the all the keywords mixed in together the same way. So, [with VisualQUEST] I was able to go back and see if the words individually not together had brought in any difference in the search.”
(G) “I think [VisualQUEST] is a benefit. In my previous experiences with searching queries, if you just type it in and it blurts out the answer it prioritizes in whatever way that it wanted. I like this because it is a little bit more specific, and you are able to choose more of the options that you want to use. I think you have more control of how to exactly find the answer and what exactly you are looking for, instead of starting from just a general basis of all the answers that are possible. So, I think it’s better to be able to narrow down exactly what you’re looking for and find more appropriate answer towards your question.”
(H) “I was thinking … where the ontology would have been helpful. So … it would have possibly brought up some of those other terms just from searching a few words and they would be able to make some connections between the text that was provided and some of my search terms (to see) … how relevant they were. So, if I was shooting in the dark and hoping for the best, which is what I was kind of doing (without the ontology), at the very least, it would have given you confidence of your actions. Yeah, I think so. A little bit more confidence.”
(I) “Yeah, actually on second thought, yeah, this (ontology) would have helped because I … can find the things that … share in common, and that can make it probably much easier to find the relevant documents. Yeah, being able to see the things that certain phrases … or words share in common. You can find that common link … that can find you the … the relevant documents.”
(J) “I do really like how [VisualQUEST] gives you the ability to find different vocabulary or other words that may not have been the first thing you thought of when you were building the query.”

5.2. Limitations

One of the limitations of this research is the lack of a formal empirical user study of VisualQUEST. The COVID-19 pandemic has made it difficult to conduct such a study. Our preliminary investigations do not enable us to fully evaluate all the features of VisualQUEST. In these informal evaluations, we noted that user experiences of the tool were affected by their initial unfamiliarity with the interface—that is, users expressed an initial lack of confidence when using the novel elements of the interface. However, this was quickly overcome when they had a few minutes to learn the preliminaries of the tool. Users felt that they were able to mold their interface to match their personal needs and expectations when searching and triaging. They said that this was in contrast to their typical limiting experiences with traditional interfaces. They expressed that they were capable of utilizing ontology files to align their vocabulary with the vocabulary of the domain, even if they were not initially familiar with the ontology’s domain or its structure and content. Users conveyed that the use of the ontology and the mediation opportunities it provided helped guide their information-seeking process, making tasks manageable and easier and that not having ontologies would negatively affect their task performance. Despite the lack of a formal study, we anticipate that insights gained through our formative evaluations can help future investigations and promote further refinement to the interface design process, particularly how user-facing ontologies should be integrated into VATs that support searching and triaging of large document sets.
The second limitation of this research is of a technical nature. First, the Analytics server of VisualQUEST can handle uploading, processing, and serving document sets and ontology files of large sizes. For example, our usage scenario demonstrates VisualQUEST handling HPO and its 11,000 ontology terms and a large document set reflecting a subset of MEDLINE. However, if document sets and ontology files were to be increased to an extreme scale, overhead limits within the local browser could produce a notable wait before users could begin to search and triage. Therefore, this limits VisualQUEST’s current ability to handle document sets and ontology files of extremely large sizes. Additional technical efforts would be needed to address this limitation. For instance, additional efforts could be made to shift computation away from the local browser, improve the general computational efficiency of the tool, and seek centralized solutions to eliminate document set and ontology file indexing prior to task performance. VisualQUEST’s second technical limitation is its current level of support for ontology file formats. As previously described, VisualQUEST in its current state can process the core elements of OWL, a leading format for encoding ontologies within the digital space. Yet, the OWL specification is overly verbose, particularly in regard to its extensive base of axiom relations. Therefore, we believe VisualQUEST’s ontology processing system can be improved to supply even more value for mediation and query expansion opportunities. In addition, there are other RDF-based ontology formats that would be valuable to support.

5.3. Future Work

We plan to perform formal, empirical evaluation studies. These studies will implement task-driven formal evaluations to compare VisualQUEST with other tools that facilitate searching and triaging large document sets. We hope to generate qualitative and quantitative results that provide a better understanding of how interface design criteria affect user performance in information-seeking tasks. Specifically, we will expand our evaluation studies to include quantitative results which track how user performance changes when presented with alternative interfaces for a task set. We intend to measure task performance and completion timings, as well as expand qualitative findings such as user-reported ease, satisfaction, assessment, and more in-depth interviews. These will help us with a better understanding of the criteria for the design of such tools.
Beyond these, we intend to explore several other potential research directions. First, we believe there is value in deeper investigations of lower-level design considerations and their impact on the performance of challenging information-seeking tasks on large documents. Second, the distilled design criteria and the implemented prototype, VisualQUEST, provide an initial exploration of how ontologies can be presented to information seekers within the visual interface of their tool. Yet, we believe ontologies present more research opportunities for novel designs. Future research could explore additional points of ontology integration (e.g., in the high-level and low-level triage stages) within complex, multi-stage information-seeking processes. Third, information-seeking tasks can sometimes require refined levels of domain knowledge for effective performance. Future research could investigate how domain-specific considerations affect the performance of information search and triage and what design approaches can be used to benefit those requirements.

5.4. Summary

We investigated the design of ontology-supported, progressively disclosed visual analytics interfaces for searching and triaging large document sets. In this investigation, we first reviewed existing research literature on the multi-stage information-seeking process to distill high-level design criteria. Using this, we suggested a four-stage model encompassing query building, search, high-level triage, and low-level triage. We also highlighted the importance of progressive disclosure as an organizational design technique for complex, multi-stage tasks. Furthermore, we discussed the use of ontologies as a mechanism for bridging the gulf between the current user’s vocabulary and that of the document set. We developed eleven criteria to help with the systematic design of the aforementioned interfaces.
To illustrate the utility of the criteria, we applied them to the design of a demonstrative prototype: VisualQUEST (Visual interface for QUEry, Search, and Triage). VisualQUEST enables users to build queries, search, and triage document sets both at high and low levels. Users can plug-and-play document sets and expert-defined ontology files within a domain-independent, progressively disclosed environment for multi-stage information search and triage tasks. We described VisualQUEST through a functional workflow.
We presented some preliminary findings of our ongoing formative evaluations. Initial evaluations found that users responded positively to the design criteria applied within VisualQUEST. These preliminary evaluations suggested that:
  • Users are able to transfer their knowledge of traditional interfaces to use VisualQUEST.
  • Users are able to interpret VisualQUEST’s abstract representations to use its ML component more effectively, as compared to traditional “black box” approaches.
  • Users are able to differentiate between the individual stages of their information-seeking process and use VisualQUEST’s domain-independent, progressively disclosed interface to search and triage large document sets.
  • Users are able to use ontology files to align their vocabulary with the domain, even when they are not initially familiar with the ontology’s domain, its structure, or its content.
  • Users feel that mediating ontologies make search tasks more manageable and easier.
This research is a step in the direction of investigating how to design novel visual analytics interfaces to support complex, multi-stage information-seeking tasks on large document sets.

Author Contributions

Conceptualization, J.D. and K.S.; methodology, J.D. and K.S.; software, J.D.; validation, J.D. and K.S.; formal analysis, J.D. and K.S.; investigation, J.D. and K.S.; resources, Insight Lab, J.D. and K.S.; data curation, J.D.; writing—original draft preparation, J.D.; writing—review and editing, J.D. and K.S.; visualization, J.D.; supervision, K.S.; project administration, J.D.; funding acquisition, K.S. All authors have read and agreed to the published version of the manuscript.

Funding

This research received funding from the Natural Sciences and Engineering Research Council of Canada (NSERC).

Institutional Review Board Statement

Not applicable.

Informed Consent Statement

Informed consent was obtained from all subjects involved in the study.

Data Availability Statement

Not applicable.

Acknowledgments

We would like to thank the members of the Insight Lab who helped with this research.

Conflicts of Interest

The authors declare no conflict of interest.

References

  1. Parsons, P.; Sedig, K.; Mercer, R.E.; Khordad, M.; Knoll, J.; Rogan, P. Visual analytics for supporting evidence-based interpretation of molecular cytogenomic findings. In Proceedings of the 2015 Workshop on Visual Analytics in Healthcare, Chicago, IL, USA, 25 October 2015; pp. 1–8. [Google Scholar]
  2. Sedig, K.; Ola, O. The Challenge of Big Data in Public Helth: An Opportunity for Visual Analytics. Online J. Public Health Inform. 2014, 5, 223. [Google Scholar] [CrossRef] [Green Version]
  3. Sedig, K.; Parsons, P. Design of Visualizations for Human-Information Interaction: A Pattern-Based Framework. Synth. Lect. Vis. 2016, 4, 1–185. [Google Scholar] [CrossRef] [Green Version]
  4. Ramanujan, D.; Chandrasegaran, S.K.; Ramani, K. Visual Analytics Tools for Sustainable Lifecycle Design: Current Status, Challenges, and Future Opportunities. J. Mech. Des. 2017, 139, 111415. [Google Scholar] [CrossRef] [PubMed]
  5. Golitsyna, O.L.; Maksimov, N.V.; Monankov, K.V. Focused on Cognitive Tasks Interactive Search Interface. Procedia Comput. Sci. 2018, 145, 319–325. [Google Scholar] [CrossRef]
  6. Ninkov, A.; Sedig, K. VINCENT: A Visual Analytics System for Investigating the Online Vaccine Debate. Online J. Public Health Inform. 2019, 11, e5. [Google Scholar] [CrossRef] [PubMed] [Green Version]
  7. Demelo, J.; Parsons, P.; Sedig, K. Ontology-Driven Search and Triage: Design of a Web-Based Visual Interface for MEDLINE. JMIR Med. Inform. 2017, 5, e4. [Google Scholar] [CrossRef] [PubMed]
  8. Ola, O.; Sedig, K. Beyond Simple Charts: Design of Visualizations for Big Health Data. Online J. Public Health Inform. 2016, 8, e195. [Google Scholar] [CrossRef] [PubMed] [Green Version]
  9. Boschee, E.; Barry, J.; Billa, J.; Freedman, M.; Gowda, T.; Lignos, C.; Palen-Michel, C.; Pust, M.; Khonglah, B.K.; Madikeri, S.; et al. Saral: A Low-resource cross-lingual domain-focused information retrieval system for effective rapid document triage. In Proceedings of the 57th Annual Meeting of the Association for Computational Linguistics: System Demonstrations, Florence, Italy, 28 July–2 August 2019; pp. 19–24. [Google Scholar]
  10. Talbot, J.; Lee, B.; Kapoor, A.; Tan, D.S. EnsembleMatrix: Interactive Visualization to Support Machine Learning with Multiple Classifiers. In Proceedings of the 27th International Conference on Human Factors in Computing Systems, Boston, MA, USA, 4–9 April 2009; p. 1283. [Google Scholar]
  11. Hohman, F.; Kahng, M.; Pienta, R.; Chau, D.H. Visual Analytics in Deep Learning: An Interrogative Survey for the Next Frontiers. IEEE Trans. Vis. Comput. Graph. 2018, 25, 2674–2693. [Google Scholar] [CrossRef]
  12. Yuan, J.; Chen, C.; Yang, W.; Liu, M.; Xia, J.; Liu, S. A Survey of Visual Analytics Techniques for Machine Learning. Comput. Vis. Media 2020, 7, 3–36. [Google Scholar] [CrossRef]
  13. Endert, A.; Ribarsky, W.; Turkay, C.; Wong, B.L.W.; Nabney, I.; Blanco, I.D.; Rossi, F. The State of the Art in Integrating Machine Learning into Visual Analytics. Comput. Graph. Forum 2017, 36, 458–486. [Google Scholar] [CrossRef]
  14. Harvey, M.; Hauff, C.; Elsweiler, D. Learning by Example: Training Users with High-quality Query Suggestions. In Proceedings of the 38th International ACM SIGIR Conference on Research and Development in Information Retrieval, New York, NY, USA, 9–13 August 2015; pp. 133–142. [Google Scholar]
  15. Huurdeman, H.C. Dynamic Compositions: Recombining Search User Interface Features for Supporting Complex Work Tasks. CEUR Workshop Proc. 2017, 1798, 22–25. [Google Scholar]
  16. Chuang, J.; Ramage, D.; Manning, C.; Heer, J. Interpretation and Trust: Designing Model-driven Visualizations for Text Analysis. In Proceedings of the SIGCHI Conference on Human Factors in Computing Systems, Austin, TX, USA, 5–10 May 2012; pp. 443–452. [Google Scholar]
  17. Zeng, Q.T.; Tse, T. Exploring and Developing Consumer Health Vocabularies. J. Am. Med. Inform. Assoc. 2006, 13, 24–29. [Google Scholar] [CrossRef] [PubMed]
  18. Khan, S.; Kanturska, U.; Waters, T.; Eaton, J.; Bañares-Alcántara, R.; Chen, M. Ontology-assisted Provenance Visualization for Supporting Enterprise Search of Engineering and Business Files. Adv. Eng. Inform. 2016, 30, 244–257. [Google Scholar] [CrossRef]
  19. Saleemi, M.M.; Rodríguez, N.D.; Lilius, J.; Porres, I. A Framework for Context-aware Applications for Smart Spaces. In Smart Spaces and Next Generation Wired/Wireless Networking; Springer: Berlin/Heidelberg, Germany, 2011; Volume 6869, pp. 14–25. ISBN 9783642228742. [Google Scholar]
  20. Huurdeman, H.C.; Wilson, M.L.; Kamps, J. Active and passive utility of search interface features in different information seeking task stages. In Proceedings of the 2016 ACM on Conference on Human Information Interaction and Retrieval, Chapel Hill, NC, USA, 13–17 March 2016; pp. 3–12. [Google Scholar]
  21. Wu, C.M.; Meder, B.; Filimon, F.; Nelson, J.D. Asking Better Questions: How Presentation Formats Influence Information Search. J. Exp. Psychol. Learn. Mem. Cogn. 2017, 43, 1274–1297. [Google Scholar] [CrossRef] [PubMed]
  22. Herceg, P.M.; Allison, T.B.; Belvin, R.S.; Tzoukermann, E. Collaborative Exploratory Search for Information Giltering and Large-scale Information Triage. J. Assoc. Inf. Sci. Technol. 2018, 69, 395–409. [Google Scholar] [CrossRef]
  23. Badi, R.; Bae, S.; Moore, J.M.; Meintanis, K.; Zacchi, A.; Hsieh, H.; Shipman, F.; Marshall, C.C. Recognizing User Interest and Document Value from Reading and Organizing Activities in Document Triage. In Proceedings of the 11th International Conference on Intelligent User Interfaces, Sydney, Australia, 29 January–1 February 2006; p. 218. [Google Scholar]
  24. Bae, S.; Kim, D.; Meintanis, K.; Moore, J.M.; Zacchi, A.; Shipman, F.; Hsieh, H.; Marshall, C.C. Supporting Document Triage via Annotation-based Multi-application Visualizations. In Proceedings of the 10th ACMIEEECS Joint Conference on Digital Libraries, Queensland, Australia, 21–25 June 2010; pp. 177–186. [Google Scholar]
  25. Buchanan, G.; Owen, T. Improving Skim Reading for Document Triage. In Proceedings of the Second International Symposium on Information Interaction in Context, London, UK, 14–17 October 2008; p. 83. [Google Scholar]
  26. Loizides, F.; Buchanan, G.; Mavri, K. Theory and Practice in Visual Interfaces for Semi-structured Document Discovery and Selection. Inf. Serv. Use 2016, 35, 259–271. [Google Scholar] [CrossRef] [Green Version]
  27. Vamathevan, J.; Clark, D.; Czodrowski, P.; Dunham, I.; Ferran, E.; Lee, G.; Li, B.; Madabhushi, A.; Shah, P.; Spitzer, M. Applications of Machine Learning in Drug Discovery and Development. Nat. Rev. Drug Discov. 2019, 18, 463–477. [Google Scholar] [CrossRef]
  28. Wei, J.; Chu, X.; Sun, X.; Xu, K.; Deng, H.; Chen, J.; Wei, Z.; Lei, M. Machine Learning in Materials Science. InfoMat 2019, 1, 338–358. [Google Scholar] [CrossRef]
  29. Wang, J.; Li, M.; Diao, Q.; Lin, H.; Yang, Z.; Zhang, Y.J. Biomedical document triage using a hierarchical attention-based capsule network. BMC Bioinform. 2020, 21, 380. [Google Scholar] [CrossRef]
  30. Holzinger, A. Knowledge Discovery and Data Mining in Biomedical Informatics: The Future is in Integrative, Interactive Machine Learning Solutions. In Interactive Knowledge Discovery and Data Mining in Biomedical Informatics; Springer: Berlin/Heidelberg, Germany, 2014; Volume 8401. [Google Scholar]
  31. Fiebrink, R.; Cook, P.R.; Trueman, D. Human Model Evaluation in Interactive Supervised Learning. In Proceedings of the 2011 Annual Conference on Human Factors in Computing Systems, Vancouver, BC, Canada, 7–12 May 2011; p. 147. [Google Scholar]
  32. Dey, A. Machine Learning Algorithms: A Review. Int. J. Comput. Sci. Inf. Technol. 2016, 7, 1174–1179. [Google Scholar]
  33. Celebi, M.E.; Aydin, K. Unsupervised Learning Algorithms; Springer: Berlin, Germany, 2016; ISBN 3319242113. [Google Scholar]
  34. Sun, G.; Lv, H.; Wang, D.; Fan, X.; Zuo, Y.; Xiao, Y.; Liu, X.; Xiang, W.; Guo, Z. Visualization analysis for business performance of chinese listed companies based on gephi. Comput. Mater. Contin. 2020, 63, 959–977. [Google Scholar]
  35. Sacha, D.; Sedlmair, M.; Zhang, L.; Lee, J.A.; Weiskopf, D.; North, S.; Keim, D. Human-centered Machine Learning Through Interactive Visualization: Review and Open Challenges. In Proceedings of the ESANN 2016 24th European Symposium on Artificial Neural Networks, Computational Intelligence and Machine Learning, Bruges, Belgium, 27–29 April 2016; pp. 641–646. [Google Scholar]
  36. Hoeber, O. Visual Search Analytics: Combining Machine Learning and Interactive Visualization to Support Human-Centred Search. In Proceedings of the Beyond Single-Shot Text Queries: Bridging the Gap(s) Between Research Communities, Berlin, Germany, 4 March 2014; pp. 37–43. [Google Scholar]
  37. Holzinger, A. Interactive Machine Learning for Health Informatics: When Do We Need the Human-in-the-loop? Brain Inform. 2016, 3, 119–131. [Google Scholar] [CrossRef] [PubMed] [Green Version]
  38. Tresp, V.; Marc Overhage, J.; Bundschus, M.; Rabizadeh, S.; Fasching, P.A.; Yu, S. Going Digital: A Survey on Digitalization and Large-Scale Data Analytics in Healthcare. Proc. IEEE 2016, 104, 2180–2206. [Google Scholar] [CrossRef] [Green Version]
  39. Mehta, N.; Pandit, A. Concurrence of Big Data Analytics and Healthcare: A Systematic Review. Int. J. Med. Inform. 2018, 114, 57–65. [Google Scholar] [CrossRef] [PubMed]
  40. Arp, R.; Smith, B.; Spear, A.D. American Journal of Sociology. In Building Ontologies with Basic Formal Ontology; Mit Press: Cambridge, MA, USA, 2015; Volume 53, ISBN 0262527812. [Google Scholar]
  41. Xing, Z.; Wang, L.; Xing, W.; Ren, Y.; Li, T.; Xia, J. Application of Ontology in the Web Information Retrieval. J. Big Data 2019, 1, 79–88. [Google Scholar] [CrossRef]
  42. Gruber, T.R. Technical Report KSL 92-71 Revised April 1993 A Translation Approach to Portable Ontology Specifications by A Translation Approach to Portable Ontology Specifications. Knowl. Creat. Diffus. Util. 1993, 5, 199–220. [Google Scholar]
  43. Jusoh, S.; Awajan, A.; Obeid, N. The Use of Ontology in Clinical Information Extraction. J. Phys. Conf. Ser. 2020, 1529, 052083. [Google Scholar] [CrossRef]
  44. Lytvyn, V.; Dosyn, D.; Vysotska, V.; Hryhorovych, A. Method of Ontology Use in OODA. In Proceedings of the 2020 IEEE Third International Conference on Data Stream Mining & Processing, Lviv, Ukraine, 21–25 August 2020; pp. 409–413. [Google Scholar]
  45. Román-Villarán, E.; Pérez-Leon, F.P.; Escobar-Rodriguez, G.A.; Martínez-García, A.; Álvarez-Romero, C.; Parra-Calderóna, C.L. An Ontology-based Personalized Decision Support System for Use in the Complex Chronically Ill Patient. Stud. Health Technol. Inform. 2019, 264, 758–762. [Google Scholar]
  46. Spoladore, D.; Colombo, V.; Arlati, S.; Mahroo, A.; Trombetta, A.; Sacco, M. An ontology-based framework for a telehealthcare system to foster healthy nutrition and active lifestyle in older adults. Electronics 2021, 10, 2129. [Google Scholar] [CrossRef]
  47. Sherimon, P.C.; Krishnan, R. OntoDiabetic: An Ontology-Based Clinical Decision Support System for Diabetic Patients. Arab. J. Sci. Eng. 2016, 41, 1145–1160. [Google Scholar] [CrossRef]
  48. Spoladore, D.; Pessot, E. Collaborative ontology engineering methodologies for the development of decision support systems: Case studies in the healthcare domain. Electronics 2021, 10, 1060. [Google Scholar] [CrossRef]
  49. Simperl, E.P.B.; Tempich, C. Ontology engineering: A reality check. In OTM Confederated International Conferences” On the Move to Meaningful Internet Systems”; Springer: Berlin/Heidelberg, Gremany, 2006; Volume 4275, pp. 836–854. [Google Scholar]
  50. Jakus, G.; Milutinovic, V.; Omerović, S.; Tomazic, S. Concepts, Ontologies, and Knowledge Representation; Springer: New York, NY, USA, 2013; ISBN 978-1-4614-7821-8. [Google Scholar]
  51. Rector, A.; Schulz, S.; Rodrigues, J.M.; Chute, C.G.; Solbrig, H. On beyond Gruber: “Ontologies” in Today’s Biomedical Information Systems and the Limits of OWL. J. Biomed. Inform. X 2019, 2, 100002. [Google Scholar] [CrossRef] [PubMed]
  52. Tobergte, D.R.; Curtis, S. A Survey on Ontologies for Human Behavior Recognition. J. Chem. Inf. Model. 2013, 53, 1689–1699. [Google Scholar]
  53. Katifori, A.; Torou, E.; Vassilakis, C.; Lepouras, G.; Halatsis, C. Selected Results of a Comparative Study of Four Ontology Visualization Methods for Information Retrieval Tasks. In Proceedings of the Second International Conference on Research Challenges in Information Science, Marrakech, Morocco, 3–6 June 2008; pp. 133–140. [Google Scholar]
  54. Springer, A.; Whittaker, S. Progressive Disclosure: Designing for Effective Transparency. arXiv 2018, arXiv:1811.02164. [Google Scholar]
  55. William, L.; Kritina Holden, J.B. Progressive Disclosure. In Universal Principles of Design; Rockport Publishers: Beverly, MA, USA, 2010; pp. 188–189. ISBN 978-1592535873. [Google Scholar]
  56. Soldaini, L.; Yates, A.; Yom-Tov, E.; Frieder, O.; Goharian, N. Enhancing Web Search in the Medical Domain via Query Clarification. Inf. Retr. Boston. 2016, 19, 149–173. [Google Scholar] [CrossRef]
  57. Anderson, J.D.; Wischgoll, T. Visualization of Search Results of Large Document Sets. Electron. Imaging 2020, 2020, 388-1–388-7. [Google Scholar] [CrossRef]
  58. Saha, D.; Floratou, A.; Sankaranarayanan, K.; Minhas, U.F.; Mittal, A.R.; Özcan, F.; Deacy, S. ATHENA: An Ontology-Driven System for Natural Language Querying over Relational Data Stores. Proc. VLDB Endow. 2016, 9, 1209–1220. [Google Scholar] [CrossRef]
  59. Munir, K.; Sheraz Anjum, M. The Use of Ontologies for Effective Knowledge Modelling and Information Retrieval. Appl. Comput. Inform. 2018, 14, 116–126. [Google Scholar] [CrossRef]
  60. Amershi, S.; Cakmak, M.; Knox, W.B.; Kulesza, T. Power to the People: The Role of Humans in Interactive Machine Learning. Ai Mag. 2014, 35, 105–120. [Google Scholar] [CrossRef] [Green Version]
  61. Cortez, P.; Embrechts, M.J. Using Sensitivity Analysis and Visualization Techniques to Open Black Box Data Mining Models. Inf. Sci. 2013, 225, 1–17. [Google Scholar] [CrossRef] [Green Version]
  62. Spence, R. Interaction. In Information Visualization; Springer: Berlin/Heidelberg, Germany, 2014; pp. 173–223. [Google Scholar]
  63. Spence, R. Sensitivity Encoding to Support Information Space Navigation: A Design Guideline. Inf. Vis. 2002, 1, 120–129. [Google Scholar] [CrossRef]
  64. Spence, R. Sensitivity, Residue and Scent. Inf. Des. J. Doc. Des. 2004, 12, 1–18. [Google Scholar] [CrossRef]
  65. Azzopardi, L.; Zuccon, G. An Analysis of the Cost and Benefit of Search Interactions. In Proceedings of the 2016 ACM International Conference on the Theory of Information Retrieval, Newark, DE, USA, 12–16 September 2016; pp. 59–68. [Google Scholar]
  66. Chandrasegaran, S.; Badam, S.K.; Kisselburgh, L.; Ramani, K.; Elmqvist, N. Integrating Visual Analytics Support for Grounded Theory Practice in Qualitative Text Analysis. Comput. Graph. Forum 2017, 36, 201–212. [Google Scholar] [CrossRef]
  67. Bostock, M. D3.js Data-Driven Documents. Available online: https://d3js.org/ (accessed on 10 May 2020).
  68. Loizides, F.; Buchanan, G. What Patrons Want: Supporting Interaction for Novice Information Seeking Scholars. In Proceedings of the 9th ACM/IEEE-CS joint conference on Digital libraries, Austin, TX, USA, 14–19 June 2009; Volume 60558. [Google Scholar]
  69. Mavri, A.; Loizides, F.; Photiadis, T.; Zaphiris, P. We Have the Content … Now What? The role of Structure and Interactivity in Academic Document Triage Interfaces. Inf. Des. J. 2013, 20, 247–265. [Google Scholar]
  70. Loizides, F. Information Seekers’ Visual Focus During Time Constraint Document Triage. In International Conference on Theory and Practice of Digital Libraries; Springer: Berlin/Heidelberg, Germany, 2012; Volume 7489, pp. 25–31. [Google Scholar]
  71. Solr Cloud. Available online: https://lucene.apache.org/solr/ (accessed on 10 May 2020).
  72. Pedregosa, F.; Varoquaux, G.; Gramfort, A.; Michel, V.; Thirion, B.; Grisel, O.; Blondel, M.; Louppe, G.; Prettenhofer, P.; Weiss, R.; et al. Scikit-learn: Machine Learning in Python. J. Mach. Learn. Res. 2012, 12, 2825–2830. [Google Scholar]
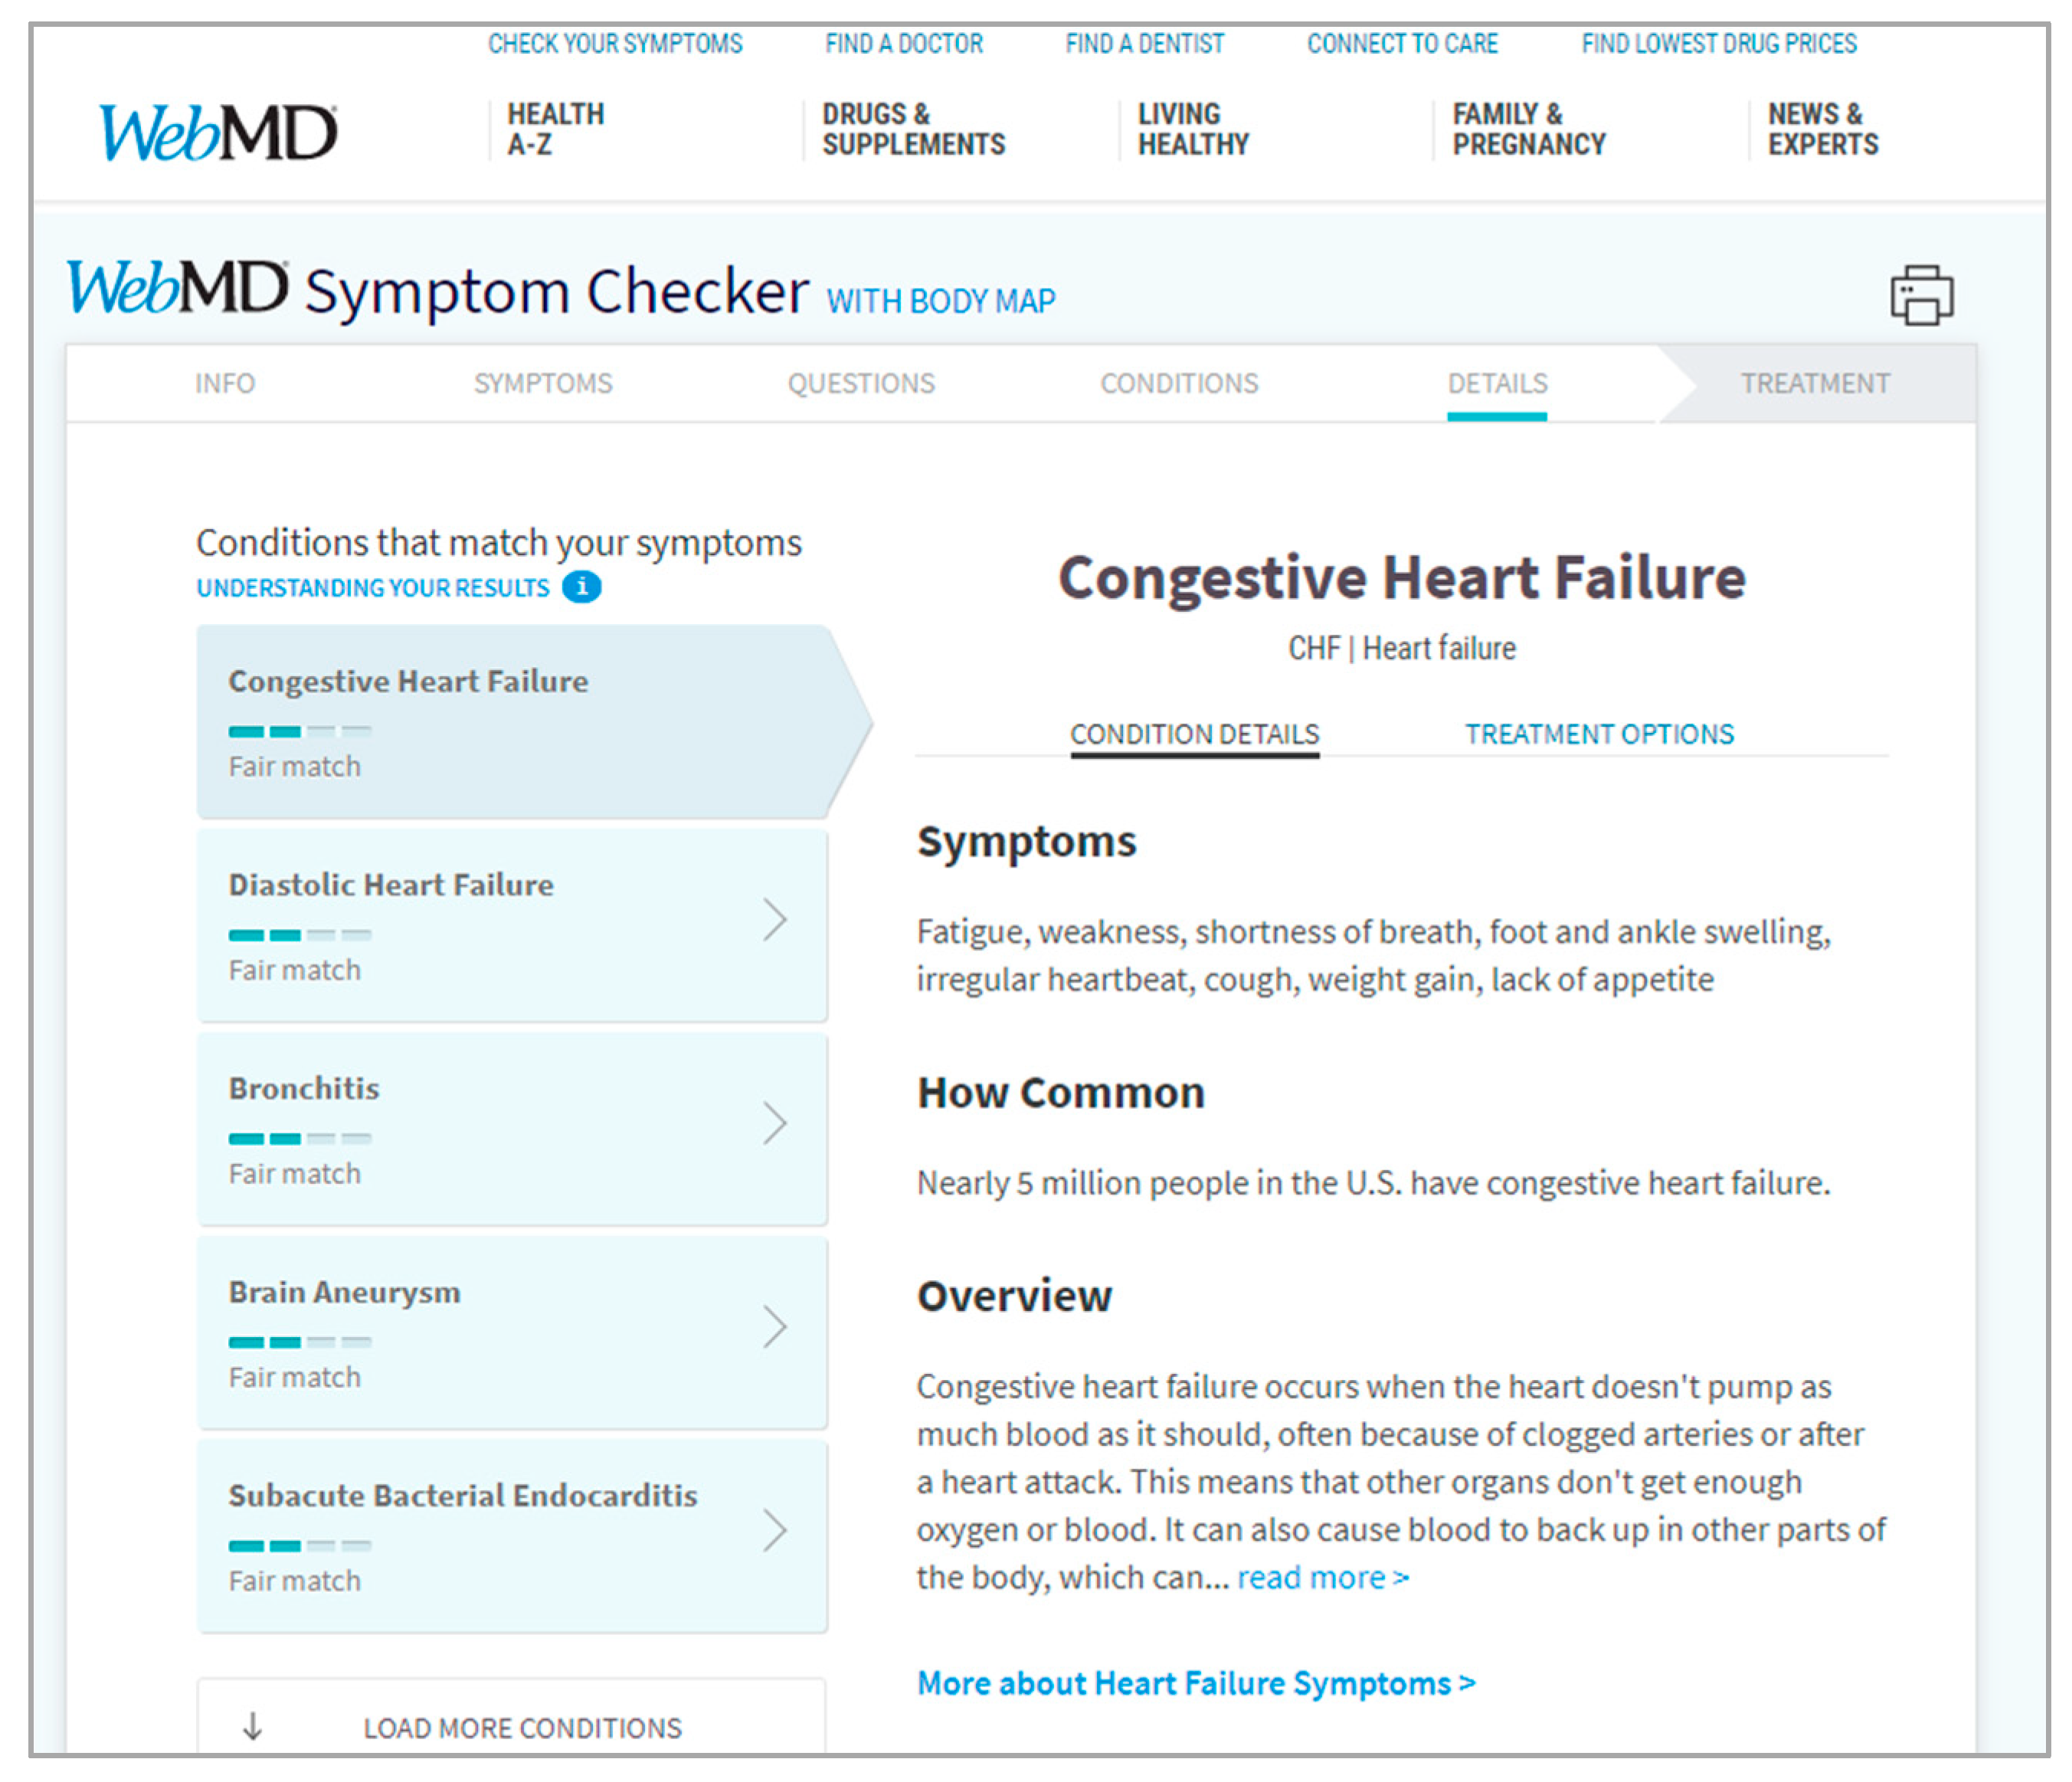
Figure 1. WebMD’s Symptom Checker Source: image generated on 18 January 2021 using the public web portal provided by WebMD, https://symptoms.webmd.com/ (accessed on 18 January 2021).
Information 13 00008 g001
Figure 2. OVERT-MED. Source: image generated on 5 July 2021 with permission courtesy of Insight Lab, Western University, London, Ontario, Canada http://insight.uwo.ca/ (accessed on 5 July 2021).
Information 13 00008 g002
Figure 3. PubMed: Source: image generated on 5 July 2021 using the public web portal provided by the National Center for Biotechnical Information, https://pubmed.ncbi.nlm.nih.gov/?term=heart (accessed on 5 July 2021).
Information 13 00008 g003
Figure 4. HockeyViz Team Assessments. Source: image generated on 21 December 2021using the public web portal provided by HockeyViz, https://hockeyviz.com/team/TOR/2122 (accessed on 21 December 2021).
Information 13 00008 g004
Figure 5. Depiction of the dynamic functional workflow of VisualQUEST.
Information 13 00008 g005
Figure 6. An overview of Query Building subview within VisualQUEST.
Information 13 00008 g006
Figure 7. Expanding a query item to assess related ontology elements.
Information 13 00008 g007
Figure 8. An overview of the Search subview within VisualQUEST.
Information 13 00008 g008
Figure 9. A preview of a search formulation that uses all query items.
Information 13 00008 g009
Figure 10. An overview of the high-level triage subview within VisualQUEST.
Information 13 00008 g010
Figure 11. High-level triage after groupings have been inspected and opened for further examination.
Information 13 00008 g011
Figure 12. A close look at high-level triage, showing a listing of documents contained within a selected grouping of the document set.
Information 13 00008 g012
Figure 13. An overview of the low-level triage subview within VisualQUEST.
Information 13 00008 g013
Figure 14. A closer view of the Selected Documents listing, where the user can see timeline-like abstraction of documents and their alignment with the search formulation.
Information 13 00008 g014
Figure 15. An overview of low-level triage after documents have been added and opened for viewing.
Information 13 00008 g015
Table 1. Search categories, keywords used to identify literature, and screening results reflected as the number of articles found.
Search CategoriesKeywordsMetadata ScreeningAbstract Screening
Information-seeking processInformation seeking model, information seeking process, and information seeking stages.Google Scholar: 95;
IEEE Xplore: 60;
Total: 155
Google Scholar: 18;
IEEE Xplore: 4;
Total: 22
Information search interfaceInformation search interface, search interface, and search interface design.Google Scholar: 90;
IEEE Xplore: 27;
Total: 117
Google Scholar: 10;
IEEE Xplore: 1;
Total: 11
Information triage interfaceInformation triage, information triage interface, document triage, and triage interface design.Google Scholar: 38;
IEEE Xplore: 3;
Total: 41
Google Scholar: 6;
IEEE Xplore: 0;
Total: 6
Ontology use within user-facing information-seeking interfacesOntology interface, ontology integration, ontology-based interface, and user-facing interfaces with ontologies.Google Scholar: 214;
IEEE Xplore: 12;
Total: 226
Google Scholar: 2;
IEEE Xplore: 0;
Total: 2
Table 2. The stages of the information-seeking and triage process: their associated task, alignment with existing models, and functional descriptions.
StageAssociated TaskAlignment with Existing ModelsFunctional Descriptions
Query buildingInformation searchPre-focus (initiation, selection, exploration)Users communicate their information-seeking objectives via the tool’s interface.
SearchInformation searchFocus formulation (formulation)Users specify the formulation of their search and, when satisfied, initiate the performance of computational search.
High-level triageInformation triageLow-specificity post-formulation (collection and presentation)Users encounter sets of similar information entities generated from computational search, make initial high-level assessments of general alignment with information-seeking objectives, and direct further triaging encounters.
Low-level triageInformation triageHigh-specificity post-formulation (collection and presentation)Users encounter individual information entities previously encountered in high-level triage to perform final, low-level assessments of relevance to information-seeking objectives.
Table 3. The set of criteria for designing VAT interfaces for searching and triaging large document sets. For reference within discussion, a numerical value is assigned to each criterion. Each DC# describes the design criteria and provides an integration classification and examples of potential uses of ontologies within user-facing information seeking interfaces.
Design CriteriaIntegrationPotential Uses of Ontologies within User-Facing Interfaces
1Use progressive disclosure when sequencing the stages of the information-seeking process.All stagesOntology entities and relations can be consistent and transparent guideposts between stages, particularly for non-active stages which must be pruned of unnecessary elements.
2Attune users to the characteristics and domain of the document set before beginning search formulation.Query buildingOntology entities and relations can promote the characteristics and domain of document sets.
3Be cognizant of users’ domain expertise.Query buildingOntology entities and relations can provide a bridge between task vocabularies and the common vocabularies of non-expert users, as well as previously formed domain vocabularies of expert users.
4Create search formulation and refinement environments supplemented by query building.SearchOntology entities and relations can be useful within interface elements that suggest expansions and refinements to their search formulation.
5Leverage sensitivity encoding when previewing the document set mappings of search formulations.SearchOntology entities and relations can be useful sensitivity encoded displays, which can suggest refinement opportunities for re-aligning their search formulation to the document set being searched and information-seeking objectives.
6Present overview displays which arrange and compare document groupings using shared characteristics.High-level triageOntology entities and relations can be useful in abstraction, such as locating shared document characteristics and when forming document groupings.
7Utilize non-linear inspection flows which support actions for traversing, previewing, contrasting, and judging relevance.High-level triageOntology entities and relations can help users connect to and assess the general characteristics and contents of a document grouping, allowing them to inspect, assess, and judge relevance on multiple documents at a time.
8Offer document-level displays that allow users to apply domain expertise during relevance decision making.Low-level triageOntology entities and relations can be useful for directing summation and annotation actions, as well as provide familiar cues for interactions like sorting and relevance judgment.
9Persist relevance decision-making results externally to allow for repeat information-seeking sequences.Low-level triageOntology entities and relations can be useful for indexing document selections as well as for recordkeeping users’ prior search and triage sequences.
10Allow users to encounter search results without a demand for immediate appraisal.All triageOntology entities and relations can help direct search formulation previews and the results of a full mapping of the document set, allowing users to quickly associate their predictions against search results.
11Promote positive feedback over negative feedback.All stagesOntology entities and relations can provide familiar cues to direct positive feedback interactions within information-seeking sequences.
Table 4. General description of tasks (T1 … T7) performed during formative evaluations.
Target StageTask Description
T1Query buildingConsider two terms and contrast their rate of occurrence within the document set.
T2Query buildingConsider a term and determine its alignment with a set of provided definitions.
T3SearchConsider how provided set of terms aligns with the document set, both individually and in combinations.
T4High-level triageWithout opening a specific document, predict its alignment to a provided set of terms.
T5High-level triageWithout opening a specific pair of documents, compare and predict which of them would contain a higher rate of occurrence of a specific term.
T6Low-level triageGiven a specific document, count and order the rate of occurrences of a provided set of terms within that document.
T7Multi-stageGiven a domain research question, using all stages and available functionalities of the interface, produce five relevant documents from the document set.
Publisher’s Note: MDPI stays neutral with regard to jurisdictional claims in published maps and institutional affiliations.