Article

Evaluating the Impact of Integrating Similar Translations into Neural Machine Translation

1
LT³ Language and Translation Technology Team, Faculty of Arts and Philosophy, Ghent University, Groot-Brittanniëlaan 45, B-9000 Ghent, Belgium
2
Centre for Computational Linguistics, KU Leuven, B-3000 Leuven, Belgium
*
Author to whom correspondence should be addressed.
Information 2022, 13(1), 19; https://doi.org/10.3390/info13010019
Submission received: 3 December 2021 / Revised: 23 December 2021 / Accepted: 28 December 2021 / Published: 4 January 2022
(This article belongs to the Special Issue Machine Translation for Conquering Language Barriers)

Abstract

:
Previous research has shown that simple methods of augmenting machine translation training data and input sentences with translations of similar sentences (or fuzzy matches), retrieved from a translation memory or bilingual corpus, lead to considerable improvements in translation quality, as assessed by a limited set of automatic evaluation metrics. In this study, we extend this evaluation by calculating a wider range of automated quality metrics that tap into different aspects of translation quality and by performing manual MT error analysis. Moreover, we investigate in more detail how fuzzy matches influence translations and where potential quality improvements could still be made by carrying out a series of quantitative analyses that focus on different characteristics of the retrieved fuzzy matches. The automated evaluation shows that the quality of NFR translations is higher than the NMT baseline in terms of all metrics. However, the manual error analysis did not reveal a difference between the two systems in terms of total number of translation errors; yet, different profiles emerged when considering the types of errors made. Finally, in our analysis of how fuzzy matches influence NFR translations, we identified a number of features that could be used to improve the selection of fuzzy matches for NFR data augmentation.

1. Introduction

Machine translation (MT) systems are routinely evaluated using a restricted set of automated quality metrics, especially at early stages of development [1,2]. This was not different for neural fuzzy repair (NFR) [3,4,5], an MT data augmentation method that relies on the retrieval of translations of similar sentences, called fuzzy matches (FMs), from a translation memory (TM) or bilingual corpus. Using mainly BLEU [6], a metric quantifying the degree of exact overlap between MT output and a reference translation, substantial quality improvements were demonstrated between NFR systems and strong neural machine translation (NMT) baselines. This difference in terms of BLEU score was, arguably, consistent (across language pairs and data sets) and large enough to be interpreted as a strong indication that NFR can lead to translations of better quality. However, considering that BLEU scores only target one specific component of translation quality, this study intends to provide a more detailed and varied analysis of how the NFR output compares to the output of a baseline NMT system. Our aim is two-fold; not only do we want to obtain a better picture of the quality of translations produced with NFR, we also hope to gain more insight into how NFR leads to better translation quality and to identifying patterns that can be exploited to further improve the system.
It can be argued that different translation tasks and contexts require different definitions of translation quality, as well as distinct evaluation techniques [7]. In this study, we focus on a specific translation context, namely, the European institutions, and the Commission in particular. At the Commission’s Directorate-General for Translation (DGT), the translation quality requirements are very high, as the translated texts are often legally binding, politically sensitive, confidential and/or important for the image of the institutions [8]. This also means that consistency and exact lexical choices are often important factors contributing to translation quality next to, for example, meaning preservation and morpho-syntactic well-formedness.
Different methods were applied to extend the evaluation of the NFR output: (a) we calculated a wider range of automated quality estimation metrics targeting different aspects of translation quality, (b) we analysed required edit operations (to bring the MT output in line with the reference translation) for different fuzzy match ranges and different word classes and (c) we performed a fine-grained error analysis to establish the error profiles of the MT systems. Additionally, we zoomed in on the role that the retrieved FMs play in the NFR input and output and tried to identify FM-related features that can explain differences in quality between the NFR system and the NMT baseline, and that thus potentially can be used to further improve the NFR system.
We present the background to the study in Section 2, before introducing the study itself with the research questions (Section 3). The methodology is described in Section 4, followed by the results (Section 5) and their discussion (Section 6). In the final part, we formulate the conclusions (Section 7).

2. Research Background

In this section, we provide background related to the integration of similar translations into MT (Section 2.1) and the evaluation of MT quality and translation errors (Section 2.2).

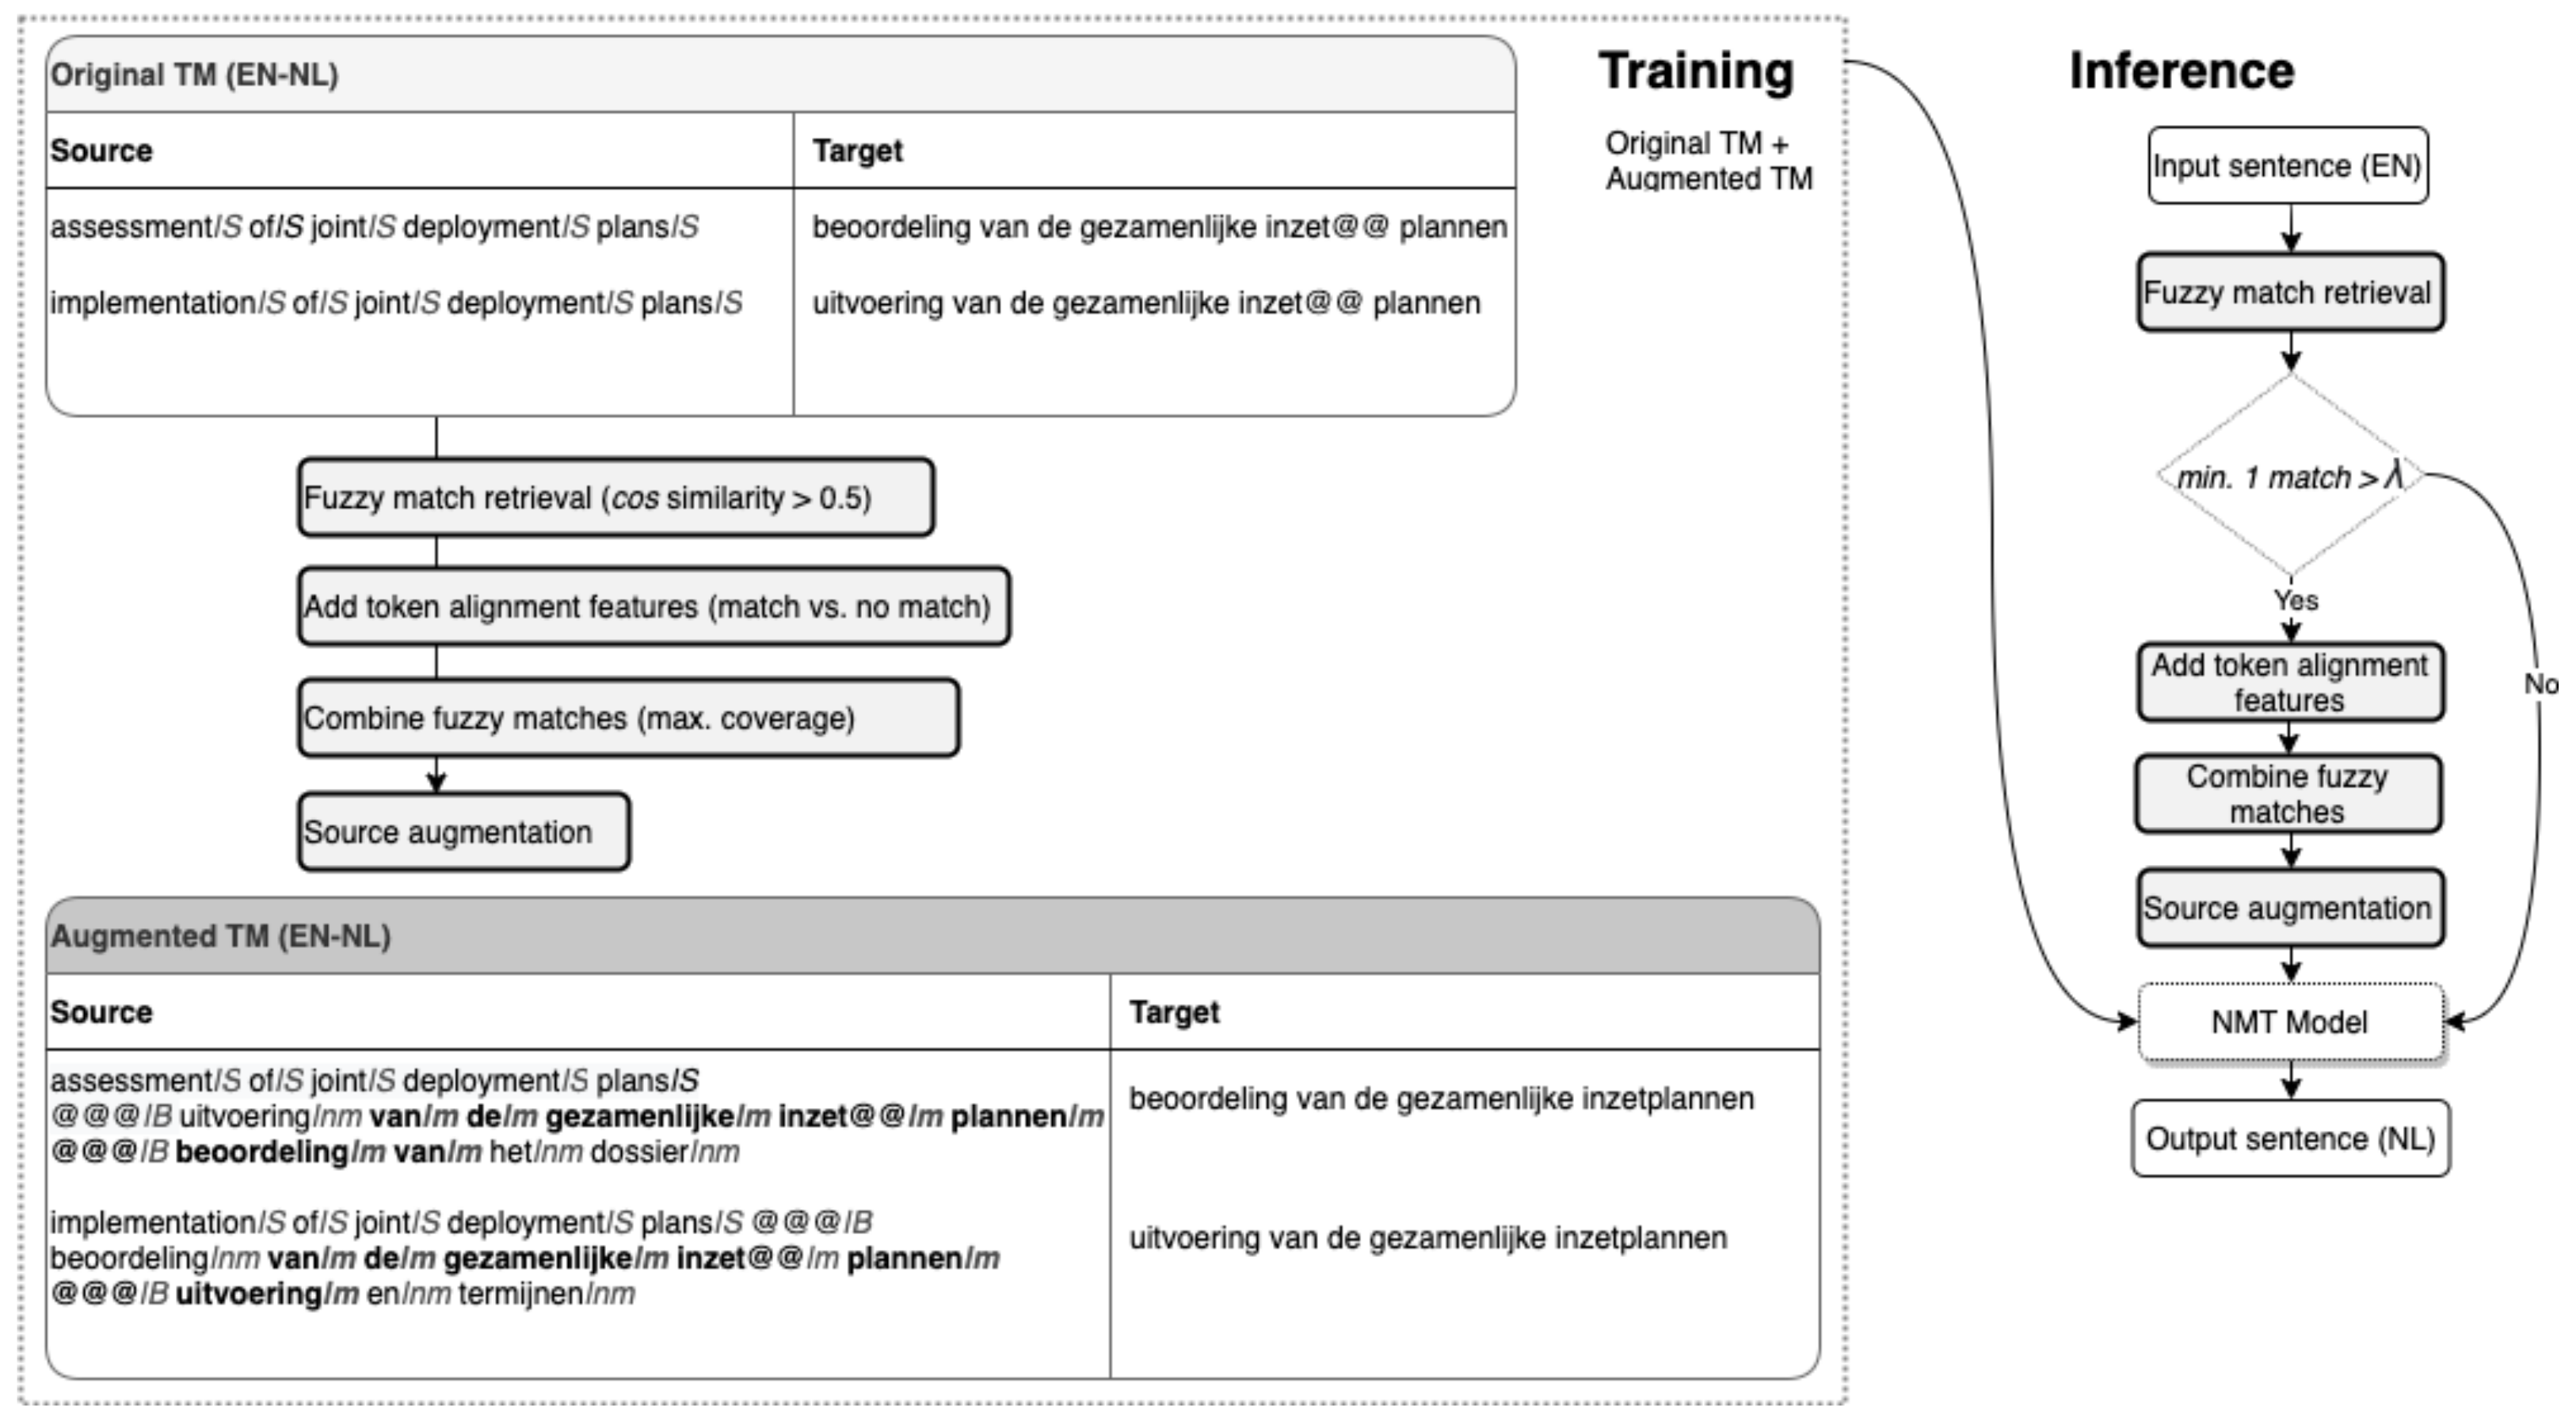
2.1. TM–MT Integration

TMs are widely used in translation workflows [9], since they aid translators with finding existing translations of similar sentences. Easy access to existing translations is not only useful for speeding up the translation process, but also, for example, to ensure (terminological) consistency. In order to retrieve FMs, a wide range of automated metrics has been used, such as (token) edit distance [10,11], percentage overlap [12], vector similarity [13] and MT evaluation metrics (see Section 2.2) [14]. In recent years, MT has been claiming an increasingly prominent place in computer-assisted-translation (CAT) workflows [15,16,17], alongside TMs. MT output is typically presented to translators in case no sufficiently similar translation is retrieved from the TM [18]. In spite of recent advances in the overall quality of MT, professional translators still have more confidence in translations retrieved from a TM than in MT output, for example, due to the unpredictability of MT errors [19,20].
For over twenty years, attempts have been made to combine the advantages of TMs and MT. Different integration methods were proposed in the context of various MT paradigms [21,22,23,24]. Recent approaches have focused on integrating TM matches, or similar translations in general, in NMT models [25,26,27,28]. In this study, we focus on a simple approach to TM–NMT integration, neural fuzzy repair (NFR), that relies on source sentence augmentation through the concatenation of translations of similar source sentences retrieved from a TM [3]. This method has been shown to work well with the Transformer architecture [29], with the FM retrieval being based on the cosine similarity of sentence embeddings [4,5]. In this paper, we do not focus on comparing different TM–MT integration methods, but rather on evaluating one NFR configuration that was shown to perform well in a previous study, using BLEU as evaluation metric [4]. The NFR system evaluated in this study is presented in more detail in Section 4.2.
The data augmentation method used in NFR, which was inspired by work conducted in automated post-editing [30] and multi-source translation [31], has been shown to also yield promising results in other fields, such as text generation [32] and code summarization [33]. In the context of MT, it has also proven to be helpful in domain adaptation [5], increasing data robustness [34] and specialised translation tasks [35]. Another interesting line of related research focuses on combining NMT with similar sentences retrieved from a monolingual corpus [36].
Thus far, the evaluation of the NFR method has relied exclusively on a restricted set of automated quality metrics. In this study, our aim is to also target other aspects of translation quality. Considering that this data augmentation method is gaining some ground in the field of MT, as well as in different NLP domains, a more extensive evaluation seems warranted. In the next section, we discuss the notion of MT quality in more general terms.

2.2. Quality Assessment of MT

Translation quality remains, to a certain extent, an elusive concept [1,37]. There are many possible answers to the question of what makes something a “good” translation. Theoretically speaking, translation quality is clearly a multidimensional and multicomponent construct, that can be approached from different theoretical and practical angles [38,39]. Moreover, different types of translation tasks and contexts potentially require different definitions of quality, rendering its evaluation even more complex [7]. In an attempt to increase the objectivity and feasibility of quality evaluation, a basic distinction is often made between the accuracy (or adequacy) and fluency (or acceptability) of translations [40,41]. Broadly speaking, accuracy is concerned with the extent to which the source content and meaning are retained in the translation. Fluency, on the other hand, refers to whether a translation is well-formed, regardless of its meaning. Other researchers have operationalised MT quality in terms of concepts such as readability, comprehensibility and usability, as well as style and register [1,37].
In research practice, MT quality has been assessed in two broad ways, i.e., (a) by relying on automated metrics and (b) by performing human evaluation. These two approaches are described in the following sections.

2.2.1. Automatic Quality Assessment

A look at almost any MT-related research paper shows that automated metrics for quality estimation are very much at the core of MT research. Not least because they are extremely practical to use, they play a central role in system development and selection, as well as overall evaluation. A key characteristic of almost all of these metrics is that they rely on a (human-produced) reference translation, most often by calculating the similarity between MT output and this gold standard [1].
The various metrics that exist differ with regard to the approach they take to measuring the similarity between the MT output and the reference translation. Whereas certain metrics are based on n-gram precision (e.g., BLEU, METEOR [42] and NIST [43]) or n-gram F-score (e.g., chrF [44]), others compute edit distance (e.g., TER [45]). On the other hand, more recently developed measures are often based on calculating the similarity of vector representations (e.g., BERTScore [46] and COMET [47]). The metrics also differ with regard to their unit of measurement; some consider token strings (e.g., BLEU, METEOR and TER), other character strings (e.g., chrF), while others use token or sentence embeddings (e.g., BERTScore and COMET). Some metrics have also been optimised for certain evaluation tasks. COMET, for example, was trained on predicting different types of human judgements in the form of post-editing effort, direct assessment or translation error analysis [47].
It can be argued that these measures capture a combination of translation accuracy and fluency, with some metrics being more oriented towards the former (e.g., BLEU) and others towards the latter (e.g., BERTScore) [48]. Because of their different design, the measures thus target different aspects of translation quality. For example, whereas exact token-based metrics (such as BLEU) measure the amount of lexical overlap (i.e., presence of identical sequences of tokens) with the reference translation, some accept grammatical variation by either looking for overlap in characters (chrF), or by evaluating word lemmas instead of tokens (METEOR). Semantic variability can also be taken into account to a certain extent by accepting synonyms (METEOR). Measures based on vector representations can be argued to also measure semantic similarity, as they do not compare strings of tokens or characters, but rather multidimensional vector representations that are claimed to encode semantic information [49]. Metrics that focus on edit distance, on the other hand, explicitly target the edit operations required to bring the MT output in line with a reference translation. Related to this, it has also been proposed to compare the syntactic structure of MT output and reference translations by calculating the edit distance between syntactic labels. One such approach, dependency-tree edit distance (DTED), uses labels derived from dependency parsing [50]. By targeting syntactic labels rather than word tokens, this approach is concerned with syntactic rather than lexical or semantic accuracy.
The metrics that are used in this study all rely on a comparison with a reference translation (see Section 4.3.1 for more details). Next to such reference-based evaluation metrics, some studies have also employed measures that target other aspects of MT quality. In fact, the automated evaluation of MT quality without using reference translations could be seen as a goal in itself. A detailed discussion of this task, which is commonly referred to as MT quality estimation (QE) [51], falls outside the scope of the current study.
Even though, practically speaking, automated evaluation is fast(er) and less costly than human evaluation, theoretically speaking, it is almost universally acknowledged as being inferior to human evaluation. As a result, the main goal of automated quality metrics is to resemble human evaluation as closely as possible. Therefore, a “good” quality metrics is often defined as a metric that correlates well with human ratings and is able to mimic human judgements [52,53,54].

2.2.2. Manual Quality Assessment

Among the various human evaluation methods that have been developed, three approaches have become well-established standards in the field, namely, (a) direct assessment (DA) and/or ranking of MT output, (b) measuring of technical and temporal post-editing effort (PEE) and (c) translation error analysis. In ranking, multiple MT outputs are simply ordered by human assessors based on their quality [55]. DA consists of collecting human assessments of a given translation in terms of how adequately it expresses the meaning of the corresponding source text or a reference translation on an analogue rating scale [54,56]. PEE is often measured in terms of technical PEE (i.e., the amount of editing work involved in the post-editing process) [15,57] or temporal PEE (i.e., the time it takes to amend an MT suggestion to turn it into a high-quality translation) [58,59].
Even though all above-mentioned methods are useful for assessing MT quality for different purposes, they all fail to capture the exact nature of the errors made by an MT system and to provide reasons for a given quality assessment. For this reason, error analysis, which consists of detecting, categorizing and marking errors in machine-translated text, has emerged as a crucial human quality assessment technique, especially when it comes to identifying specific translation issues and carrying out diagnostic and comparative evaluations of translations [60,61]. A variety of MT error taxonomies has been proposed in the literature. They can be grouped as follows: (a) taxonomies that use common error categories as a basis, such as omissions, word order errors, incorrect words, unknown words and punctuation errors [61,62]; (b) linguistically-motivated taxonomies, which classify the MT errors into different linguistic levels, such as the orthographic, lexical and semantic levels [63,64]; and (c) fine-grained, hierarchical error taxonomies, that take the distinction between accuracy (or adequacy) and fluency as a basis for translation error classification [65,66].
While fine-grained error analysis is at the core of understanding the relationship between translation errors and quality, it is also labour- and time-intensive and classification of the errors in MT output is by no means unambiguous [66,67]. In order for the findings to be reliable, it should be possible to apply an error analysis task consistently by multiple assessors, yielding a high inter-annotator agreement (IAA) [68]. Fine-grained error analysis has been applied to different MT architectures and it is still a common MT quality assessment technique that allows us to identify the strengths and weaknesses of NMT systems, for example, for different domains and language pairs [67,69,70,71]. To our knowledge, NFR output, or that of similar TM–NMT integration systems, has not been analysed yet in terms of the types of errors it contains. However, such an exercise could shed more light on how the error profile of an NMT system changes when similar translations are integrated in its input. In this study, we used the hierarchical SCATE MT error taxonomy, described in more detail in Section 4.4.1, to evaluate and compare the translations produced by the NFR and a baseline NMT system.

3. The Current Study

The aim of this study is to provide a more thorough evaluation of the best-performing NFR system according to previous evaluations [4] by comparing its output to that of a baseline NMT system. In doing so, we hope to identify the strengths and weaknesses of the NFR system and the types of changes in translation quality relative to the baseline NMT system, as well as potential areas for further improvement of this data augmentation method for NMT. Our research questions are as follows:
  • RQ1: How does the quality of NFR output compare to that of a baseline NMT system in terms of (a) semantic, syntactic and lexical similarity to a reference translation, as measured by automated quality metrics; and (b) the types and number of edit operations required to transform the MT output into the reference translation?
  • RQ2: What types of and how many translation errors do the NFR and the baseline NMT system make? To what extent are the error profiles of the two systems different?
  • RQ3: How do fuzzy matches in NFR influence the MT output, i.e., how often do tokens in fuzzy matches appear in NFR output and in the reference translations and to what extent are these tokens aligned to tokens in the source sentence?
  • RQ4: Which factors influence NFR quality and to what extent can these factors explain the variation in quality differences between the NFR and the baseline NMT system?
The first two research questions explicitly target MT quality evaluation, while questions 3 and 4 deal with the internal workings of NFR. As will become clear in the next section, we evaluated quality in two fundamentally distinct ways, i.e., (a) automatically, by applying metrics that calculate different types of similarity between the MT output and a reference translation; and (b) manually, by annotating translation errors on the basis of the MT output and the input sentence (without access to the reference translation). We consider both approaches to be complementary here, as they target distinct, though related aspects of MT quality and rely on different types of information.
Crucially, for practical reasons, both evaluations were performed out-of-context and at the sentence level in this study. Even though this is common research practice, it is clearly not ideal [2,72], especially in the specific translation context that is investigated in this study. Yet, in spite of inherent shortcomings, we believe that a combination of both automated metrics (that rely on comparisons with reference translations) and fine-grained human error annotation (based on the source text and the MT output) can provide insights into the quality of both NMT systems, including the types and amounts of errors they make. This is also one of the reasons why we opted for human error annotation instead of ranking or scoring. Most of the quality metrics have also been shown to correlate reasonably well with human judgements [52,53,54] and some were specifically trained for this purpose [47]. With regard to measuring post-editing effort, properly conducting an experimental study is difficult and costly in the specific context under investigation here, since we would need to rely on expert translators and set up (semi-)controlled experiments involving realistic translation tasks [73]. We come back to this issue in the discussion.

4. Methodology

In this section, we describe the data sets (Section 4.1) and the NMT systems (Section 4.2) used in the study. We then provide more details on the automated quality assessment (Section 4.3) and human error annotation (Section 4.4). The subsequent sections focus on the analysis of the impact of FMs on NFR translations (Section 4.5) and the methods used for identifying features that influence NFR quality (Section 4.6).

4.1. Data

To train our NMT models, we used the TM of the European Commission’s translation service (DGT-TM), which consists of texts and their translation written for mostly legal purposes, such as contracts, reports, regulations, directives, policies and plans within the Commission [74]. The translations in this data set are verified at multiple levels to ensure that they are of high quality, with consistent use of style and terminology. We focus on translation from English into Dutch.
The training set consisted of 2.389 M sentence pairs. A total of 3000 sentences were set aside for validation and 6207 sentences for testing. The validation and test sets did not contain any sentences that also occurred in the training set (i.e., 100% matches were removed). All sentence pairs were truecased and tokenised using the Moses toolkit [75].
We extracted a subset of 300 sentences from the test set for manual error analysis, applying stratified random sampling and filtering. With the aim of ensuring that the subset contained different types of segments while being representative of the original test set, we applied the following criteria:
  • The distribution of the number of sentences in different FM ranges (based on the similarity between the input sentence and the sentence retrieved from the TM; see Section 4.2) was similar in both data sets;
  • The subset contained an equal number of sentences with different source lengths (i.e., short sentences of length 1–10 tokens, medium of length 11–25 and long with a length over 25 tokens) per FM range;
  • Segments consisting (almost exclusively) of chemical formulas, numbers or abbreviations were excluded.
Table 1 describes the test set as well as the subset used for manual analysis. We subdivided the data set into different FM ranges, since the FM score was found to have a strong impact on the quality of the resulting MT output [3]. Note that we used the score of the “best” retrieved FM per input sentence for the purpose of subdividing the data set into match ranges (i.e., the FM with the highest similarity score). A small number of sentences in the test set (18, or 0.3%) did not have any FMs with a similarity score above 50%. Such sentences were not included in the subset.
As the table shows, we somewhat overrepresented the lower match ranges in the subset (i.e., 50–89%) in order to better balance the data set. The proportion of sentences in the highest match range is 40.5% in the full test set and only 25% in the subset.

4.2. NMT Systems

For the purpose of our evaluations, we compared the best NFR configuration and the baseline NMT system reported in a previous study [4]. Both systems use the Transformer architecture [29] and were trained using OpenNMT [76]. More details on hyperparameters and training options are provided in the original study [4]. To train the NFR system, input sentences are augmented with similar translations retrieved from a TM (which is also used for training the baseline NMT system). In addition, alignment-based features are added to these augmented inputs. In what follows, we provide a brief overview of the different steps in the procedure.
First, for a given data set consisting of source/target sentence pairs S , T , for each source sentence s i S , n similar sentences { s 1 , , s n } S , are retrieved from the same data set, where s i { s 1 , , s n } , given that the similarity score is above a given threshold λ > 0.5 . The sentence similarity score S E ( s i , s j ) between two sentences s i and s j is defined as the cosine similarity of their sentence embeddings e i and e j , that is,
S E ( s i , s j ) = e i · e j e i × e j
where e is the magnitude of vector e. Similar to [5], we obtained sentence embeddings by training sent2vec [77] models on in-domain data and, for efficient similarity search, we built a FAISS index [78] containing the vector representation of each sentence. Byte-pair encoding (BPE) was applied to the data prior to calculating sentence similarity and was used in all subsequent steps [79] (https://github.com/rsennrich/subword-nmt (accessed on 15 July 2021)). To this end, we used a 32 K vocabulary for source and target language combined.
In a second step, for each s i , once the most similar n source sentences (i.e., fuzzy sources) are retrieved using cosine similarity, tokens in each fuzzy target { t 1 , , t n } T are augmented with word alignment features that indicate which source tokens they are aligned with in s i . This alignment process is conducted in two steps, i.e., firstly, by aligning the source tokens in s i with the fuzzy source tokens in s j by back-tracing the optimal path found during edit distance calculation between the two segments; and, secondly, by aligning fuzzy source tokens in s j with fuzzy target tokens in t j by referring to the automatically generated word alignments, which are obtained with GIZA++ [80]. After obtaining the alignments, fuzzy target tokens that are aligned with source tokens are marked as m (match) or nm (no-match). All tokens in the original input sentence are also marked with the feature S (source) for correct formatting.
In the next step, the best-scoring FM target t 1 is combined with another FM target t j , which maximises the number of tokens covered in the input sentence s i , provided that a second FM with additional matching input tokens can be found. If this is not the case, this method falls back to using the second best fuzzy target t 2 . For each input sentence s i in the bilingual data set, an augmented sentence s i is generated by concatenating the combined fuzzy target sentences to s i . We used “@@@” as the boundary token between each sentence in the augmented input sentence.
Finally, the NMT model is trained using the combination of the original TM, which consists of the original source/target sentence pairs S , T and the augmented TM, consisting of augmented-source/target sentence pairs S , T . At inference, each source sentence is augmented using the same method. If no FMs are found with a match score above λ , the non-augmented (i.e., original) source sentence is used as input. Figure 1, which is modified from Tezcan, Bulté and Vanroy [4], illustrates the NFR method for training and inference.

4.3. Automated Quality Estimation

In this section, we describe the procedures used for automated quality estimation. We list and briefly discuss the different metrics that were applied (Section 4.3.1) and provide more details on the identification of necessary edit operations using TER (Section 4.3.2). The human evaluation based on error analysis is described in the subsequent Section 4.4.

4.3.1. Metrics

We calculated seven automated metrics for translation quality estimation. The goal of using a variety of metrics is to cover different aspects of translation quality and to analyse if all metrics, which use different methods to measure quality, agree on the potential difference in quality between the NFR and the baseline NMT systems. Table 2 provides an overview of these metrics, specifying which method they use, the unit they target and the translation quality dimension they assess. More details concerning their concrete implementation in this study are provided in Appendix A.
BLEU and METEOR are similar metrics in that they measure n-gram precision at the level of token strings. Whereas BLEU targets exact lexical overlap, METEOR takes into account morphological and lexical variation (i.e., by also comparing lemmas and synonyms). Similarly to BLEU and METEOR, TER also targets token strings but estimates edit operations instead of n-gram precision. In this sense, it can be said to tap into the technical post-editing effort required to bring the MT output in line with the reference translation. The version of TER we used here, similar to BLEU, does not accept morphological and lexical variation. Unlike the three previous metrics, chrF targets character strings rather than token strings. It measures exact overlap, as BLEU does, but, since it also targets sub-word units, morphological variation is penalised less strongly.
BERTScore and COMET measure semantic similarity by calculating the distance between vector representations of tokens and sentences, respectively. Thus, they are fundamentally different from the previous metrics, which operate on (non-transformed) token or character strings. Moreover, COMET scores have been tuned towards predicting human translation quality ratings. Finally, DTED measures syntactic similarity by calculating edit distance for syntactic dependency labels [81].

4.3.2. TER Edit Operations

TER computation is based on the identification of different types of token-level edit operations required to bring the MT output in line with a reference translation (i.e., insertions, deletions, substitutions and token or group shifts). By using TER, we aim to find out what types and what amount of edits are required to transform both the NFR and the baseline NMT systems into the reference translation. An additional reason for using TER edits is that the edit types are identified for each token separately, which makes it possible to analyse whether the edits affect different classes of words. This is important, considering that content words, which possess semantic content and contribute significantly to the meaning of the sentence in which they occur, arguably matter more than function words when it comes to translation quality, considering that they have been associated with increased post-editing effort [82,83]. In the context of automatic evaluation, attaching more weight to content than to function words has been shown to lead to higher correlations with human quality judgements [84].
We compared the required edit operations for the NFR and baseline translations to determine whether they were distributed differently. To obtain a more detailed picture, we distinguished between edit operations affecting content words (i.e., nouns, proper nouns, adjectives, verbs and adverbs), function words (i.e., articles, determiners, prepositions, etc.) and other words/tokens (such as punctuation, symbols and other tokens that cannot be assigned a part-of-speech tag), following the classification used in the context of Universal Dependencies [85]. To automate the detection of part-of-speech (POS) tags, we rely on the state-of-the-art stanza parser developed by the Stanford NLP group [86].

4.4. Manual Error Analysis

In this section, we first describe the error taxonomy that was used for the error analysis (Section 4.4.1). This is followed by an overview of the annotation procedure (Section 4.4.2). We also report and discuss inter-annotator agreement (Section 4.4.3).

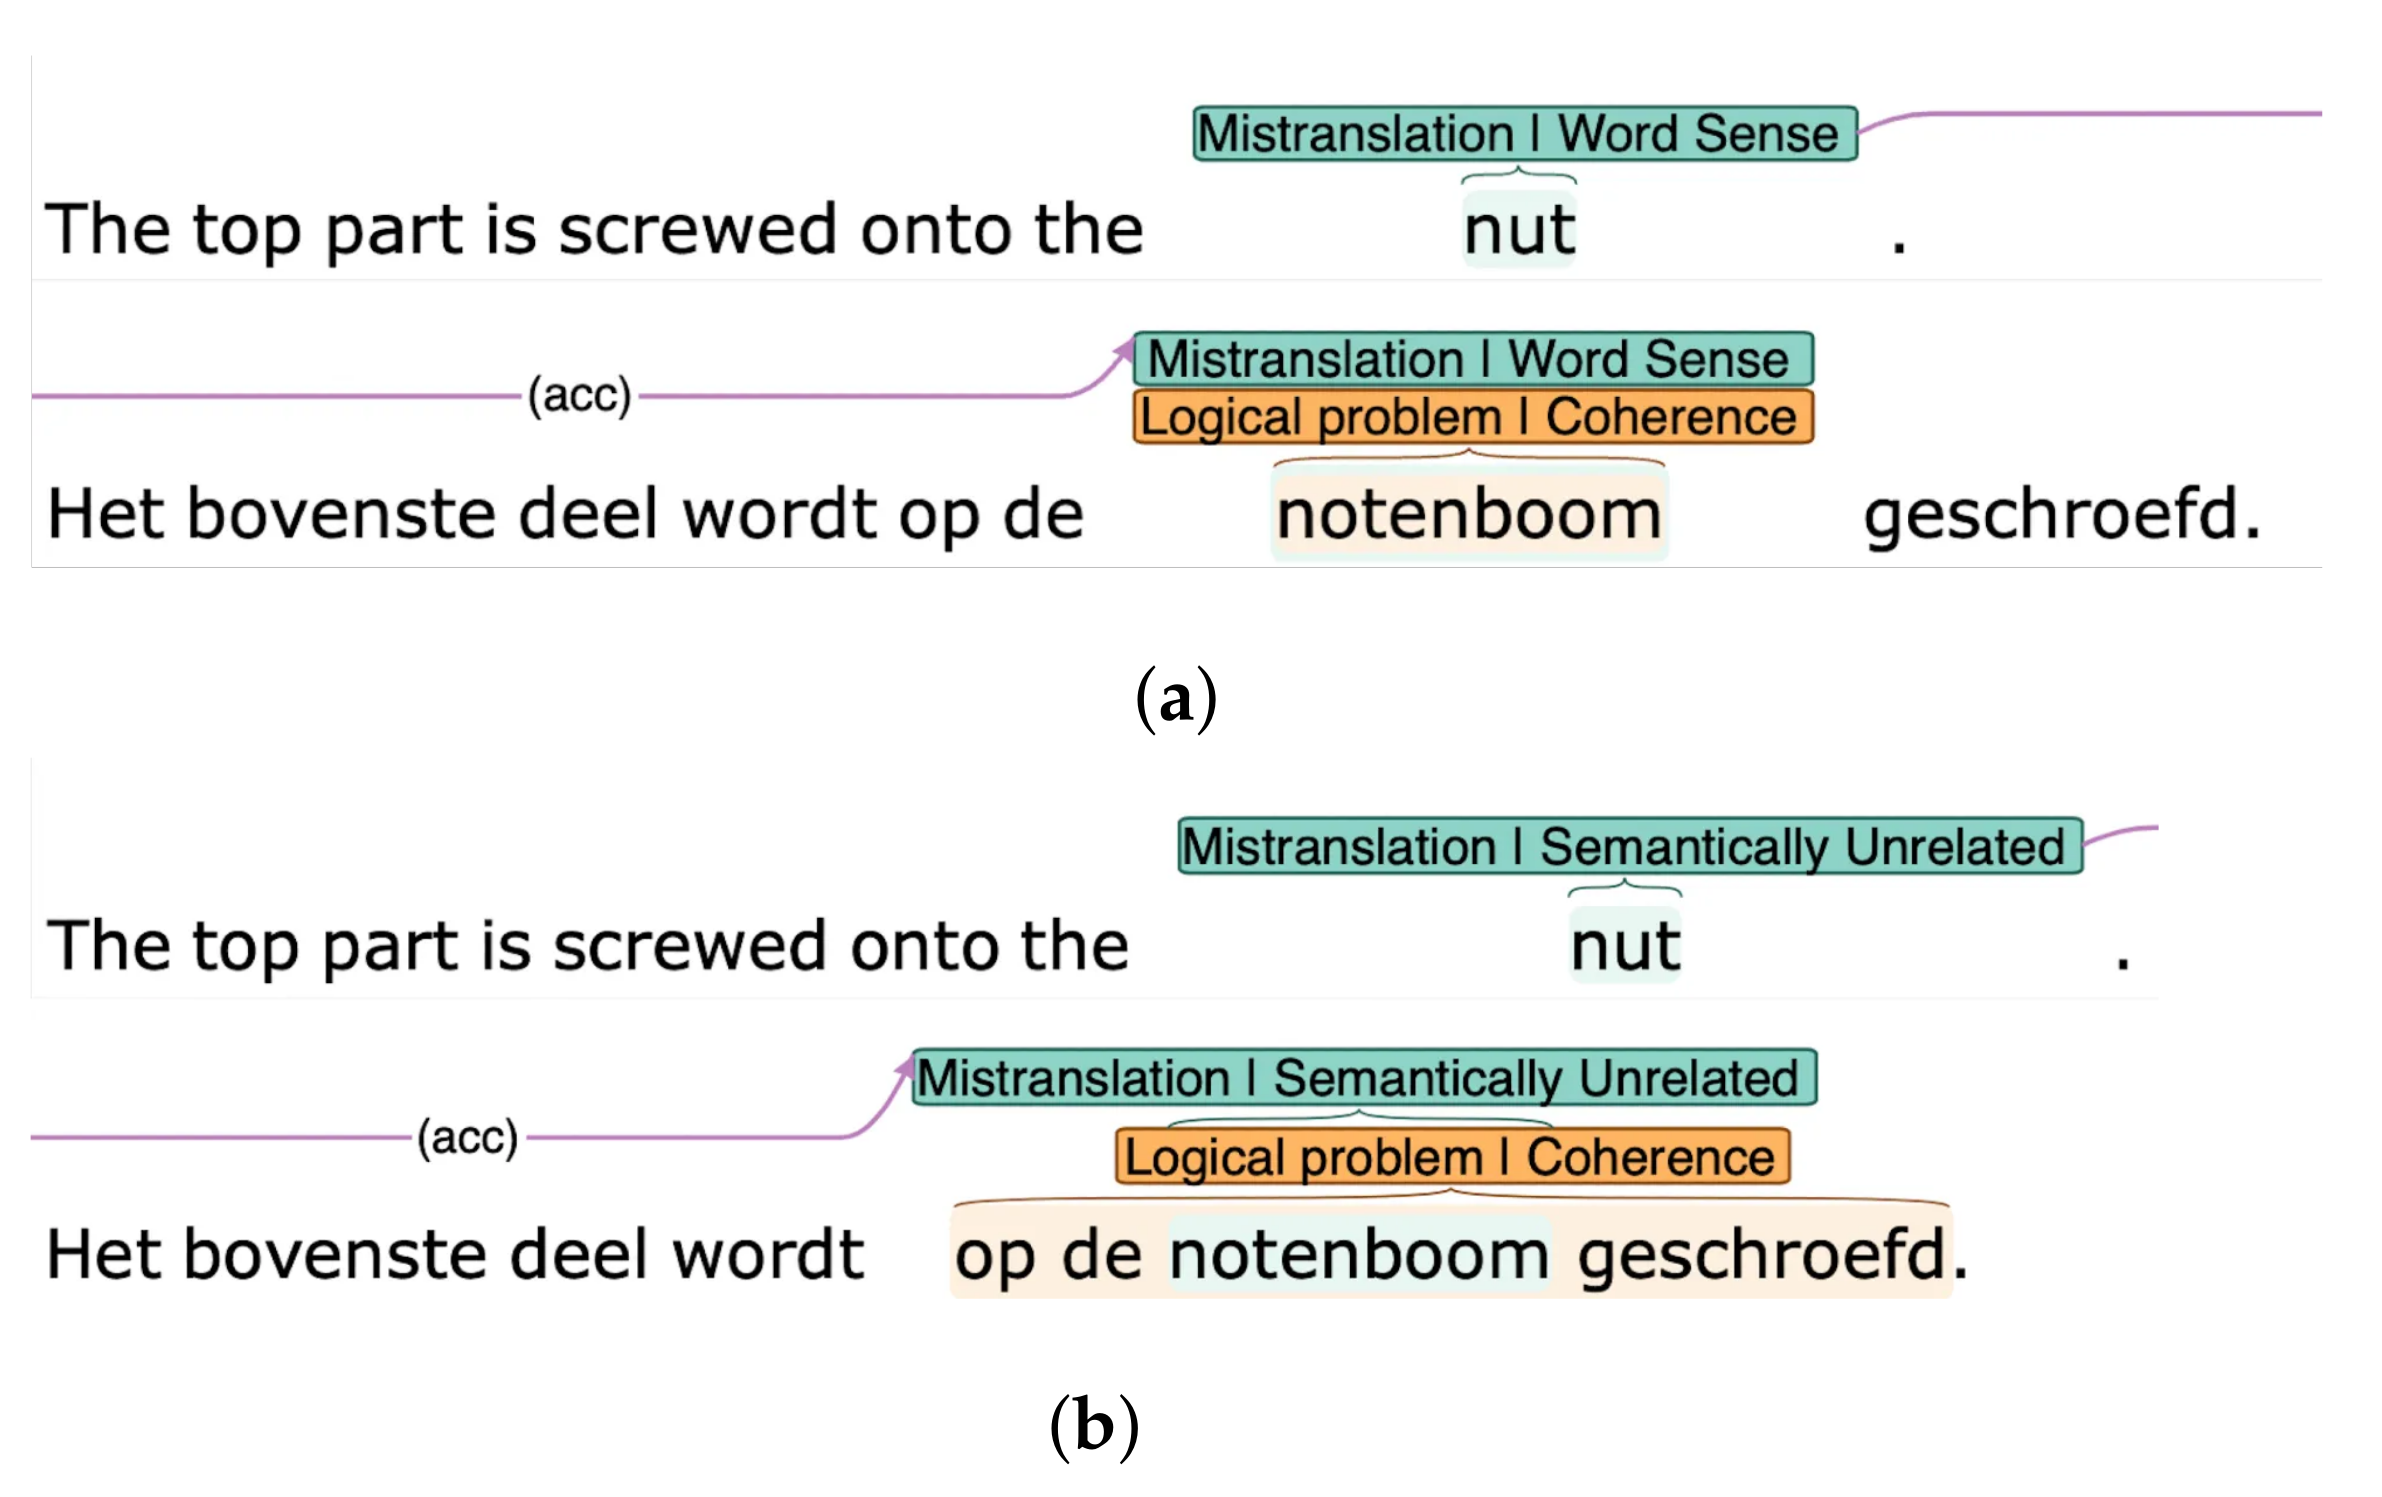
4.4.1. Error Taxonomy

To identify errors in the MT outputs, we used the SCATE MT error taxonomy [66,69]. As shown in Figure 2, this taxonomy is hierarchical, consisting of three levels. At the highest level, a distinction is made between accuracy and fluency errors (see also Section 2.2). Any error that can be detected by analysing the MT output alone is defined as a fluency error. If an error can only be detected by analysing both the source text and the MT output, it is classified as an accuracy error. Both of these error types have two additional levels of sub-categories (e.g., accuracy → mistranslation → word sense). In this study, we used a slightly adapted version of the taxonomy; the category “fluency → orthography” was added and the sub-category “non-existing word” was moved from the fluency error category “coherence” to “lexicon”. These changes were implemented based on annotator feedback in the context of previous research.

4.4.2. Procedure

Two annotators performed the error annotation task. Both were native speakers of Dutch with advanced English proficiency (level C2 of the CEFR scale). Both annotators had a bachelor’s degree in applied linguistics, with courses taken in translation studies, as well as a master’s degree (in interpreting, in the case of annotator 1, and in translation, for the second annotator). Prior to the annotation task, they were briefed about the task, read the annotation guidelines and performed a test task with 30 sentences for which they received feedback. The sentences in the test task were not included in the final annotation set. It has to be noted that the annotators were not experienced translators working at the DGT and did not have expert knowledge of the terminology used in this domain. They also lacked document-level contextual information, which should be taken into account when interpreting the results.
The annotation task was performed using the online annotation tool WebAnno https://webanno.github.io/webanno/ (accessed on 21 September 2021). MT errors were annotated in two steps. First, fluency errors were annotated by analysing the MT output alone, without having access to the corresponding source text (monolingual annotation). Second, the accuracy errors were annotated by analysing the MT output and the source text together (bilingual annotation). During the second step, the fluency errors annotated in the first step were visible to the annotators. The annotators were allowed to annotate multiple error categories on the same text span (i.e., errors can overlap). To ensure consistency in the error annotations, the translations of the NFR and baseline NMT systems were presented side by side to the annotators. The system details were masked during the annotations. The error definitions used in the SCATE taxonomy and the detailed annotation guidelines that were provided to the annotators can be found at https://github.com/lt3/nfr/blob/main/webanno/SCATE_annotation_guidelines.pdf (accessed on 21 September 2021).
Both annotators completed the annotation task (for NFR and baseline NMT output) in approximately 34 h. After the annotation task, the annotators worked together to resolve disagreements and to create a final, consolidated version of error annotations for both data sets, which can be found at https://github.com/lt3/nfr/tree/main/webanno (accessed on 21 September 2021).

4.4.3. Inter-Annotator Agreement

To assess the level of inter-annotator agreement (IAA), we evaluated the two tasks the error annotation process was based on, namely, error detection and error categorization, using the methodology proposed by Tezcan, Hoste and Macken [66]. Error detection is seen as a binary decision task, which consists of deciding whether a token corresponds to an error or not. IAA is assessed by calculating Cohen’s kappa at token level (i.e., tokens marked as error or not) and at sentence level (i.e., sentences marked as containing an error or not). To assess error categorization, we used alignment-based IAA; Cohen’s kappa was calculated for both annotators’ error annotations which overlapped in terms of the tokens they spanned. In this analysis, isolated annotations (i.e., when only one of the annotators detected an error on a given text span) were not included. Similarly, when multiple annotations overlapped between the two annotators, only aligned errors were analysed. Agreement on error categorization was analysed for the three hierarchical levels of the error taxonomy.
Figure 3 provides an example of error annotations by both annotators for the baseline NMT translations of the input sentence “The top part is screwed onto the nut”.
In the annotation examples provided in Figure 3, there are 9 tokens in the MT output. Both annotators agreed that this output contained errors (agreement on sentence-level error detection). On the other hand, while annotator 1 marked 1 token as erroneous (and 8 as correct), annotator 2 identified 4 erroneous tokens (low agreement on token-level error detection). By aligning the “mistranslation” and “logical problem” error annotations between the annotators, we can see that both annotators agreed on categorizing both errors at the first level (accuracy and fluency), as well as at the second level (mistranslation and logical problem) of the taxonomy, whereas, on level 3, they only agreed on categorizing the “logical problem” error as “coherence”. The annotators disagreed when categorizing the “mistranslation” error (word sense vs. semantically unrelated).
Table 3 shows IAA on error detection at token and sentence level, for both the NFR and baseline NMT translations. The confusion matrix on which the calculation of Cohen’s kappa was based, is provided in the appendices (Table A3).
IAA can be characterised as low at token level and moderate at sentence level. However, it should be noted that error detection at the token level is a very unbalanced task (in case of high-quality translations), with the vast majority of tokens not corresponding to errors (i.e., the probability of overall chance agreement is very high). There are two further reasons why IAA at token level seems low, namely, (a) even though both annotators often detected the same error, their annotations covered different text spans; and (b) annotator 2 was more critical than annotator 1 overall, not only having identified a higher number of errors, but also having covered more tokens (see Table A3).
Table 4 summarises the results for IAA on error classification at the three levels of the error taxonomy. At Level 1, agreement at the top level of the hierarchy was analysed (accuracy vs. fluency). For Levels 2 and 3, the same analyses were performed for the sub-categories in the hierarchy (if the annotators agreed on the higher level). At the lowest level (3), we only evaluated the two categories with the largest number of identified errors (i.e., accuracy → mistranslation and fluency → style and register).
Cohen’s kappa was very high for error classification at the highest level of the taxonomy, as well as at Level 2, when all accuracy errors were considered. For fluency errors, IAA was slightly lower. At the lowest level, agreement was perfect for fluency errors related to style and register, whereas, for accuracy errors related to mistranslations, IAA was found to be moderately high. It can also be seen that the level of agreement was higher for the NFR system for all levels of error detection and categorisation.
Even though some of the kappa scores reported for this study may seem low, they are on par with those reported in similar studies on MT error analysis [67,68,87]. However, it also has to be noted that there is no consensus on how IAA should be analysed for this task, which makes it difficult to compare the IAA rates reported in different studies.

4.5. Fuzzy Match Analysis in NFR

NFR works by augmenting input sentences with the target side of an FM retrieved from a TM. In the NFR system evaluated here, two FMs were concatenated to the original input sentence. To analyse the impact these FMs had on the MT output, we counted the number of tokens in the FMs that also appeared in the MT output and compared this to the tokens that appeared in the baseline NMT translation. Moreover, we distinguished between FM tokens that were either aligned or not to tokens in the input sentence (i.e., the match and no-match alignment features described in Section 4.2). In a final step, we verified how many of the match/no-match tokens that appeared in the MT outputs were also present in the reference translation.

4.6. Features and Statistical Models

The aim of our final analysis is to identify features that can be used to further improve the quality of NFR translations. To this end, we investigated the extent to which certain characteristics of the source sentence and the selected FMs influenced the difference in quality between the NFR and baseline NMT systems or, in other words, we looked for features that made NFR translations “better” (or “worse”) than baseline translations. This identification of features should allow us to improve the performance of the NFR system in three possible ways: (a) by better selecting FMs used for data augmentation, (b) by optimising FM combination strategies and (c) by possibly selecting which input sentences not to augment.
For the purpose of this analysis, we calculated the difference between the sentence-level TER scores obtained by the NFR and the baseline NMT system. Table 5 gives an overview of the candidate features that we investigated. First, we considered the vocabulary of the source sentence in terms of the frequency of tokens in the data set as a whole by calculating the percentage of tokens in the sentence belonging to different frequency bands. We also looked at the length of the source sentence, as well as the length of both FMs relative to the length of the source sentence and to one another. Next, we considered the similarity of the FMs to the source sentence, as well as the ratio of match/no-match tokens per FM. Finally, we included the mutual dependency-tree edit distances between the source sentences, FM1 and FM2.
As a first step in our analysis, we selected a subset of the test set based on the difference in TER scores between the baseline NMT and the NFR systems, keeping only those sentences for which a considerable difference in TER scores (i.e., >0.1) was observed. We then split this subset into sentences for which NFR obtained a better TER score and sentences for which the baseline translation scored better. We compared the mean scores for each feature for both subsets and estimated the significance and magnitude of the difference between both using independent samples t tests and Cohen’s d effect size.
The features that showed the largest difference (in terms of Cohen’s d) between the two subsets were then entered as independent variables into a linear model, with the difference in TER scores between the NFR and baseline translations as the dependent variable. We used R’s [88] lm function to fit the model and include all sentences in the test set as observations. The aim of this step is to jointly model the effects of the different features, focusing on the interpretability of results. We performed forward and backward model selection using Aikake’s Information Criterion (AIC) to arrive at the most parsimonious model [89,90].

5. Results

5.1. Automated Quality Assessment

In this section, we present the results related to the first research question. We first look at the quality assessment using automated metrics (Section 5.1.1), before turning to the analysis of required edit operations (Section 5.1.2).

5.1.1. Semantic, Syntactic and Lexical Similarity

We used seven automated evaluation metrics to estimate the quality of the NFR system and compare it to the baseline Transformer, as well as to the most similar translation retrieved from the TM (using cosine similarity). The results are presented in Table 6. We report the overall score per metric for the baseline and NFR systems, as well as the TM; further, we indicate the absolute and relative difference between the baseline and the NFR systems. To allow a comparison across metrics to be conducted, we also report the difference in terms of standardised (or z) scores for each metric. Z-scores represent deviations from the mean in terms of standard deviations.
According to all evaluation metrics, the quality of the NFR translations was estimated to be higher than that of those produced by the baseline NMT system. All improvements were statistically significant according to the Mann–Whitney U test ( p < 0.001 ). The largest standardised difference between the two systems was recorded for BLEU (+0.157), followed by chrF (+0.155) and BertScore (+0.134). COMET showed the smallest difference (+0.077). Both the baseline NMT and the NFR systems outperformed the TM, in this scenario, according to all metrics. For reference, the scores for all evaluation metrics obtained on the subset of the test set used for manual evaluation are provided in the appendices (Table A1).
To allow a more detailed analysis to be performed, the BLEU scores per FM range are reported in Table 7.
These scores confirm previous findings [4]. With the increase in FM scores, (a) the estimated translation quality increased for both systems and (b) the difference between the baseline NMT and NFR systems became larger. Table 7 also shows that, in the highest FM range (i.e., 90–99%), FMs retrieved with cosine similarity achieved a higher BLEU score when used as the final output than the baseline NMT system (75.25 vs. 74.64). On the other hand, the scores obtained by the NFR system were much higher (85.25). The BLEU scores for the different FM ranges obtained on the subset used for manual evaluation are provided in the appendices (Table A2).
Finally, the correlations between the different evaluation metrics are shown in Table 8. We did not include BLEU in this analysis, since BLEU scores are not reliable at sentence level [42].
Generally speaking, the correlations between the different evaluation metrics could be described as strong to very strong, even though most correlations did not exceed 0.85. The strongest correlations were found between chrF and BERTScore (0.934 and 0.929) and between chrF and METEOR (0.923 and 0.916). The reported correlations confirm that DTED was the most distinct of the metrics, targeting syntactic structure rather than token strings or (vectorised) semantics. It showed the weakest correlation with four out of five of the other metrics and its strongest correlation was with TER (0.838). In addition, COMET appeared to capture different information. The correlation between COMET and other metrics did not exceed 0.824. It is also worth noting that the correlations between the metrics were highly comparable for the NFR and baseline NMT translations. The largest difference was found for the correlation between TER and METEOR (−0.811 for NFR and −0.852 for the baseline NMT system).

5.1.2. Edit Operations

We analysed the number and types of TER edit operations to obtain a more detailed picture of the formal editing required to transform MT output into the reference translation. We first looked at the number of different types of edit operations for the complete test set for both MT systems, before turning to an analysis per match range. The results of the first analysis are presented in Table 9. For the purpose of this analysis, we made a distinction between edits involving content words, function words and other words or tokens.
The results show that NFR produced translations that required fewer edit operations overall (−15.10% edits and −1.18 edits per sentence), as well as for all individual edit types. The reduction in the number of edits seemed to be consistent and balanced for content, function and other words, for all types of edits. When we compared the relative frequencies of edit types, we could see that substitutions made up the largest group of edits, with an average of 3.49 and 2.90 edits required per sentence in the baseline NMT and NFR outputs, respectively. The difference between the NFR and baseline systems in terms of number of required substitutions was also substantial (−16.97%), especially when compared to the difference in terms of insertions (−9.61%) and, to a lesser extent, deletions (−13.11%). Two other edit types showed an even larger reduction in the total number of edits required—shift tokens (−19.55%) and shift groups (−18.76%).
For the second analysis, we divided the test set according to the match score of the first FM that was retrieved for the NFR system. A detailed overview of the frequency of edit operations per match range is provided in the appendices (Table A4). A summary of the results is visualised in Figure 4. In this graph, for the sake of clarity, we only distinguish between edit types and not token types and plot the percentage difference between the baseline NMT and NFR systems.
Figure 4 shows that the estimated translation quality difference between the NFR and the baseline NMT systems, measured in terms of number and types of edits required, was larger for higher FM scores. For source sentences that were augmented with FMs with a similarity score of up to 70%, there was little difference between the NFR and the baseline systems. In fact, compared to the NFR system, the baseline system required fewer substitutions and shifts in the FM range 50–59% and fewer insertions and deletions in the range 60–69%. With FM similarity scores of 70% and higher, NFR requires fewer edits for all edit types. The reduction in required edits increased dramatically for higher FM ranges, reaching a difference of between −26.88% (for insertions) and −55.77% (for shift groups) in the FM range 90–99%.

5.2. Fine-Grained Error Analysis

Our second research question aimed to compare the types and number of errors that were made by the NFR and the baseline NMT systems, classified according to the SCATE error taxonomy. The results of the consolidated human error annotation are summarised in Table 10.
Overall, the annotators identified the same number of errors (199) for both translation systems. Likewise, the number of sentences that contained at least one error was highly similar for both systems (120 for baseline NMT and 123 for NFR). However, the errors in the NFR output spanned more tokens (442 compared to 395, or 7.9% and 7.0%, respectively). It is worth noting that, overall, around 60% of the sentences in the test set did not contain any errors, according to the annotations. Table 11 shows which types of errors were made by both MT systems according to the SCATE error taxonomy.
As shown in Table 11, the majority of errors made by both the baseline NMT (110) and the NFR system (128) was accuracy errors. For both systems, the two error categories with the largest number of errors were mistranslation and omission errors. Taken together, the errors in these two categories made up 85% and 76% of all accuracy errors for the baseline and NFR systems, respectively. Looking more closely at the mistranslation errors that both systems made, different error profiles emerged; while the NFR system made more errors in the sub-category “semantically unrelated” (27), the baseline system seemed to perform better in this respect and produced translations with 56% fewer errors in this category (12). On the other hand, the baseline system produced more errors in all other sub-categories of mistranslation, with, especially, the “word sense” and “multi-word expressions” categories standing out when compared to the NFR system (even though, in absolute terms, these types of errors were less frequent). When we consider the other types of accuracy errors, the NFR system clearly made more addition errors (8 vs. 25).
While the NFR system made more accuracy errors, producing more fluent output seemed to be its strength, compared to the baseline NMT system, as it produced translations with 19% fewer fluency errors (89 vs. 71). Within the main category of fluency, errors were distributed differently for both systems. The most striking difference could be observed for the “lexicon” category; the baseline system clearly made worse “lexical choices” while producing translations (17 vs. 9) and used words outside the Dutch vocabulary (7 errors in the category “non-existing/foreign” errors), which did not seem to be a big issue for the NFR system (1 error ). On the other hand, the baseline system generated fewer errors of “grammar and syntax” than the NFR system (8 vs. 15).

5.3. Impact of Data Augmentation

Our third research question targeted the impact FMs had on the MT output. Table 12 shows the percentage of matched tokens per selected FM (% m/FM1 and % m/FM2) and how many of these tokens appear in the MT output relative to the total number of matched tokens (% m-pass). We report these values for the full test set for both the baseline NMT and the NFR systems, even though the FM tokens, of course, did not actually appear in the baseline input. The table also shows what percentage of match/no-match tokens that appeared in the MT output, also formed part of the reference translation (%m-pass-REF). In addition to providing the values for the full test set, we provide them for the lowest (50–59%) and the highest (90–99%) match ranges for the NFR system.
On average, FM1 contained 62.2% tokens that were aligned with the source sentence. For the highest FM range, this percentage reached 82.7%; for the lowest, it was only 26.6%. In the full test set, 88.4% of the matching tokens were transferred to the NFR output. For comparison, 82.6% of these tokens could also be found in the baseline NMT output. Of all the matching tokens that appeared in the NFR output, 69.5% could also be found in the reference translation. For the baseline system, this was only 66.6%. Another interesting observation is that fewer matching tokens passed to the NFR output in the lowest FM range (74.5%), especially when compared to the highest range (95.8%).
Looking at how no-match tokens were utilised by both systems, on average, a higher ratio of such tokens appeared in the NFR translations (36.5%) than the baseline NMT output (31.9%). It is worth noting that a higher proportion of no-match tokens in NFR translations also formed part of the reference translation (29.6%) than is the case for the baseline translations (27.3%). On the other hand, the majority of no-match tokens that appeared in the NFR and baseline outputs (70.4% and 72.7%, respectively) did not appear in the reference translations. The NFR system also seemed to carry a higher percentage of no-match tokens to its output in higher FM ranges (45.8% in 90–99% vs. 23.5% in 50–59%) and more of these tokens appeared in the reference translations in the higher match range.
As detailed in Section 4.2, for the NFR configuration used in this study, the highest-scoring FM was combined with a second FM, which did not necessarily achieve a high similarity score but which maximized the total number of source words that were aligned. As a result, there were, on average, fewer matching tokens in FM2 than in FM1 (46.8% vs. 62.2%). However, an overall pattern similar to the one observed for FM1 emerges when comparing how matching/non-matching tokens were utilised in NFR and the baseline NMT systems. The main difference seemed to be that fewer FM2 tokens (both match and non-match) were transferred to the NFR output than FM1 tokens. Similar patterns could also be observed for FM1 and FM2 when comparing the lowest and highest FM ranges in NFR.

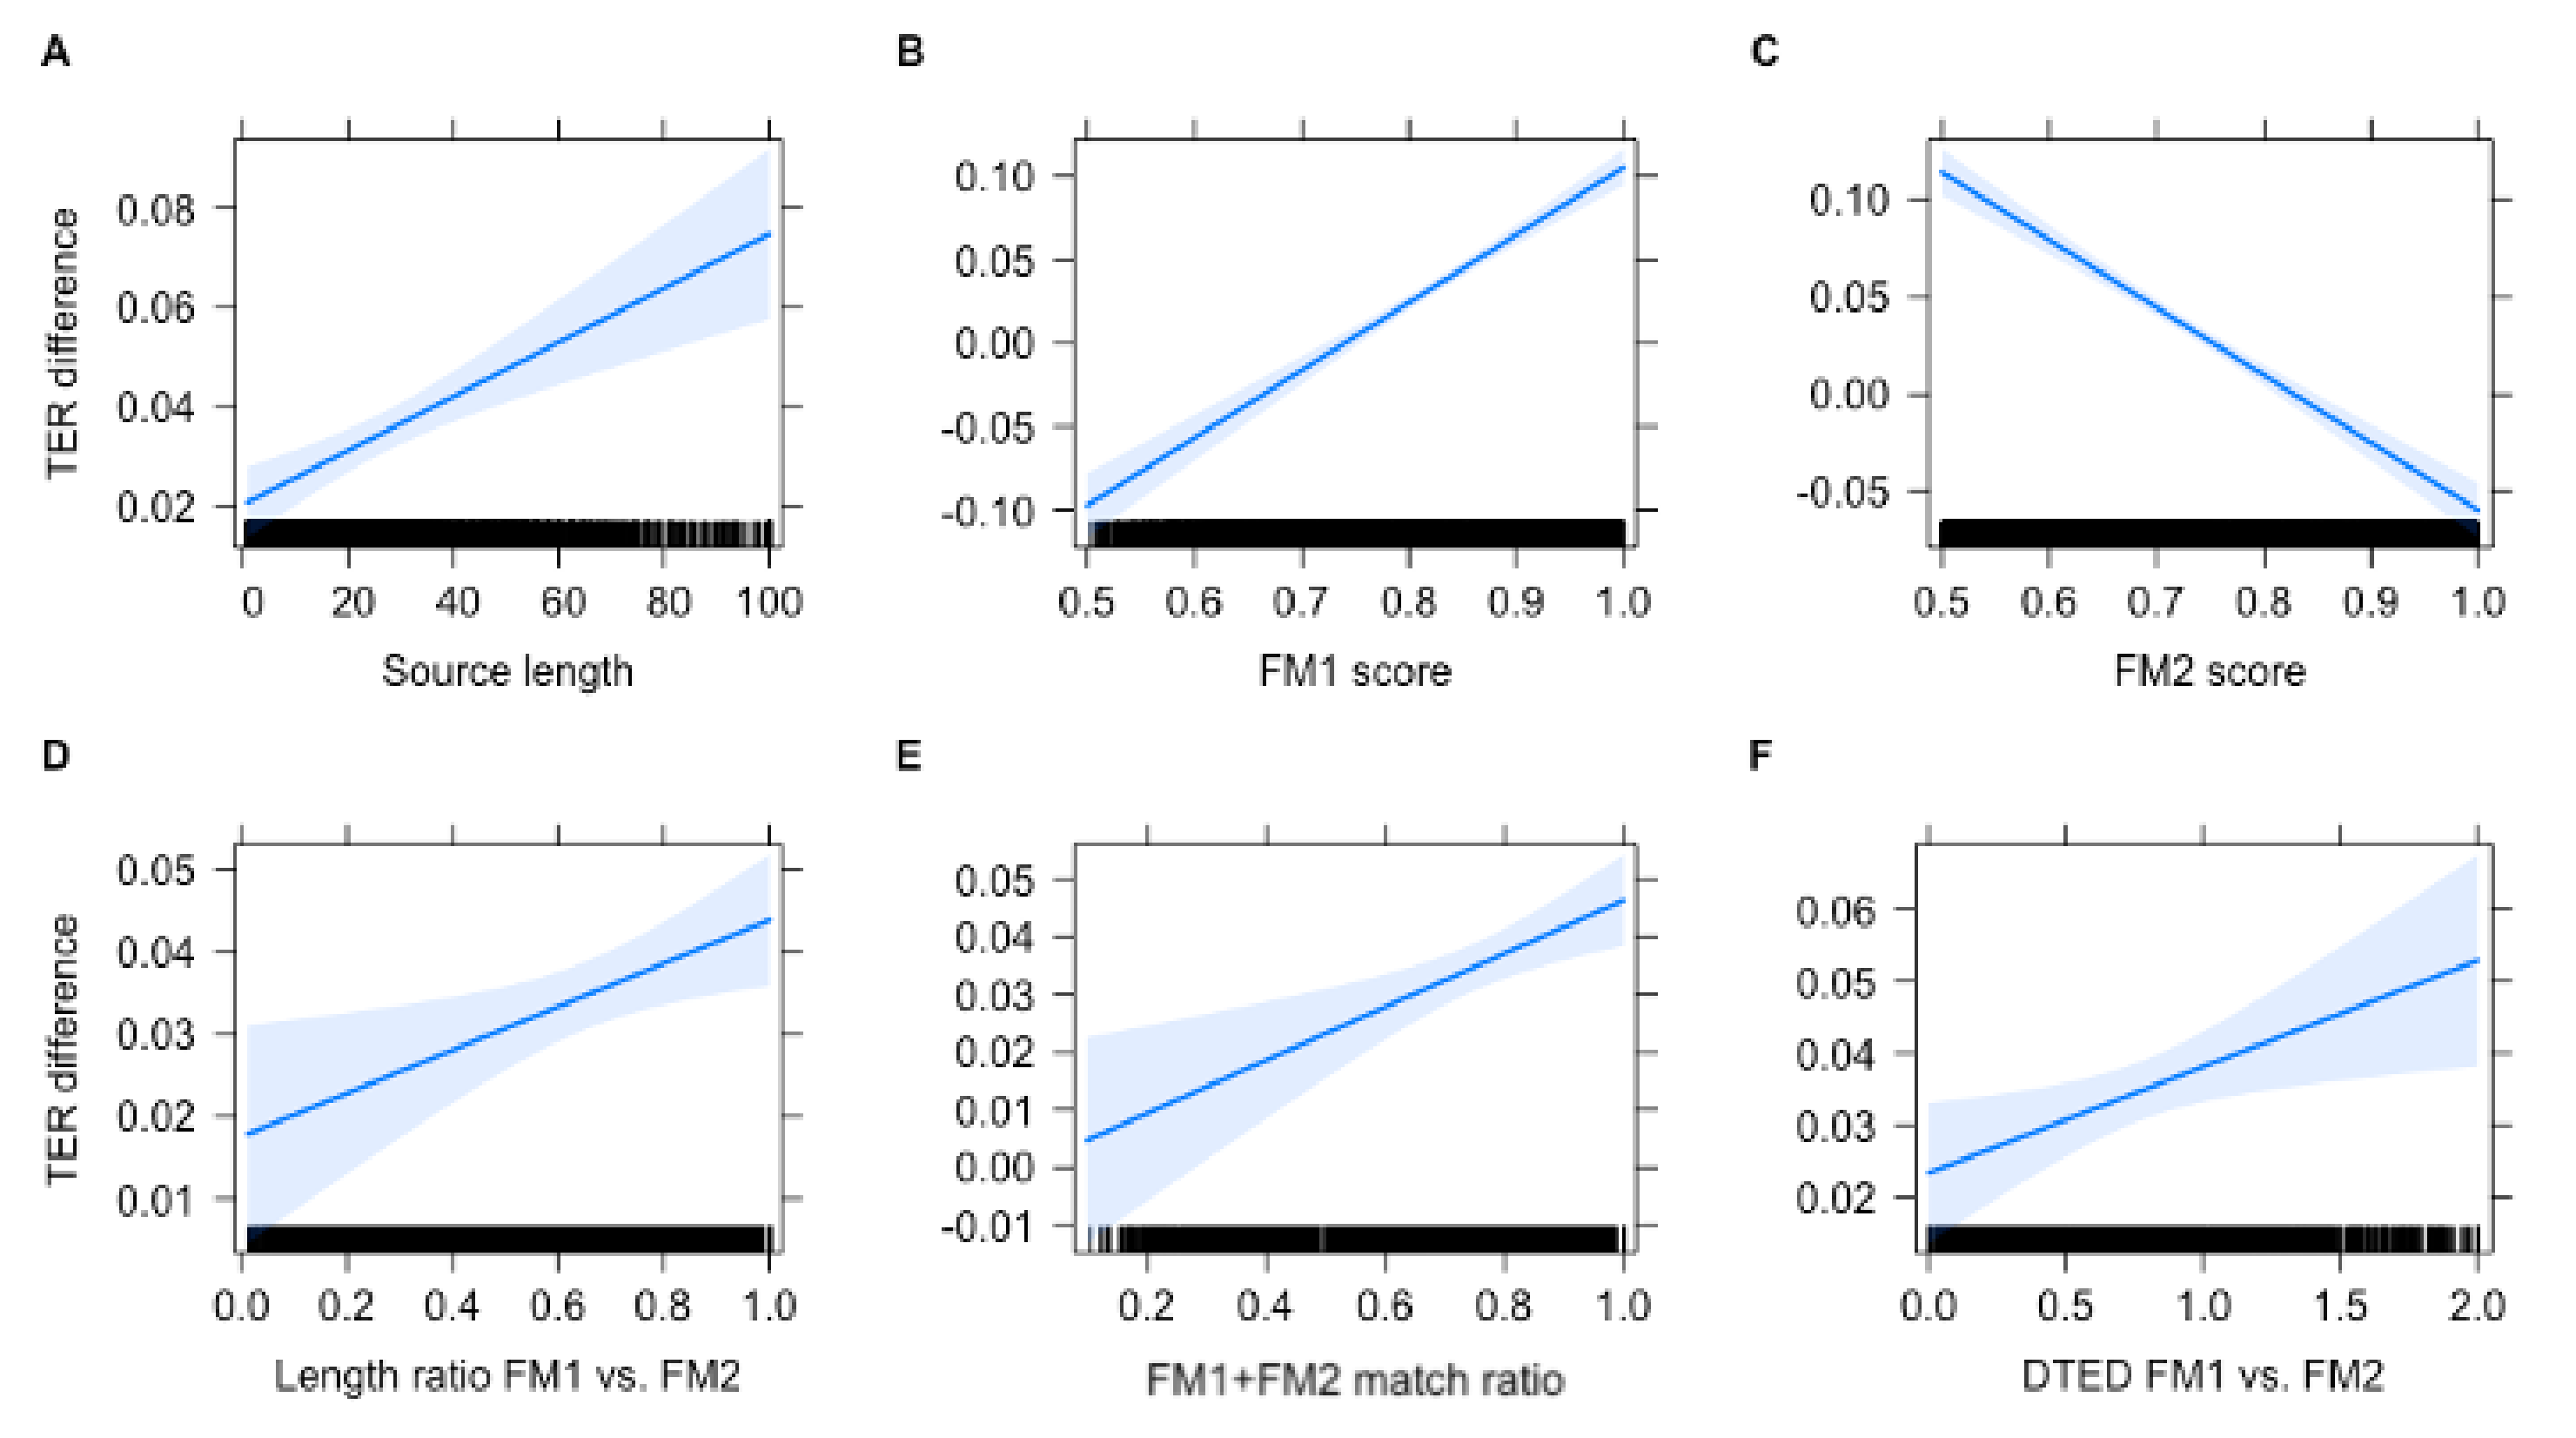
5.4. Variables Influencing MT Quality

The final research question aimed to identify factors that influence the quality of NFR translations, with the ultimate aim of further improving NFR quality. We first analysed the effect of separate features by comparing their average values for sentences where NFR scored substantially better than the baseline NMT (in terms of TER) and those where the baseline scored better. As outlined in Section 4.6, the selected features were extracted per input sentence and targeted four different characteristics:
  • Vocabulary frequency: Percentages of tokens in the input sentence that belonged to the 99%, 90% and 75% least frequent tokens in the source side of the training set (% Q99, % Q90 and % Q75).
  • Length: Length of the source sentence in number of tokens (Source), length ratio of FMs to source sentence (FM1/source and FM2/source) and to each other (FM2/FM1).
  • FM similarity: Fuzzy match scores as measured by their cosine similarity to the source sentence (FM1 score and FM2 score), percentage of match tokens in fuzzy matches (% m/FM1 and % m/FM2) and the ratio of total unique match tokens from FM1 and FM2 combined, relative to the length of the source sentence (total_m/source).
  • Syntax: Syntactic similarity between the source sentence and the fuzzy matches (Source vs. FM1, Source vs. FM2 and FM1 vs. FM2), measured by DTED.
The results of this analysis are shown in Table 13. There were 1310 sentences for which NFR translations obtained a TER score that was at least 0.10 higher than the baseline NMT translation. In contrast, for only 579 sentences, the baseline translations scored better. A more detailed analysis of the distribution of sentences that obtained higher TER scores per system and per FM range is provided in the appendices (Table A5). This table shows that, in each FM range, there were sentences that were translated better by the baseline system, although the proportion of sentences for which the NFR system performed better clearly was larger for higher FM ranges.
For 7 out of 15 features, a substantial difference, with a Cohen’s d effect size of over 0.20, was found between the two subsets. Most of these had to do with similarity between the FMs, and the source sentence and the percentage of matched tokens they contained (FM1 score, FM2 score, % m/FM1 and t o t a l _ m / s o u r c e ). In addition, the length of the source sentence, as well as the length difference between the two FMs, differed substantially for both subsets. The final feature qualifying was the dependency-tree edit distance between both FMs.
After performing model selection, six out of seven predictors were retained in our final linear model. The outcome variable for this model was the difference in TER scores between the baseline NMT and NFR translations of the sentences in the test set. The parameter estimates of the model are presented in Table 14. Since we are dealing with a linear and additive model without interaction terms, the coefficients have to be interpreted as changes to the outcome variable when other terms in the model are kept constant.
All six variables contributed significantly to the model. The strongest effect, as shown by the standardized betas, was observed for FM1 (positive) and FM2 score (negative). However, note that the overall explanatory power of this model is limited, with only 6.4% of the variance explained. Figure 5 visualises the strength and direction of the effect of the six features. Note that the scale of the Y-axis is not constant across these plots.
Plot A shows how NFR translations appeared to outperform baseline NMT translations when source sentences were longer and plot B confirms that high FM scores were associated with better NFR scores than the baseline. The model also predicted low scoring matches to lead to worse NFR translations than the baseline system. However, this was true only for the first FM. According to the model, a higher-scoring second FM lead to worse NFR performance (plot C). There were three more positive effects: the difference in TER scores was more in favour of the NFR system when the length of both FMs was more alike (D), when there were more matched tokens in both FMs combined (E) and when the dependency-tree edit distance between both FMs was larger (F). The relevance of these findings is discussed in the next section.

6. Discussion

In the first part of the discussion, we summarise the findings of our study and point to potential implications (Section 6.1). The second part discusses the limitations (Section 6.2).

6.1. Findings and Implications

6.1.1. RQ1: Automated Quality Evaluation and Required Edits

Our first research question aimed to compare the quality of NFR and baseline NMT translations. To this end, we calculated scores on seven automated quality metrics and analysed the number and types of edit operations required to bring the MT output in line with a reference translation. The results are unequivocal. NFR translations were more similar to reference translations according to all quality metrics, regardless of whether they targeted lexical overlap, semantic similarity, or syntactic equivalence. The largest difference was found in terms of exact metrics (i.e., BLEU, TER and, to a lesser extent, chrF) and the smallest for COMET, which did not require exact lexical overlap. This seems to indicate that NFR was especially strong at staying close to reference translations in terms of lexical equivalence (i.e., producing words and/or tokens that were identical to the reference), which is one of the main aims of TM–MT integration methods. In terms of semantic equivalence (so accepting lexical variation), the difference with the baseline NMT system was slightly less pronounced, but still significant (as measured by BERTScore and METEOR). This was also the case for COMET, which has been shown to correlate well with human evaluations [53]. It is also interesting to note that we observed a difference in terms of syntactic similarity between the MT output and the reference translations. To our knowledge, dependency tree edit distance is not widely used as an MT evaluation metric, as it does not capture any semantic or lexical aspects, but it could be a useful addition to the repertoire of automatic measures of quality, since it targets a different (linguistically motivated) type of similarity between the MT output and the reference translation. In this regard, we noted that the correlations between the different evaluation metrics were moderate to very high, yet not high enough to discard any measures as being redundant. Our study also shows that, considering the clearly different focus of these measures, it can be worthwhile to include a wide selection of them when performing MT evaluations.
In addition, the current study confirms that the NFR system outperformed the FMs retrieved from the TM in all similarity ranges, also when using cosine similarity as the similarity measure instead of edit distance [3]. Even though the baseline NMT system used in this study also outperformed the TM output when all sentences in the test set were evaluated, this was not the case when we focused on the highest FM range, where TM matches obtained higher BLEU scores than the baseline NMT output (75.25 vs. 74.64). This observation illustrates why a baseline NMT system is often used as a back-off to a TM in CAT workflows [16,91] and why NFR, as a single system, could be a better alternative to this traditional TM–MT combination approach; even in the highest FM range, the NFR system outperformed the TM output by a large margin, at least in terms of BLEU scores (85.25 vs. 75.25).
Looking at the number of required edit operations, our analyses show that the NFR output not only necessitated fewer edits overall, but did so across all types of edits (insertions, deletions, substitutions and shifts) and words (content, function and other). This shows, among other things, that the differences between NFR output and baseline NMT output concerned all types of words, including words with high semantic substance and not only, for example, punctuation and/or function words.
Zooming in on the different types of edits, the two edit types with the largest reduction in the total number of required edits when comparing the NFR and the baseline NMT systems were shifts (−19.55% token shifts and −18.76% group shifts) and substitutions (−16.97%). Substitutions were the edit type with the largest absolute reduction (−3680) and, since these substitutions also involved a large proportion of content words, one of the strengths of NFR seemed to be its ability to make better lexical choices than the baseline NMT system. Whether this also means that the NFR system is better at making terminological choices needs to be investigated in a follow-up study explicitly targeting the translation of terms. On the other hand, the large reduction in terms of shifts (tokens and groups) for NFR output indicates that NFR was able to produce an output that was more similar to the reference translation in terms of word order.
Our analysis of edit operations per match range shows that the difference between the NFR and the baseline NMT system in terms of required edit operations was larger for higher FM ranges, affecting all types of edit operations. The reduction in edit operations was especially pronounced for substitutions and shifts in the highest FM range (i.e., >90%), which corresponded to the largest group of sentences in the test set; in total, 40.5% of all source sentences in the test set were augmented with an FM with a similarity score of 90% or higher. These findings expand on evidence indicating that the similarity between the input sentence and the sentence retrieved from the TM is crucial for NFR quality [3,4]. In terms of TER edits, it seems that the difference between NFR and baseline NMT translations became substantial only with matches scoring 70% or higher. While it has been shown that including low FMs is useful to boost NFR quality [3,4], it might be worthwhile to be more selective about which input sentences in the low FM ranges are augmented at inference.

6.1.2. RQ2: Error Profiles

Our second research question aimed to investigate the amount and types of translation errors made by the NFR and the baseline NMT systems and to analyse to what extent the error profiles of both systems differed. A first observation is that the overall number of errors made by both systems was relatively low, with around 60% of sentences in the test set not containing any errors.
When comparing the NFR and baseline systems, the results of the automated analyses are not confirmed. Whereas according to the analysis using automated metrics NFR clearly outperformed the baseline system, the manual error analysis showed that the NFR system made an equal number of translation errors as the baseline, made more accuracy errors and produced translations with more tokens that corresponded to errors and slightly more sentences that contained errors than the baseline system. Moreover, the detailed error classification revealed different error profiles; while the NFR system seemed to produce more fluent translations with better lexical choices and fewer coherence errors than the baseline system, it also made more grammatical errors. Moreover, the NFR system fell short in terms of accuracy, making more errors in the categories “addition” and “semantically unrelated”.
There are a number of potential explanations for this apparent discrepancy. First, the automatic and manual evaluation methods used in this study relied on a different type of information to assess translation quality. While the automatic evaluation compared the MT output to a reference translation, the manual error annotation was performed by analysing the MT output and source sentence only. Thus, it can be argued that the two evaluation methods provide complementary information, yielding a more nuanced picture of the differences in translation quality. A second potential reason for the difference in results is that the sentence-level manual error analysis performed in this study, by definition, considered all deviations from the source text as accuracy errors. This may be problematic, since sentence-level translations can contain apparent deviations from the source text (e.g., related to the use of cohesive devices or translation decisions affecting sentence boundaries) that do not constitute actual errors when analysed in context [2,72]. At the same time, the automatic evaluation metrics compared the MT output to reference translations taken from the TM. These reference translations, as they are taken from larger documents, can also contain apparent deviations from the source text, potentially distorting the evaluations.
To investigate this issue further, we analysed the percentage of errors annotated in the NFR and baseline NMT systems that were also found in the reference translations. The results of this analysis are presented in Table 15.
The results indicate that the errors annotated in both MT outputs, to a certain extent, also appeared in the reference translations. This seems to apply to a much larger percentage of NFR errors when compared to the baseline NMT; a total of 18.1% of all errors annotated for NFR also appeared in the reference translations (in comparison to only 8.5% for the baseline system). Most of these errors were accuracy errors (27), representing 21.1% of all accuracy errors annotated in this data set. These findings confirm that certain deviations from the source content and meaning, which can be considered to be translation errors according to a strict assessment method, were also present in reference translations. Table 16 shows an example of an addition that appeared both in the NFR output and the reference translation.
The phrase “van de maatregelen (by the measures)” was not present in the source text, but was added to the NFR translation and it also appeared in the reference translation. This addition, most likely, made sense in the context of the complete paragraph the sentence was taken from, but it was annotated as an error (accuracy → addition) in this study. No errors were annotated in the baseline NMT output, since detailhandelaren and kleinhandelaren are both correct translations of the English word retailers. Similarly, grote and ernstige are equally correct translations of the word substantially. When using automated evaluation metrics that rely on a comparison with the reference translation and especially metrics that evaluate exact lexical overlap (such as BLEU and TER), the different lexical choices in the baseline translation cause the estimated translation quality to decrease. Whether such deviations should be considered real errors or not is open to debate and, potentially, also depends on the translation context. We argue that, in the context under investigation in this study, exact lexical choices are important, which would be an argument to count different lexical choices as errors. Whatever the case may be, it is clear that this constitutes an important, potentially confounding factor in MT evaluation. We believe that ideal evaluation set-ups should include methods that use both the source text and reference translations for the purpose of assessing MT quality. Moreover, the analysed example demonstrates that evaluations at the sentence-level are inherently flawed in most translation contexts and that document-level evaluations, or context-aware evaluations in general, are the preferred option [72].
Even though the fine-grained error analysis allowed us to reveal the different error profiles of both systems, it did not inform us about the severity of the errors, a potentially subjective notion in itself [92]. The severity of errors has been studied extensively in the context of post-editing effort. There is some consensus in the literature as to which types of errors are the most challenging to post-edit and which take the least effort. Reordering and lexical choice errors and errors that lead to shifts in meaning compared to the source text are among the most challenging error types [7,83,93,94,95], whereas errors of incorrect word form [83], omissions and additions [7,93] and orthography errors [93] are reported to have the least impact on post-editing effort. Combining these findings with the error profiles observed in this study, it appears that most of the most frequent errors made by the NFR system had a restricted impact on post-editing effort (i.e., addition, omission and word form). Moreover, the NFR system made fewer errors in lexical choices than the baseline NMT, one of the error categories that is commonly reported to have a high impact on post-editing effort. However, this issue needs to be investigated further, for example, by carrying out an empirical study aimed at analysing the actual post-editing effort involved in correcting the errors made by the NFR and a baseline system.

6.1.3. RQ3: Impact of Fuzzy Matches

We analysed the impact FMs had on NFR output by comparing the proportion of match and no-match tokens that appeared in the NFR and baseline NMT outputs, as well as in different match ranges of the NFR output. More matched tokens from both the first and second FM appeared in NFR output than in the baseline output. While this difference was not very big, it still shows us that the data augmentation method successfully allowed the NFR system to find a higher number of “relevant” tokens for producing more similar translations to the reference translations than the baseline system. This was confirmed by the higher proportion of matched tokens in NFR translations that also appeared in the reference translations when compared to the baseline system. The analysis also showed that higher-scoring FMs not only had a higher percentage of matched tokens, but also that a higher proportion of these tokens appeared in the NFR output. In other words, the NFR system became more confident about using matching tokens in the translations when the FM was highly similar to the source sentence. Another observation is that NFR seemed to be more influenced by the first FM than by the second FM. Even though, in the current NFR configuration, the first FM always had a higher similarity score to the source sentence, it may be interesting to analyse whether this effect was intensified due to the order in which FMs were concatenated to the source sentences.
At the same time, the NFR output also contained more no-match tokens than the baseline NMT output and most of these tokens did not appear in the reference translation. This demonstrates that this data augmentation method, to a certain extent, also introduced FM-related noise in the translations. This phenomenon was observed in spite of the fact that matched and non-matched tokens were labelled with a different feature (see Section 4.2). However, our analyses also showed that a considerable proportion of FM tokens that were labelled as no-match also appeared in the reference translations. In this context, it should be noted that the automatic alignment method used in the NFR approach is not a fail-safe procedure and that certain non-aligned tokens may be relevant regardless of being aligned to the source sentence. This would need to be analysed in a follow-up study, in which the quality of alignments is explicitly evaluated and linked to the quality of (and/or errors in) NFR output.

6.1.4. RQ4: Factors Influencing NFR Quality

With a view to further improve the NFR system, we tried to identify which features influenced NFR quality, in comparison to the quality of baseline NMT translations. We identified seven potential features, six of which were maintained in our final model. Not surprisingly, the similarity score of the first FM was confirmed to have a strong positive impact on NFR quality [3]. However our model also predicted the similarity score of the second FM to negatively influence NFR quality. This could mean that it is indeed a good strategy to not always select the match with the second-highest score to be added as second FM. This is exactly what the maximum coverage mechanism, explained in Section 4.2, aims to achieve. The analysis also confirmed that increasing the total number of matched tokens for both FMs combined was associated with a higher TER difference between NFR and baseline. Moreover, it seemed to be better to select two FMs that did not differ too much in terms of their lengths but, at the same time, to select matches that did differ in terms of their syntactic structure. Taken together, these results suggest that it could be worthwhile to attempt to better model the joint selection of both FMs in NFR, for example, by imposing additional restrictions in terms of syntactic similarity and length ratios between the FMs.
We are aware of the fact that the explanatory power of our linear model is limited, with only a small percentage of variance explained, but, in this context, it is important to note that we modelled the difference in TER scores between NFR and baseline NMT translations and not the TER scores as such. The overall absolute TER difference between the two systems on the test set was only 4.41 points. In addition, we also do not expect to be able to explain all of the variance in TER scores based on the features included in the model, considering the inherent variation in single-sentence translations. In spite of this, we believe that TER difference, while showing less variation, was a more meaningful variable to model than absolute TER scores for this particular analysis, since we were interested in modelling the difference in quality between the two systems. At the same time, while we were aiming for explicability with this linear and additive model, we may have oversimplified the complex interrelationships between the features themselves, as well as between the features and the TER difference scores (which were non-linear in certain cases). Whatever the case may be, the potential merit of this analysis should be tested by evaluating the impact of integrating these features in the FM-selection component of the NFR system on translation quality.

6.2. Limitations

In our discussion of this study’s findings, we touch upon a number of potential limitations. In this section, we focus on some additional issues that we feel should be made explicit. First, none of the MT evaluation methods are without controversy and, potentially, inherent problems [1] and the methods used in this study are no different. To date, there is also no universally agreed-upon methodology for either of these approaches [54]. This being said, we feel that an empirical study involving a task-specific evaluation of post-editing productivity (i.e., temporal post-editing effort) would give us more insight into the potential practical benefits of NFR compared to a baseline NMT system. It should be noted that measuring temporal post-editing effort is argued to be the most (if not only) meaningful when the measurements are carried out with highly-qualified translators, using the tools of their preference and carrying out real post-editing tasks with realistic time constraints, which should all be taken into account when setting up such an empirical study [59,73].
Second and related to this, the annotators in this study did not work for European institutions, which led to potential problems with error identification, especially with respect to lexical choices. Third, we did not manually verify the reference translations in the test set. Even though DGT-TM is well maintained, it cannot be excluded that there are, for example, misaligned translation pairs or translations that are not entirely accurate [2]. Fourth, it is a well-established fact that relying on a single reference translation is problematic [1], although, in practice, it is often not possible to obtain alternative translations, especially when the data sets originate from TMs. Finally, the evaluations in this study only concerned a single translation context and data set, as well as a single language pair and translation direction.

7. Conclusions

This study set out to provide a more thorough and multifaceted evaluation of the NFR approach to NMT data augmentation, which relies on the retrieval of fuzzy matches from a TM. The evaluations were carried out both automatically, by relying on a broad spectrum of automated quality metrics, and manually, by performing fine-grained human error annotation. In terms of results, all automated metrics, which compared the MT output to a reference translation, indicated higher scores for the NFR system than for an NMT baseline and confirmed the significant improvements it achieved in estimated translation quality [4,5]. The detailed TER analysis showed that the strengths of the NFR system are to produce translations with more similar lexical choices and word order than the reference translations. It also showed that the reduction in the amount of edits was balanced between content and function words.
The error analysis, which did not rely on reference translations, did not yield the same results, as both systems made a comparable amount of errors. We did find different error profiles for both systems. While the NFR system produced more fluent translations, with a significant reduction in lexicon and coherence errors, it also diverged from the source content and meaning (i.e., reduced accuracy) more often than the baseline NMT system, making more errors of addition and mistranslations, which were semantically unrelated to the source content. On the other hand, we observed that 21% of the annotated accuracy errors also appeared in the reference translations, which, at least in part, can be attributed to translation decisions taken in the context of document-level translation tasks. Taken together, the analyses seemed to indicate that NFR can lead to improvements in translation quality compared to a baseline NMT system with regard to lexical choices and, more generally speaking, in terms of what we label “exactness” or, in other words, the ability to be consistent and to closely resemble (in terms of semantics, lexicon and syntax) a reference translation.
An additional aim of this study was to more closely analyse the impact the retrieved and added fuzzy matches had on the MT output, with a view to identifying features that could be used to further improve the NFR system. We found that the tokens in the fuzzy translations appeared more frequently in the NFR output than in baseline NMT translations. This was the case for both tokens that were aligned to tokens in the input sentence and those that were not. In both cases, we observed that more of these tokens were also present in the reference translations. We were also able to identify a number of features related to the length, number of aligned tokens and similarity of the fuzzy matches, including syntactic similarity, that could potentially be used to improve the selection of fuzzy matches in the context of NFR.
In future work, we hope to carry out an empirical study focused on measuring translators’ post-editing effort when using NFR compared to a baseline NMT system in a CAT workflow. One potential added advantage of NFR in such a setting is the possibility to automatically annotate the MT output with information that is potentially useful for translators, such as indications of which tokens also appear in the best-scoring fuzzy match retrieved from the TM. Next to this empirical study, experiments should also be carried out aimed at exploring whether the features identified in this study can be employed to further improve the quality of NFR translations.

Author Contributions

Conceptualization, A.T. and B.B.; methodology, A.T. and B.B.; software, A.T. and B.B.; validation, A.T. and B.B.; formal analysis, A.T. and B.B.; investigation, A.T. and B.B.; resources, A.T. and B.B.; data curation, A.T. and B.B.; writing—original draft preparation, A.T. and B.B.; writing—review and editing, A.T. and B.B.; visualization, A.T. and B.B.; supervision, A.T. and B.B.; project administration, A.T.; funding acquisition, A.T. All authors have read and agreed to the published version of the manuscript.

Funding

This research study was funded by Research Foundation—Flanders (FWO).

Institutional Review Board Statement

The study was approved by the Ethics Committee, Faculty of Arts and Philosophy, Ghent University (11-02-2021).

Informed Consent Statement

Informed consent was obtained from all subjects involved in the study.

Data Availability Statement

Publicly available data sets were analysed in this study. These data can be found at https://ec.europa.eu/jrc/en/language-technologies/dgt-translation-memory (accessed on 15 August 2020).

Conflicts of Interest

The authors declare no conflict of interest. The funders had no role in the design of the study; in the collection, analyses, or interpretation of data; in the writing of the manuscript, or in the decision to publish the results.

Abbreviations

The following abbreviations are used in this manuscript:
CATcomputer-assisted translation
FMfuzzy match
NFRneural fuzzy repair
NMTneural machine translation
MTmachine translation
TMtranslation memory

Appendix A. Details of Automated Quality Metrics

BLEU was implemented with the multi-bleu script (https://github.com/moses-smt/mosesdecoder/blob/master/scripts/generic/multi-bleu.perl (accessed on 2 November 2021)). We used version 1.5 of METEOR (https://www.cs.cmu.edu/~alavie/METEOR/ (accessed on 2 November 2021)) and version 0.7.25 of TER. For COMET, we used version 1.0.1 of the model wmt20-comet-da (https://github.com/Unbabel/COMET (accessed on 2 November 2021)). BERTScore was calculated with version 0.3.10 (https://github.com/Tiiiger/bert_score (accessed on 2 November 2021)). Finally, for the computation of ChrF, we relied on ChrF++ (https://github.com/m-popovic/chrF (accessed on 2 November 2021)) and DTED was calculated with the ASTrED library (https://github.com/BramVanroy/astred (accessed on 2 November 2021)).

Appendix B

Table A1. Automatic evaluation results for the subset of the test set which was used for error annotation and the level of statistical significance of the differences per metric (* p < 0.05 ; *** p < 0.001 ).
BLEU ↑METEOR ↑TER ↓chrF ↓BERTScore ↑COMET ↑DTED ↓
Baseline NMT45.0266.3738.5367.9089.8671.1336.23
NFR54.7372.6032.5573.5991.4774.3933.19
S. Significance****************
Table A2. BLEU scores for the baseline NMT and the NFR system for the subset used for manual evaluation, as well as the difference between the BLEU scores obtained by the baseline and NFR systems. % sentences shows the percentage of sentences that make up the different subsets.
All50–59%60–69%70–79%80–89%90–99%
Baseline NMT45.0235.0238.2941.7446.2656.96
NFR54.7335.6639.4348.0658.5672.51
Diff. NFR-NMT+9.71+0.64+1.14+6.32+12.30+15.55
% sentences%100%10%20%20%25%25
Table A3. Confusion matrix error detection at token and sentence level, for baseline NMT and NFR system.
Annotator 1
Token LevelSentence Level
Baseline NMTNFRBaseline NMTNFR
YesNoYesNoYesNoYesNo
Annotator 2Yes14716717817960297630
No104520511352421819311183
Table A4. Number of TER edits per edit type, for content-words (Cont), function-words (Func) and other tokens/words that did not fall into either category (Oth). Values with a higher amount of edits for the NFR system are highlighted with underscore. BASE refers to the baseline NMT system.
FM 50–59FM 60–69FM 70–79FM 80–89FM 90–99
BASENFRBASENFRBASENFRBASENFRBASENFR
INS (Cont)555537109311269979938237021255852
INS (Func)591565127412831113106296088215601147
INS (Oth)9793177187198205193217444384
DEL (Cont)350359790777610573535434760517
DEL (Func)419402827868763707615479968623
DEL (Oth)52369398103837772150140
SUB (Cont)1729174232743189262323581842139726931361
SUB (Func)1124109122192205177616391379102719631015
SUB (Oth)83109192193190192148118299212
SHIFT-TOK (Cont)308302818821713663518416883438
SHIFT-TOK (Func)477489120111729868617265401140517
SHIFT-TOK (Oth)33301021019510195648955
SHIFT-GROUP234244590585499454359289563249
Table A5. Distribution of sentences with better translations per system according to TER, per fuzzy match ratio, including ties, when both systems achieved the same score.
DataNFR BetterBaseline NMT BetterTie
All36.5%21.1%42.4%
50–59%40.2%35.4%24.5%
60–69%35.7%36.8%27.4%
70–79%39.5%26.9%33.6%
80–89%38.1%17.9%44%
90–99%34.1%11.1%54.9%

References

  1. Castilho, S.; Doherty, S.; Gaspari, F.; Moorkens, J. Approaches to human and machine translation quality assessment. In Translation Quality Assessment; Springer: Cham, Switzerland, 2018; pp. 9–38. [Google Scholar]
  2. Way, A. Quality expectations of machine translation. In Translation Quality Assessment; Springer: Cham, Switzerland, 2018; pp. 159–178. [Google Scholar]
  3. Bulte, B.; Tezcan, A. Neural Fuzzy Repair: Integrating Fuzzy Matches into Neural Machine Translation. In Proceedings of the 57th Annual Meeting of the Association for Computational Linguistics, Florence, Italy, 28 July–2 August 2019; pp. 1800–1809. [Google Scholar] [CrossRef]
  4. Tezcan, A.; Bulté, B.; Vanroy, B. Towards a Better Integration of Fuzzy Matches in Neural Machine Translation through Data Augmentation. Informatics 2021, 8, 7. [Google Scholar] [CrossRef]
  5. Xu, J.; Crego, J.; Senellart, J. Boosting Neural Machine Translation with Similar Translations. In Proceedings of the 58th Annual Meeting of the Association for Computational Linguistics, Online, 5–10 July 2020; Association for Computational Linguistics: Stroudsburg, PA, USA, 2020; pp. 1580–1590. [Google Scholar] [CrossRef]
  6. Papineni, K.; Roukos, S.; Ward, T.; Zhu, W.J. Bleu: A Method for Automatic Evaluation of Machine Translation. In Proceedings of the 40th Annual Meeting of the Association for Computational Linguistics, Philadelphia, PA, USA, 7–12 July 2002; Association for Computational Linguistics: Philadelphia, PA, USA, 2002; pp. 311–318. [Google Scholar] [CrossRef] [Green Version]
  7. Popović, M.; Lommel, A.; Burchardt, A.; Avramidis, E.; Uszkoreit, H. Relations between different types of post-editing operations, cognitive effort and temporal effort. In Proceedings of the 17th Annual Conference of the European Association for Machine Translation, Dubrovnik, Croatia, 16–18 June 2014; pp. 191–198. [Google Scholar]
  8. Drugan, J.; Strandvik, I.; Vuorinen, E. Translation quality, quality management and agency: Principles and practice in the European Union institutions. In Translation Quality Assessment; Springer: Cham, Switzerland, 2018; pp. 39–68. [Google Scholar]
  9. Reinke, U. State of the art in translation memory technology. In Language Technologies for a Multilingual Europe; Rehm, G., Stein, D., Sasaki, F., Witt, A., Eds.; Language Science Press: Berlin, Germany, 2018; Chapter 5; pp. 55–84. [Google Scholar] [CrossRef]
  10. Levenshtein, V. Binary codes capable of correcting deletions, insertions, and reversals. Sov. Phys. Dokl. 1966, 10, 707–710. [Google Scholar]
  11. Bloodgood, M.; Strauss, B. Translation Memory Retrieval Methods. In Proceedings of the 14th Conference of the European Chapter of the Association for Computational Linguistics, Gothenburg, Sweden, 26–30 April 2014; Association for Computational Linguistics: Gothenburg, Sweden, 2014; pp. 202–210. [Google Scholar] [CrossRef] [Green Version]
  12. Baldwin, T. The hare and the tortoise: Speed and accuracy in translation retrieval. Mach. Transl. 2009, 23, 195–240. [Google Scholar] [CrossRef]
  13. Ranasinghe, T.; Orasan, C.; Mitkov, R. Intelligent Translation Memory Matching and Retrieval with Sentence Encoders. In Proceedings of the 22nd Annual Conference of the European Association for Machine Translation, Lisboa, Portugal, 3–5 November 2020; European Association for Machine Translation: Lisboa, Portugal, 2020; pp. 175–184. [Google Scholar]
  14. Vanallemeersch, T.; Vandeghinste, V. Assessing linguistically aware fuzzy matching in translation memories. In Proceedings of the 18th Annual Conference of the European Association for Machine Translation, Antalya, Turkey, 11–13 May 2015; EAMT: Antalya, Turkey, 2015; pp. 153–160. [Google Scholar]
  15. Koponen, M. Is machine translation post-editing worth the effort? A survey of research into post-editing and effort. J. Spec. Transl. 2016, 25, 131–148. [Google Scholar]
  16. Rossi, C.; Chevrot, J.P. Uses and perceptions of Machine Translation at the European Commission. J. Spec. Transl. 2019, 31, 177–200. [Google Scholar]
  17. Stefaniak, K. Evaluating the usefulness of neural machine translation for the Polish translators in the European Commission. In Proceedings of the 22nd Annual Conference of the European Association for Machine Translation, Lisboa, Portugal, 3–5 November 2020; European Association for Machine Translation: Lisboa, Portugal, 2020; pp. 263–269. [Google Scholar]
  18. Simard, M.; Isabelle, P. Phrase-based machine translation in a computer-assisted translation environment. In Proceedings of the MT Summit XII, Ottawa, ON, Canada, 26–30 August 2009; AMTA: Ottawa, ON, Canada, 2009; pp. 120–127. [Google Scholar]
  19. Moorkens, J.; O’Brien, S. Assessing user interface needs of post-editors of machine translation. In Human Issues in Translation Technology: The IATIS Yearbook; Taylor & Francis: Abingdon, UK, 2016; pp. 109–130. [Google Scholar]
  20. Sánchez-Gijón, P.; Moorkens, J.; Way, A. Post-editing neural machine translation versus translation memory segments. Mach. Transl. 2019, 33, 31–59. [Google Scholar] [CrossRef]
  21. Bulté, B.; Vanallemeersch, T.; Vandeghinste, V. M3TRA: Integrating TM and MT for professional translators. In Proceedings of the 21st Annual Conference of the European Association for Machine Translation, Alicante, Spain, 28–30 May 2018; EAMT: Alicante, Spain, 2018; pp. 69–78. [Google Scholar]
  22. Koehn, P.; Senellart, J. Convergence of Translation Memory and Statistical Machine Translation. In Proceedings of the AMTA Workshop on MT Research and the Translation Industry, Denver, CO, USA, 31 October–4 November 2010; Association for Machine Translation in the Americas: Denver, CO, USA, 2010; pp. 21–31. [Google Scholar]
  23. Kranias, L.; Samiotou, A. Automatic Translation Memory Fuzzy Match Post-Editing: A Step Beyond Traditional TM/MT Integration. In Proceedings of the Fourth International Conference on Language Resources and Evaluation (LREC’04), Lisbon, Portugal, 26–28 May 2004; European Language Resources Association (ELRA): Lisbon, Portugal, 2004; pp. 331–334. [Google Scholar]
  24. Ortega, J.E.; Forcada, M.L.; Sanchez-Martinez, F. Fuzzy-match repair guided by quality estimation. IEEE Trans. Pattern Anal. Mach. Intell. 2020. [Google Scholar] [CrossRef]
  25. Feng, Y.; Zhang, S.; Zhang, A.; Wang, D.; Abel, A. Memory-augmented Neural Machine Translation. In Proceedings of the 2017 Conference on Empirical Methods in Natural Language Processing, Stroudsburg, PA, USA, 7–11 September 2017; Association for Computational Linguistics: Copenhagen, Denmark, 2017; pp. 1390–1399. [Google Scholar] [CrossRef]
  26. He, Q.; Huang, G.; Cui, Q.; Li, L.; Liu, L. Fast and accurate neural machine translation with translation memory. In Proceedings of the 59th Annual Meeting of the Association for Computational Linguistics and the 11th International Joint Conference on Natural Language Processing, Online, 1–6 August 2021; pp. 3170–3180. [Google Scholar]
  27. Khandelwal, U.; Fan, A.; Jurafsky, D.; Zettlemoyer, L.; Lewis, M. Nearest neighbor machine translation. arXiv 2020, arXiv:2010.00710. [Google Scholar]
  28. Zhang, J.; Utiyama, M.; Sumita, E.; Neubig, G.; Nakamura, S. Guiding Neural Machine Translation with Retrieved Translation Pieces. In Proceedings of the 2018 Conference of the North American Chapter of the Association for Computational Linguistics: Human Language Technologies, Minneapolis, MN, USA, 2–7 June 2019; Association for Computational Linguistics: New Orleans, LA, USA, 2018; pp. 1325–1335. [Google Scholar] [CrossRef]
  29. Vaswani, A.; Shazeer, N.; Parmar, N.; Uszkoreit, J.; Jones, L.; Gomez, A.N.; Kaiser, Ł.; Polosukhin, I. Attention is all you need. In Proceedings of the 30th Conference on Neural Information Processing Systems, Long Beach, CA, USA, 4–9 December 2017; Neural Information Processing Systems Foundation: Long Beach, CA, USA, 2017; pp. 5998–6008. [Google Scholar]
  30. Hokamp, C.; Liu, Q. Lexically Constrained Decoding for Sequence Generation Using Grid Beam Search. In Proceedings of the 55th Annual Meeting of the Association for Computational Linguistics, Vancouver, BC, Canada, 30 July–4 August 2017; Association for Computational Linguistics: Vancouver, BC, Canada, 2017; pp. 1535–1546. [Google Scholar] [CrossRef] [Green Version]
  31. Dabre, R.; Cromieres, F.; Kurohashi, S. Enabling multi-source neural machine translation by concatenating source sentences in multiple languages. arXiv 2017, arXiv:1702.06135. [Google Scholar]
  32. Hossain, N.; Ghazvininejad, M.; Zettlemoyer, L. Simple and Effective Retrieve-Edit-Rerank Text Generation. In Proceedings of the 58th Annual Meeting of the Association for Computational Linguistics, Online, 5–10 July 2020; Association for Computational Linguistics: Stroudsburg, PA, USA, 2020; pp. 2532–2538. [Google Scholar] [CrossRef]
  33. Zhang, J.; Wang, X.; Zhang, H.; Sun, H.; Liu, X. Retrieval-based neural source code summarization. In Proceedings of the 2020 IEEE/ACM 42nd International Conference on Software Engineering (ICSE), Online, 24 June–16 July 2020; pp. 1385–1397. [Google Scholar]
  34. Li, Z.; Specia, L. Improving Neural Machine Translation Robustness via Data Augmentation: Beyond Back-Translation. In Proceedings of the 5th Workshop on Noisy User-Generated Text, Hong Kong, China, 4 November 2019; Association for Computational Linguistics: Hong Kong, China, 2019; pp. 328–336. [Google Scholar] [CrossRef]
  35. Banar, N.; Daelemans, W.; Kestemont, M. Neural machine translation of artwork titles using iconclass codes. In Proceedings of the the 4th Joint SIGHUM Workshop on Computational Linguistics for Cultural Heritage, Social Sciences, Humanities and Literature, Online, 12 December 2020; pp. 42–51. [Google Scholar]
  36. Cai, D.; Wang, Y.; Li, H.; Lam, W.; Liu, L. Neural machine translation with monolingual translation memory. arXiv 2021, arXiv:2105.11269. [Google Scholar]
  37. Hutchins, W.J.; Somers, H.L. An introduction to Machine Translation; Academic Press London: London, UK, 1992. [Google Scholar]
  38. Harris, K.; Burchardt, A.; Rehm, G.; Specia, L. Technology Landscape for Quality Evaluation: Combining the Needs of Research and Industry. In Proceedings of the LREC Workshop on Translation Evaluation, Portorož, Slovenia, 24 May 2016; pp. 50–54. [Google Scholar]
  39. Koby, G.; Fields, P.; Hague, D.; Lommel, A.; Melby, A. Defining translation quality. Revista tradumàtica Traducció i Tecnologies de la Informació i la Comunicació 2014, 12, 413–420. [Google Scholar] [CrossRef] [Green Version]
  40. Toury, G. The nature and role of norms in translation. Descr. Transl. Stud. Beyond 1995, 4, 53–69. [Google Scholar]
  41. White, J. Approaches to black box MT evaluation. In Proceedings of the Machine Translation Summit V, Luxembourg, 10–13 July 1995. [Google Scholar]
  42. Banerjee, S.; Lavie, A. METEOR: An Automatic Metric for MT Evaluation with Improved Correlation with Human Judgments. In Proceedings of the ACL Workshop on Intrinsic and Extrinsic Evaluation Measures for Machine Translation and/or Summarization, Ann Arbor, MI, USA, 29 June 2005; Association for Computational Linguistics: Ann Arbor, MI, USA, 2005; pp. 65–72. [Google Scholar]
  43. Doddington, G. Automatic Evaluation of Machine Translation Quality Using N-Gram Co-Occurrence Statistics. In Proceedings of the Second International Conference on Human Language Technology Research, San Francisco, CA, USA, 24–27 March 2002; pp. 138–145. [Google Scholar]
  44. Popović, M. chrF: Character n-gram F-score for automatic MT evaluation. In Proceedings of the Tenth Workshop on Statistical Machine Translation, Lisbon, Portugal, 17–18 September 2015; pp. 392–395. [Google Scholar]
  45. Snover, M.; Dorr, B.; Schwartz, R.; Micciulla, L.; Makhoul, J. A study of translation edit rate with targeted human annotation. In Proceedings of the 2006 Conference of the Association for Machine Translation in the Americas, Cambridge, MA, USA, 8–12 August 2006; AMTA: Cambridge, MA, USA, 2006; pp. 223–231. [Google Scholar]
  46. Zhang, T.; Kishore, V.; Wu, F.; Weinberger, K.; Artzi, Y. BERTScore: Evaluating text generation with BERT. arXiv 2019, arXiv:1904.09675. [Google Scholar]
  47. Rei, R.; Stewart, C.; Farinha, A.; Lavie, A. COMET: A neural framework for MT evaluation. arXiv 2020, arXiv:2009.09025. [Google Scholar]
  48. Feng, Y.; Xie, W.; Gu, S.; Shao, C.; Zhang, W.; Yang, Z.; Yu, D. Modeling fluency and faithfulness for diverse neural machine translation. In Proceedings of the AAAI Conference on Artificial Intelligence, New York, NY, USA, 7–12 February 2020; pp. 59–66. [Google Scholar]
  49. Mikolov, T.; Chen, K.; Corrado, G.; Dean, J. Efficient estimation of word representations in vector space. arXiv 2013, arXiv:1301.3781. [Google Scholar]
  50. McCaffery, M.; Nederhof, M.J. DTED: Evaluation of machine translation structure using dependency parsing and tree edit distance. In Proceedings of the First Conference on Machine Translation, Berlin, Germany, 11–12 August 2016; pp. 491–498. [Google Scholar]
  51. Specia, L.; Raj, D.; Turchi, M. Machine translation evaluation versus quality estimation. Mach. Transl. 2010, 24, 39–50. [Google Scholar] [CrossRef]
  52. Mathur, N.; Wei, J.; Freitag, M.; Ma, Q.; Bojar, O. Results of the WMT20 metrics shared task. In Proceedings of the Fifth Conference on Machine Translation, Association for Computational Linguistics, Online, 19–20 November 2020; pp. 688–725. [Google Scholar]
  53. Kocmi, T.; Federmann, C.; Grundkiewicz, R.; Junczys-Dowmunt, M.; Matsushita, H.; Menezes, A. To ship or not to ship: An extensive evaluation of automatic metrics for machine translation. arXiv 2021, arXiv:2107.10821. [Google Scholar]
  54. Freitag, M.; Rei, R.; Mathur, N.; Lo, C.; Stewart, C.; Foster, G.; Lavie, A.; Bojar, O. Results of the WMT21 Metrics Shared Task: Evaluating Metrics with Expert-based Human Evaluations on TED and News Domain. In Proceedings of the Sixth Conference on Machine Translation, Association for Computational Linguistics, Online, 10–11 November 2021. [Google Scholar]
  55. Callison-Burch, C.; Fordyce, C.; Koehn, P.; Monz, C.; Schroeder, J. Further meta-evaluation of machine translation. In Proceedings of the Third Workshop on Statistical Machine Translation, Columbus, OH, USA, 19 June 2008; pp. 70–106. [Google Scholar]
  56. Graham, Y.; Baldwin, T.; Moffat, A.; Zobel, J. Continuous measurement scales in human evaluation of machine translation. In Proceedings of the 7th Linguistic Annotation Workshop and Interoperability with Discourse, Columbus, OH, USA, 19 June 2013; pp. 33–41. [Google Scholar]
  57. Bentivogli, L.; Cettolo, M.; Federico, M.; Federmann, C. Machine translation human evaluation: An investigation of evaluation based on post-editing and its relation with direct assessment. In Proceedings of the 15th International Workshop on Spoken Language Translation, Bruges, Belgium, 29–30 October 2018; pp. 62–69. [Google Scholar]
  58. Sanchez-Torron, M.; Koehn, P. Machine Translation Quality and Post-Editor Productivity. In Proceedings of the Conference of the Association for Machine Translation in the Americas (AMTA) Vol. 1: MT Researchers’ Track, Austin, TX, USA, 28 October–1 November 2016; Association for Machine Translation in the Americas (AMTA): Austin, TX, USA, 2016; pp. 16–26. [Google Scholar]
  59. Läubli, S.; Fishel, M.; Massey, G.; Ehrensberger-Dow, M.; Volk, M.; O’Brien, S.; Simard, M.; Specia, L. Assessing post-editing efficiency in a realistic translation environment. In Proceedings of the MT Summit XIV Workshop on Post-editing Technology and Practice, Nice, France, 3 September 2013; pp. 83–91. [Google Scholar]
  60. Daems, J. A translation Robot for Each Translator?: A Comparative Study of Manual Translation and Post-Editing of Machine Translations: Process, Quality and Translator Attitude. Ph.D. Thesis, Ghent University, Ghent, Belgium, 2016. [Google Scholar]
  61. Vilar, D.; Xu, J.; D’Haro, L.F.; Ney, H. Error Analysis of Statistical Machine Translation Output. In Proceedings of the International Conference on Language Resources and Evaluation (LREC), Genoa, Italy, 22–28 May 2006; pp. 697–702. [Google Scholar]
  62. Avramidis, E.; Koehn, P. Enriching morphologically poor languages for statistical machine translation. In Proceedings of the Association for Computer Linguistics (ACL), Columbus, OH, USA, 15–20 June 2008; pp. 763–770. [Google Scholar]
  63. Farrús, M.; Costa-Jussa, M.; Marino, J.; Poch, M.; Hernández, A.; Henríquez, C.; Fonollosa, J. Overcoming statistical machine translation limitations: Error analysis and proposed solutions for the Catalan–Spanish language pair. Lang. Resour. Eval. 2011, 45, 181–208. [Google Scholar] [CrossRef] [Green Version]
  64. Costa, A.; Ling, W.; Luís, T.; Correia, R.; Coheur, L. A linguistically motivated taxonomy for Machine Translation error analysis. Mach. Transl. 2015, 29, 127–161. [Google Scholar] [CrossRef] [Green Version]
  65. Lommel, A.; Burchardt, A.; Uszkoreit, H. Multidimensional Quality Metrics (MQM): A Framework for Declaring and Describing Translation Quality Metrics. Tradumàtica 2014, 12, 455–463. [Google Scholar] [CrossRef] [Green Version]
  66. Tezcan, A.; Hoste, V.; Macken, L. SCATE taxonomy and corpus of machine translation errors. Trends E-tools Resour. Transl. Interpret. 2017, 32, 219–244. [Google Scholar]
  67. Klubička, F.; Toral, A.; Sánchez-Cartagena, V. Fine-grained human evaluation of neural versus phrase-based machine translation. arXiv 2017, arXiv:1706.04389. [Google Scholar]
  68. Lommel, A.; Popović, M.; Burchardt, A. Assessing Inter-Annotator Agreement for Translation Error Annotation. In Proceedings of the International Conference on Language Resources and Evaluation (LREC), Workshop on Automatic and Manual Metrics for Operational Translation Evaluation, Reykjavik, Iceland, 26 May 2014. [Google Scholar]
  69. Tezcan, A.; Daems, J.; Macken, L. When a ‘sport’ is a person and other issues for NMT of novels. In Proceedings of the Qualities of Literary Machine Translation, Florence, Italy, 19 August 2019; European Association for Machine Translation: Dublin, Ireland, 2019; pp. 40–49. [Google Scholar]
  70. Vardaro, J.; Schaeffer, M.; Hansen-Schirra, S. Translation quality and error recognition in professional neural machine translation post-editing. In Informatics; Multidisciplinary Digital Publishing Institute: Basel, Switzerland, 2019; Volume 6, p. 41. [Google Scholar]
  71. Hayakawa, T.; Arase, Y. Fine-Grained Error Analysis on English-to-Japanese Machine Translation in the Medical Domain. In Proceedings of the 22nd Annual Conference of the European Association for Machine Translation, Lisbon, Portugal, 3–5 November 2020; pp. 155–164. [Google Scholar]
  72. Läubli, S.; Sennrich, R.; Volk, M. Has Machine Translation Achieved Human Parity? A Case for Document-level Evaluation. In Proceedings of the 2018 Conference on Empirical Methods in Natural Language Processing, Brussels, Belgium, 2–4 November 2018; pp. 4791–4796. [Google Scholar]
  73. Macken, L.; Prou, D.; Tezcan, A. Quantifying the effect of machine translation in a high-quality human translation production process. Informatics 2020, 7, 12. [Google Scholar] [CrossRef] [Green Version]
  74. Steinberger, R.; Eisele, A.; Klocek, S.; Pilos, S.; Schlüter, P. DGT-TM: A freely available Translation Memory in 22 languages. In Proceedings of the Eighth International Conference on Language Resources and Evaluation (LREC’12), Istanbul, Turkey, 23–25 May 2012; European Language Resources Association (ELRA): Istanbul, Turkey, 2012; pp. 454–459. [Google Scholar]
  75. Koehn, P.; Hoang, H.; Birch, A.; Callison-Burch, C.; Federico, M.; Bertoldi, N.; Cowan, B.; Shen, W.; Moran, C.; Zens, R.; et al. Moses: Open Source Toolkit for Statistical Machine Translation. In Proceedings of the 45th Annual Meeting of the Association for Computational Linguistics, Prague, Czech Republic, 23–30 June 2007; Association for Computational Linguistics: Prague, Czech Republic, 2007; pp. 177–180. [Google Scholar]
  76. Klein, G.; Kim, Y.; Deng, Y.; Senellart, J.; Rush, A.M. OpenNMT: Open-source toolkit for neural machine translation. arXiv 2017, arXiv:1701.02810. [Google Scholar]
  77. Pagliardini, M.; Gupta, P.; Jaggi, M. Unsupervised Learning of Sentence Embeddings Using Compositional n-Gram Features. In Proceedings of the 2018 Conference of the North American Chapter of the Association for Computational Linguistics: Human Language Technologies, New Orleans, LA, USA, 1–6 June 2018; Association for Computational Linguistics: New Orleans, LA, USA, 2018; pp. 528–540. [Google Scholar] [CrossRef]
  78. Johnson, J.; Douze, M.; Jégou, H. Billion-scale similarity search with GPUs. IEEE Trans. Big Data 2019, 7, 535–547. [Google Scholar] [CrossRef] [Green Version]
  79. Sennrich, R.; Haddow, B.; Birch, A. Neural Machine Translation of Rare Words with Subword Units. In Proceedings of the 54th Annual Meeting of the Association for Computational Linguistics, Berlin, Germany, 7–12 August 2016; Association for Computational Linguistics: Berlin, Germany, 2016; pp. 1715–1725. [Google Scholar] [CrossRef]
  80. Och, F.J.; Ney, H. A Systematic Comparison of Various Statistical Alignment Models. Comput. Linguist. 2003, 29, 19–51. [Google Scholar] [CrossRef]
  81. Pawlik, M.; Augsten, N. Efficient computation of the tree edit distance. ACM Trans. Database Syst. 2015, 40, 1–40. [Google Scholar] [CrossRef]
  82. Koponen, M.; Aziz, W.; Ramos, L.; Specia, L. Post-editing time as a measure of cognitive effort. In Proceedings of the Association for Computer Linguistics (ACL), Workshop on Post-Editing Technology and Practice, San Diego, CA, USA, 28 October–1 November 2012; pp. 11–20. [Google Scholar]
  83. Koponen, M. Comparing human perceptions of post-editing effort with post-editing operations. In Proceedings of the Seventh Workshop on Statistical Machine Translation, Montreal, QC, Canada, 7–8 June 2012; pp. 181–190. [Google Scholar]
  84. Denkowski, M.; Lavie, A. Meteor universal: Language specific translation evaluation for any target language. In Proceedings of the Ninth Workshop on Statistical Machine Translation, Baltimore, MD, USA, 26–27 June 2014; pp. 376–380. [Google Scholar]
  85. Nivre, J.; De Marneffe, M.C.; Ginter, F.; Goldberg, Y.; Hajic, J.; Manning, C.D.; McDonald, R.; Petrov, S.; Pyysalo, S.; Silveira, N.; et al. Universal dependencies v1: A multilingual treebank collection. In Proceedings of the Tenth International Conference on Language Resources and Evaluation (LREC’16), Miyazaki, Japan, 23–28 May 2016; pp. 1659–1666. [Google Scholar]
  86. Qi, P.; Zhang, Y.; Zhang, Y.; Bolton, J.; Manning, C. Stanza: A Python Natural Language Processing Toolkit for Many Human Languages. arXiv 2020, arXiv:2003.07082. [Google Scholar]
  87. Fonteyne, M.; Tezcan, A.; Macken, L. Literary Machine Translation under the Magnifying Glass: Assessing the Quality of an NMT-Translated Detective Novel on Document Level. In Proceedings of the 12th Language Resources and Evaluation Conference, Marseille, France, 7–12 May 2020; pp. 3790–3798. [Google Scholar]
  88. R Core Team. R: A Language and Environment for Statistical Computing; R Core Team: Vienna, Austria, 2020. [Google Scholar]
  89. Ripley, B.; Venables, B.; Bates, D.; Hornik, K.; Gebhardt, A.; Firth, D. Package ‘Mass’. Available online: https://cran.r-project.org/web/packages/MASS/index.html (accessed on 20 October 2021).
  90. Akaike, H. Information theory and an extension of the maximum likelihood principle. In Proceeding of the Second International Symposium on Information Theory, Tsahkadsor, Armenia, U.S.S.R., 2–8 September 1971; Akademiai Kiado: Armenia, U.S.S.R., 1973; pp. 267–281. [Google Scholar]
  91. Federico, M.; Cattelan, A.; Trombetti, M. Measuring user productivity in machine translation enhanced computer assisted translation. In Proceedings of the 2012 Conference of the Association for Machine Translation in the Americas, San Diego, CA, USA, 28 October–1 November 2012; pp. 44–56. [Google Scholar]
  92. Zouhar, V.; Vojtěchová, T.; Bojar, O. WMT20 document-level markable error exploration. In Proceedings of the Fifth Conference on Machine Translation, Online, 19–20 November 2020; pp. 371–380. [Google Scholar]
  93. Tezcan, A.; Hoste, V.; Macken, L. Estimating post-editing time using a gold-standard set of machine translation errors. Comput. Speech Lang. 2019, 55, 120–144. [Google Scholar] [CrossRef]
  94. Federico, M.; Negri, M.; Bentivogli, L.; Turchi, M. Assessing the impact of translation errors on machine translation quality with mixed-effects models. In Proceedings of the 2014 Conference on Empirical Methods in Natural Language Processing (EMNLP), Doha, Qatar, 25–29 October 2014; pp. 1643–1653. [Google Scholar]
  95. Daems, J.; Vandepitte, S.; Hartsuiker, R.; Macken, L. Identifying the machine translation error types with the greatest impact on post-editing effort. Front. Front. Psychol. 2017, 8, 1282. [Google Scholar] [CrossRef] [Green Version]
Figure 1. Neural fuzzy repair: training and inference.
Information 13 00019 g001
Figure 2. Overview of the SCATE error taxonomy.
Information 13 00019 g002
Figure 3. Annotations obtained from (a) annotator 1 and (b) annotator 2 for the same source sentence (top) and the baseline NMT output (bottom). “Notenboom” would be the Dutch translation of “walnut tree”; “nut” was correctly translated by the NFR system as “moer”.
Information 13 00019 g003
Figure 4. Percentage of difference in total number of edits, per edit type, when NFR output is compared to the baseline NMT output for different fuzzy match (FM) ranges.
Information 13 00019 g004
Figure 5. Effect plots for six significant features in the linear model predicting TER difference: (A) source length, (B) FM1 score, (C) FM2 score, (D) length ratio fuzzy match 1 and 2, (E) total combined match token ratio of fuzzy matches 1 and 2 to source length and (F) dependency-tree edit distance between both fuzzy matches. Shaded areas show 95% confidence intervals.
Information 13 00019 g005
Table 1. Number of sentences in the test set and the subset used for manual evaluation per fuzzy match range.
50–59%60–69%70–79%80–89%90–99%All
Test setSentences45910121012119225146207
% of total7.4%16.3%16.3%19.2%40.5%
SubsetSentences3060607575300
% of total10%20%20%25%25%
Table 2. Overview of the automatic evaluation metrics.
MetricMethodUnitQuality Dimension Targeted
BLEUN-gram precisionToken stringExact lexical overlap
METEORN-gram precisionToken stringLexical overlap (with morphological and lexical variation)
TEREdit distanceToken stringMinimum number of edits (technical PE effort)
chrFN-gram F-scoreCharacter stringExact sub-word level overlap
BERTScoreVector similarityToken embeddingSemantic similarity
COMETVector similaritySentence embeddingSemantic similarity (predicting human quality ratings)
DTEDEdit distanceToken dep. labelSyntactic similarity
Table 3. Kappa scores for IAA on error detection.
Token LevelSentence Level
Baseline NMT0.4950.611
NFR0.5220.688
Table 4. Kappa scores for inter-annotator agreement on error classification at the three levels of the error taxonomy.
Baseline NMTNFR
Level 1
 Accuracy vs. Fluency0.9781
Level 2
 Accuracy0.9020.935
 Fluency0.8040.860
Level 3
 Accuracy → Mistranslation0.5960.763
 Fluency → Style and Register11
Table 5. Overview of candidate features.
Vocabulary frequency
  % of frequent/rare words in source sentence
Sentence length
  Length of source sentence
  Length ratios of source sentence, FM1 and FM2
FM similarity
  FM scores
  Ratio of match/no-match tokens in FMs
Syntax
  DTED between sources, FM1 and FM2
Table 6. Automatic evaluation results for TM, baseline NMT and NFR. Arrows next to each metric indicate that either higher scores (↑) or lower scores (↓) are better. Scores are reported per system, absolute and relative difference between baseline and NFR and difference in terms of standard (z) scores.
BLEU ↑METEOR ↑TER ↓chrF ↑BERTScore ↑COMET ↑DTED ↓
TM44.4956.1060.2659.6784.8614.4663.09
Baseline NMT58.8775.5329.6675.5292.5678.3329.76
NFR66.0779.4525.2579.3393.4981.7926.33
NMT vs. NFR
Absolute diff.+7.20+3.02−4.41+3.81+0.93+3.46+3.43
Relative diff.+12.23%+5.19%−14.87%+5.05%+1.00%+4.42%+11.53%
Z-score diff.+0.157+0.124−0.125+0.155+0.134+0.077−0.108
Table 7. BLEU scores for the TM, baseline NMT and NFR system in different FM ranges.
All50–59%60–69%70–79%80–89%90–99%
TM44.495.1810.7723.5243.9975.25
Baseline NMT58.8734.6442.9450.2459.0974.64
NFR66.0735.9743.6353.9367.2985.24
Table 8. Pearson correlations between the automatic evaluation scores per sentence calculated both for baseline NMT (lower left) and NFR outputs (upper right).
METEOR ↑TER ↓chrF ↑BERTScore ↑COMET ↑DTED ↓
METEOR1−0.8110.9230.9020.747−0.661
TER−0.8521−0.781−0.806−0.6930.838
chrF0.916−0.81810.9340.797−0.646
BERTScore0.890−0.8310.92910.824−0.728
COMET0.739−0.6950.7960.8201−0.608
DTED−0.6480.801−0.637−0.723−0.5911
Table 9. Number of TER edits per edit type (in total and per sentence), for content words, function words and other tokens/words and percentage difference between baseline NMT and NFR systems.
Baseline NMTNFRNMT vs. NFR
Total/SentTotal/Sent% Difference
InsertionsContent words47470.7642390.68−10.70
Function words55270.8949660.80−10.15
Other11140.1810890.18−2.24
Total11,3881.8310,2941.66−9.61
DeletionsContent words30630.4926770.43−12.60
Function words36090.5831020.50−14.05
Other4750.084310.07−9.26
Total71471.1562101.00−13.11
SubstitutionsContent words12,2581.9710,1461.63−17.23
Function words85111.3770301.13−17.40
Other9190.158320.13−9.47
Total21,6883.4918,0082.90−16.97
Token shiftsContent words32530.5226510.43−18.51
Function words45520.7336100.58−20.69
Other4150.073520.06−15.18
Total82201.3266131.07−19.55
Total token-level edits 48,4437.8041,1256.62−15.10
Group shifts 22550.3618320.30−18.76
Table 10. Overview of error analysis.
Baseline NMTNFR
Number of errors199199
Number of erroneous tokens395442
% of erroneous tokens7.0%7.9%
Number of sentences with error(s)120123
% of sentences with error(s)40%41%
Table 11. Number of errors per category of the SCATE error taxonomy, for the baseline NMT and NFR systems.
BASENFR BASENFR
FLUENCY8971ACCURACY110128
Coherence2011Mistranslation5857
 ○ Logical problem189 ○ Multiword expression105
 ○ Co-reference ○ Semantically unrelated1227
 ○ Cultural reference ○ Word sense148
 ○ Verb tense22 ○ Part-of-speech21
 ○ Inconsistency ○ Partial
Grammar and Syntax815 ○ Other2016
 ○ Extra word21Omission3640
 ○ Missing word26Addition825
 ○ Multi-word syntaxDo-not-translate
 ○ Word order22Untranslated2
 ○ Word form26Mechanical45
 ○ Other ○ Capitalization
Lexicon2912 ○ Punctuation45
 ○ Lexical choice179 ○ Other
 ○ Non-existing/Foreign71Other21
 ○ Wrong preposition52
Orthography24
 ○ Punctuation21
 ○ Capitalization
 ○ Spelling3
 ○ Other
Style and Register3029
 ○ Disfluent2626
 ○ Register11
 ○ Repetition32
 ○ Untranslated
Table 12. Analysis of match (m) and no-match (nm) tokens in FMs and whether they appeared in the MT output (pass) as well as in the reference translation (REF).
Full Test Set50–59%90–99%
NFRBaseline NMTNFRNFR
Fuzzy match 1
% m/FM162.226.682.7
% m-pass88.482.674.595.8
% m-pass-REF69.566.659.577.4
% nm/FM137.873.417.3
% nm-pass36.531.923.545.8
% nm-pass-REF29.627.317.438.7
Fuzzy match 2
% m/FM246.822.863.7
% m-pass82.180.269.889.0
% m-pass-REF66.465.454.074.7
% nm/FM253.277.236.3
% nm-pass26.825.711.532.5
% nm-pass-REF23.122.316.629.1
Table 13. Results feature analysis, including means and standard deviations (SD) per subset and t- and p-values of independent samples t-test, as well as Cohen’s d effect size. Features with effect sizes above 0.20 are indicated in red.
NFR BetterBaseline BetterT Test
(n = 1310)(n = 579)
MeanSDMeanSDtpd
Vocabulary frequency
 % Q9945.716.948.519.73.130.0020.16
 % Q9018.514.319.716.71.540.1230.08
 % Q758.39.48.810.80.990.3230.05
Length
Source30.220.425.519.8−4.64<0.0010.23
 FM1/source1.140.571.140.710.160.8750.00
 FM2/source1.531.411.671.451.950.0510.10
FM2/FM11.471.161.171.701.250.2130.22
FM similarity
FM1 score84.313.176.014.4−12.27<0.0010.61
% m/FM165.926.253.829.2−8.91<0.0010.45
FM2 score69.114.565.815.0−4.53<0.0010.23
 % m/FM241.726.838.126.4−2.680.0070.14
total_m/source87.128.977.942.4−5.48<0.0010.27
Syntax—DTED
 Source vs. FM10.860.420.840.48−0.370.7090.04
 Source vs. FM21.231.011.462.171.440.1510.16
FM1 vs. FM21.091.220.850.55−2.500.0130.22
Table 14. Parameter estimates (b), standard errors (S.E.), standardised estimates ( β ), t- and p-values for the linear model estimating TER difference. Adjusted R2 = 0.064. (* p < 0.05 ; ** p < 0.01 ; *** p < 0.001 ).
ParameterbS.E. β tp
(Intercept)−12.31.71 −7.24<0.001 ***
Length source0.0550.0120.0654.72<0.001 ***
Length FM1/FM22.621.000.0412.620.009 **
FM1 score40.412.940.32313.76<0.001 ***
FM2 score−34.742.50−0.302−13.87<0.001 ***
total_m/source4.631.370.0603.38<0.001 ***
DTED FM1 vs. FM21.480.590.0412.520.012 *
Table 15. Annotated errors that appeared in reference translations.
SystemAll ErrorsFluencyAccuracy
Baseline NMT17 (8.5%)6 (6.7%)11 (10%)
NFR36 (18.1%)9 (12.6%)27 (21.1%)
Table 16. Example of an addition found both in the NFR output and the reference translation.
Segment
Source (EN)Furthermore, the importers and the retailers will not be substantially
 affected
Baseline NMT (NL)Bovendien zullen de importeurs en detailhandelaren geen grote gevolgen
 ondervinden
NFR (NL)Bovendien zullen de importeurs en detailhandelaren geen ernstige gevolgen
van de maatregelen ondervinden
Reference (NL)Bovendien zullen de importeurs en kleinhandelaren geen ernstige gevolgen
van de maatregelen ondervinden
Publisher’s Note: MDPI stays neutral with regard to jurisdictional claims in published maps and institutional affiliations.

