Article

The Acceptance of Independent Autonomous Vehicles and Cooperative Vehicle-Highway Autonomous Vehicles

School of Automotive and Traffic Engineering, Jiangsu University, Zhenjiang 212013, China
*
Author to whom correspondence should be addressed.
Information 2021, 12(9), 346; https://doi.org/10.3390/info12090346
Submission received: 24 July 2021 / Revised: 18 August 2021 / Accepted: 24 August 2021 / Published: 26 August 2021

Abstract

:
The public’s acceptance of independent autonomous vehicles and cooperative vehicle-highway autonomous vehicles is studied by combining the structural equation model and an artificial neural network. The structural equation model’s output variables are used as the input variables of the artificial neural network, which compensates for the linear problem of the structural equation model and ensures the accuracy of the input variables of the artificial neural network. In order to summarize the influencing factors of autonomous vehicles acceptance, the Unified Theory of Acceptance and Use of Technology model was expanded by adding two variables: risk expectation and consumer innovation. The results show that social influence is the strongest predictor of the acceptance of independent autonomous vehicles. The most significant factor of the cooperative vehicle-highway autonomous vehicles’ acceptance is effort expectation. Additionally, risks, performance, existing traffic conditions, and personal innovation awareness also significantly affect autonomous driving acceptance. The research results can provide a theoretical basis for technology developers and industry managers to develop autonomous driving technology and policymaking.

1. Introduction

Relying on its radars, cameras, sensors, and other equipment to perceive road and traffic conditions and then using computer analysis and decision making to choose a suitable route to drive, automatic driving vehicles are often called independent autonomous vehicles [1]. Due to road perception capability limitations, Tesla and Google’s independent autonomous vehicles have experienced serious fatal accidents in recent years [2,3]. Autonomous vehicles may not be able to guarantee road safety only by relying on their radar entirely. Autonomous vehicles may also rely on other intelligent transportation facilities in the future to enable autonomous vehicles to have complex environment perception, intelligent decision making, collaborative control, and other functions in the form of cooperative vehicle-highway systems [4]. “Cooperative vehicle-highway” means that vehicles rely on roadside sensing devices to monitor vehicles and pedestrians running on the road in real time and use low-latency networks to obtain real-time information such as the object speed, location, and vehicle conditions to realize autonomous technology.
Before autonomous vehicles enter the market on a large scale, they face many development issues such as technology, regulations, ethics, and infrastructure construction. Aside from that, the successful popularization of autonomous vehicles requires public support [5]. The public’s attitude has a guiding effect on the development of new technologies, social policies, and infrastructure investment. Whether it is independent autonomous vehicles or cooperative vehicle-highway autonomous vehicles, both aim to realize autonomous driving, increase user travel efficiency, and improve social productivity. Through acceptance research, we can understand the public’s perceptions and attitudes towards autonomous driving, provide a theoretical basis for enterprise technology development from the users’ perspective, and study the human factors affecting the development direction of autonomous driving.
This paper tries to adopt a systematic theoretical framework to cover multiple factors affecting the acceptance of autonomous driving of the heterogeneous population. This paper explores the relationship between the significance and relative importance of complex variables by the analysis method of the structural equation model (SEM) and an artificial neural network (ANN). We aim to provide technology developers and industry managers with relevant theoretical foundations for autonomous driving technology development and policy formulation. This paper’s unique contributions are as follows: (1) Previous studies have mostly focused on the acceptance of independent autonomous vehicles. This paper compares the two autonomous technologies of independent autonomous vehicles and cooperative vehicle-highway autonomous vehicles to study the public’s acceptance of both. (2) The analysis method that combines the structural equation model and an artificial neural network has appeared several times in the research on the acceptance of mobile information technology. This paper introduces this dual-model combination method into the research on the acceptance of autonomous technology. (3) The Unified Theory of Acceptance and Use of Technology (UTAUT) has been used to research the acceptance of autonomous technology. This paper expands the UTAUT theoretical model through the two variables of risk expectation and consumer innovation to form a new theoretical framework to explain autonomous vehicles’ acceptance more comprehensively.

2. Literature Review

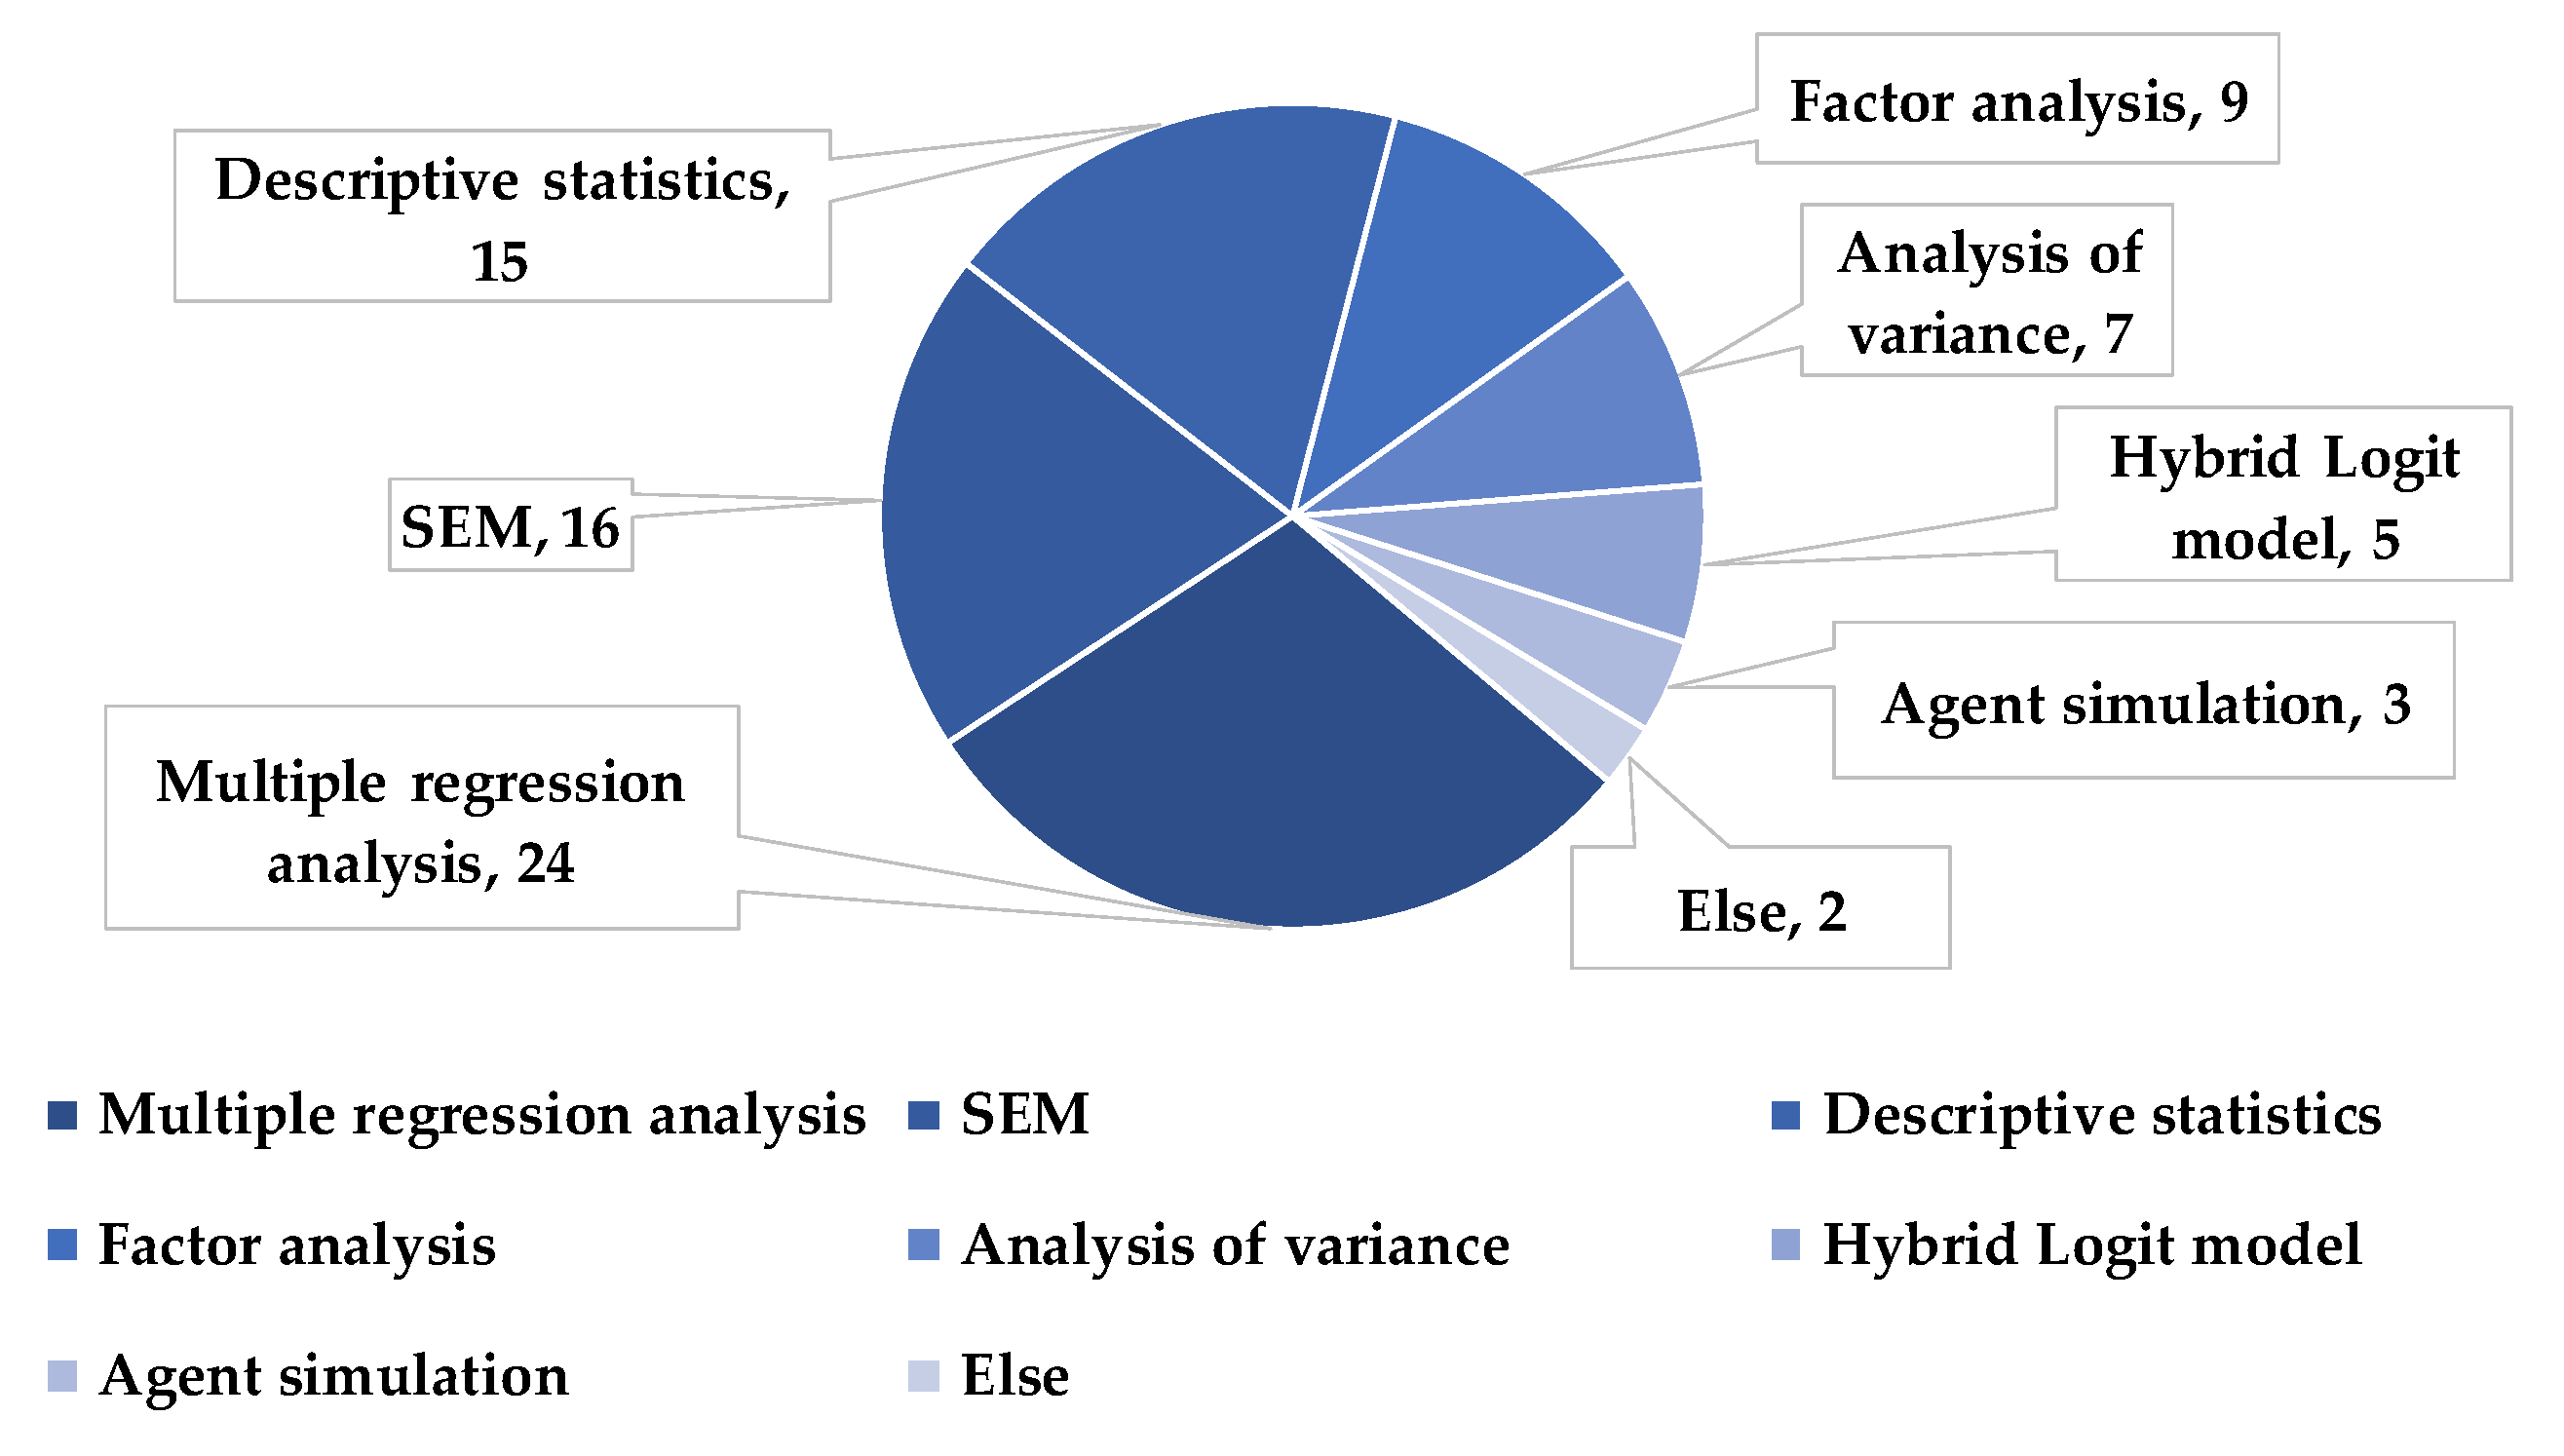
The potential psychological factors affecting the public’s acceptance of autonomous technology have been gradually identified and summarized in recent studies. Technology acceptance behavior theory can systematically integrate various potential psychological factors that affect the acceptance of autonomous technology. This study compiled 81 relevant pieces of literature, the Technology Acceptance Model (TAM), the Theory of Planned Behavior (TPB), the Diffusion of Innovations Model (DIM), the UTAUT, the Theory of Reasoned Action (TRA), and other theoretical models that are the most common, as shown in Figure 1.
Many studies have used intention as a dependent variable to explore people’s acceptance of technology [6]. The UTAUT uses intention as the direct result variable of the four variables of performance expectation, effort expectation, social influence, and promotion conditions. This is the uniqueness of this model. Hartwich [7] and others introduced attitude, anger, and self-efficacy into the UTAUT model, and the study found that young people and the elderly have a stronger agreement on self-driving to promote self-efficacy. Kaur [6] and Kettles [8] also used attitude variables to expand the UTAUT model for empirical analysis. They both discovered the predictive relationship of variables in the theoretical framework on attitudes and willingness to accept autonomous technology. Manfreda [9] found in a study based on the UTAUT model that personal technical perception and safety awareness significantly affect the willingness to accept autonomous technology.
The theory of technology acceptance behavior can summarize the multiple influencing factors of the acceptance of autonomous driving. In addition, model analysis methods are used to verify the correlation between factors so as to obtain various predictive relationships for acceptance intentions. Figure 2 shows the research methods used in 81 relevant pieces of literature.
In order to further explore the linear and nonlinear mechanisms in the process of acceptance, some scholars combine the SEM and ANN. Liébana-Cabanillas et al. [10] found that perceived usefulness and perceived safety are the most significant factors influencing the acceptance of mobile payments. Hew et al. [11] concluded that perceived usefulness is the strongest influencing factor in the study of mobile entertainment acceptance. Tan et al. [12] considered after ANN analysis that academic qualifications are the most important variable that causes differences in the acceptance of mobile learning. Sharma et al. [13] found that service quality is the most important factor affecting consumers’ acceptance of e-learning. Arif et al. [14] found that image barriers are the primary consideration for users’ acceptance of online banking.
The ANN input and output variables can be obtained through the significant variables verified by the SEM. Some scholars also input the significant variables obtained by regression analysis into the ANN model. Sim et al. [15] verified the correlation of the variables in the acceptance model through hierarchical regression analysis and then obtained the conclusion that the perceived ease of use is higher than the perceived usefulness through ANN analysis. Chong [16] verified the significance of the four variables in the UTAUT model after multiple regression analysis and then obtained the strongest weight variable as the performance expectation through ANN analysis. The two studies of Sim et al. and Chong et al. also reflect that in the behavioral willingness study, the ANN needs to obtain scientific input layer and output layer variables through linear analysis. At the same time, it also affirmed the rationality of the combination of the SEM and an ANN.
In general, by analyzing the relevant literature, the following conclusions can be drawn:
  • The safety and risk of autonomous technology has received extensive attention in the field of acceptance research. When considering the acceptance of autonomous technology, the public will consider many factors. In existing research, scholars have summarized multiple influencing factors through “acceptance behavior theory”. In the process, they have gradually discovered that although the public affirms the convenience brought by autonomous driving to a certain extent, people are not satisfied with their safety [17,18,19]. Kaur et al. [6] used risk factors to evaluate people’s trust in autonomous driving in a study based on the UTAUT and discussed its impact on the acceptance of autonomous driving.
  • The public’s perception of the risk of autonomous technology is different, and further research is needed. Rogers pointed out in the innovation diffusion theory that people with strong innovative spirits often show an active exploration attitude towards the surrounding information of new technologies, and these people may be early adopters of new technologies [20]. It can be seen that the sense of innovation will drive people to take risks to a certain extent, and people with high risk tolerance may pay more attention to the benefits of the technology. Therefore, this study starts with the heterogeneity of risk perception and evaluates people’s trade-offs between risks and advantages to study the acceptance of autonomous driving.
  • The SEM and ANNs have their own applicability and limitations in the study of acceptance of autonomous driving. The SEM can analyze the causal relationship between multiple variables, but it cannot explain the nonlinear mechanism in technology acceptance behavior. Compared with ANNs, the SEM lacks the comprehensiveness of prediction. However, it is difficult to study the correlation between behavioral intentions and dependent variables only through an ANN, and there is no basis for obtaining psychological variables in the neuron input layer, which leads to biased weight mapping results.
  • At present, in the literature collected using the SEM to study the acceptance of autonomous driving technology, there is no research method that extends the SEM through an ANN. The output of the SEM is used as the input of the ANN, which not only compensates for the linearity problem of the SEM but also guarantees the accuracy of the input variables of the ANN. As a result, the explanatory power of behavioral willingness is improved, and the linear and nonlinear relationship between the predictor variables and dependent variables can be comprehensively analyzed. Therefore, this study introduces a combination of the SEM and an ANN to achieve the purpose of explaining the acceptance of autonomous driving more accurately.

3. Research Method

3.1. Data Analysis Model

The structural equation model uses hypothesis testing to analyze the relationship between latent variables that cannot be directly measured in order to explore the influencing factors of behavior willingness [21]. The SEM can explore the causal relationship between variables such as attitude, perceived risk, and perceived usefulness. These variables have been proven to be significant factors influencing the willingness to accept autonomous vehicles in empirical research [17,22]. AJT [17] selected 11 psychological variables from 4 behavior theories to form a new theoretical framework and explored the public’s acceptance of autonomous technology through the structural equation model. The model‘s explanatory power reached 79%. Xu et al. [23] introduced the two variables of perceived security and trust in the technology acceptance model to form a new theoretical framework. Bennett et al. [24] studied blind people’s willingness to ride in autonomous vehicles through structural equation modeling of four variables: hope, skepticism, safety, and affordability. The SEM can verify the correlation between variables through linear analysis, but human decision making is a complex process with nonlinear characteristics. The SEM sometimes oversimplifies this process and limits the accuracy of the research results [10].
An artificial neural network can not only express the nonlinear relationship between variables but also has a self-learning ability. It can automatically adjust the connection weights between network nodes to fit the relationship between variables. Singh et al. [25] conducted a sensitivity analysis of 26 initial variables in the study of green product consumption willingness. According to the analysis results, each variable’s significance is sorted in each predetermined category, and the input layer variables of the ANN are obtained. Kadali et al. [26] observed pedestrians’ crossing behavior between the front and rear cars when they crossed the road in their experiment. They used the time headway and the number of pedestrian attempts to cross as input variables for neuron analysis to explore the pedestrians’ willingness to cross. However, due to its “black box” characteristics, an ANN cannot directly perform hypothesis testing and causal analysis [16].
The SEM can analyze the causal relationship among multiple variables, but it lacks predictive power compared with ANNs. However, causal analysis cannot be performed only through an ANN, and it is difficult to obtain the correlation between behavioral intentions and dependent variables. Combining the SEM and an ANN can balance the linear and nonlinear relationships between the predictor variables and dependent variables, thereby improving the predictive power of behavioral intentions. First, one can obtain the perceived relationship of the interviewee’s behavior prediction in the SEM and then transform it into the topology of an ANN. Then, the nonlinear mapping ability and self-learning ability of an ANN can be used to fit the causal relationship between multiple variables [27]. This solves the problem of linearity and parameter estimation in the SEM and makes the establishment of an ANN topology structure well-founded.

3.2. Acceptance Behavior Theory

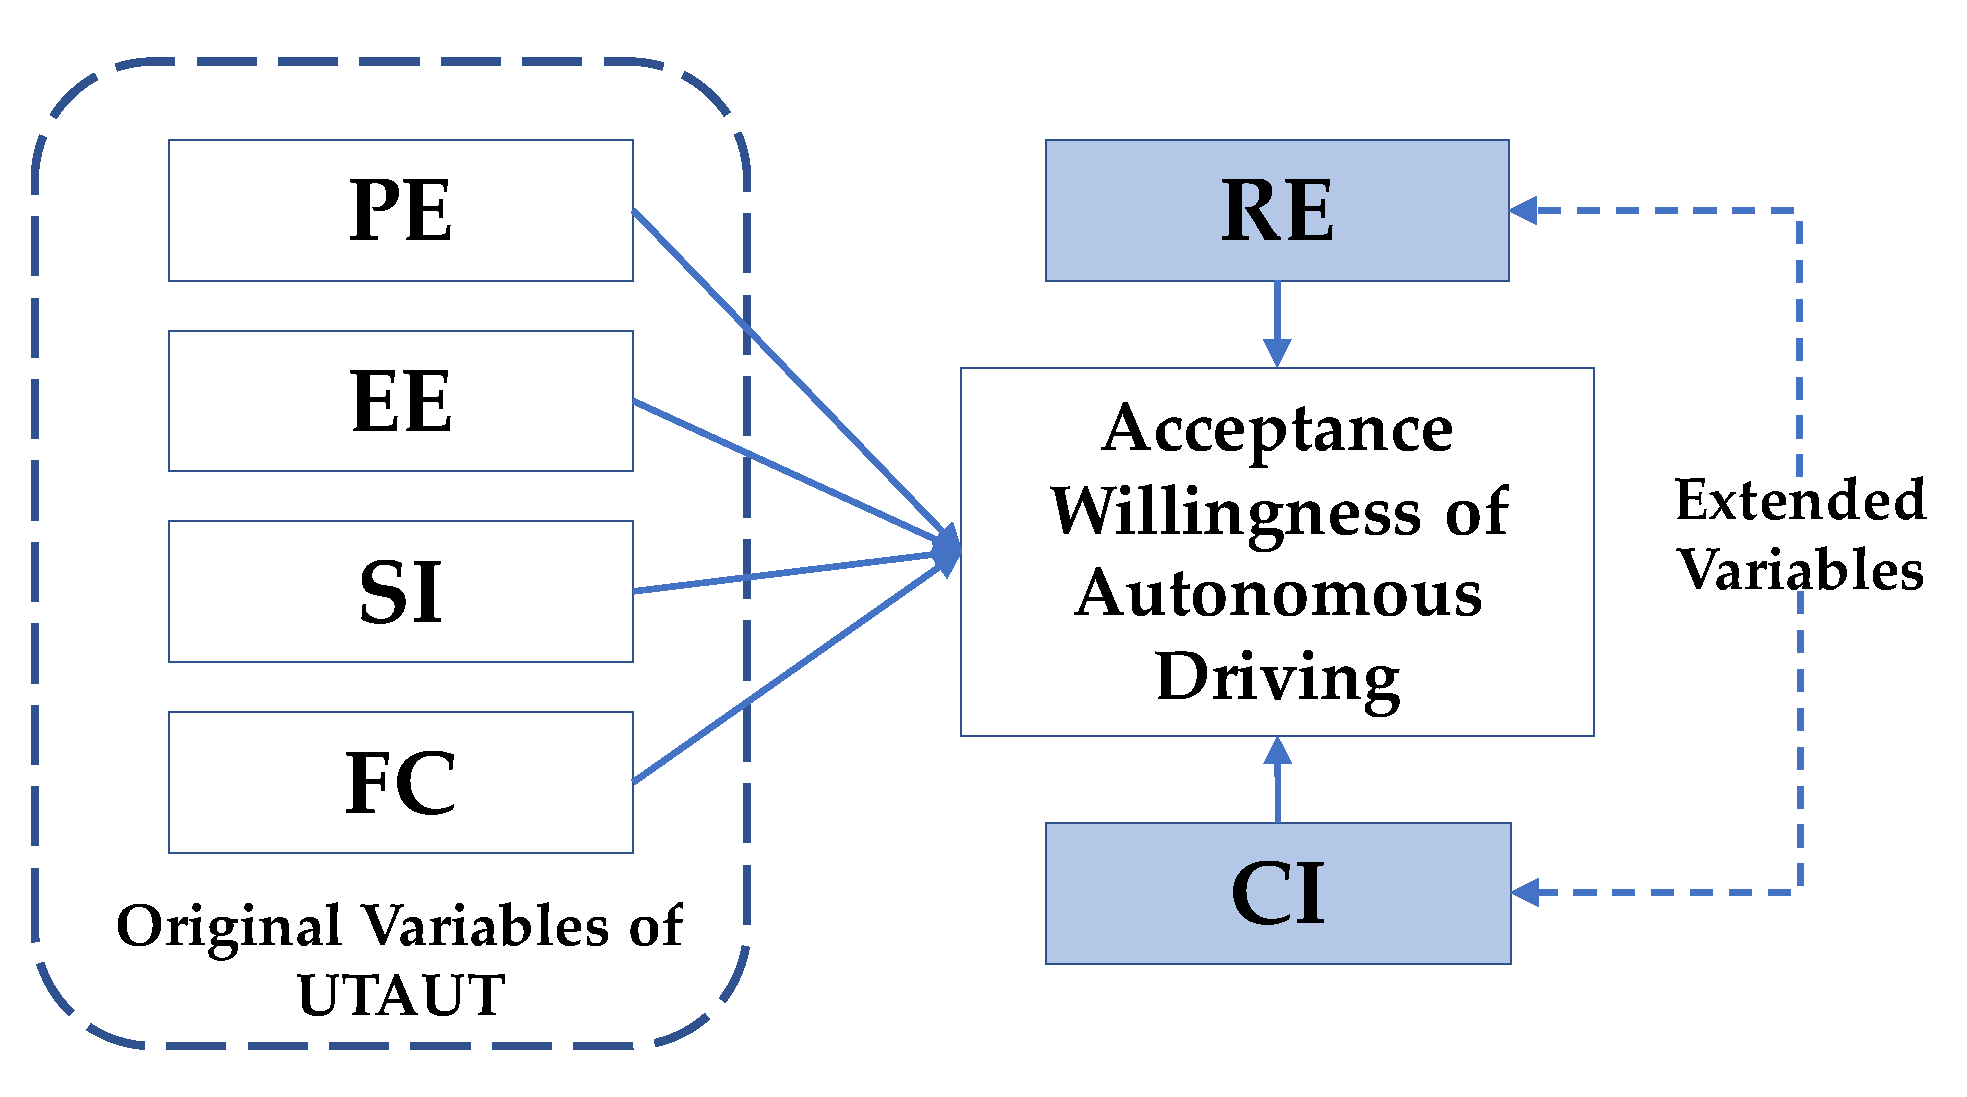
The variables in the SEM and ANN can be summarized in the framework of behavior theory. Many scholars have also cited a variety of behavioral theories in the study of acceptance of autonomous vehicles. Since its birth in 2001, the UTAUT has been widely used in the behavioral intention research of information technology and service applications [28]. Empirical studies have found that the explanatory power of the UTAUT model is greater than that of the previous models, and the explained variance of behavioral intentions can reach 70% [6]. This paper uses the UTAUT model as the theoretical framework and systematically summarizes the psychological factors that affect the acceptance of autonomous vehicles, including Performance Expectancy (PE), Effort Expectancy (EE), Social Influence (SI), and Facilitating Conditions (FC). Simultaneously, the two variables of Risk Expectancy (RE) and Consumer Innovativeness (CI) are added to extend the model as shown in Figure 3. Finally, the assumptions of influencing factors proposed by the UTAUT model are shown in Table 1.
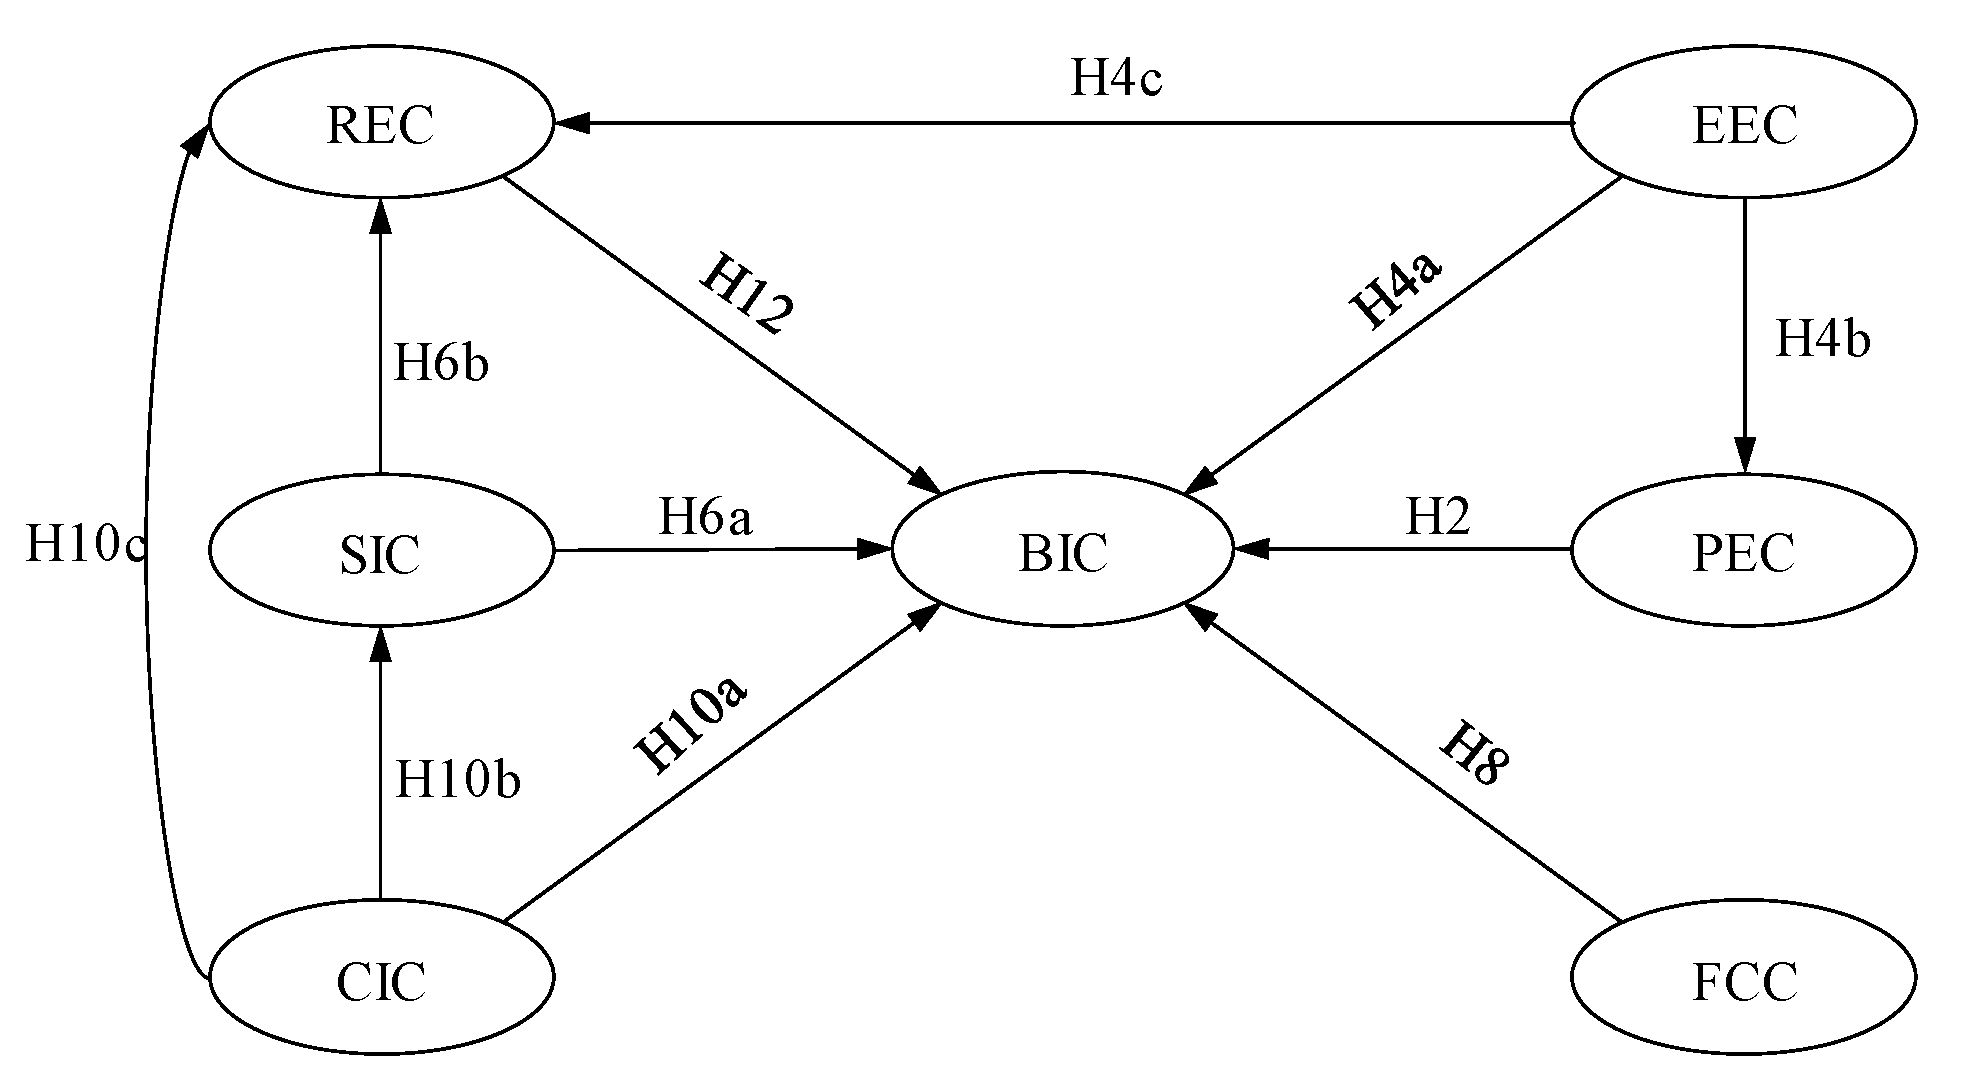
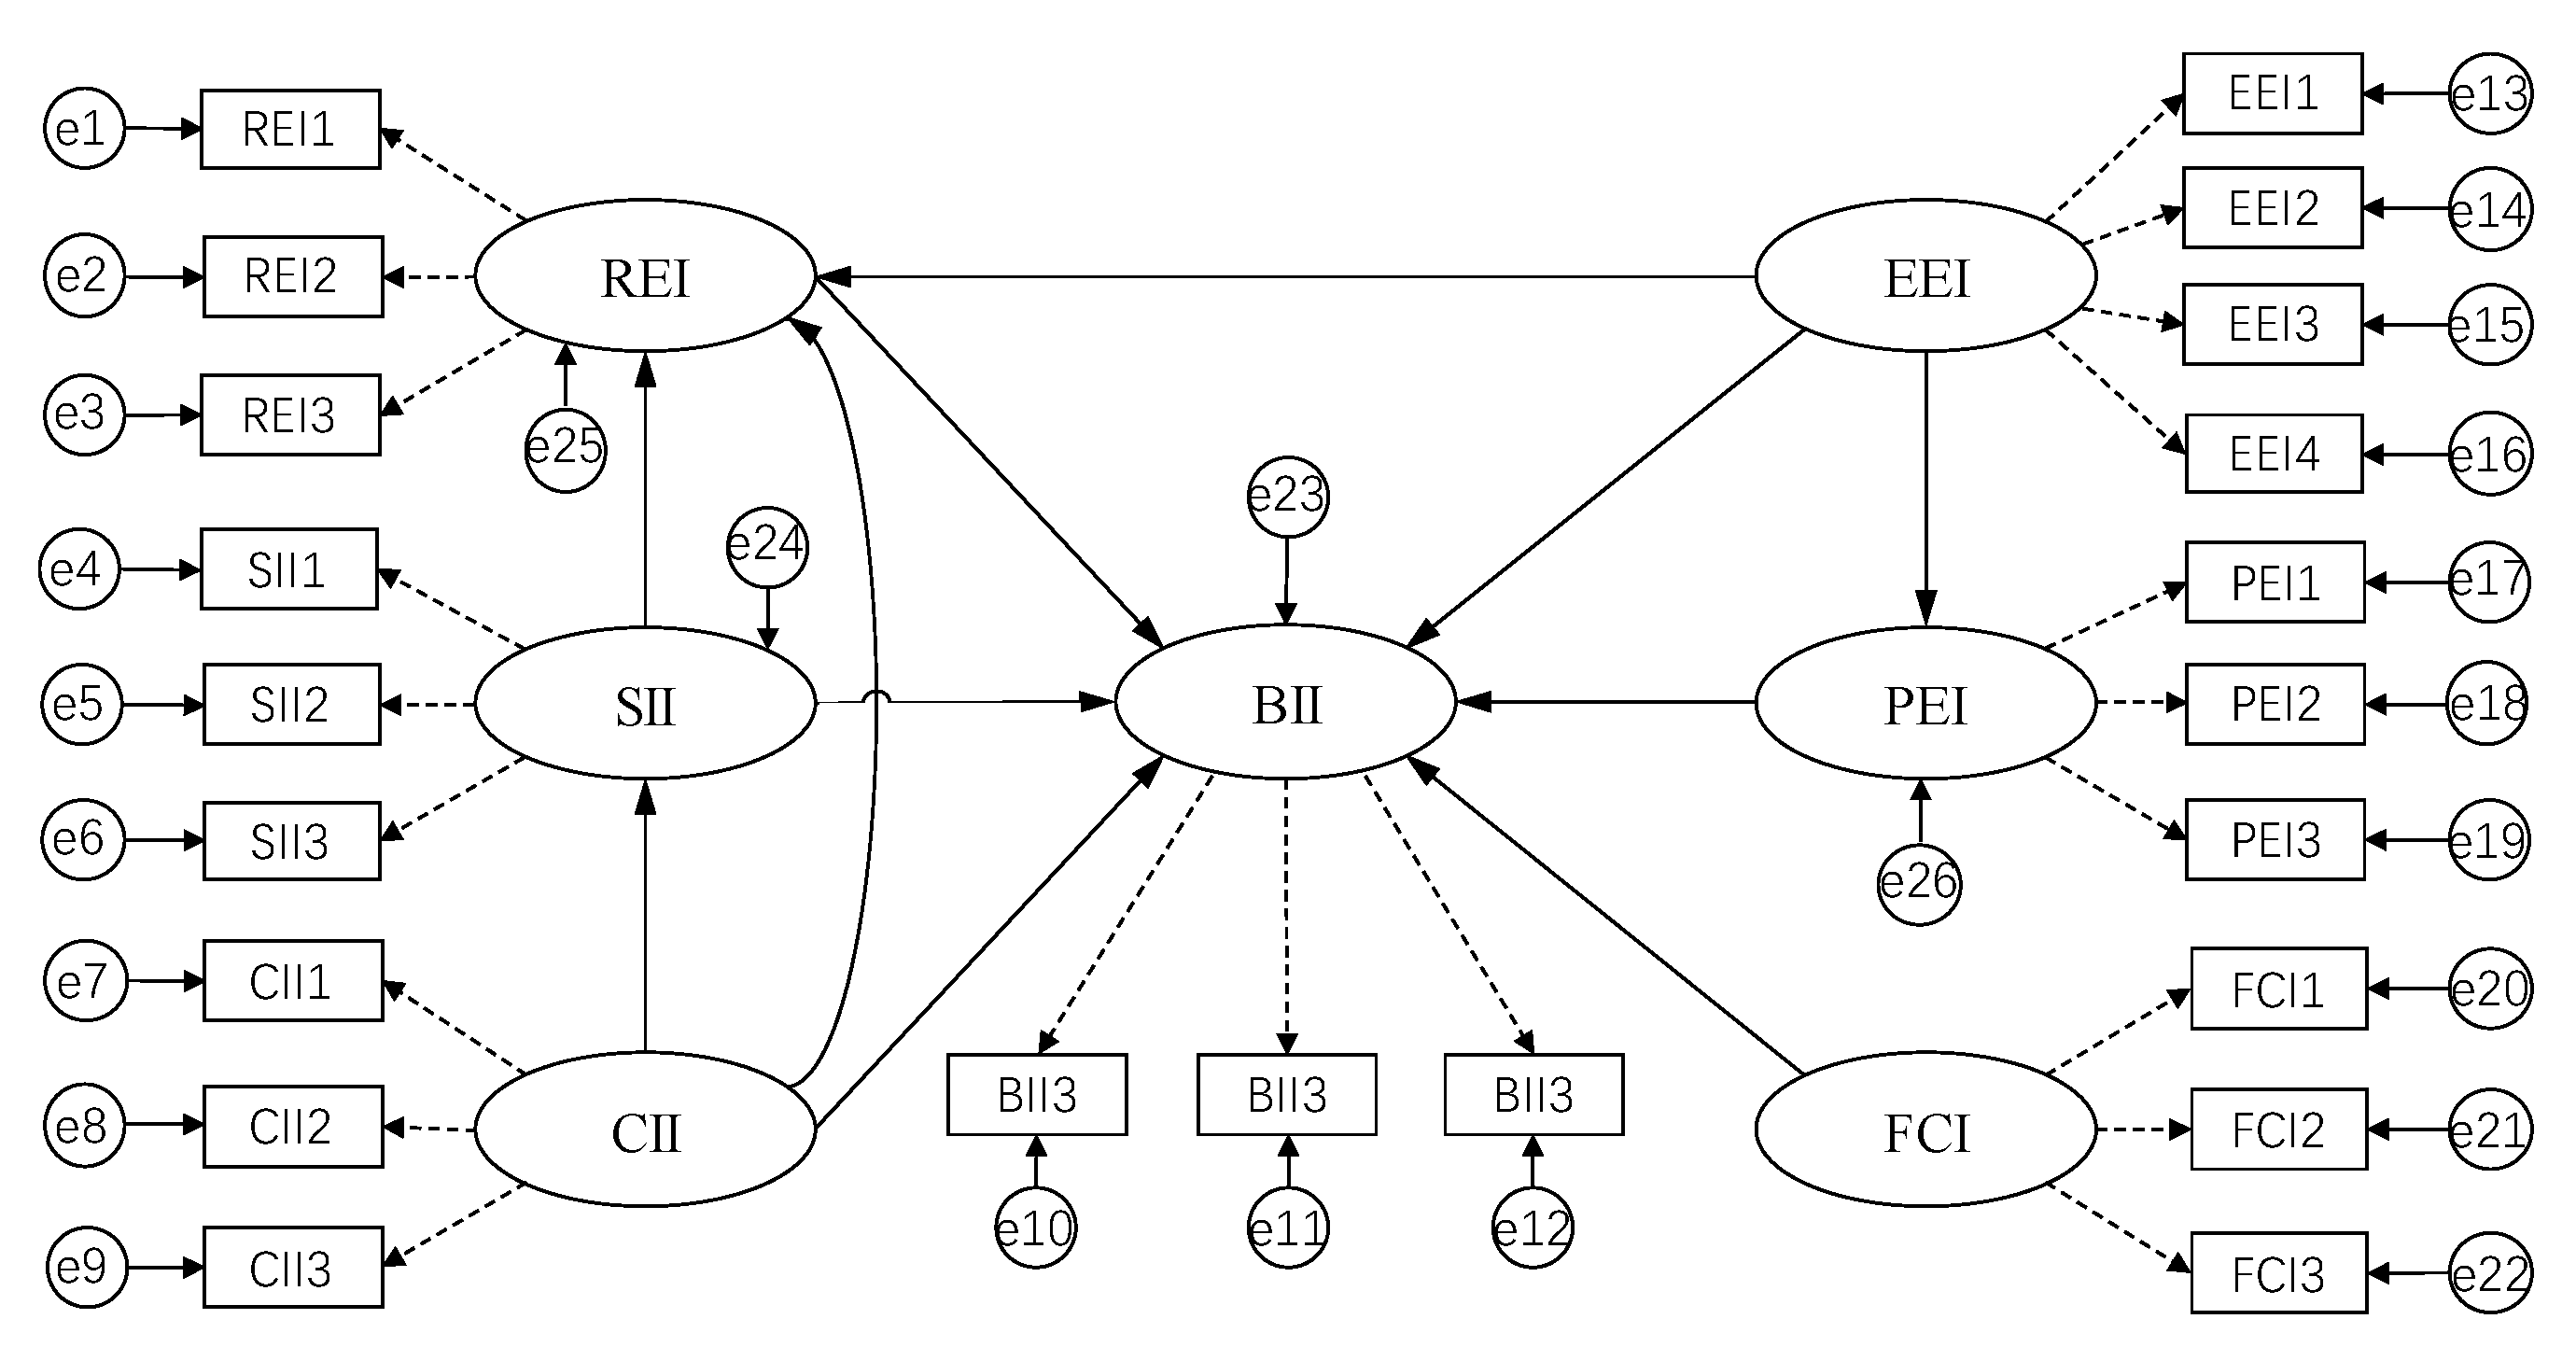
According to the UTAUT theoretical model of extended variables, the framework of the acceptance intention model for independent autonomous vehicles and cooperative vehicle-highway autonomous vehicles is established as shown in Figure 4 and Figure 5. The last letter I of the two figures’ variables represents independent autonomous vehicles, and C represents cooperative vehicle-highway autonomous vehicles. The pointing arrows in the two figures represent the causal relationship of each assumption.

4. Empirical Analysis

4.1. Data Acquisition and Inspection

A series of stated preference surveys was conducted in this paper to predict respondents’ acceptance of autonomous vehicles under multiple attributes. The survey used a Likert five-level scale to measure the psychological variables of the respondents (in the Appendix A). The questionnaire survey was conducted from 8–10 January 2019, lasting 3 days. Since the train station had a large passenger flow and could basically guarantee the randomness and representativeness of the surveyed population, the survey location was the waiting room of the Zhenjiang Railway Station. A total of 1068 participants’ responses were obtained for the data from the survey. After data cleaning, 778 valid questionnaire responses were retained. Table 2 shows the demographic data related to the assessed sample.

4.1.1. Reliability Test

This paper analyzed the collected data’s reliability. Cronbach’s alpha (α) and composite reliability (C.R.) were used to evaluate the collected data’s reliability [29]. The results of the reliability test are shown in Table 3.
As shown in Table 2, the α of all variables was between 0.770 and 0.879; an α greater than 0.7 indicated that the data were available, and a value greater than 0.9 indicated that the data had high reliability [30]. At the same time, the C.R. had a maximum of 0.835 and a minimum of 0.766. Both were greater than the recommended value of 0.6 [17]. The results show the high reliability of the survey scale.

4.1.2. Validity Test

The validity test measures the degree of convergence through the average variance extracted (AVE). The items for psychological variables were shown in the Appendix B. As shown in Table 4, each variable’s normalization factor loading coefficient was more significant than 0.6, which was greater than the recommended value of 0.5. The average variance extracted was between 0.67 and 0.81, which was greater than the test standard value of 0.5 [17], indicating that this paper’s questionnaire had good convergence validity.

4.2. Structural Equation Model Analysis

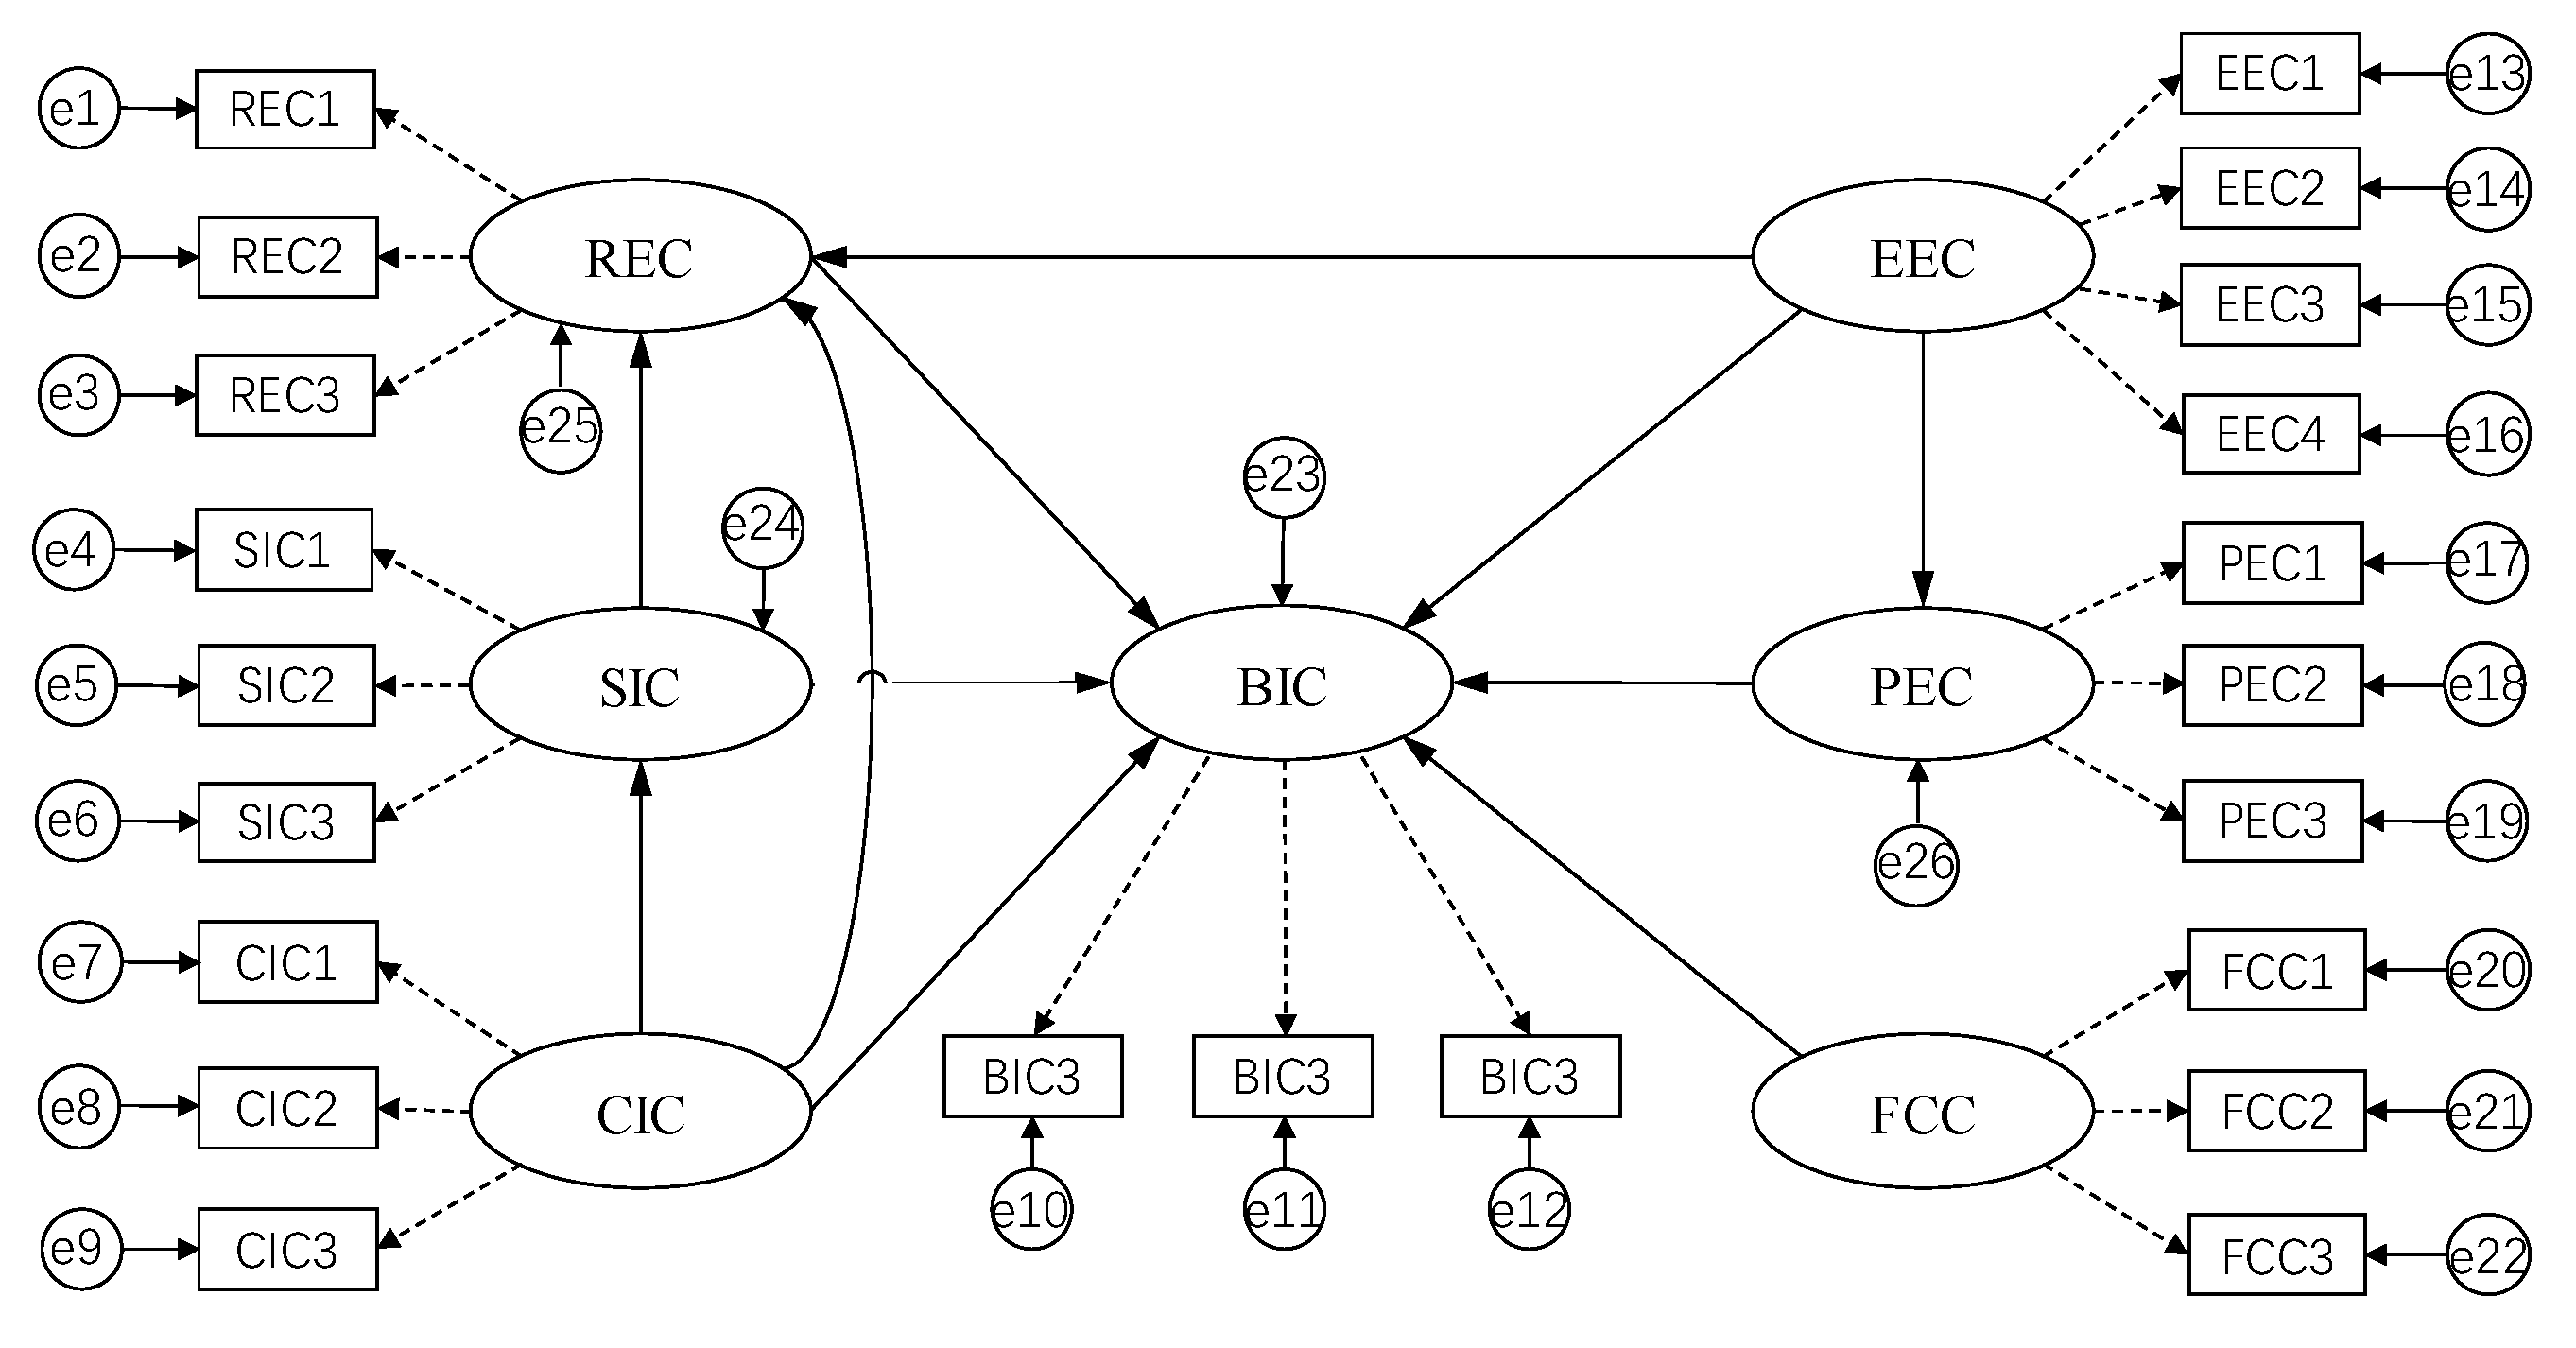
In the process of structural equation model analysis, multiple regression and factor analysis can be combined to simultaneously analyze the causal relationship between all latent variables and explicit variables. After proposing the hypothesis, the questionnaire was set up according to the variable scale, and the variable data were obtained. According to the correlation between the latent variables and their assumptions, a framework was built for structural equation model analysis. As shown in Figure 6 and Figure 7, the box in the model is the observed variable, the ellipse is the latent variable, the circle is the error term, the solid line represents the causal relationship between the latent variables, and the dotted line represents the relationship between the latent variable and the observed variable. The tested data were substituted into the established model framework for structural equation model analysis.
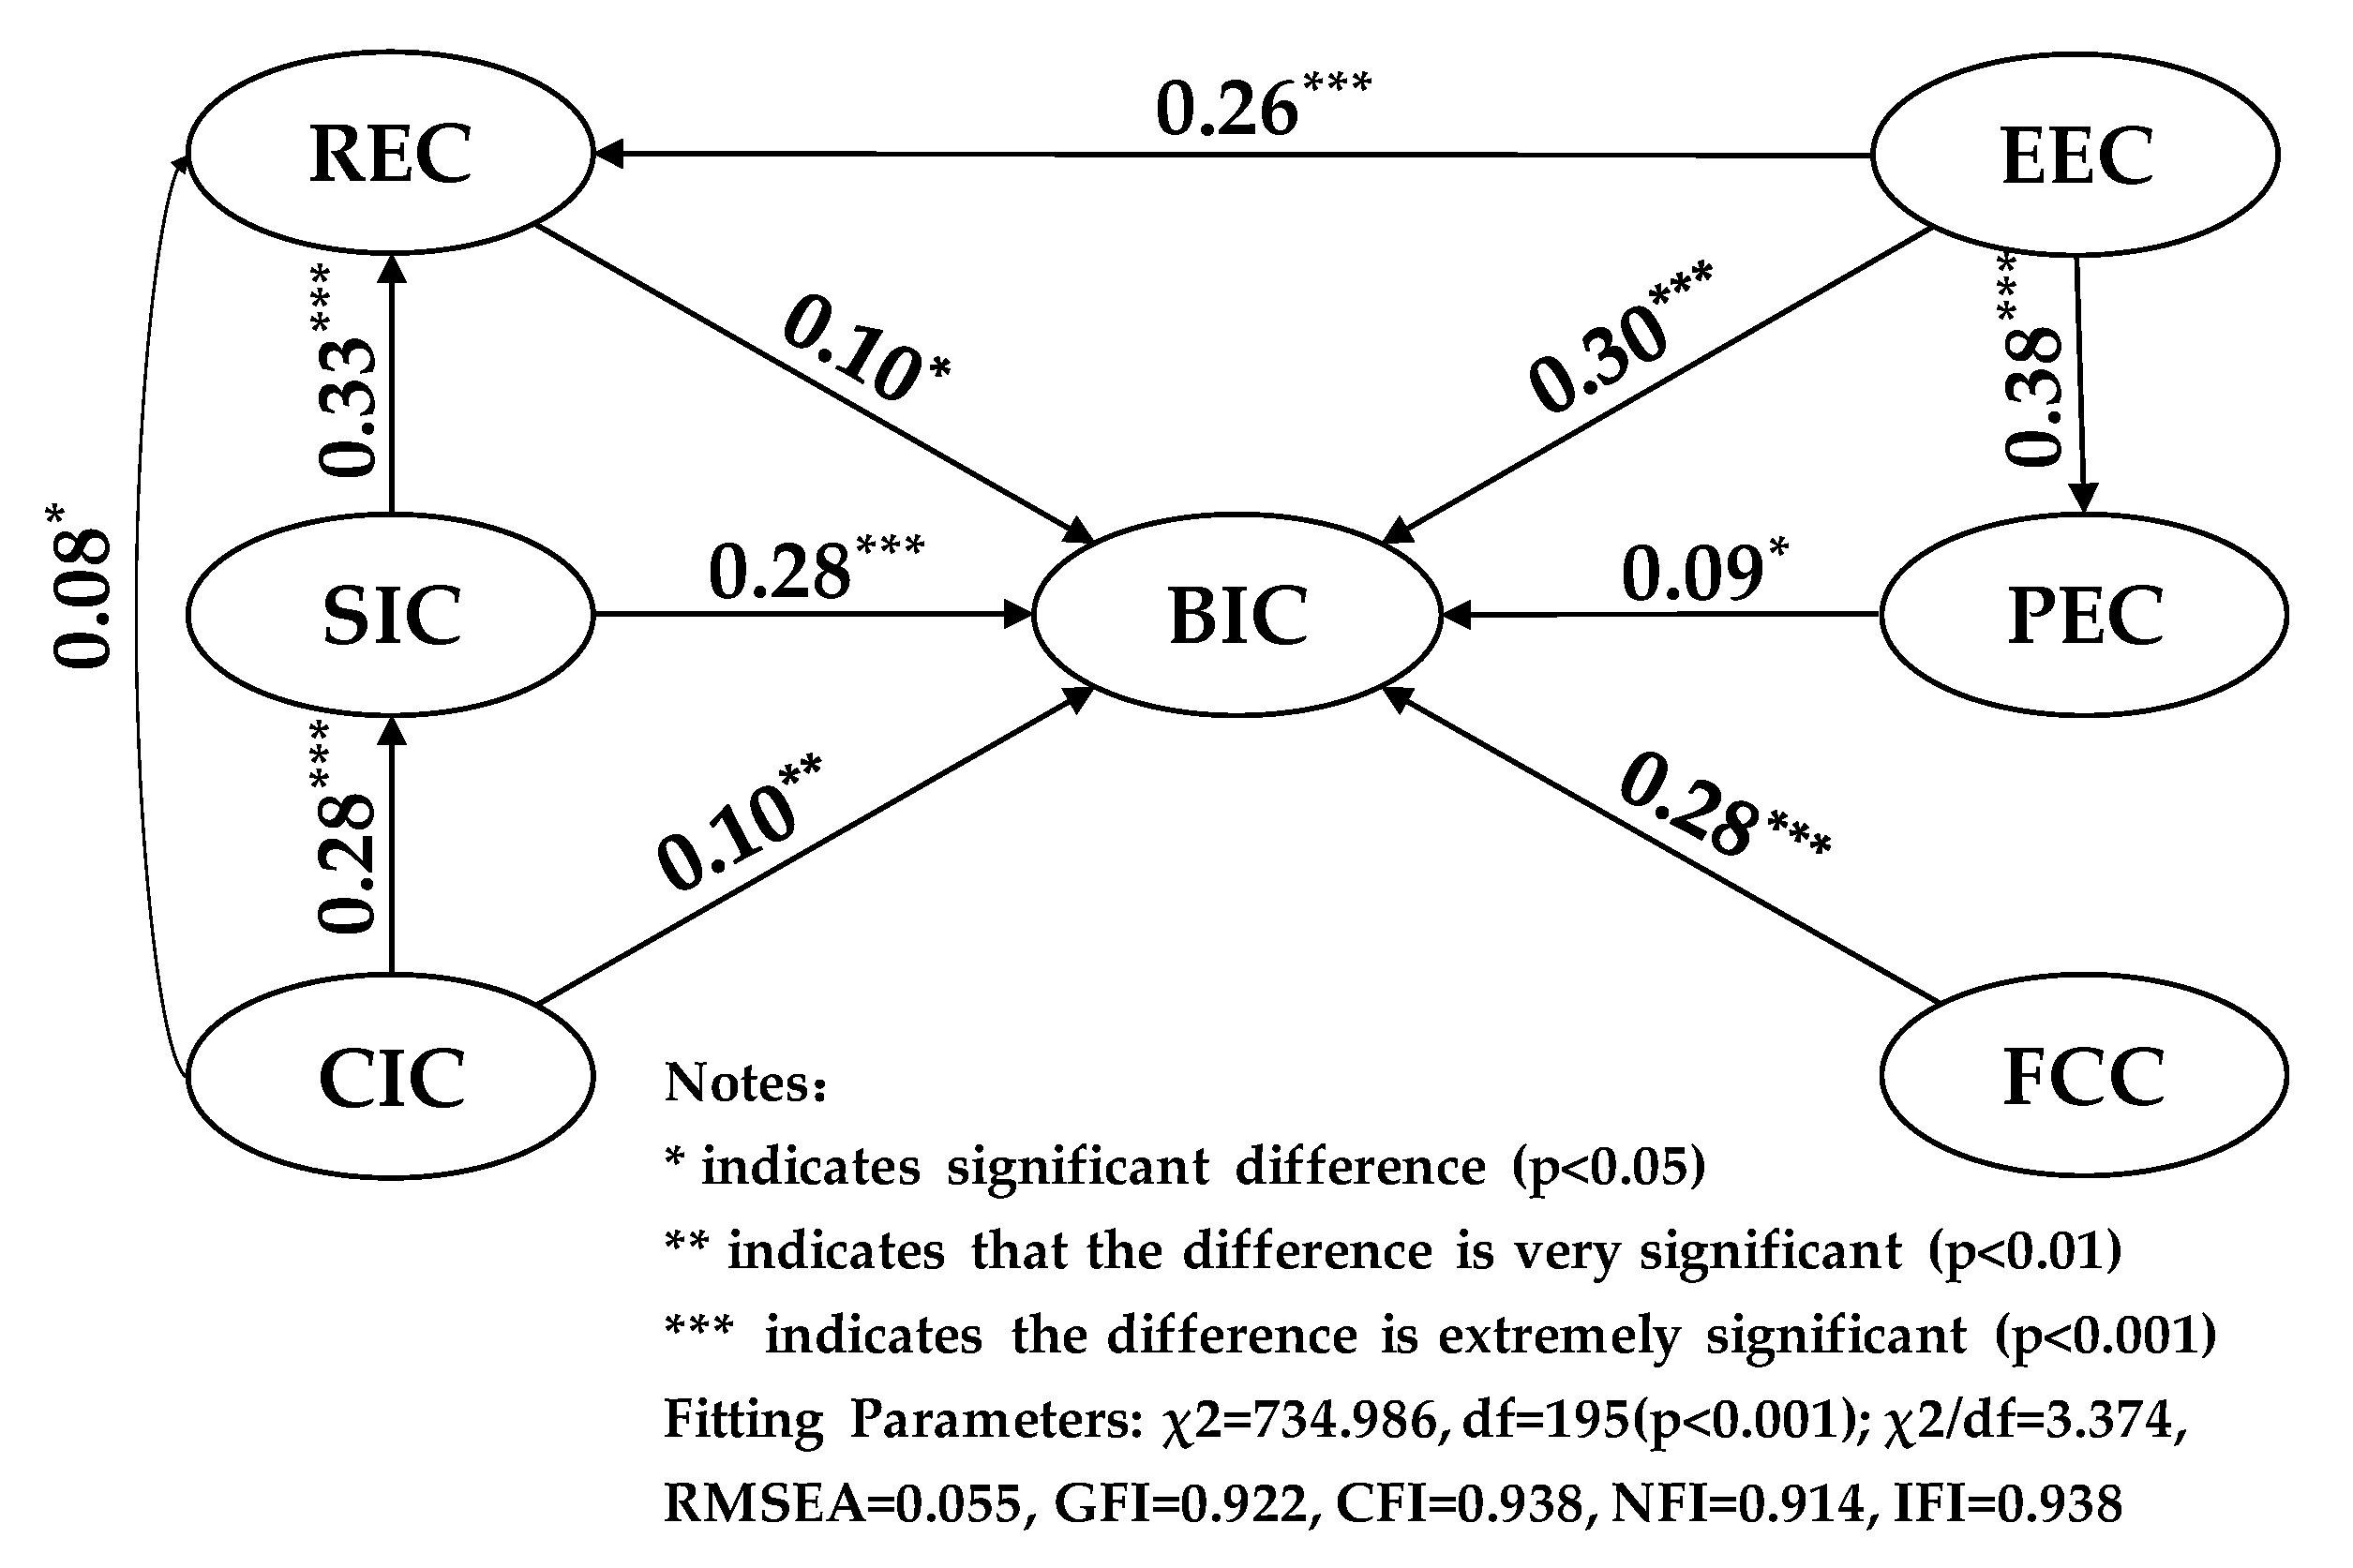
The model framework was built in AMOS to conduct model fitting detection. The fitting data were obtained as shown in Table 5 and Table 6, where χ2/df is an absolute index to measure the model. The smaller the ratio, the better the fit of the model. The parameter values in Table 5 and Table 6 are 3.374 and 3.538, respectively, which are both acceptable levels. The root-mean-square error (RMSEA) in the two samples was 0.055 and 0.056, respectively, reaching a reasonable level. (Generally, an RMSEA greater than 0.05 indicates an excellent fit, and a value greater than 0.08 indicates a good fit.) In another absolute index of the Good Fit Index (GFI), the two research objects’ parameters both exceeded 0.9. (Generally, a GFI greater than 0.9 can be regarded as good) Aside from that, the three relative indexes—CFI, NFI, and IFI—all reached reasonable levels. (Generally, these three indicators being greater than 0.9 can be regarded as good) In summary, the model fit well.
In accordance with the survey data on the acceptance of autonomous technology, path analysis was performed in AMOS through regression analysis to explore the correlation between various psychological variables while testing the significance of each hypothesis path in the extended UTAUT theoretical framework. The specific test results are shown in Table 7.
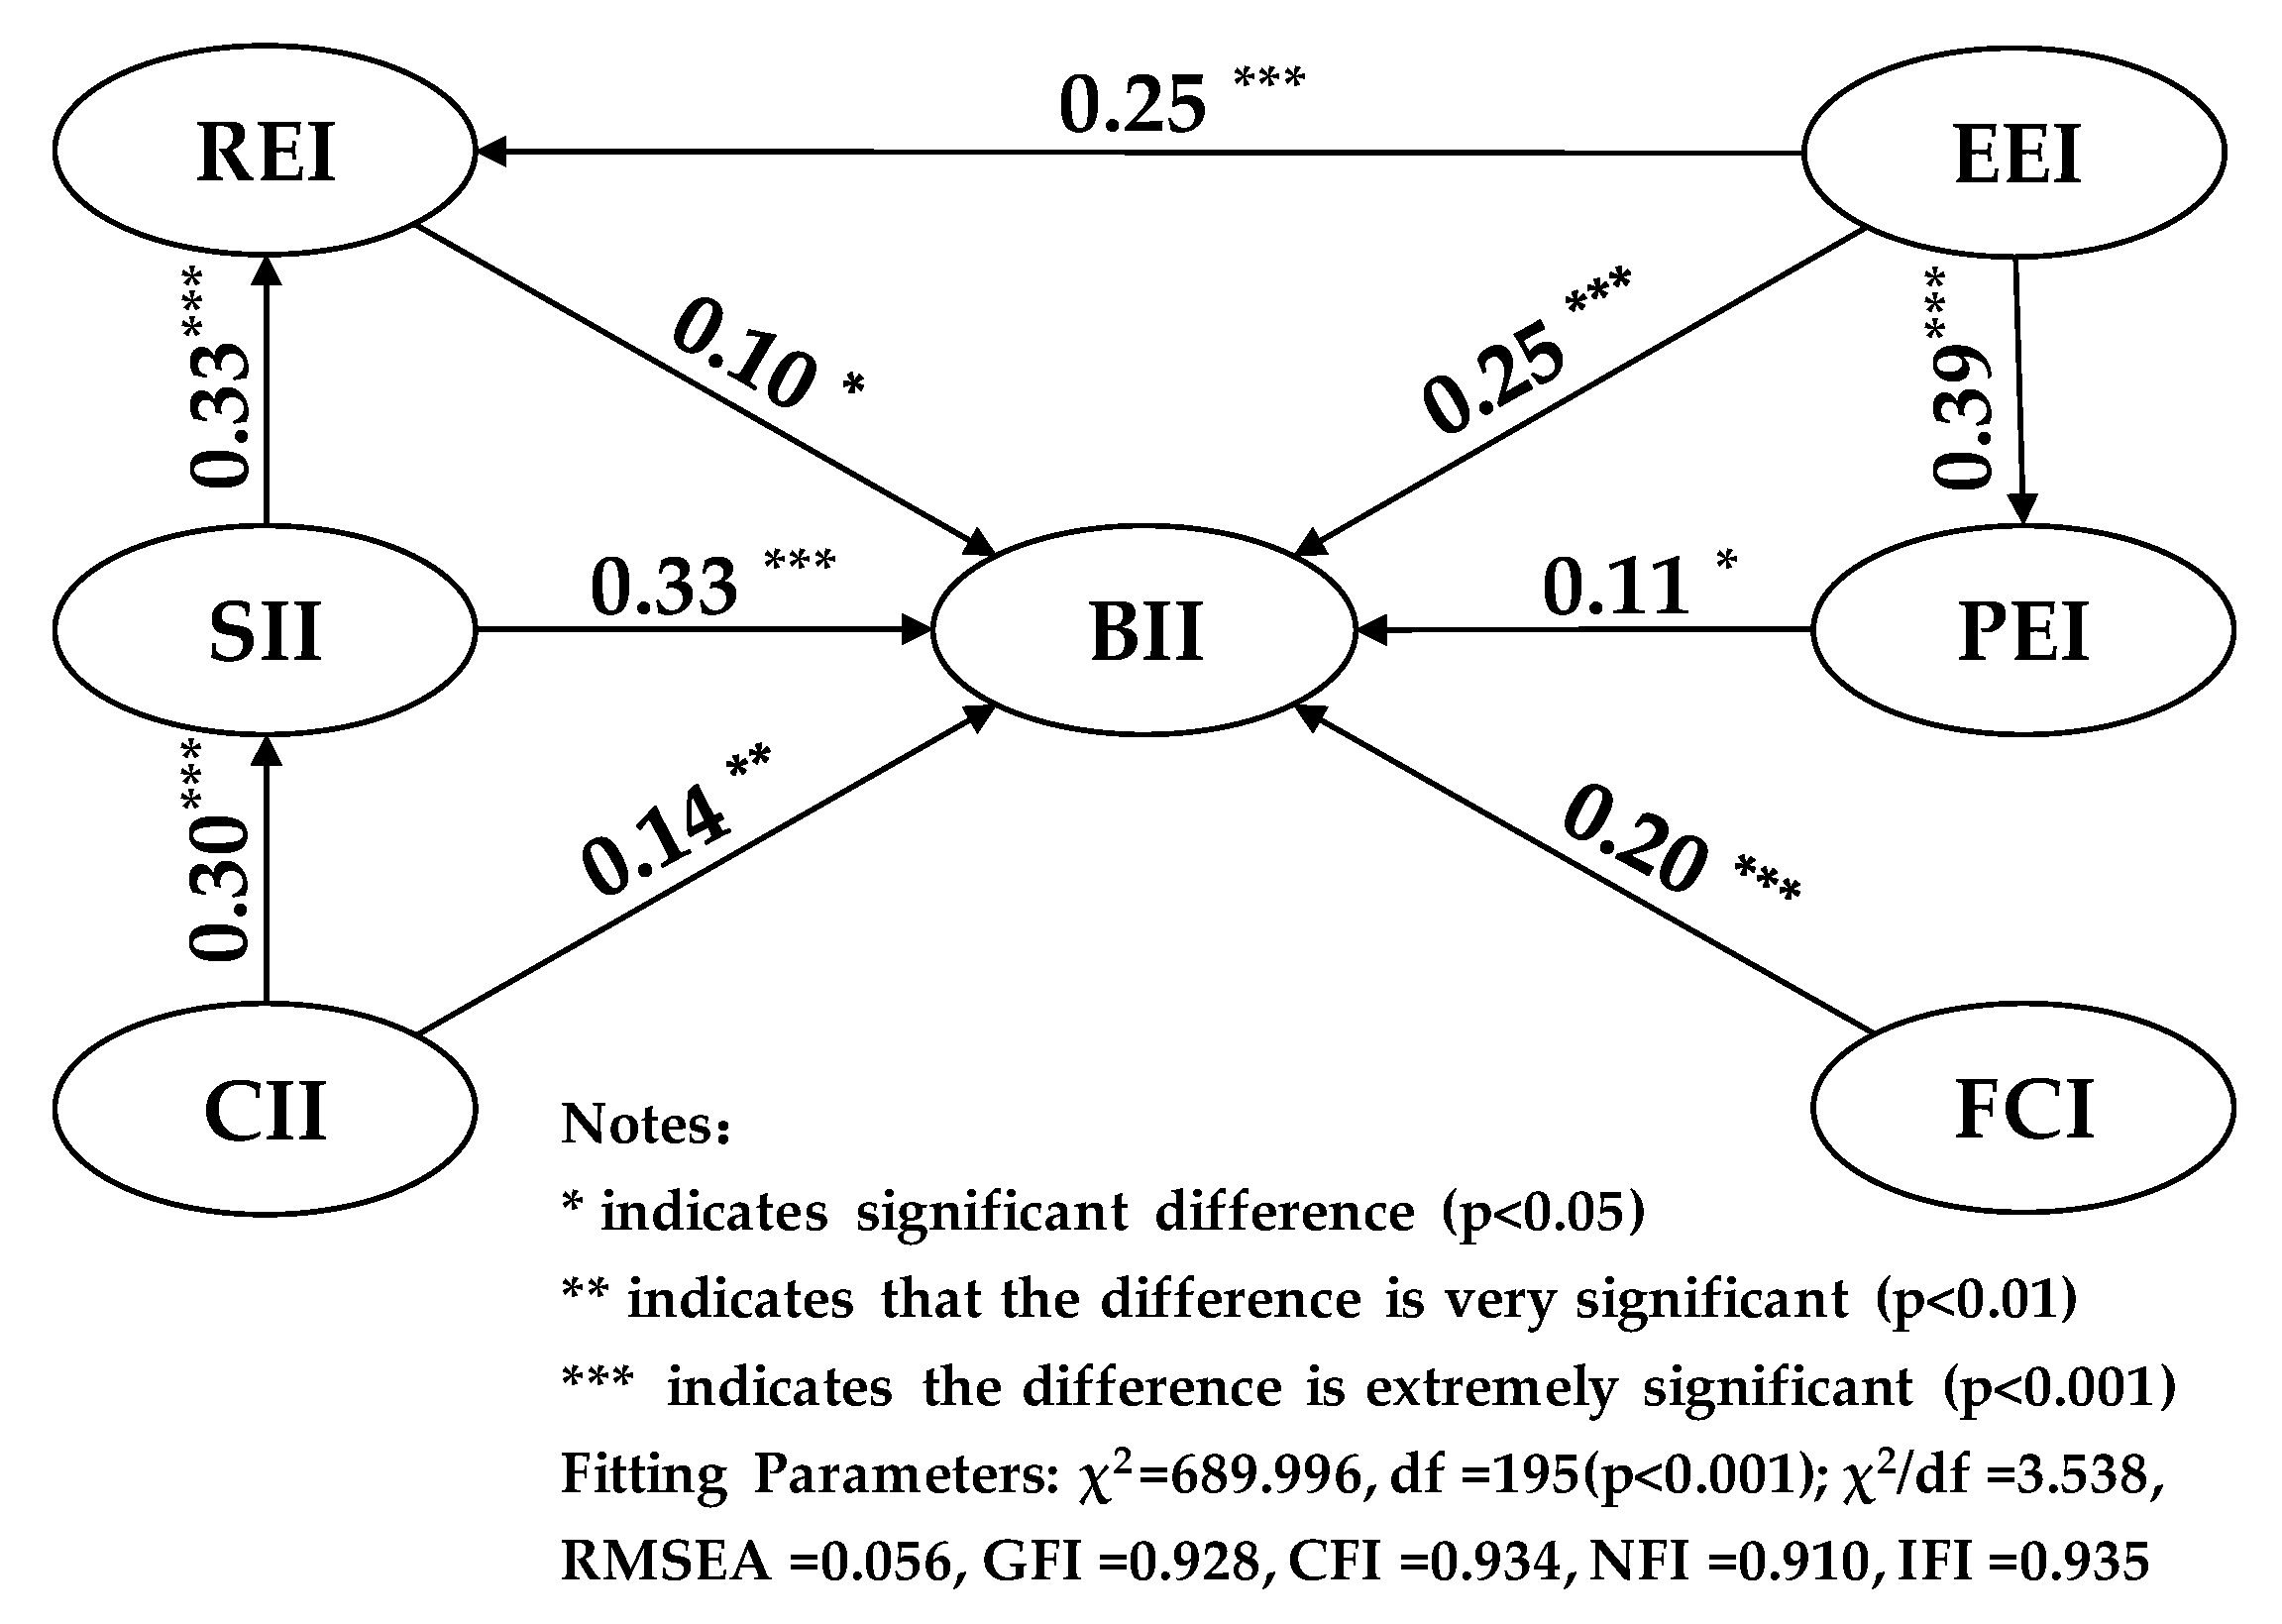
The p value of the H9c path was 0.097, which was greater than 0.05, indicating that the path assumption was not valid. In the significance level * p, there were hypothetical paths H1, H2, H11, and H12. The path with the significance level ** p was H10a, and the significance levels of all other paths reached *** p. The regression analysis results show that the H9c hypothesis was rejected, and the other hypotheses were all valid. After deleting the rejection hypothesis, the verification results are displayed through the structural equation model as shown in Figure 8 and Figure 9.
Among the significant effects on willingness to accept (BII and BIC), the test results show that Effort Expectancy (EEI, β = 0.25, p < 0.001; EEC, β = 0.30, p < 0.001), Social Influence (SII, β = 0.33, p < 0.001; SIC, β = 0.28, p < 0.001), and Facilitating Conditions (FCI, β = 0.20, p < 0.001; FCC, β = 0.28, p < 0.001) had the most significant impact on the willingness to accept. This shows that people’s acceptance of autonomous vehicles and cooperative vehicle-highway autonomous vehicles would be affected by the perceived effort, people around them, and existing environmental conditions. Performance Expectancy (PEI, β = 0.11, p < 0.05; PEC, β = 0.09, p < 0.05), Risk Expectancy (REI, β = 0.10, p < 0.05; REC, β = 0.10, p < 0.001), and Consumer Innovation (CII, β = 0.14, p < 0.01; CIC, β = 0.10, p < 0.001) also had a significant influence on acceptance intention.

4.3. Artificial Neural Network Analysis

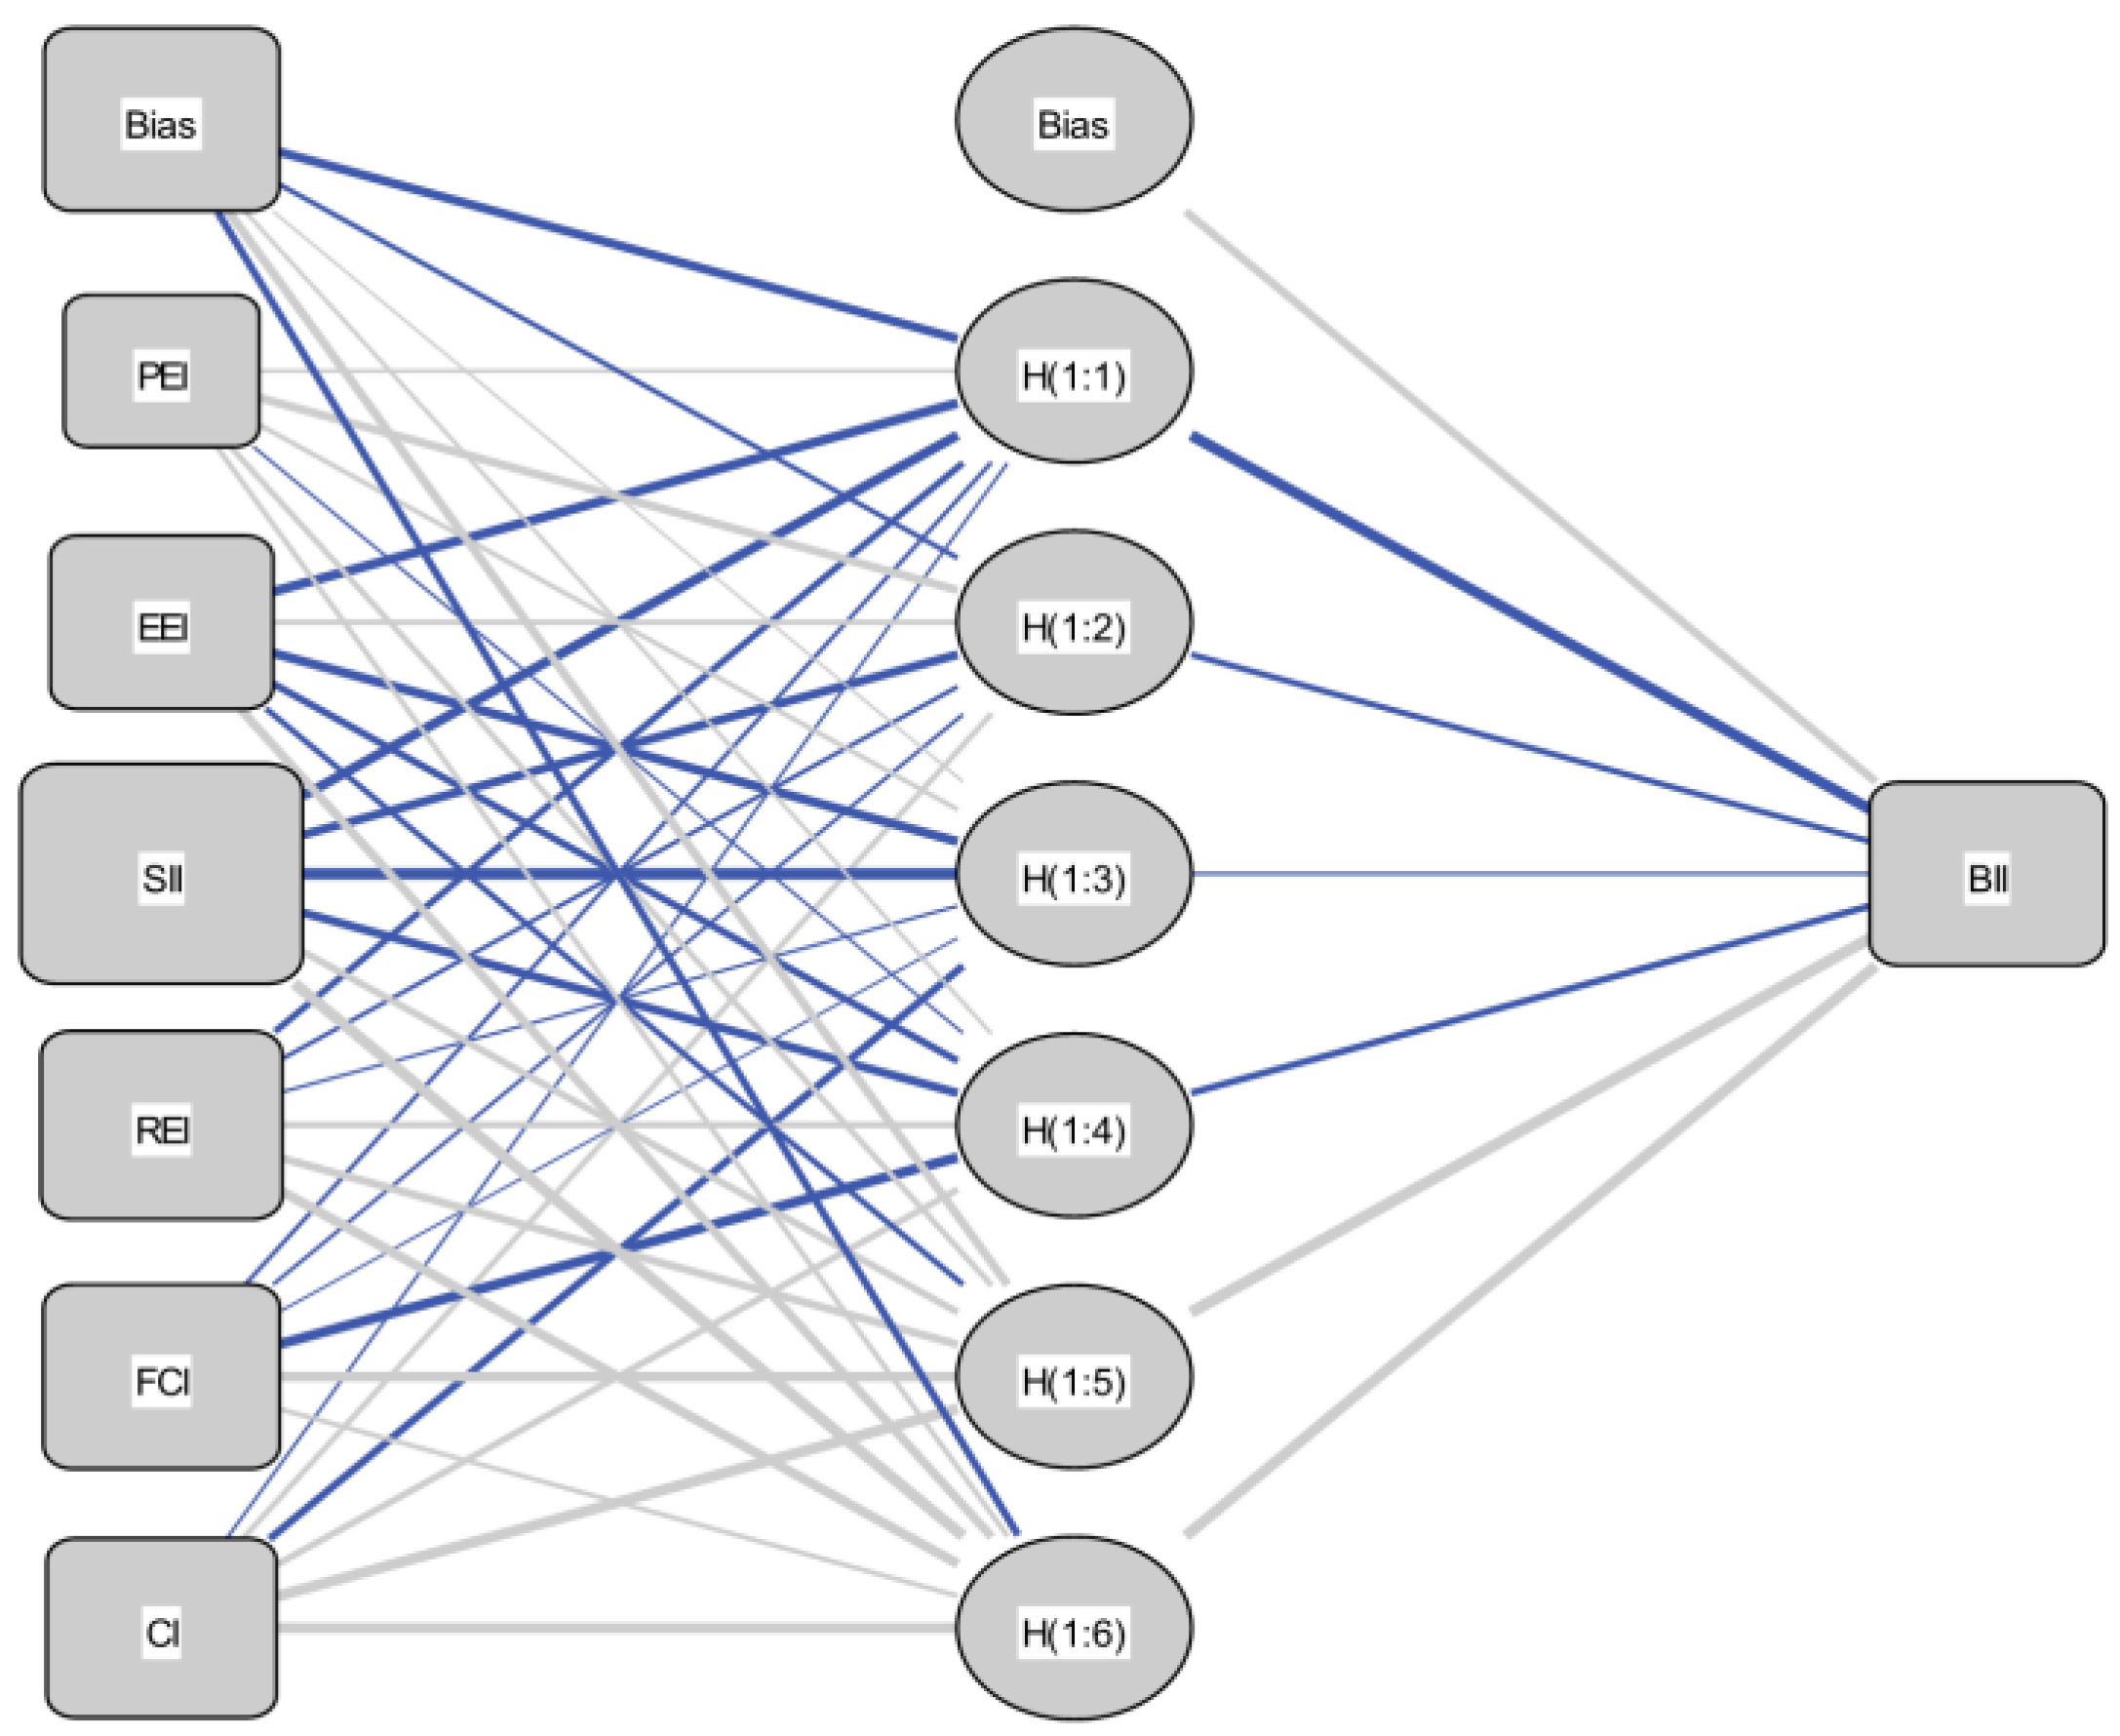
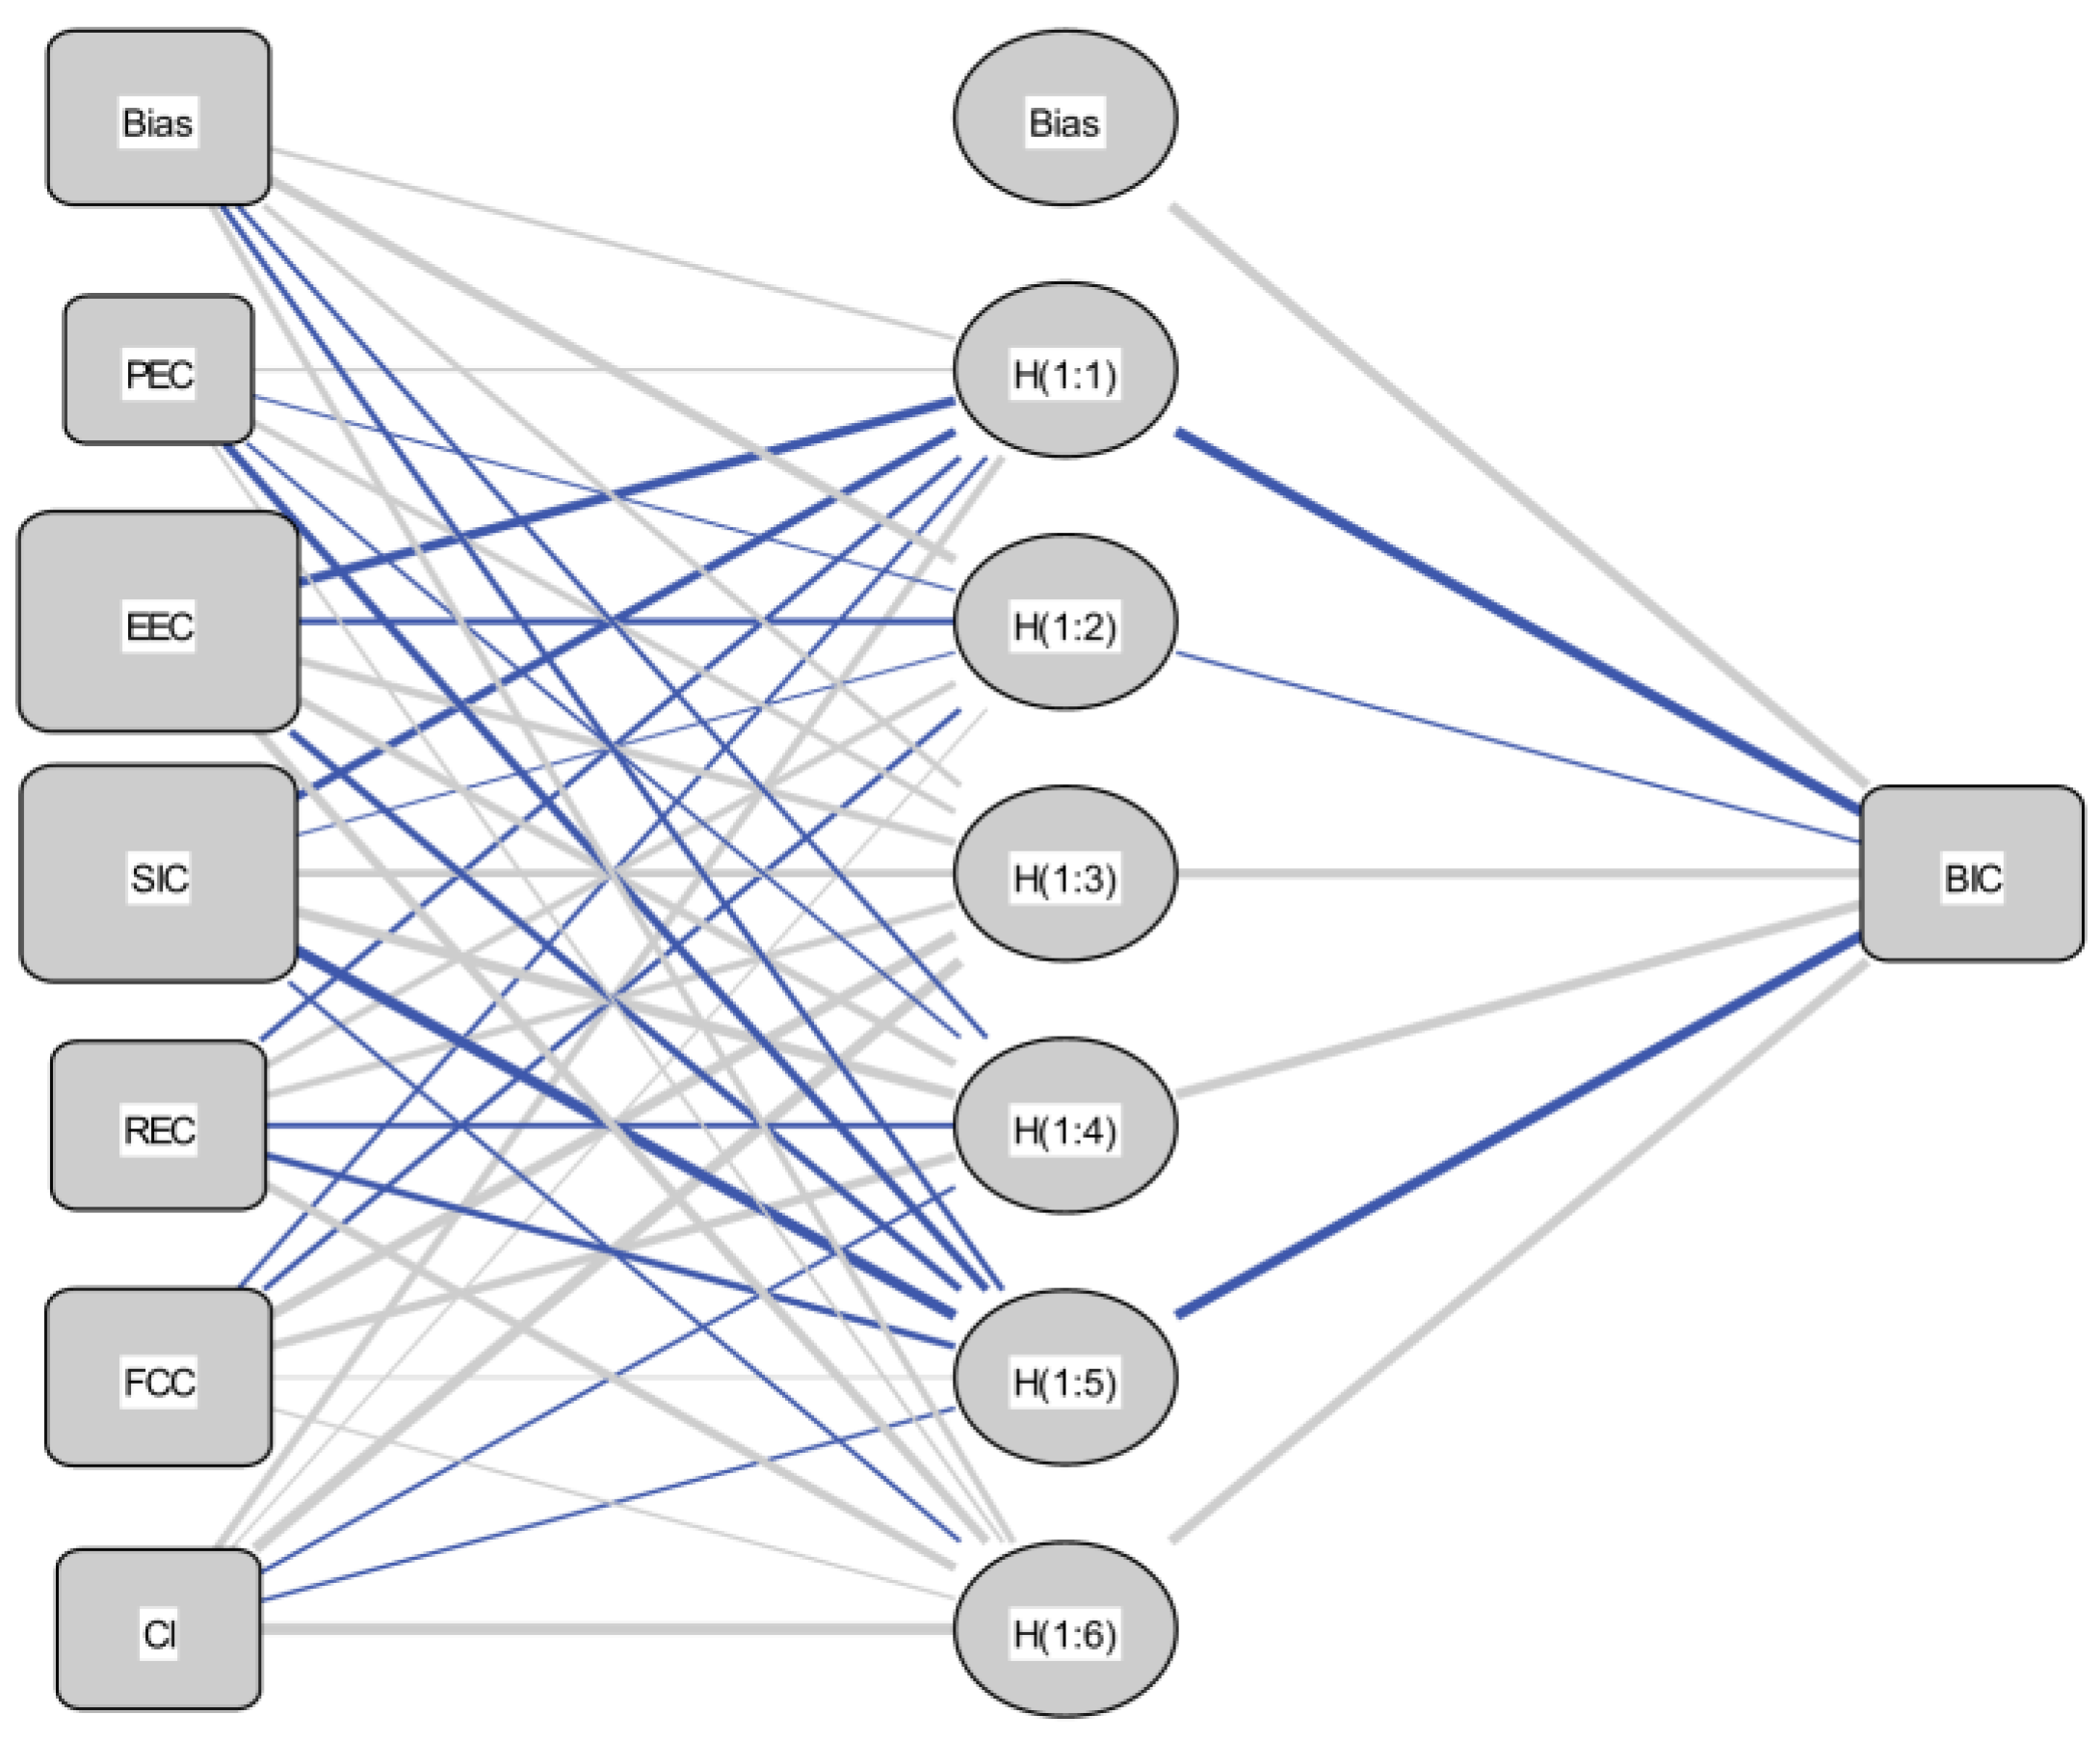
To model a feedforward neural network, the number of hidden layers must be determined first. Two or more hidden layers can model discontinuous functions to express complex correlations. In the analysis of the acceptance of autonomous vehicles, the correlation function is usually continuous. Therefore, this study used a single hidden layer to model the continuous function. The input and output layers were arranged according to the number of research variables. The number of neurons in the hidden layer was not absolute; it depended on the number of hidden layers, sample size, neural network structure, activation function complexity, and training algorithm, among other factors. The prediction accuracy of the artificial neural network analysis would increase with the number of neurons in the hidden layer, but too many neurons would also lead to overfitting of the model, so an appropriate number of neurons in the hidden layer needed to be selected. In the artificial neural network structure constructed in this study, the output layer was a single psychological variable, so the number of neurons in the hidden layer was the same as the input layer.
The feedforward backpropagation multilayer perceptron is used to quantify the relationship between the predictor variable and the dependent variable. An artificial neural network model is built according to the correlation of the variables after SEM analysis. The output variable of the artificial neural network model was the behavioral intention. The input variable was the significant influencing factors of the acceptance of autonomous vehicles obtained after SEM analysis, namely Effort Expectancy, Social influence, Performance Expectancy, Risk Expectancy, and Consumer Innovation, as shown in Figure 10 and Figure 11.
To avoid ANN overfitting, a 10-fold cross validation method was adopted, in which 90% of the data were used for network training, and 10% of the data were used for testing. The training and testing of the neural network activated by the Sigmoid function and the model’s prediction accuracy were tested by the root-mean-square error. The final test results are shown in Table 8.
It can be seen from Table 6 that the root-mean-square error in the two neural network models was relatively small. The mean of the root-mean-square error in the training data was 0.1118 and 0.1198, and for the testing data it was 0.0056 and 0.0311, indicating that the neural network model had a good prediction effect.
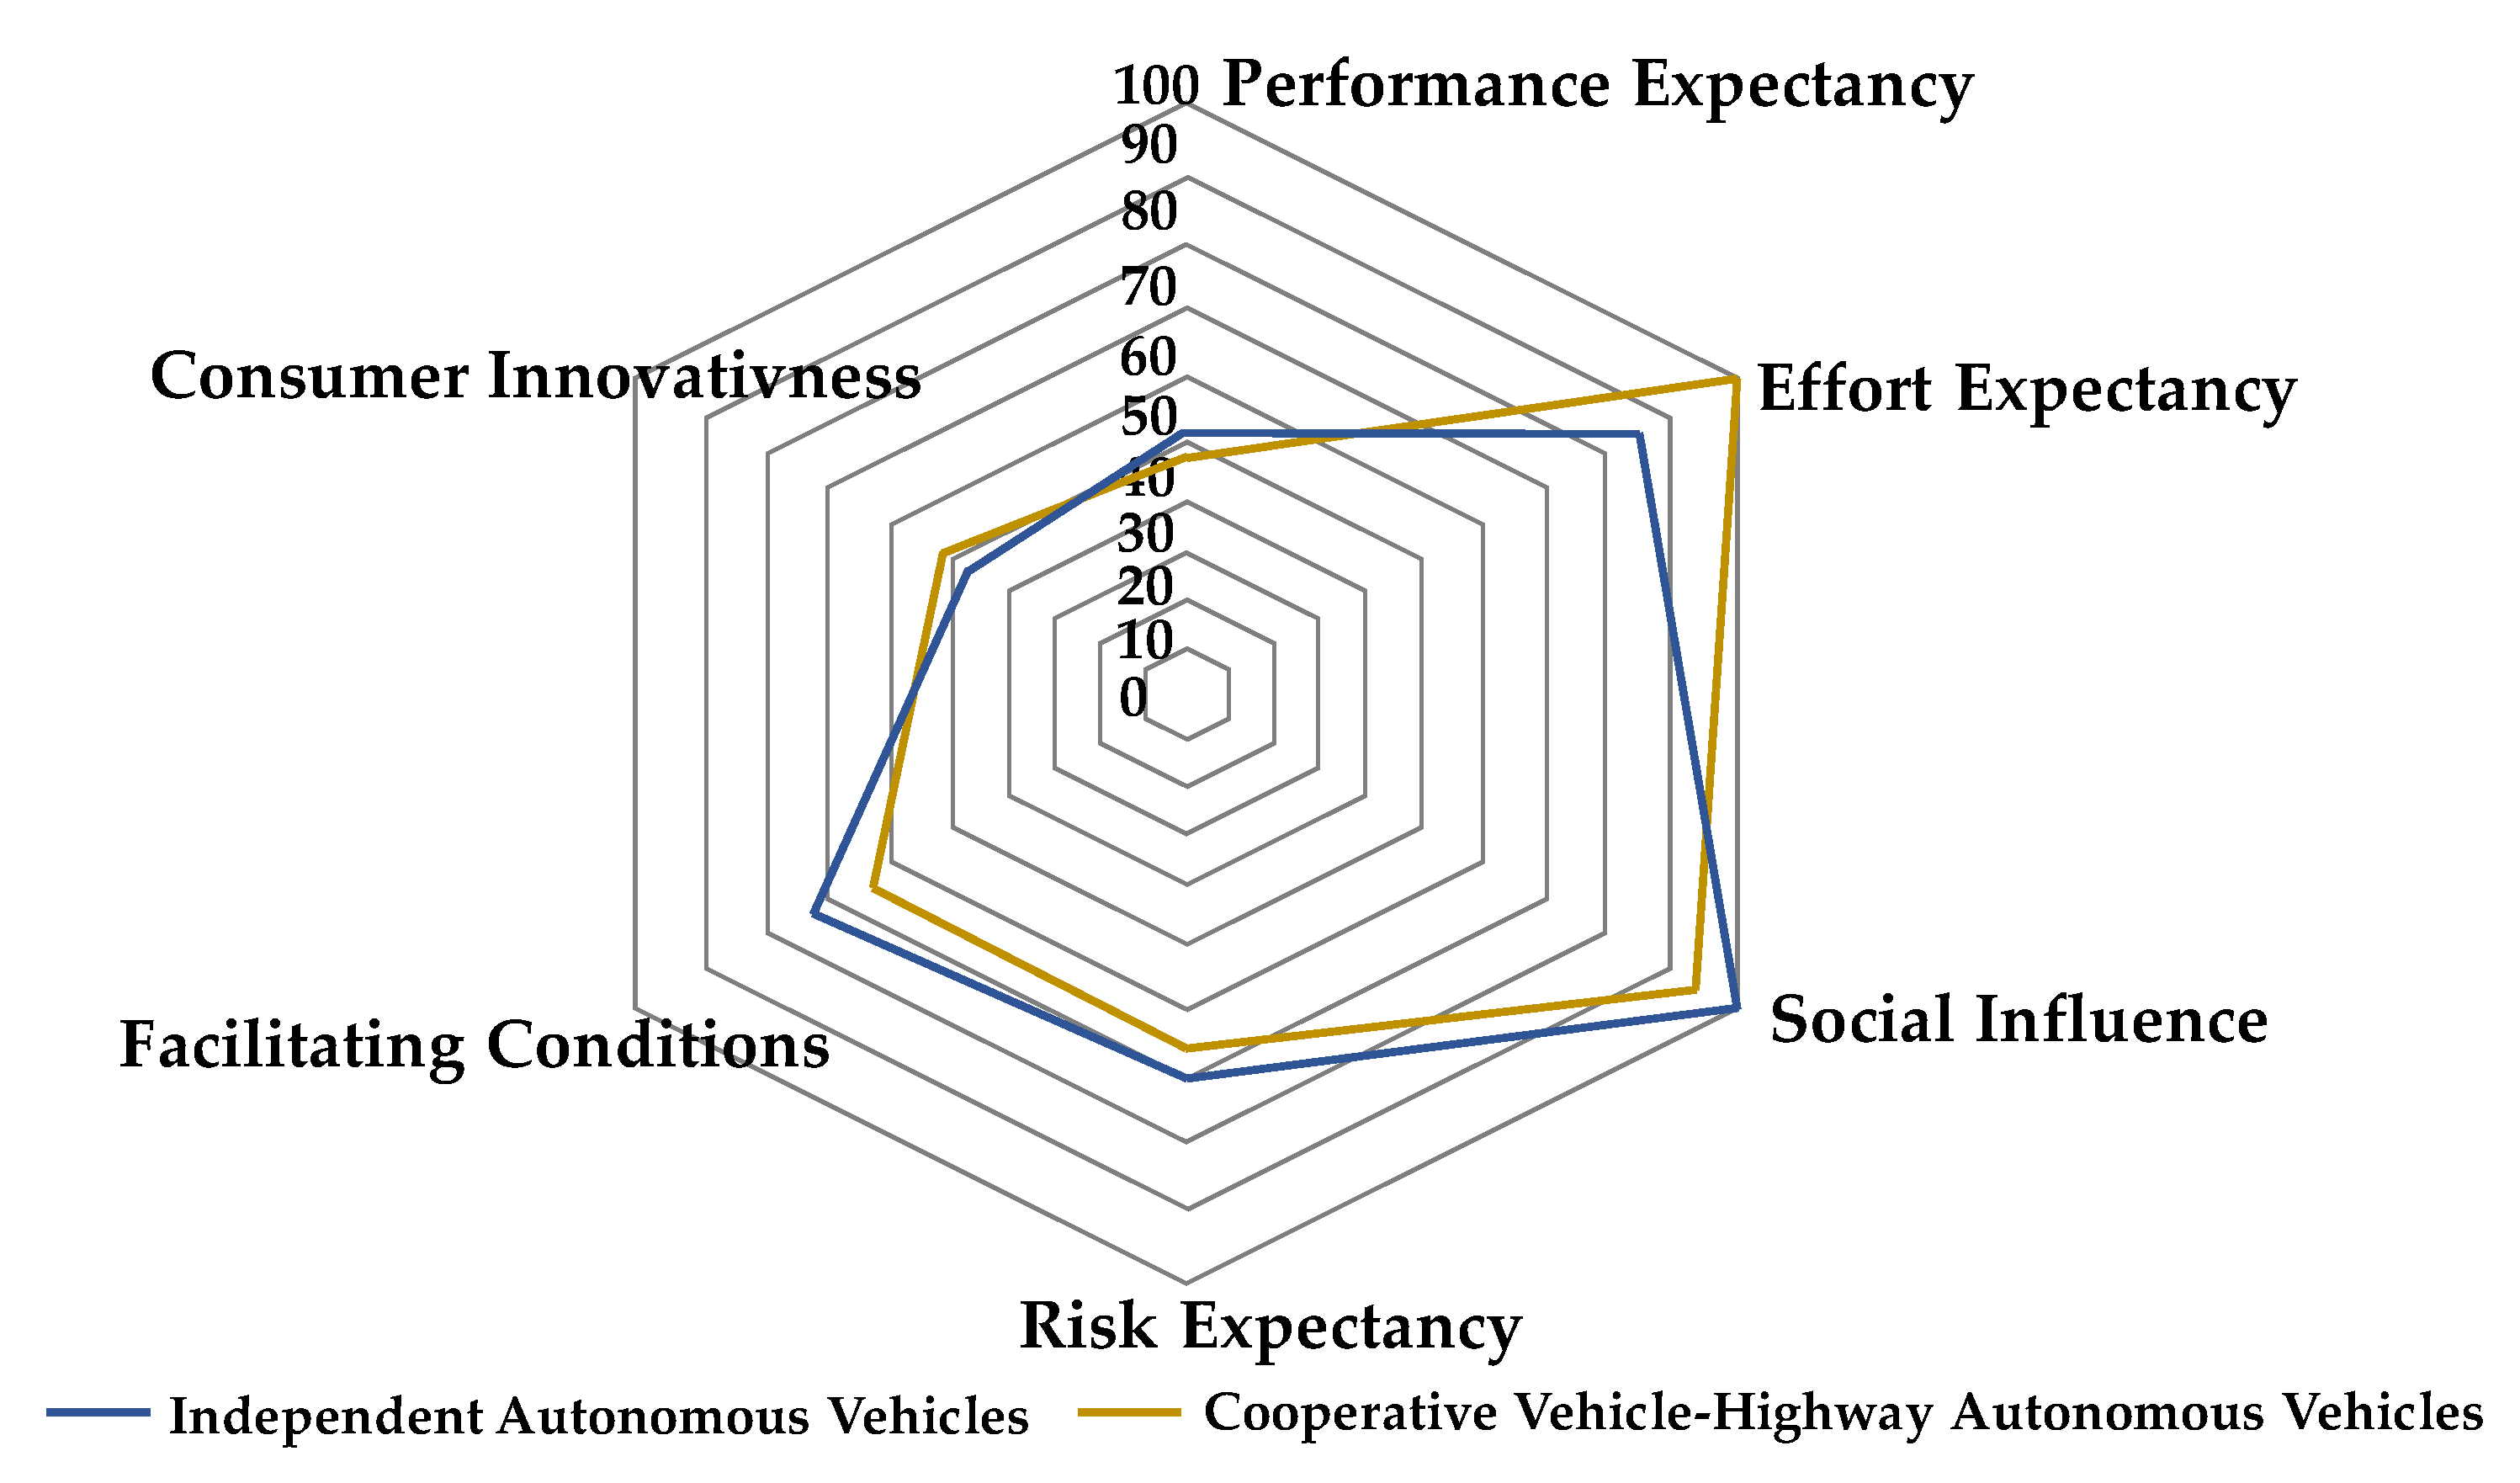
Finally, the sensitivity analysis of the neural network was performed. The analysis results are shown in Table 9 and Table 10. The relative importance in the sensitivity analysis refers to the relative influence degree of the input layer variables’ output layer variables [16]. The relative importance of the input layer variable with the highest degree of influence was 100%.
As shown in Figure 12, the Social Influence (SII) of ANN A was the strongest in terms of relative importance, and the Effort Expectancy (EEC) of ANN B was the strongest. The common point was that Social Influence and Effort Expectancy were the two most substantial input layer variables in the two neural networks, and there was little difference in their importance. The Consumer Innovativeness (CII) of ANN A had the weakest relative importance, and the weakest of ANN B was the Risk Expectancy (REC). Simultaneously, Consumer Innovativeness and Risk Expectancy were the input layer variables with the lowest relative importance in the two neural networks. This shows that the most important factor influencing the acceptance of independent autonomous vehicles was Social Influence, and Effort Expectancy was the most critical factor influencing the acceptance of cooperative vehicle-highway autonomous vehicles.

5. Empirical Analysis Results

5.1. Willingness to Accept

After structural equation model testing, it was found that Performance Expectancy, Effort Expectancy, Social Influence, Risk Expectancy, Facilitating Conditions, and Consumer Innovativeness in the model were significant factors influencing the willingness to accept. Among them, Social Influence showed the most vital weight among the six neurons in the neural network of the acceptance of independent autonomous vehicles (W = 0.234). This finding is similar to the results of Acheampong [31] and Jing et al. [32]. In the process of popularizing new technologies, the influence of public reputation on personal use intention may be greater than the influence of personal factors [33]. In addition, different from the path dependence theory of Western countries, China’s collectivist culture is one reason why people‘s ideas are easily affected by the social environment [34]. Many people will refer to the opinions of influential people around them such as parents, partners, and experienced friends when considering the considerable expense of buying a car.
In contrast, the predictive factor with the most potent weight for cooperative vehicle-autonomous highway vehicles was the Effort Expectancy (W = 0.236), and Social Influence was the second most significant factor (W = 0.225). The most vital influencing factors of cooperative vehicle-highway autonomous vehicles and independent autonomous vehicles in this paper were different. The possible reasons for this are that (1) for the public, the concept of cooperative vehicle-highway autonomous vehicles is rustier than independent autonomous vehicles, which leads to people being skeptical of its ease of use, and (2) cooperative vehicle-highway autonomous vehicles need to rely on detection information from roadside sensing facilities to realize autonomous driving. However, as far as domestic cities’ actual roads are concerned, the large-scale realization of this method will take a long time. The lack of roadside facilities may further raise questions about its feasibility.
Risk Expectancy and Facilitating Conditions are also significant predictors of willingness to accept autonomous driving, and both had an equal influence weight. Risk Expectancy was one of the predictive factors that affected people’s acceptance of autonomous driving. However, the Risk Expectancy of independent autonomous vehicles (W = 0.161) and the Risk Expectancy of cooperative vehicle-highway autonomous vehicles (W = 0.150) had low impact weights. Studies by Choi et al. and Xu et al. found that perceived risk has no significant effect on accepting autonomous driving [23,35]. Although risk factors frequently appear in acceptance studies, their predictive power conclusions are not the same. When people think that a particular technology will bring more significant benefits, their risk estimates will be correspondingly reduced [18]. Facilitating Conditions also significantly affected the acceptance of autonomous driving. Existing infrastructure conditions will affect the use of new technologies, and people who feel there are more conditions for promotion will be more willing to use new technologies [36]. However, research by Franziska et al. found that it is difficult for the elderly to estimate the Facilitating Conditions of autonomous driving [7]. Although the Facilitating Conditions of autonomous driving may affect its development, people’s insufficient understanding of the transportation infrastructure to assist autonomous driving may lead to weaker influence weights of the Facilitating Conditions.
Performance Expectancy is also a significant factor affecting the acceptance of independent autonomous vehicles and cooperative vehicle-highway autonomous vehicles. This conclusion is similar to those of previous studies [6,8,34,37]. This shows that people’s willingness to accept was affected by the function of autonomous driving, which provides a reference for marketers. In the future market, attention should be paid to publicizing the convenience that autonomous driving can provide to users, especially for people with an innovative consciousness as they are more willing to try new technologies. Moreover, this study’s results also show that consumer innovation was one of the influencing factors of the acceptance of autonomous driving, and the research of Thomas et al. also showed that consumer innovation has a moderating effect on the willingness to accept autonomous driving [37]. This conclusion also confirms the findings of Roehrich et al. [38] and Hirunyawipada et al. [39]. They believed that research on the acceptance of new technologies should consider consumers’ different tendencies towards innovation.

5.2. Suggestions and Strategies

In the future, autonomous driving technology may develop in the joint development of independent autonomous vehicles and cooperative vehicle-highway autonomous vehicles; that is, based on a road-sensing system with independent autonomous vehicles, autonomous vehicles also have the function of receiving real-time networked information to achieve stronger environmental perception capabilities. The public’s perception of independent autonomous vehicles and cooperative vehicle-highway autonomous vehicles should be compared and studied. On the one hand, we understand people’s perception of autonomous driving technology at different stages from a micro perspective, and on the other hand, because of different acceptance factors, it puts forward relevant suggestions on macro technology development and policy formulation:
1.
Intensify the promotion of autonomous technology through mass media and regional pilots.
Social Influence is the most significant factor influencing the acceptance of independent autonomous vehicles, which indicates that the public’s attitudes and understanding of autonomous driving at this stage are primarily affected by social factors such as the people around them or the media. Therefore, it is recommended that companies increase their autonomous driving publicity and improve the public’s objective perception through regional pilots or online media. Special attention should be paid to early users’ experiences, whose reputations have produced the initial impression of autonomous vehicles in society. At the same time, it is also recommended that the government supervision department improves the autonomous vehicle road test specifications and accident liability regulations to enhance the public’s sense of technology recognition and minimize the doubts about the safety risks of autonomous driving.
2.
Lowering the threshold for the use of autonomous technology through test drive experience and optimized pricing strategies.
Effort Expectancy was the most significant factor influencing the acceptance of cooperative vehicle-highway autonomous vehicles. This shows that people’s current understanding of the interactive forms in autonomous vehicles is not clear enough, and they believe that they need to pay high fees for them. Therefore, it is recommended that companies use test drives to allow more people to experience autonomous driving firsthand to weaken the technical complexity that people think is present. Simultaneously, it is also recommended that government economic departments introduce reasonable tax reduction and subsidy policies to reduce the cost and price of autonomous vehicles so that autonomous driving can benefit the masses.
3.
Promote the entry of autonomous vehicles into the market through the construction of smart transportation infrastructure.
Facilitating Conditions and Performance Expectancy were also significant factors influencing the acceptance of autonomous driving technology. It can be seen that people initially realized that the current level of transportation infrastructure construction would affect the realization of various convenient functions of autonomous vehicles to a certain extent. Therefore, it is recommended that the traffic management department comprehensively promote autonomous driving-related transportation infrastructure, such as through launching a demonstration project of intelligent connected roads, opening up dedicated lanes for autonomous vehicles, and establishing a smart transportation cloud service platform. Aside from that, it can also provide solid economic and technical support for developing autonomous driving by integrating resources in multiple fields such as IT, automobiles, and engineering.

6. Results and Prospects

6.1. Research Results

In this paper, the influence of variables in the extended UTAUT theoretical model on accepting independent autonomous vehicles and cooperative vehicle-highway autonomous vehicles was studied by combining the structural equation model with an artificial neural network. The structural equation model was used to analyze and verify the significance of the variables, and then the weights of each variable were identified in the artificial neural network analysis. The specific conclusions of this study are as follows.
Through structural equation model analysis, it was verified that six significant factors affecting the acceptance of autonomous driving in the theoretical framework were Social Influence, Effort Expectancy, Facilitating Conditions, Risk Expectancy, Performance Expectancy, and Consumer Innovativeness. At the same time, for the correlation between the independent variables in the model, Risk Expectancy and Performance Expectancy were analyzed separately. From the perspectives of actual utility and potential risks, the public’s psychology of choice and trade-off for autonomous technology was unearthed to have a deeper understanding of the acceptance behavior of autonomous driving.
After artificial neural network analysis, the predicted weight of each factor was obtained. Social Influence and Effort Expectancy were the largest weight predictors of the acceptance of independent autonomous vehicles and cooperative vehicle-highway autonomous vehicles. This shows that social influencing factors and the threshold for autonomous driving were the two aspects that people were most concerned about. Second, Risk Expectancy and Facilitating Conditions also significantly affected the acceptance of autonomous driving. While people look forward to autonomous driving’s actual utility, they also worry about whether the existing transportation facilities can support autonomous vehicles’ operation. Additionally, the weight of the impact of Performance Expectancy and Consumer Innovativeness was relatively weak, indicating that people will consider its practical use before accepting autonomous driving. It can be seen that the functionality of autonomous driving still needs to be further popularized. In the process of popularization, special attention should be paid to early users of autonomous driving vehicles with innovative consciousness. Their driving experience will have a reputation for the popularization of autonomous technology.

6.2. Research Prospect

The large-scale use of autonomous vehicles in the future will change the existing traffic patterns and people’s travel patterns. This impact may involve transportation infrastructure construction, transportation practitioners’ employment, travel costs, economic and technical safety, and other factors. These may be potential research directions for the acceptance of autonomous technology from the perspective of influencing factors, including the network safety, driving safety, marginal cost, environmental friendliness, comfort, and travel time value of autonomous driving. From the research objects’ perspective, some particular groups of people may have higher expectations for autonomous driving, such as the elderly, the injured, the blind, and minors. In addition, people’s acceptance of autonomous driving may generate a dynamic preference over time. As autonomous driving technology matures and its market share increases, people’s attitudes may not stay the same. This dynamic preference can be further analyzed through longitudinal data.
In addition to interview surveys, there are many ways to study the acceptance of autonomous driving. The real car or simulator experience of autonomous driving allows people to have an intuitive understanding of its specific functions and features, which will increase the accuracy of the prediction of acceptance studies. There are differences in the understanding of autonomous driving technology among groups in different regions. Comparing the differences in the population’s attitudes in multiple regions can provide developers with personalized suggestions, allowing autonomous vehicles to provide consumers with more targeted services.

Author Contributions

Data Curation, S.Z.; methodology, P.J.; software, G.X.; supervision, P.J. All authors have read and agreed to the published version of the manuscript.

Funding

This study was supported by the National Natural Science Foundation of China (Grant No. 71871107).

Conflicts of Interest

The authors declare no conflict of interest.

Appendix A

Appendix A.1. Acceptance Survey of Independent Autonomous Vehicles and Cooperative Vehicle-Highway Autonomous Vehicles

Dear citizen:
We are conducting a study on the public’s awareness of autonomous technology, aiming to understand the acceptance of autonomous vehicles as they gradually enter the market. This questionnaire will take you about 6 min. There is no right or wrong answer. As long as the answer reflects your true thoughts, the purpose of this survey can be achieved. Thank you for your cooperation.
Basic personal information
1.
Your gender:
□ Male □ Female
2.
Your age:
3.
Your marital status:
□ Unmarried □ Married
4.
Your education:
□ Below elementary school □ Primary school □ Junior high □ Technical secondary school □ High school □ College □ Undergraduate □ Master □ Doctor □ Ph.D. or above
5.
Your monthly income:
□ Below CNY 2000 □ CNY 2001~3500 □ CNY 3501~5000 □ CNY 5001~6500 □ CNY 6501~8000 □ CNY 8001~10,000 □ CNY 10,001~15,000 □ CNY 15,001~20,000 □ CNY 20,001 or more
6.
Your current occupation:
□ Full-time student □ Production staff □ Sales staff □ Marketing/public relations staff □ Customer service staff □ Administrative/logistics staff □ Human resources □ Finance/audit staff □ Clerical/office staff □ Technical/R&D staff □ Management staff □ Teacher □ Consultant/consulting □ Professional (accountant, lawyer, architect, medical staff, journalists, etc.) □ Other
7.
Do you have a driver’s license:
□ Yes □ No
8.
How many cars do you have:
□ 0 vehicles □ 1 vehicles □ 2 vehicles □ 3 vehicles □ 4 vehicles or more
9.
Through what channels have you learned about autonomous vehicles (multiple choice):
□ Network □ Books and newspapers □ TV broadcast □ Auto show or exhibition □ Relatives and friends □ Never know
10.
What do you do when riding in a fully autonomous vehicle that does not require manual operation (multiple choices):
□ Reading □ Listen to the radio □ Enjoy the scenery □ Sleep and rest □ Eat □ Chat □ Work □ Look at the phone □ Still pay attention to road conditions □ Other

Appendix A.2. Attitude Survey (Please Read the Following Description in Full)

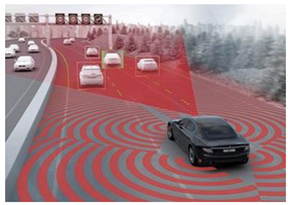
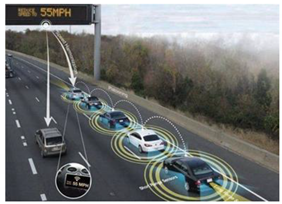
Autonomous driving is an intelligent system that realizes unmanned driving through computer programs. When driving in automatic mode, the driver does not need to manually operate the vehicle. The driver can read a book or take a nap on the way to work. After getting off the car, the car will automatically drive to the parking space. If the parking space is tight or there is no free parking space, the car can even drive home by itself. After the driver gets off work, the car automatically drives back to the company. At present, autonomous driving is divided into two types: independent autonomous vehicles and cooperative vehicle-highway autonomous vehicles, as shown in Table A1.
Table A1. Two types of autonomous driving.
Independent Autonomous VehiclesCooperative Vehicle-Highway Autonomous Vehicles
Information 12 00346 i001 Information 12 00346 i002
Independent autonomous vehicles rely on its radars, cameras, sensors, and other equipment to perceive road and traffic conditions. The vehicles use computer analysis and decision making to choose a suitable route to drive. Among the independent autonomous vehicles that have come out, the cost of a variety of high-precision sensors accounts for about 40% of the total vehicle cost. These sensors also allow the vehicles to run on existing roads, the most representative of which are Tesla and Google autonomous vehicles.Cooperative vehicle-highway autonomous vehicles mainly monitor the road in real time through roadside sensing devices. These devices send information such as the speed and location of each car and person on the road to the driving car in real time, and the car realizes automatic driving based on this information. In this mode, the car must drive on a dedicated road with roadside sensing equipment. Several vehicles can even automatically queue up at the same interval, and the cost of the roadside equipment is shared among all car owners.
Independent autonomous vehicles and cooperative vehicle-highway autonomous vehicles are both aimed at realizing autonomous driving. The technical difference between the two is that the former relies on vehicle-mounted sensor devices, and the latter relies on roadside sensor devices. Please read the paired question items in Table A2, and then use your subjective feelings about these two different modes of autonomous driving to choose between five attitudes from strongly disagree to strongly agree on the right.
Table A2. Some questions about autonomous driving.
ItemsStrongly DisagreeDisagreeNot SureAgreeStrongly Agree
11. Independent autonomous vehicles can save driving time.
12. Cooperative vehicle-highway autonomous vehicles can save driving time.
13. I feel safe to cross the road in front of independent autonomous vehicles.
14. I feel safe to cross the road in front of cooperative vehicle-highway autonomous vehicles.
15. I should have the ability to use an independent autonomous vehicle.
16. I should have the ability to use a cooperative vehicle-highway autonomous vehicle.
17. After independent autonomous vehicles are put on the market, I plan to use one as a daily travel tool.
18. After cooperative vehicle-highway autonomous vehicles are put on the market, I plan to use one as a daily travel tool.
19. Independent autonomous vehicles will reduce traffic violations.
20. Cooperative vehicle-highway autonomous vehicles will reduce traffic violations.
21. People who are important to me think that I should use an independent autonomous vehicle.
22. People who are important to me think that I should use a cooperative vehicle-highway autonomous vehicle.
23. After independent autonomous vehicles are put on the market, I believe I can afford them.
24. After cooperative vehicle-highway autonomous vehicles are put on the market, I believe I can afford them.
25. Independent autonomous vehicles will make roads safer.
26. Cooperative vehicle-highway autonomous vehicles will make roads safer.
27. Independent autonomous vehicles will effectively interact with other vehicles.
28. Cooperative vehicle-highway autonomous vehicles will effectively interact with other vehicles.
29. Existing transportation infrastructure can support the advancement of independent autonomous technology.
30. Existing transportation infrastructure can support the advancement of cooperative vehicle-highway autonomous technology.
31. Interacting with an independent autonomous system does not require a lot of brain power.
32. Interacting with a cooperative vehicle-highway autonomous system does not require a lot of brain power.
33. Using an independent autonomous vehicle can give me more time to do other things.
34. Using a cooperative vehicle-highway autonomous vehicle can give me more time to do other things.
35. The independent autonomous system helps reduce the risk of car collisions.
36. The cooperative vehicle-highway autonomous system helps reduce the risk of car collisions.
37. After the independent autonomous vehicle is put on the market, I will use it frequently in future trips.
38. After the cooperative vehicle-highway autonomous vehicle is put on the market, I will use it frequently in future trips.
39. People who are important to me or those who influence my behavior will trust independent autonomous vehicles (or have a positive attitude towards them).
40. People who are important to me or those who influence my behavior will trust cooperative vehicle-highway autonomous vehicles (or have a positive attitude towards them).
41. After the independent autonomous vehicle is put on the market, I believe I can buy or rent it.
42. After the cooperative vehicle-highway autonomous vehicle is put on the market, I believe I can buy or rent it.
43. The independent autonomous vehicle will reduce my problems when driving.
44. The cooperative vehicle-highway autonomous vehicle will reduce my problems when driving.
45. My relatives and friends will support me in using an independent autonomous vehicle.
46. My relatives and friends will support me in using a cooperative vehicle-highway autonomous vehicle.
47. Manual driving is safer than independent autonomous vehicle driving.
48. Manual driving is safer than cooperative vehicle-highway autonomous vehicle driving.
49. The emergence of independent autonomous vehicles will make the entire transportation system smoother.
50. The emergence of cooperative vehicle-highway autonomous vehicles will make the entire transportation system smoother.
51. Independent autonomous vehicles are vulnerable to new security issues, such as hacking and data security.
52. Cooperative vehicle-highway autonomous vehicles are vulnerable to new security issues, such as hacking and data security.
53. I may not be able to operate an independent autonomous vehicle.
54. I may not be able to operate a cooperative vehicle-highway autonomous vehicle.
55. The independent autonomous vehicle is compatible with all aspects of the urban transportation system.
56. The cooperative vehicle-highway autonomous vehicle is compatible with all aspects of the urban transportation system.
57. When self-driving vehicles are put on the market, in future trips, I am willing to act as the main driver of independent autonomous vehicles.
58. When self-driving vehicles are put on the market, in future trips, I am willing to act as the main driver of cooperative vehicle-highway autonomous vehicles.
59. The attitudes and opinions of people around me towards autonomous vehicles will affect my use of independent autonomous vehicles.
60. The attitudes and opinions of people around me towards autonomous vehicles will affect my use of cooperative vehicle-highway autonomous vehicles.
61. I am used to trying new technology products.
62. I am usually the first person among my friends to use a new generation of technology products.
63. I often pay attention to the upgrading of technology products.
This is the end of the questionnaire survey. Thank you very much for your participation!

Appendix B

The items for psychological variables were shown inTable A3.
Table A3. Items for psychological variables.
VariablesMeasurement Problem Item
PEPE_S1: Independent autonomous vehicles can save driving time.
PE_C1: Cooperative vehicle-highway autonomous vehicles can save driving time.
PE_S2: Independent autonomous vehicles will reduce traffic violations.
PE_C2: Cooperative vehicle-highway autonomous vehicles will reduce traffic violations.
PE_S3: Using an independent autonomous vehicle can give me more time to do other things.
PE_C3: Using a cooperative vehicle-highway autonomous vehicle can give me more time to do other things.
EEEE_S1: I should be able to operate an independent autonomous vehicle.
EE_C1: I should be able to operate a cooperative vehicle-highway autonomous vehicle.
EE_S2: It does not take me a lot of brainpower to interact with an independent autonomous vehicle.
EE_C2: It does not take me a lot of brainpower to interact with a cooperative vehicle-highway autonomous vehicle.
EE_S3: When the independent autonomous vehicles are put on the market, I believe I can buy or rent them.
EE_C3: When the cooperative vehicle-highway autonomous vehicles are put on the market, I believe I can buy or rent them.
EE_S4: I may not be able to operate an independent autonomous vehicle.
EE_C4: I may not be able to operate a cooperative vehicle-highway autonomous vehicle.
SISI_S1: People who are important to me think that I should use an independent autonomous vehicle.
SI_C1: People who are important to me think that I should use a cooperative vehicle-highway autonomous vehicle.
SI_S2: People who are important to me or those who influence my behavior will trust independent autonomous vehicles.
SI_C2: People who are important to me or those who influence my behavior will trust cooperative vehicle-highway autonomous vehicles.
SI_S3: My relatives and friends will support me in using an independent autonomous vehicle.
SI_C3: My relatives and friends will support me in using a cooperative vehicle-highway autonomous vehicle.
FCFC_S1: Independent autonomous vehicles will effectively interact with other vehicles.
FC_C1: Cooperative vehicle-highway autonomous vehicles will effectively interact with other vehicles.
FC_S2: Existing transportation infrastructure can support the advancement of independent autonomous vehicles.
FC_C2: Existing transportation infrastructure can support the advancement of cooperative vehicle-highway autonomous vehicles.
FC_S3: An independent autonomous vehicle is compatible with all aspects of the urban transportation system.
FC_C3: A cooperative vehicle-highway autonomous vehicle is compatible with all aspects of the urban transportation system.
BIBI_S1: When an independent autonomous vehicle is put on the market, I plan to use it as a daily transportation tool in future trips.
BI_C1: When a cooperative vehicle-highway autonomous vehicle is put on the market, I plan to use it as a daily transportation tool in future trips.
BI_S2: When an independent autonomous vehicle is put on the market, I will use it frequently in future trips.
BI_C2: When a cooperative vehicle-highway autonomous vehicle is put on the market, I will use it frequently in future trips.
BI_S3: When an independent autonomous vehicle is put on the market, I am willing to focus on it in future travel.
BI_C3: When a cooperative vehicle-highway autonomous vehicle is put on the market, I am willing to focus on it in future travel.
RERE_S1: I feel safe to cross the road in front of an independent autonomous vehicle.
RE_C1: I feel safe to cross the road in front of a cooperative vehicle-highway autonomous vehicle.
RE_S2: Independent autonomous vehicles will make roads safer.
RE_C2: Cooperative vehicle-highway autonomous vehicles will make roads safer.
RE_S3: Independent autonomous vehicles help reduce the risk of car collisions.
RE_C3: Cooperative vehicle-highway autonomous vehicles help reduce the risk of car collisions.
CICI_1: I like to try new technology products.
CI_2: I am usually the first person among my friends to use a new generation of technology products.
CI_3: I often pay attention to the upgrading of technology products.

References

  1. Milakism, D.; Van Arem, B.; Van Wee, B. Policy and society related implications of automated driving: A review of literature and directions for future research. J. Intell. Transp. Syst. 2017, 21, 324–348. [Google Scholar] [CrossRef]
  2. Banks, V.A.; Plant, K.L.; Stanton, N.A. Driver error or designer error: Using the Perceptual Cycle Model to explore the circumstances surrounding the fatal Tesla crash on 7th May 2016. Saf. Sci. 2018, 108, 278–285. [Google Scholar] [CrossRef] [Green Version]
  3. Ling, B.; Xiong, Y.; Sun, Y.; Ren, S.; Huang, Y.; Wang, H. Talking about how to deal with the new challenges of auto insurance in the era of autonomous driving. China Manag. Inf. 2019, 22, 125–128. [Google Scholar]
  4. China Mobile Communications Group Co., Ltd. China Mobile 5G Joint Innovation Center Innovation Research Report-Next Generation Internet of Vehicles Innovation Research Report; China Mobile 5G Joint Innovation Center: Hong Kong, China, 2019. [Google Scholar]
  5. Haboucha, C.J.; Ishaq, R.; Shiftan, Y. User preferences regarding autonomous vehicles. Transp. Res. Part C Emerg. Technol. 2017, 78, 37–49. [Google Scholar] [CrossRef]
  6. Kaur, K.; Rampersad, G. Trust in driverless cars: Investigating key factors influencing the adoption of driverless cars. J. Eng. Technol. Manag. 2018, 48, 87–96. [Google Scholar] [CrossRef]
  7. Hartwich, F.; Witzlack, C.; Beggiato, M.; Krems, J.F. The first impression counts–A combined driving simulator and test track study on the development of trust and acceptance of highly automated driving. Transp. Res. Part F Traffic Psychol. Behav. 2018, 65, 522–535. [Google Scholar] [CrossRef]
  8. Kettles, N.; Van, B.J.-P. Investigation into the antecedents of autonomous car acceptance using an enhanced UTAUT model. In Proceedings of the 2019 International Conference on Advances in Big Data, Computing and Data Communication Systems, Drakensberg Sun Resort, KwaZulu Natal, South Africa, 5–6 August 2019; pp. 1–6. [Google Scholar]
  9. Manfreda, A.; Ljubi, K.; Groznik, A. Autonomous vehicles in the smart city era: An empirical study of adoption factors important for millennials. Int. J. Inf. Manag. 2019, 58, 102050. [Google Scholar] [CrossRef]
  10. Liébana-Cabanillas, F.; Marinkovic, V.; De Luna, I.R.; Kalinic, Z. Predicting the determinants of mobile payment acceptance: A hybrid SEM-neural network approach. Technol. Forecast. Soc. Chang. 2018, 129, 117–130. [Google Scholar] [CrossRef]
  11. Hew, T.-S.; Leong, L.-Y.; Ooi, K.-B. Predicting drivers of mobile entertainment adoption: A two-stage SEM-artificial-neural-network analysis. J. Comput. Inf. Syst. 2016, 56, 352–370. [Google Scholar] [CrossRef]
  12. Tan, G.W.-H.; Ooi, K.-B.; Leong, L.-Y. Predicting the drivers of behavioral intention to use mobile learning: A hybrid SEM-Neural Networks approach. Comput. Hum. Behav. 2014, 36, 198–213. [Google Scholar] [CrossRef]
  13. Sharma, S.-K.; Gaura, A.; Saddikuti, V. Structural equation model (SEM)-neural network (NN) model for predicting quality determinants of e-learning management systems. Behav. Inf. Technol. 2017, 36, 1053–1066. [Google Scholar] [CrossRef]
  14. Arif, I.; Aslam, W.; Hwang, Y. Barriers in adoption of internet banking: A structural equation modeling-Neural network approach. Technol. Soc. 2020, 61, 101231. [Google Scholar] [CrossRef]
  15. Sim, J.-J.; Tan, G.W.-H.; Wong, J.C. Understanding and predicting the motivators of mobile music acceptance–a multi-stage MRA-artificial neural network approach. Telemat. Inform. 2014, 31, 569–584. [Google Scholar] [CrossRef]
  16. Chong, A.Y.-L. Predicting m-commerce adoption determinants: A neural network approach. Expert Syst. Appl. 2013, 40, 523–530. [Google Scholar] [CrossRef]
  17. Solbraa Bay, A.J. Innovation Adoption in Robotics: Consumer Intentions to Use Autonomous Vehicles; Norwegian School of Economics: Bergen, Norway, 2016. [Google Scholar]
  18. Zhang, T.; Tao, D.; Qu, X.; Zhang, X.; Lin, R.; Zhang, W. The roles of initial trust and perceived risk in public’s acceptance of automated vehicles. Transp. Res. Part C Emerg. Technol. 2019, 98, 207–220. [Google Scholar] [CrossRef]
  19. Liu, P.; Yang, R.; Xu, Z. Public acceptance of fully automated driving: Effects of social trust and risk/benefit perceptions. Risk Anal. 2019, 39, 326–341. [Google Scholar] [CrossRef]
  20. Rogers, E.M. Diffusion of Innovations; Simon and Schuster: New York, NY, USA, 2010. [Google Scholar]
  21. Cheng, K.M. Characteristics and application of structural equation model. Stat. Decis. 2006, 10, 22–25. [Google Scholar]
  22. Zmud, J.; Sener, I.N.; Wagner, J. Consumer Acceptance and Travel Behavior: Impacts of Automated Vehicles; Texas A&M Transportation Institute: College Station, TX, USA, 2016. [Google Scholar]
  23. Xu, Z.; Zhang, K.; Min, H.; Wang, Z.H.; Zhao, X.; Liu, P. What drives people to accept automated vehicles? Findings from a field experiment. Transp. Res. Part C Emerg. Technol. 2018, 95, 320–334. [Google Scholar] [CrossRef]
  24. Bennett, R.; Vijaygopal, R.; Kottasz, R. Willingness of people who are blind to accept autonomous vehicles: An empirical investigation. Transp. Res. Part F Traffic Psychol. Behav. 2020, 69, 13–27. [Google Scholar] [CrossRef]
  25. Singh, R.; Chowdhury, P.; Samuel, M.S. Artificial neural networks: A tool for understanding green consumer behavior. Mark. Intell. Plan. 2014, 32, 552–566. [Google Scholar]
  26. Kadali, B.R.; Rathi, N.; Perumal, V. Evaluation of pedestrian mid-block road crossing behaviour using artificial neural network. J. Traffic Transp. Eng. 2014, 1, 111–119. [Google Scholar]
  27. Yan, B.; Chu, X.; Zhang, L. User perception modeling by combining structural equation model and artificial neural network. J. Shanghai Jiaotong Univ. 2019, 53, 830–837. [Google Scholar]
  28. Venkatesh, V.; Morris, M.G.; Davis, G.B.; Davis, F.D. User acceptance of information technology: Toward a unified view. MIS Q. 2003, 27, 425–478. [Google Scholar] [CrossRef] [Green Version]
  29. Fang, M. Reliability test under structural equation model. Chin. J. Health Stat. 2009, 29, 524–526. [Google Scholar]
  30. George, D.; Mallery, P. SPSS for Windows step by step: As simple guide and reference. Comput. Softw. 2010, 100, 357. [Google Scholar]
  31. Acheampong, R.A.; Cugurullo, F. Capturing the behavioural determinants behind the adoption of autonomous vehicles: Conceptual frameworks and measurement models to predict public transport, sharing and ownership trends of self-driving cars. Transp. Res. Part F Traffic Psychol. Behav. 2019, 62, 349–375. [Google Scholar] [CrossRef] [Green Version]
  32. Jing, P.; Huang, H.; Ran, B. Exploring the factors affecting mode choice Intention of autonomous vehicle based on an extended theory of planned behavior—A case study in China. Sustainability 2019, 11, 1155. [Google Scholar] [CrossRef] [Green Version]
  33. Kulviwat, S.; Bruner, G.C., II; Al-shuridah, O. The role of social influence on adoption of high tech innovations: The moderating effect of public/private consumption. J. Bus. Res. 2009, 62, 706–712. [Google Scholar] [CrossRef]
  34. Zhu, C.; Zhu, Y.; Lu, R.; He, R.; Xia, Z. Perceptions and aspirations for car ownership among Chinese students attending two universities in the Yangtze Delta, China. J. Transp. Geogr. 2012, 24, 315–323. [Google Scholar] [CrossRef]
  35. Choi, J.K.; Ji, Y.G. Investigating the Importance of Trust on Adopting an Autonomous Vehicle. Int. J. Hum.-Comput. Interact. 2015, 31, 692–702. [Google Scholar] [CrossRef]
  36. Viswanath, V.; Thong, J.Y.L.; Xu, X. Consumer acceptance and use of information technology: Extending the unified theory of acceptance and use of technology. MIS Q. 2012, 36, 157–178. [Google Scholar]
  37. Leicht, T.; Chtourou, A.; Youssef, K.B. Consumer innovativeness and intentioned autonomous car adoption. J. High Technol. Manag. Res. 2018, 29, 1–11. [Google Scholar] [CrossRef]
  38. Roehrich, G. Consumer innovativeness: Concepts and measurements. J. Bus. Res. 2004, 57, 671–677. [Google Scholar] [CrossRef]
  39. Hirunyawipada, T.; Paswan, A.K. Consumer innovativeness and perceived risk: Implications for high technology product adoption. J. Consum. Mark. 2006, 23, 182–198. [Google Scholar] [CrossRef]
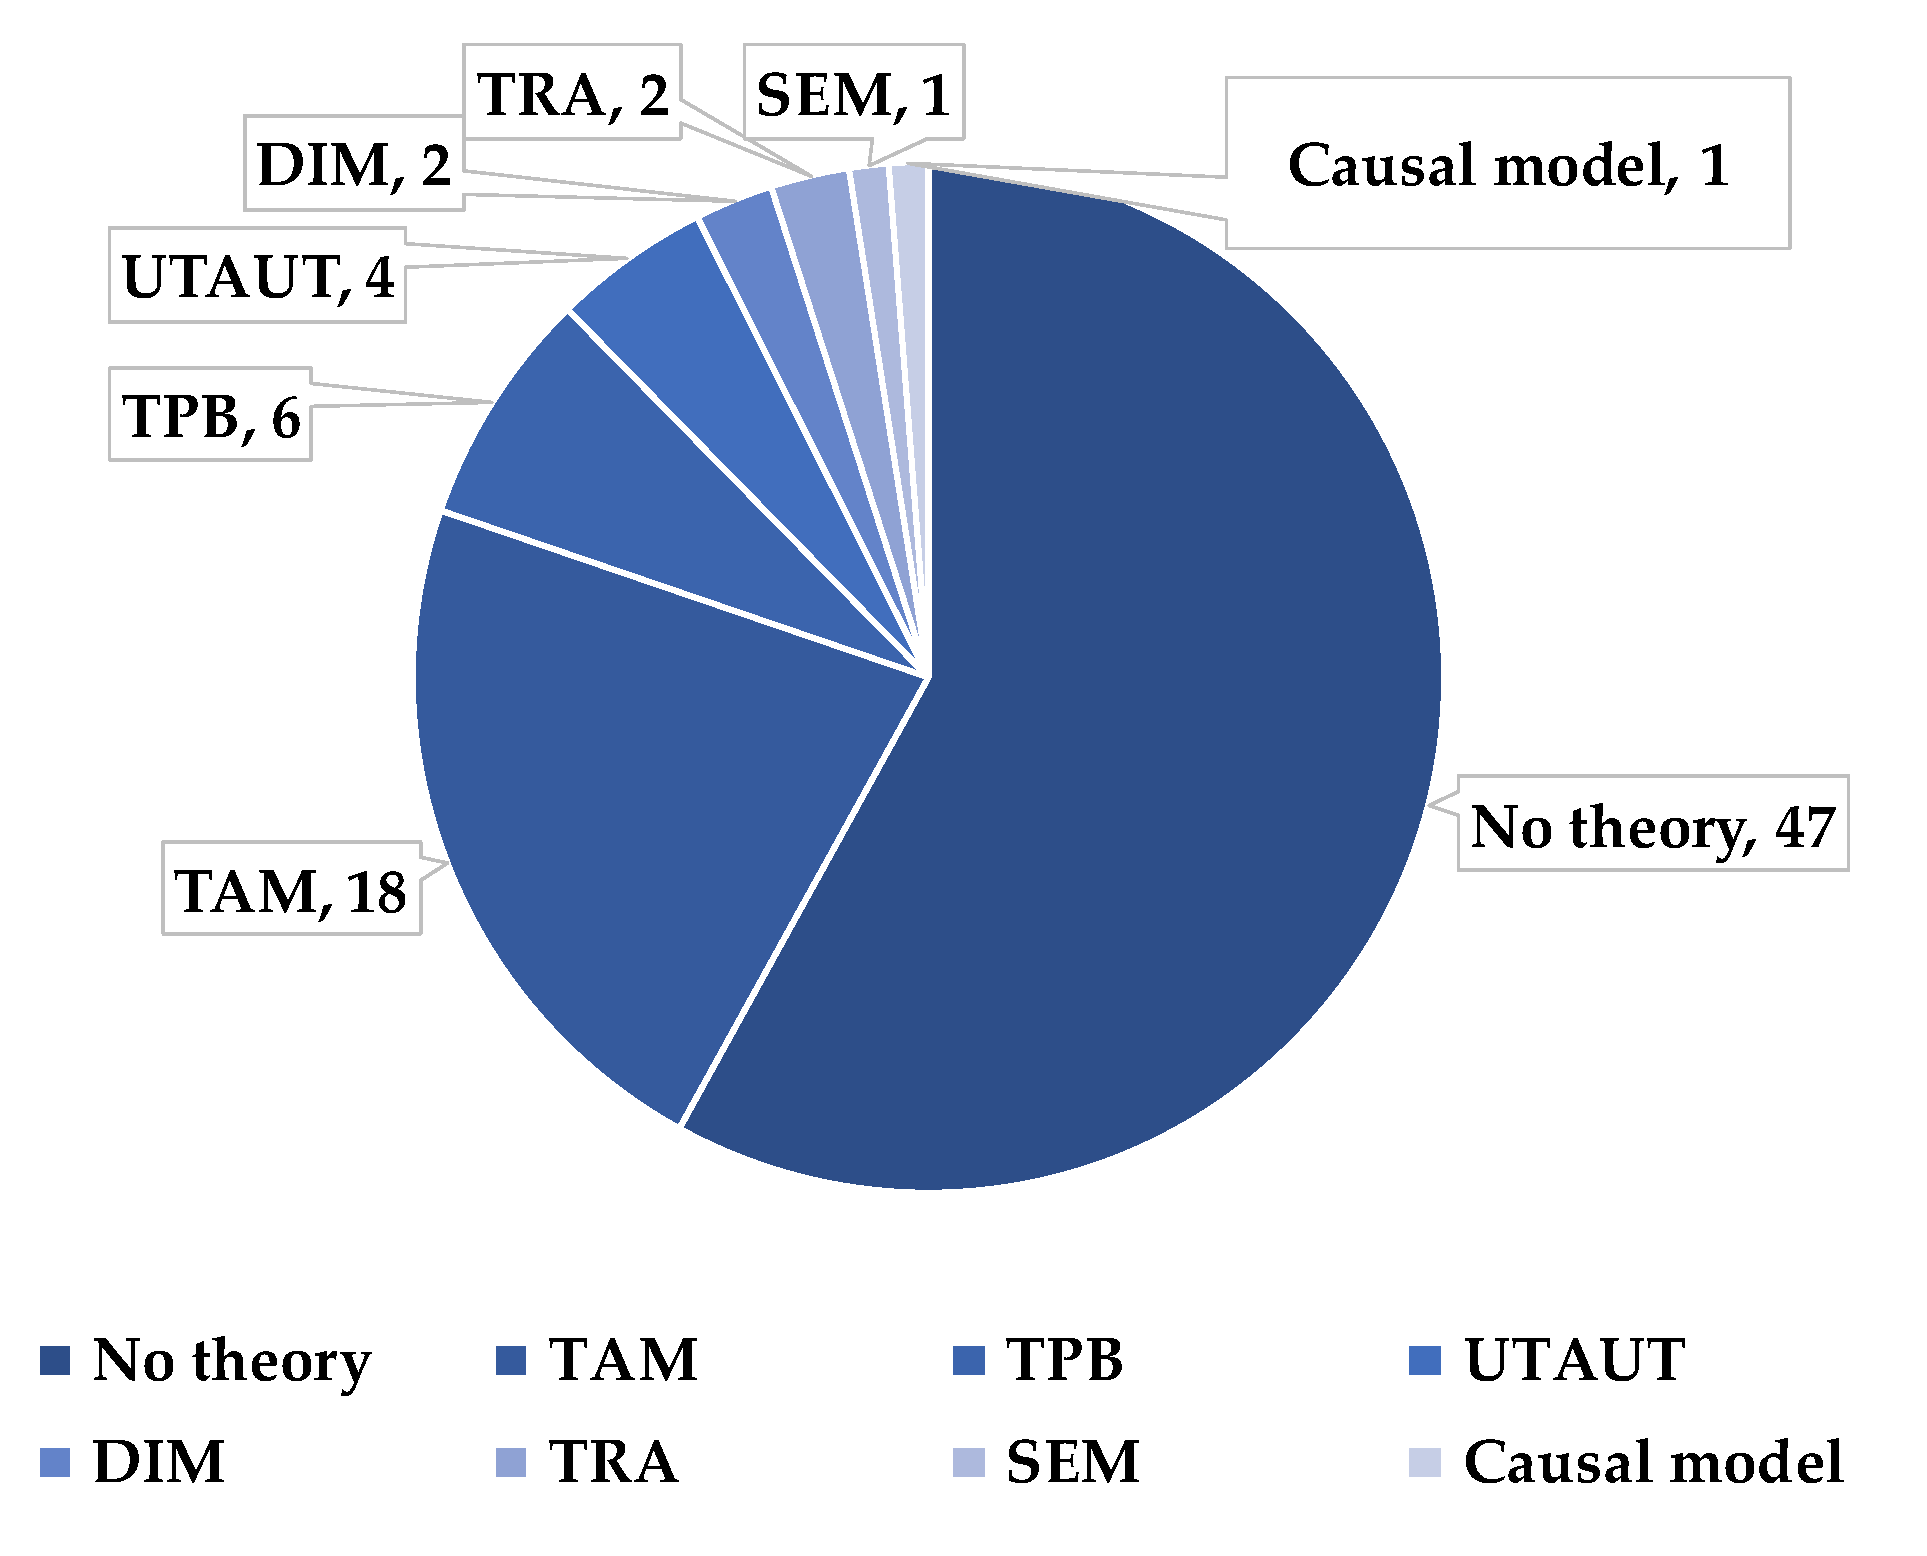
Figure 1. A summary of theoretical models in the literature on autonomous acceptance.
Information 12 00346 g001
Figure 2. A summary of analysis methods in the literature on autonomous acceptance.
Information 12 00346 g002
Figure 3. Expanded UTAUT theoretical framework.
Information 12 00346 g003
Figure 4. Independent autonomous vehicle acceptance model framework.
Information 12 00346 g004
Figure 5. Cooperative vehicle-highway autonomous vehicle acceptance model framework.
Information 12 00346 g005
Figure 6. The structural equation model analysis diagram of independent autonomous vehicles.
Information 12 00346 g006
Figure 7. The structural equation model analysis diagram of cooperative vehicle-highway autonomous vehicles.
Information 12 00346 g007
Figure 8. Standardized path coefficients in the structural equation model of independent autonomous vehicle acceptance.
Information 12 00346 g008
Figure 9. Standardized path coefficients in the structural equation model of cooperative vehicle-highway autonomous vehicle acceptance.
Information 12 00346 g009
Figure 10. Artificial neural network model A.
Information 12 00346 g010
Figure 11. Artificial neural network model B.
Information 12 00346 g011
Figure 12. The influencing factors’ relative importance of the two styles of autonomous driving.
Information 12 00346 g012
Table 1. UTAUT factor assumption.
Independent Autonomous VehiclesCooperative Vehicle-Highway Autonomous Vehicles
H1PE will significantly affect the willingness to accept independent autonomous vehicles.H2PE will significantly affect the willingness to accept cooperative vehicle-highway autonomous vehicles.
H3aEE will significantly affect the willingness to accept independent autonomous vehicles.H4aEE will significantly affect the willingness to accept cooperative vehicle-highway autonomous vehicles.
H3bEE will affect the willingness to accept independent autonomous vehicles through PE.H4bEE will affect the willingness to accept cooperative vehicle-highway autonomous vehicles through PE.
H3cEE will affect the willingness to accept independent autonomous vehicles through RE.H4cEE will affect the willingness to accept cooperative vehicle-highway autonomous vehicles through RE.
H5aSI will significantly affect the willingness to accept independent autonomous vehicles.H6aSI will significantly affect the willingness to accept cooperative vehicle-highway autonomous vehicles.
H5bSI will affect the willingness to accept independent autonomous vehicles through RE.H6bSI will affect the willingness to accept cooperative vehicle-highway autonomous vehicles through RE.
H7FC will significantly affect the willingness to accept independent autonomous vehicles.H8FC will significantly affect the willingness to accept cooperative vehicle-highway autonomous vehicles.
H9aCI will significantly affect the willingness to accept independent autonomous vehicles.H10aCI will significantly affect the willingness to accept cooperative vehicle-highway autonomous vehicles.
H9bCI will affect the willingness to accept independent autonomous vehicles through SI.H10bCI will affect the willingness to accept cooperative vehicle-highway autonomous vehicles through SI.
H9cCI will affect the willingness to accept independent autonomous vehicles through RE.H10cCI will affect the willingness to accept cooperative vehicle-highway autonomous vehicles through RE.
H11RE will significantly affect the willingness to accept independent autonomous vehicles.H12RE will significantly affect the willingness to accept cooperative vehicle-highway autonomous vehicles.
Table 2. Demographic profile of the respondents.
Division
N of Items
FrequencyPerecent (%)
GenderMen44757.5%
Women33142.5%
Age18–2531740.7%
26–3523129.7%
36–4515219.6%
46–55557.0%
Older than 55233.0%
Monthly incomeBelow CNY 200023630.3%
CNY 2001–500017923.0%
CNY 5001–800019625.2%
CNY 8000–15,00011915.3%
More than CNY 15,000486.2%
Education levelPrimary (elementary/middle school)14318.4%
Secondary (high school)749.5%
Junior college15519.9%
University (undergraduate)32742.0%
Postgraduate7910.1%
Driver’s licenseYes50464.8%
No27435.2%
Number of cars owned014819.0%
146559.8%
214218.3%
More than 3233.0%
Table 3. Reliability analysis of two-sample variables.
Latent VariablesN of ItemsαC.R.
PE3/30.773; 0.7640.782; 0.788
EE4/40.847; 0.8030.831; 0.793
SI3/30.770; 0.7780.822; 0.811
FC3/30.793; 0.8250.766; 0.787
BI3/30.788; 0.7910.791; 0.793
RE3/30.843; 0.8790.828; 0.819
CI30.8280.835
Table 4. Variable validity analysis.
Latent VariablesObserved VariablesNormalization Factor Loading CoefficientAVE
PEPE_S1; PE_C10.71; 0.770.773; 0.764
PE_S2; PE_C20.68; 0.71
PE_S3; PE_C30.79; 0.69
EEEE_S1; EE_C10.78; 0.770.847; 0.803
EE_S2; EE_C20.78; 0.68
EE_S4; EE_C40.74; 0.62
EE_S5; EE_C50.72; 0.78
SISI_S1; SI_C10.64; 0.720.770; 0.778
SI_S2; SI_C20.78; 0.75
SI_S3; SI_C30.79; 0.74
FCFC_S1; FC_C10.81; 0.830.793; 0.825
FC_S2; FC_C20.77; 0.73
FC_S3; FC_C30.68; 0.79
BIBI_S1; FC_C10.75; 0.790.788; 0.791
BI_S2; FC_C20.78; 0.82
BI_S3; FC_C30.75; 0.83
RERE_S1; RE_C10.78; 0.740.843; 0.879
RE_S2; RE_C20.78; 0.81
RE_S3; RE_C30.71; 0.74
CICI_10.810.837
CI_20.82
CI_30.78
Table 5. Fitting parameters of the structural equation model for the acceptance of independent autonomous vehicles.
Index Nameχ2/dfRMSEACFIGFINFIIFI
Test Critical Value<3, Good>0.05, Excellent>0.9>0.9>0.9>0.9
<5, Accepted>0.08, Good
Model Parameter Value3.3740.0550.9380.9220.9140.938
Table 6. Fitting parameters of the structural equation model for the acceptance of cooperative vehicle-highway autonomous vehicles.
Index Nameχ2/dfRMSEACFIGFINFIIFI
Test Critical Value<3, Good>0.05, Excellent>0.9>0.9>0.9>0.9
<5, Accepted>0.08, Good
Model Parameter Value3.5380.0560.9340.9280.9100.935
Table 7. Regression analysis weight index coefficient.
Path Standardized Regression Coefficient (β)Standard Error of Estimate (S.E.)Critical Ratio (C.R.)Significance (p)Null HypothesisDoes It Support
BIIPEI0.1140.0492.5840.01 *H1Yes
BICPEC0.0850.052.1210.034 *H2Yes
BIIEEI0.2510.0535.388***H3aYes
PEIEEI0.3920.058.145***H3bYes
REIEEI0.2510.0455.746***H3cYes
BICEEC0.2960.0556.211***H4aYes
PECEEC0.3950.057.456***H4bYes
RECEEC0.2700.0455.912***H4cYes
BIISII0.3310.0516.951***H5aYes
REISII0.3260.0476.787***H5bYes
BICSIC0.2790.055.948***H6aYes
RECSIC0.3300.0466.884***H6bYes
BIIFCI0.2030.0485.112***H7Yes
BICFCC0.1940.0375.034***H8Yes
BIICII0.1380.0353.648***H9aYes
SIICII0.3030.0367.271***H9bYes
REICII0.0680.0341.6610.097H9cNo
BICCII0.1000.0362.6730.008 **H10aYes
SICCIC0.2850.0376.766***H10bYes
RECCIC0.0840.0352.1250.034 *H10cYes
BIIREI0.1040.052.3060.021 *H11Yes
BICREC0.0970.0512.1460.032 *H12Yes
Significance level: non-significant p > 0.05, *** p < 0.001, ** p < 0.01, and * p < 0.05.
Table 8. Root-mean-square error of the ANN.
ANNANN AANN B
TrainingTestingTrainingTesting
ANN10.11810.11220.11920.1201
ANN20.11460.10730.11430.1490
ANN30.11320.12290.11230.1121
ANN40.11560.10140.12530.1242
ANN50.12650.12920.11150.1276
ANN60.12650.12010.11830.1094
ANN70.11220.12760.12850.1212
ANN80.11320.11980.11720.1142
ANN90.13200.14900.11640.1119
ANN100.12070.10940.12640.1293
Mean0.11930.11990.11180.1198
Standard Deviation0.00690.01360.00560.0311
Table 9. ANN sensitivity analysis of the acceptance of independent autonomous vehicles.
ANNANN A Relative Importance of Neurons
PEIEEISIIREIFCICII
ANN10.0730.1780.2740.1910.1760.107
ANN20.0800.2670.1780.2120.1310.132
ANN30.1700.1080.1750.2300.2370.079
ANN40.1770.2360.2500.1360.0850.117
ANN50.1190.1940.2340.1780.1430.132
ANN60.0890.1520.2850.1770.1540.142
ANN70.1130.2190.2890.1230.1440.111
ANN80.2620.2320.1490.0800.2560.020
ANN90.0680.2530.2790.1060.1550.138
ANN100.0520.1800.2270.1770.2050.159
Mean0.1200.2020.2340.1610.1690.114
Importance of Normalization (%)51.386.310068.871.948.7
Table 10. ANN sensitivity analysis of the acceptance of cooperative vehicle-highway autonomous vehicles.
ANNANN B Relative Importance of Neurons
PECEECSICRECFCCCIC
ANN10.2330.0570.1970.2060.1070.200
ANN20.0500.2430.2690.1520.1750.111
ANN30.0930.2550.1600.1490.1900.152
ANN40.1080.2280.2520.1420.1810.090
ANN50.1180.2480.2310.1410.1480.114
ANN60.1030.2770.2300.1540.1430.094
ANN70.0710.3120.2660.1180.1330.099
ANN80.1860.2400.1980.01350.1310.110
ANN90.1000.2490.2160.1620.1490.124
ANN100.1020.2460.2310.1380.1470.136
Mean0.1160.2360.2250.1500.1500.123
Importance of Normalization (%)49.210095.363.663.652.1
Publisher’s Note: MDPI stays neutral with regard to jurisdictional claims in published maps and institutional affiliations.