
Environment Monitoring System of Dairy Cattle Farming Based on Multi Parameter Fusion


Abstract
:1. Introduction
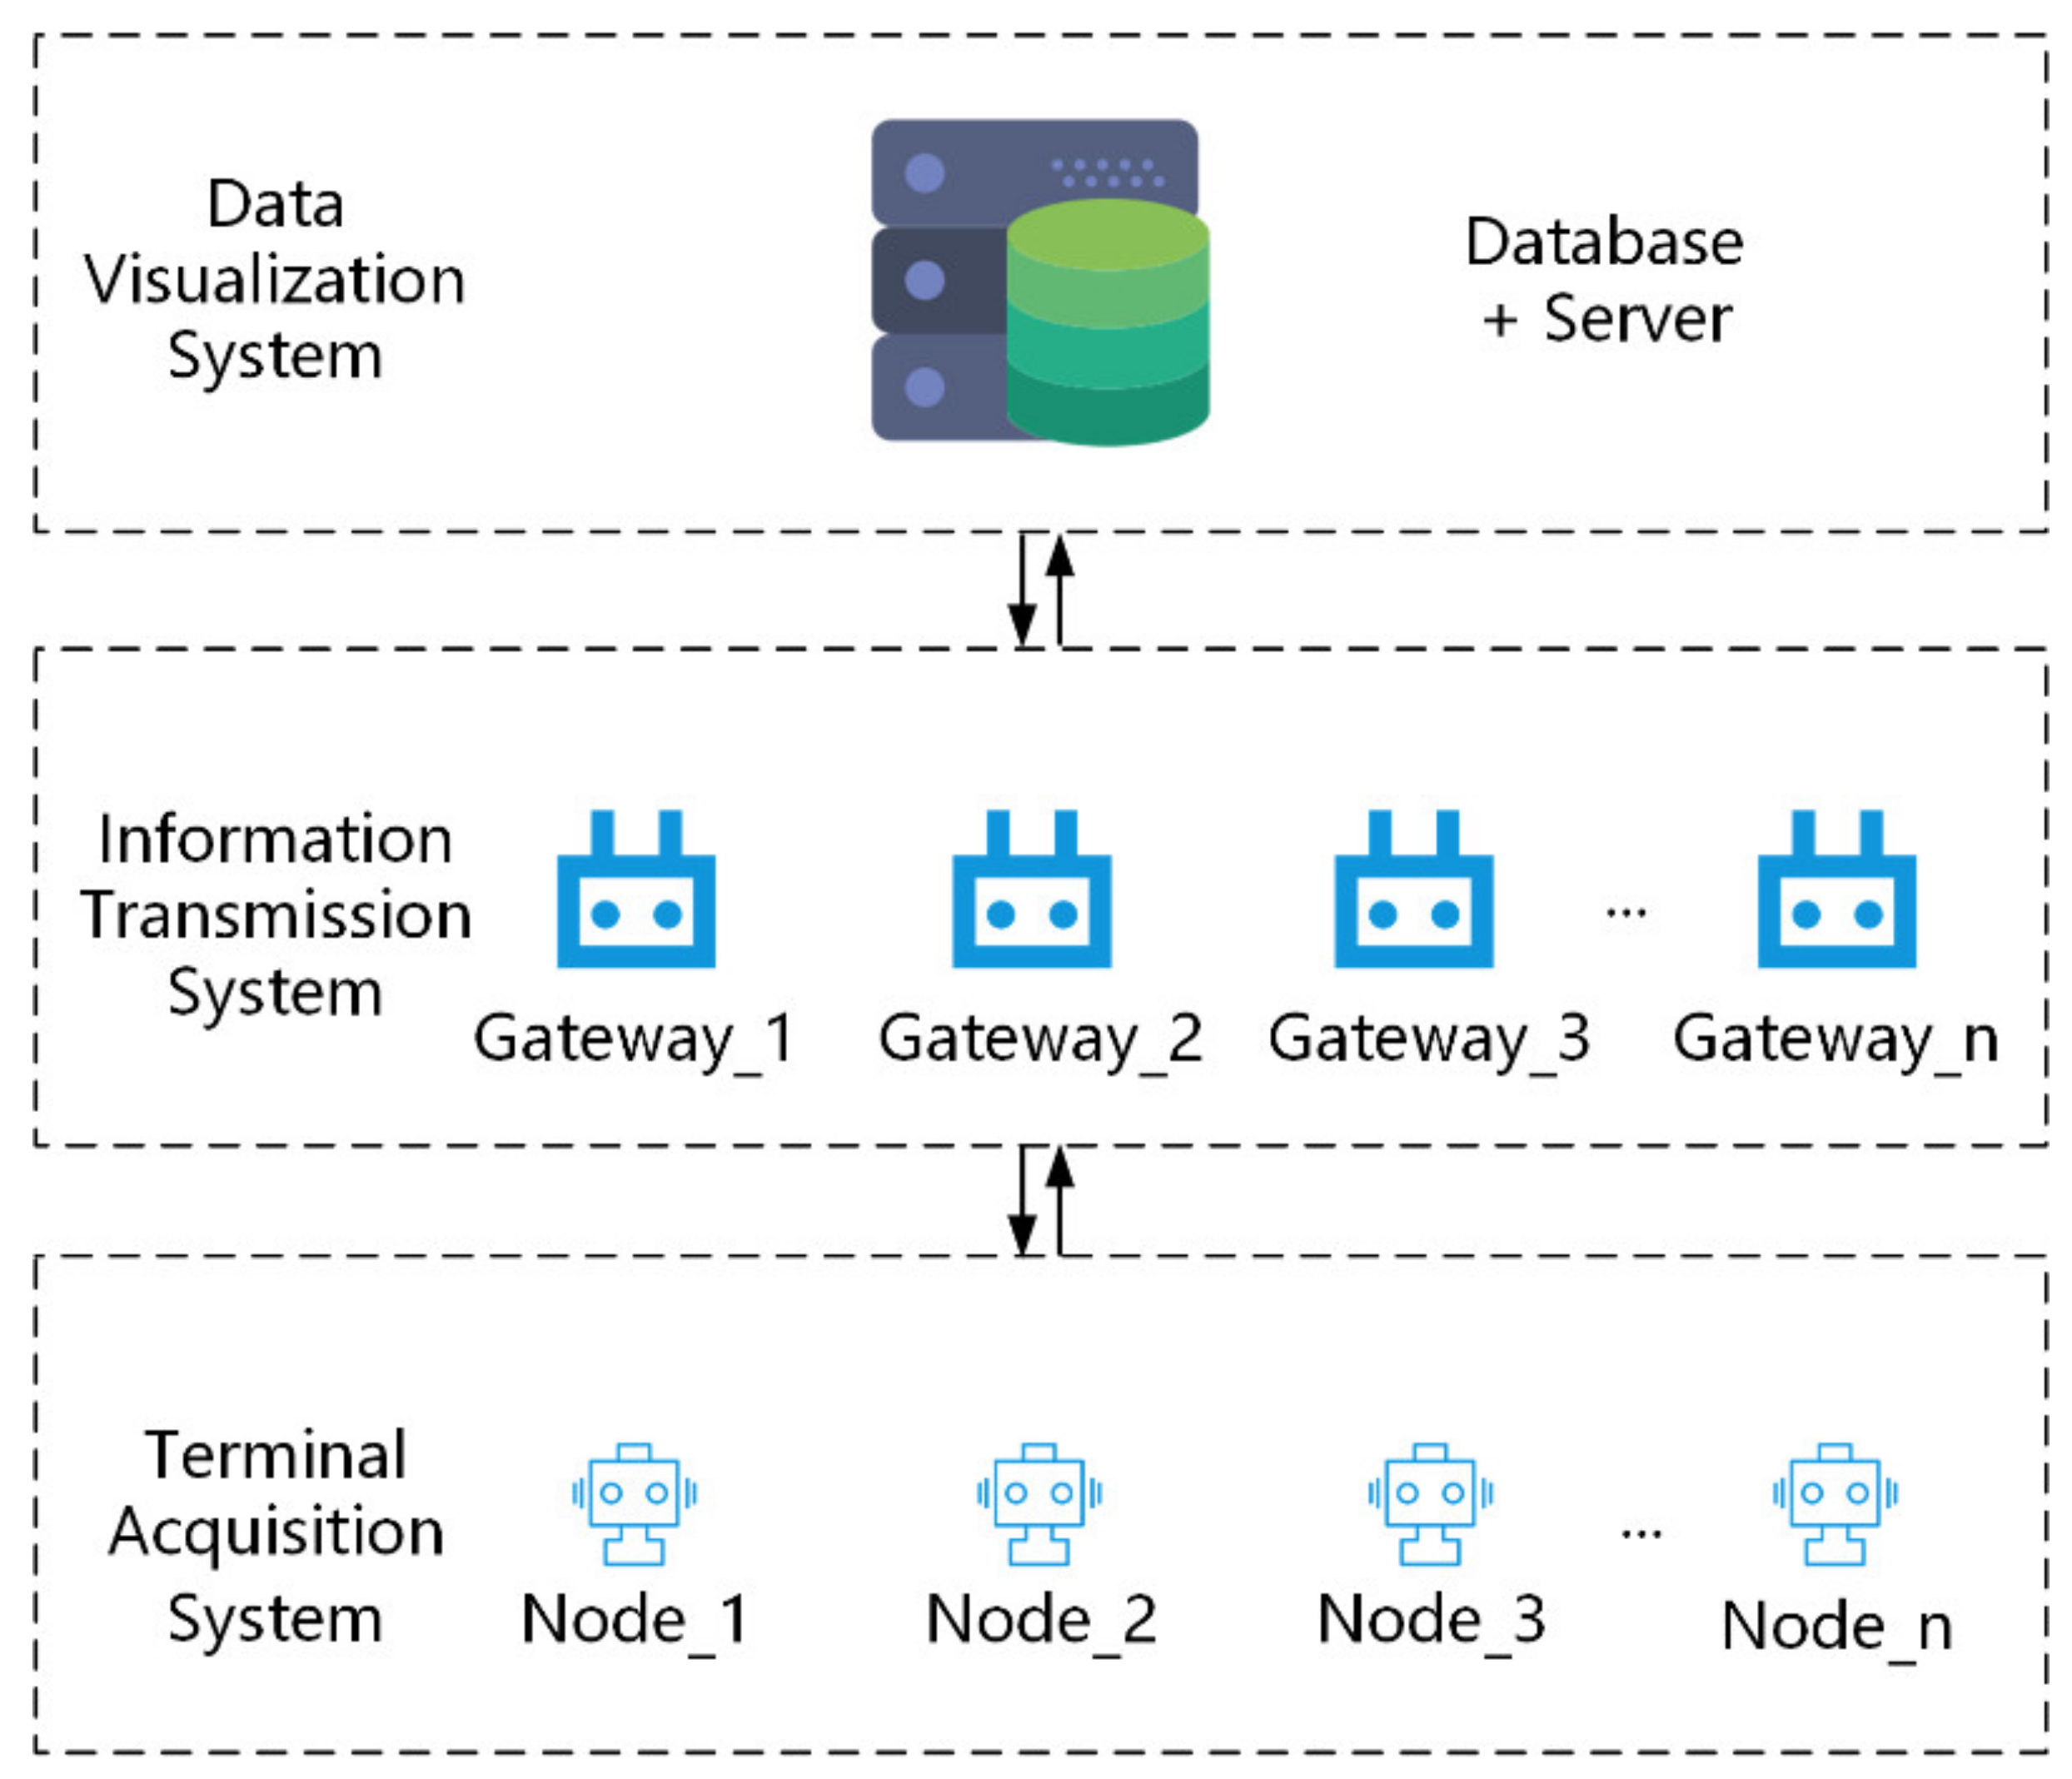
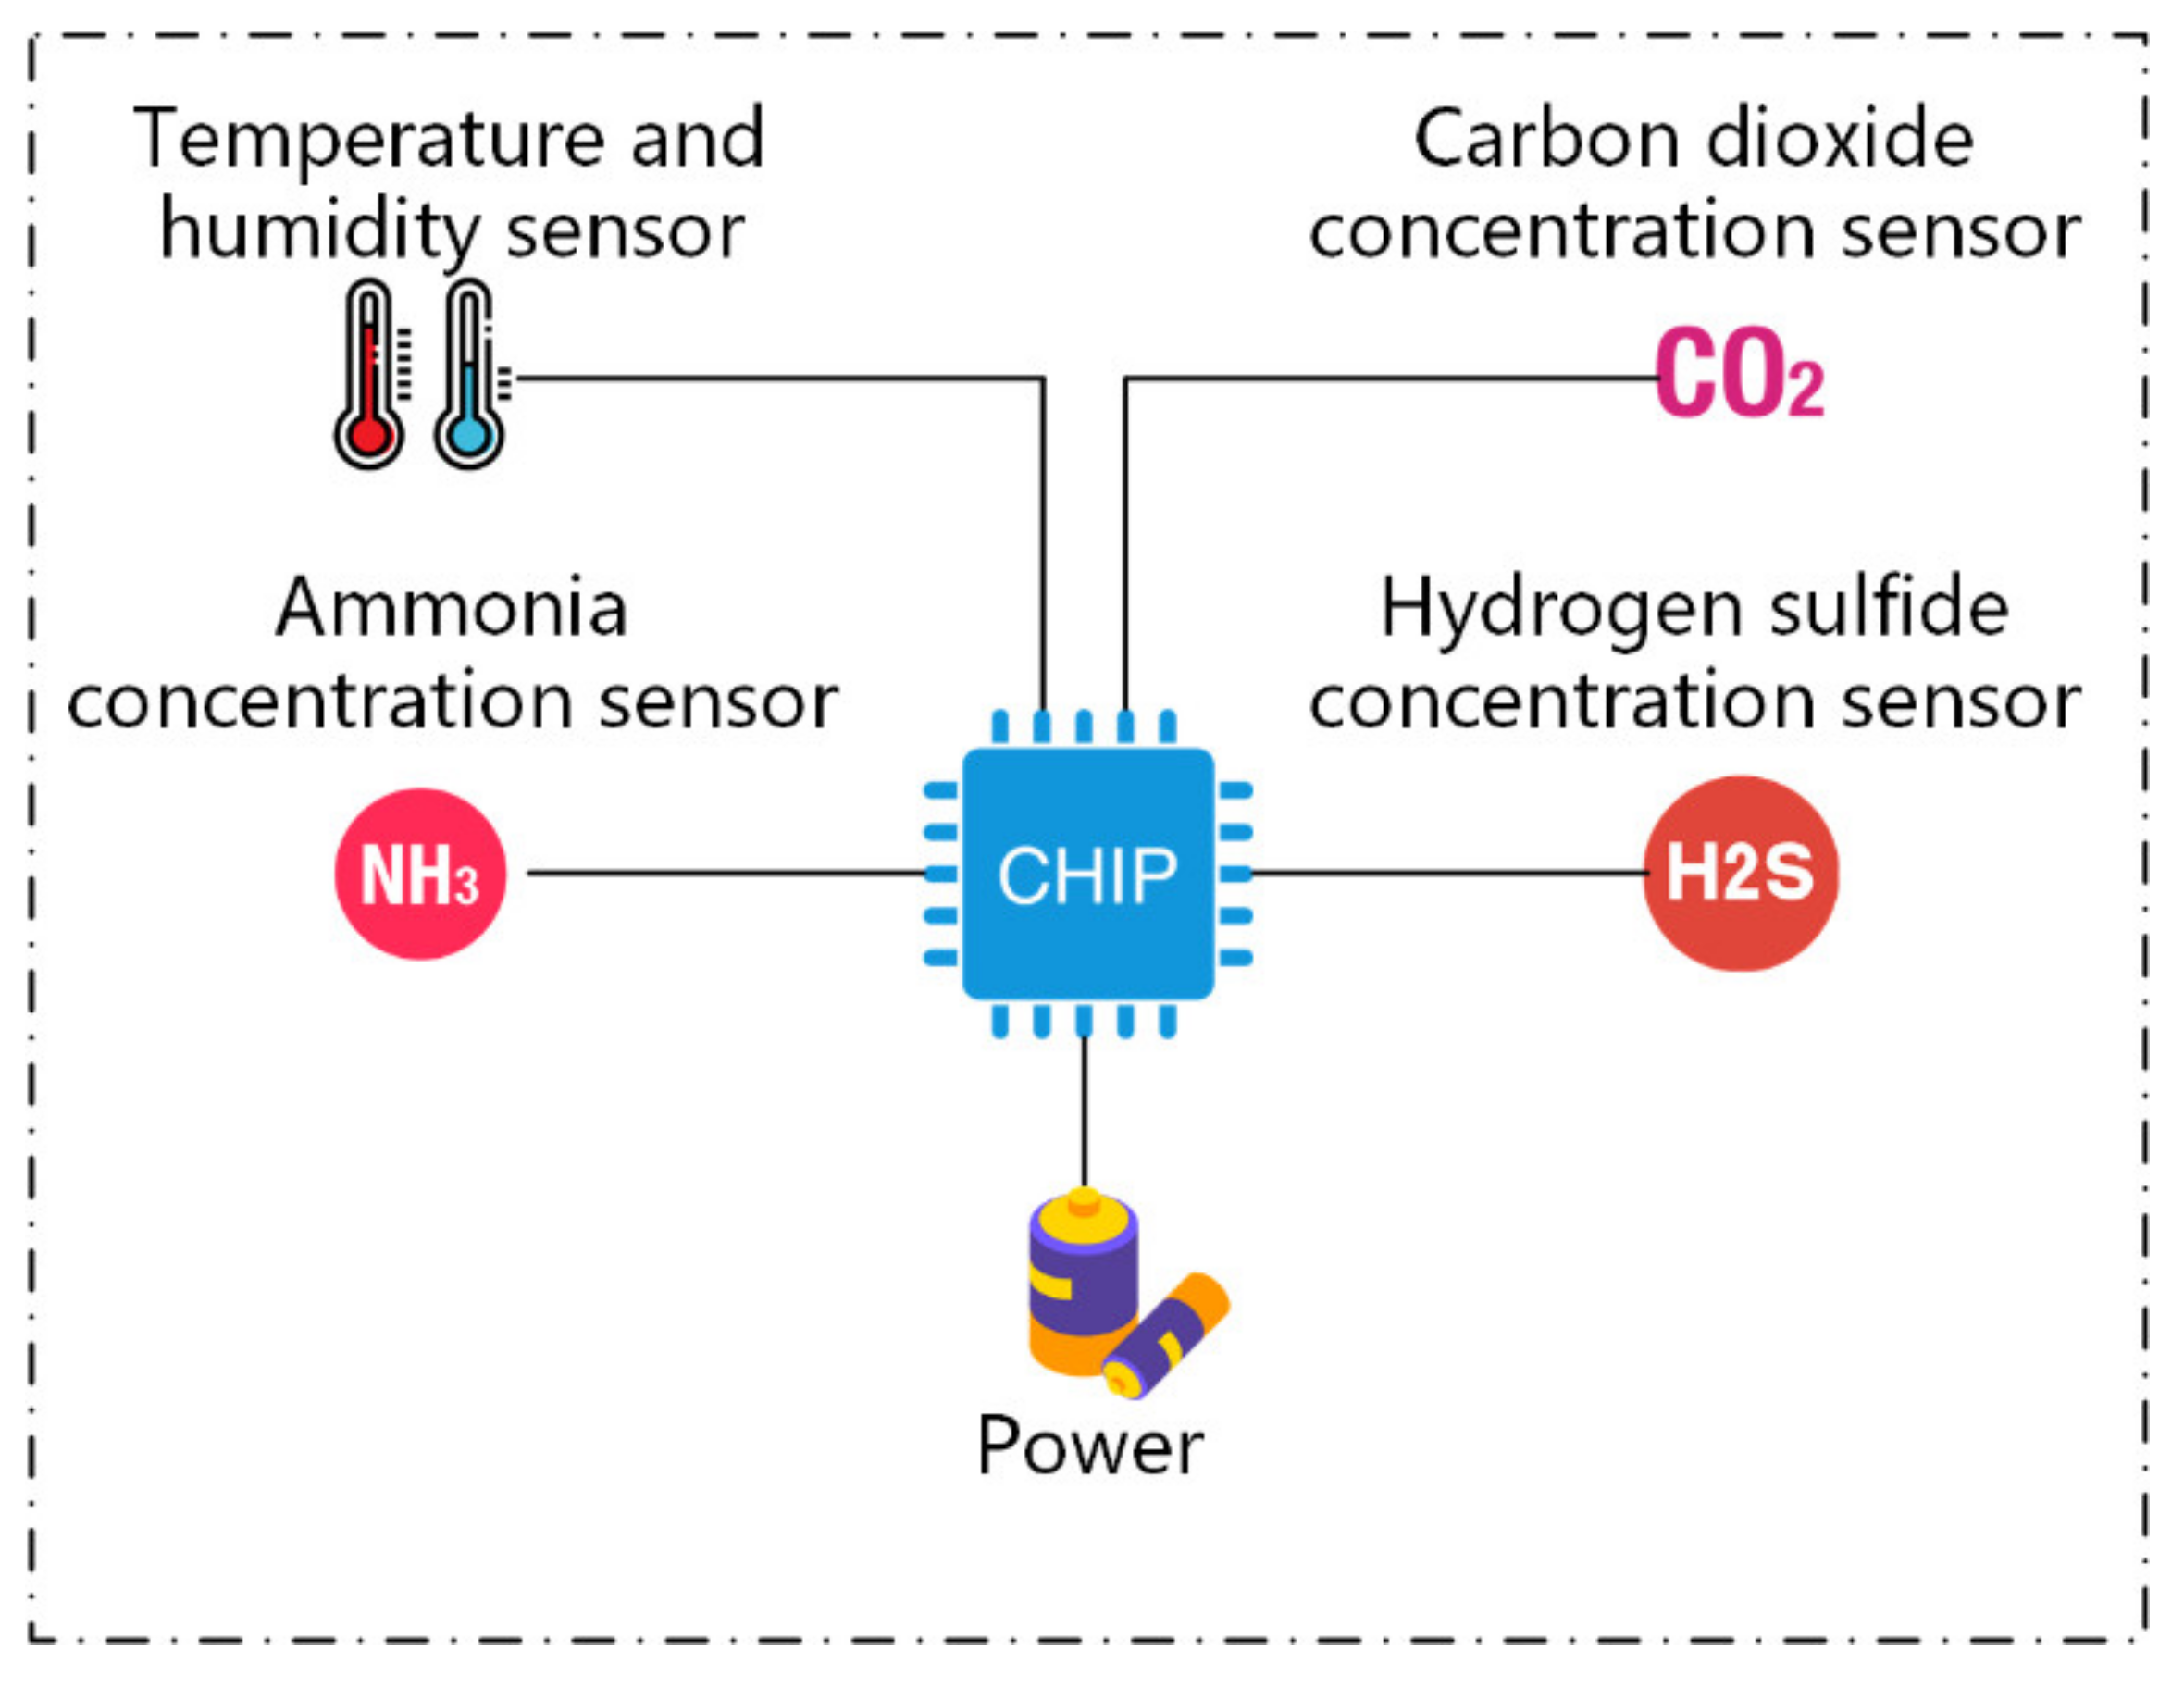
- A multi-parameter collection node and a Bluetooth gateway based on Bluetooth and Wi-Fi have been developed that can accurately collect the environmental parameters of dairy cattle farming.
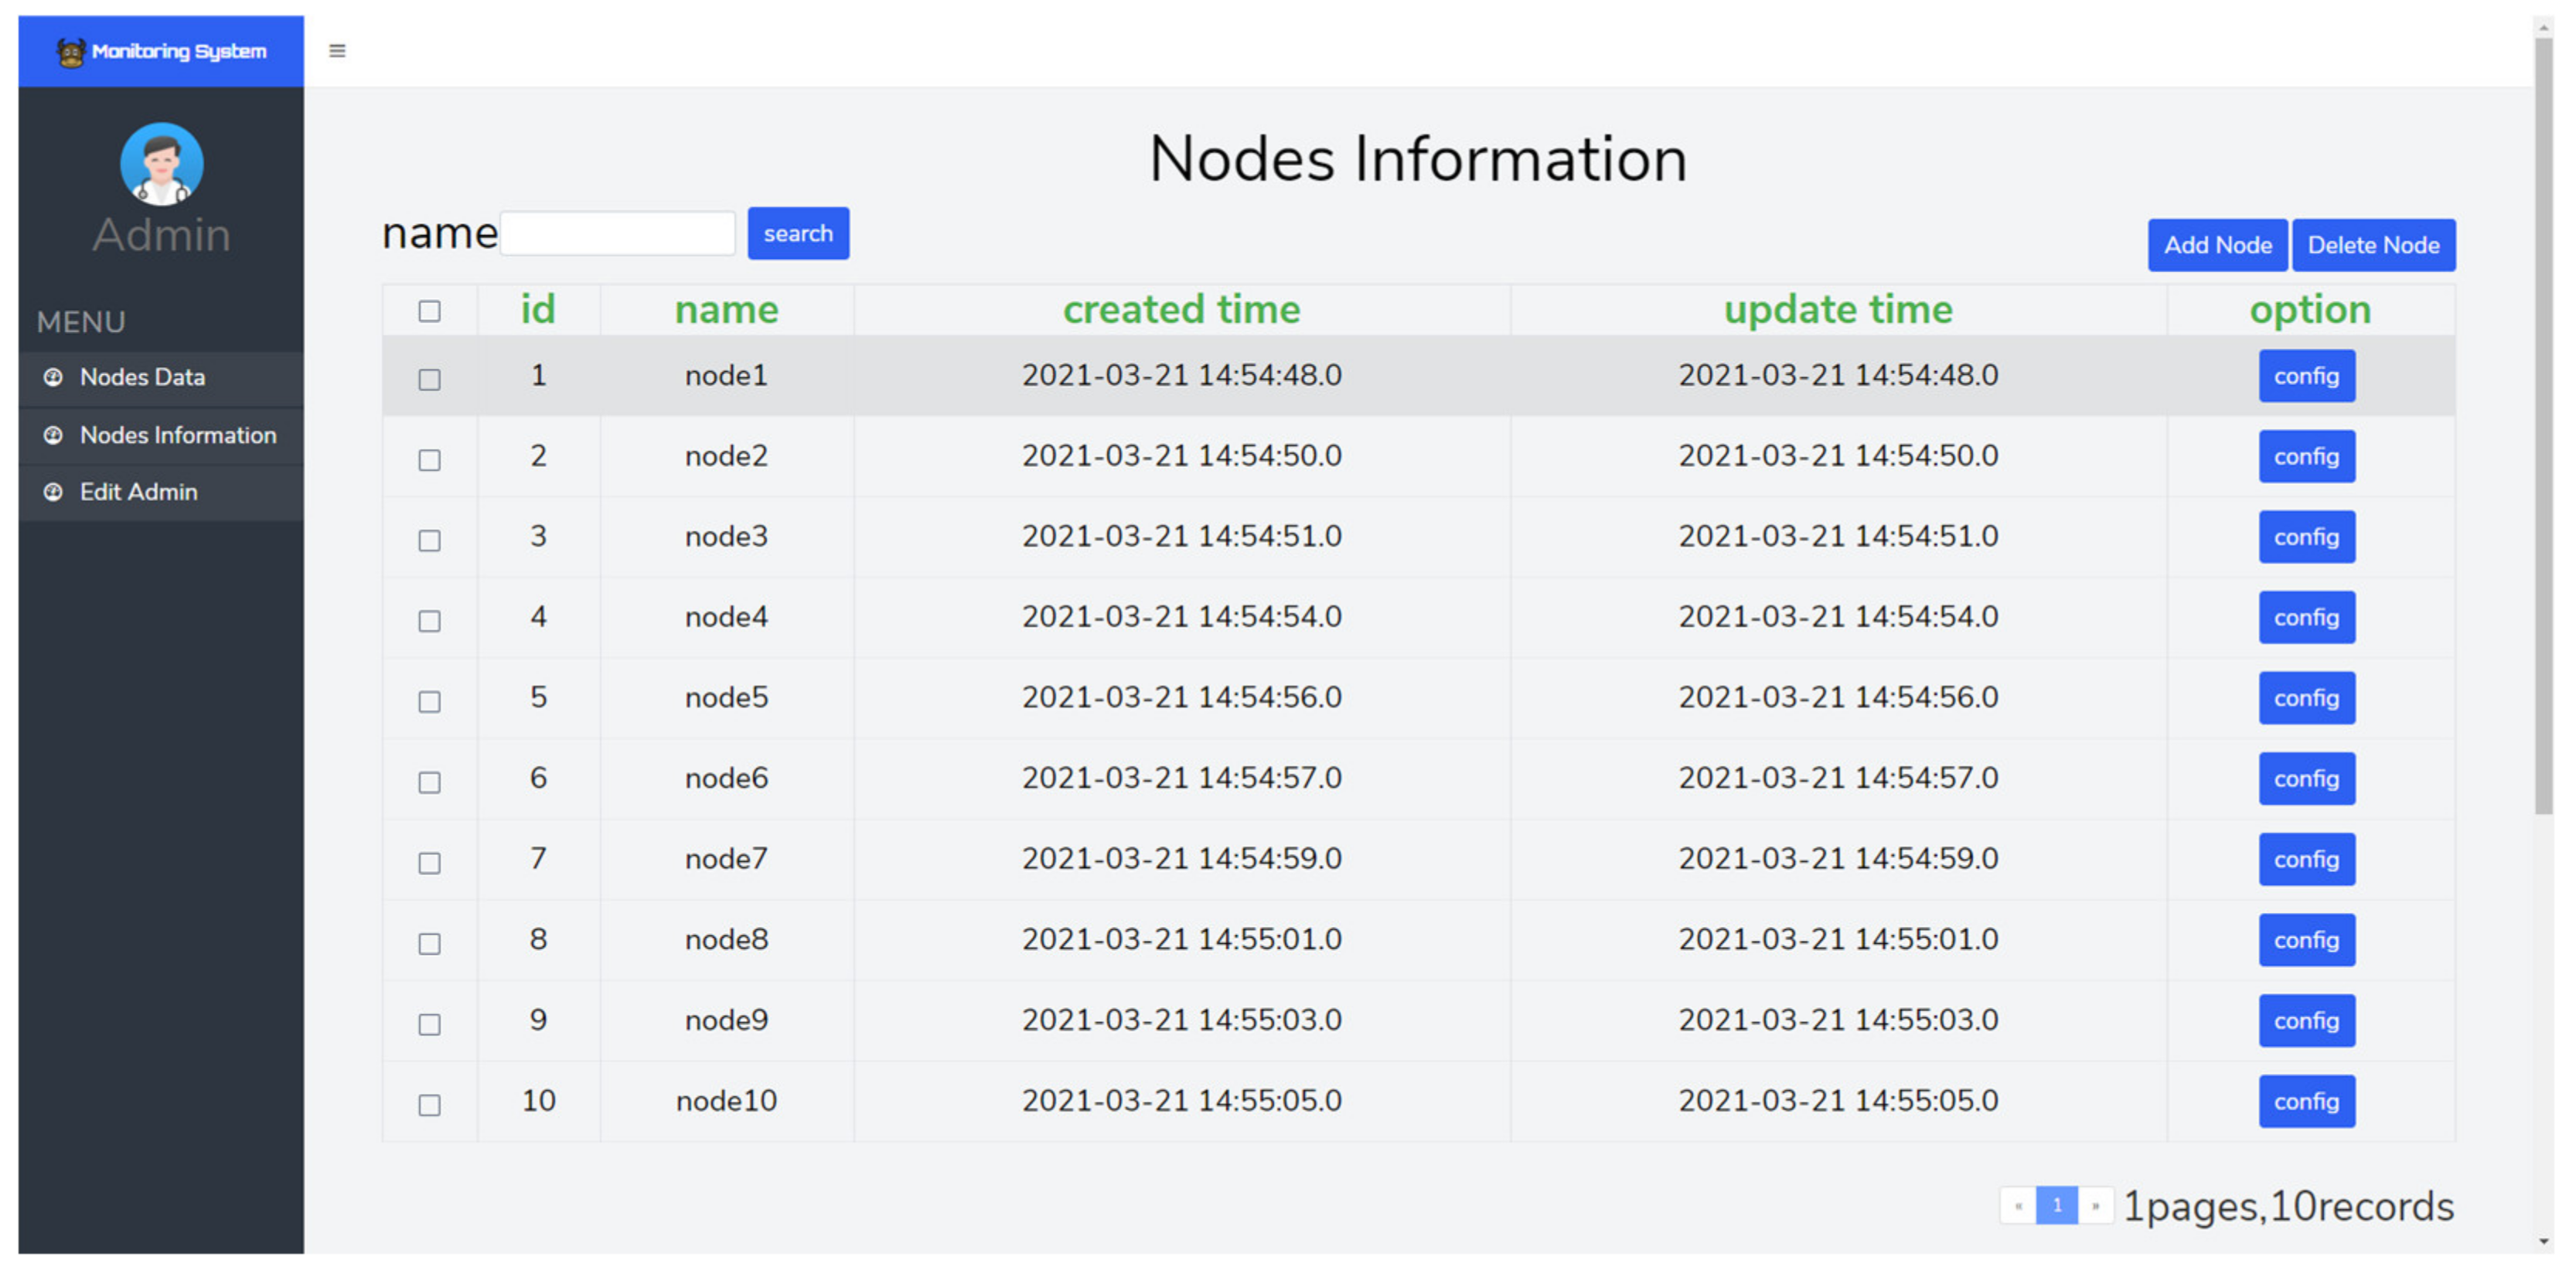
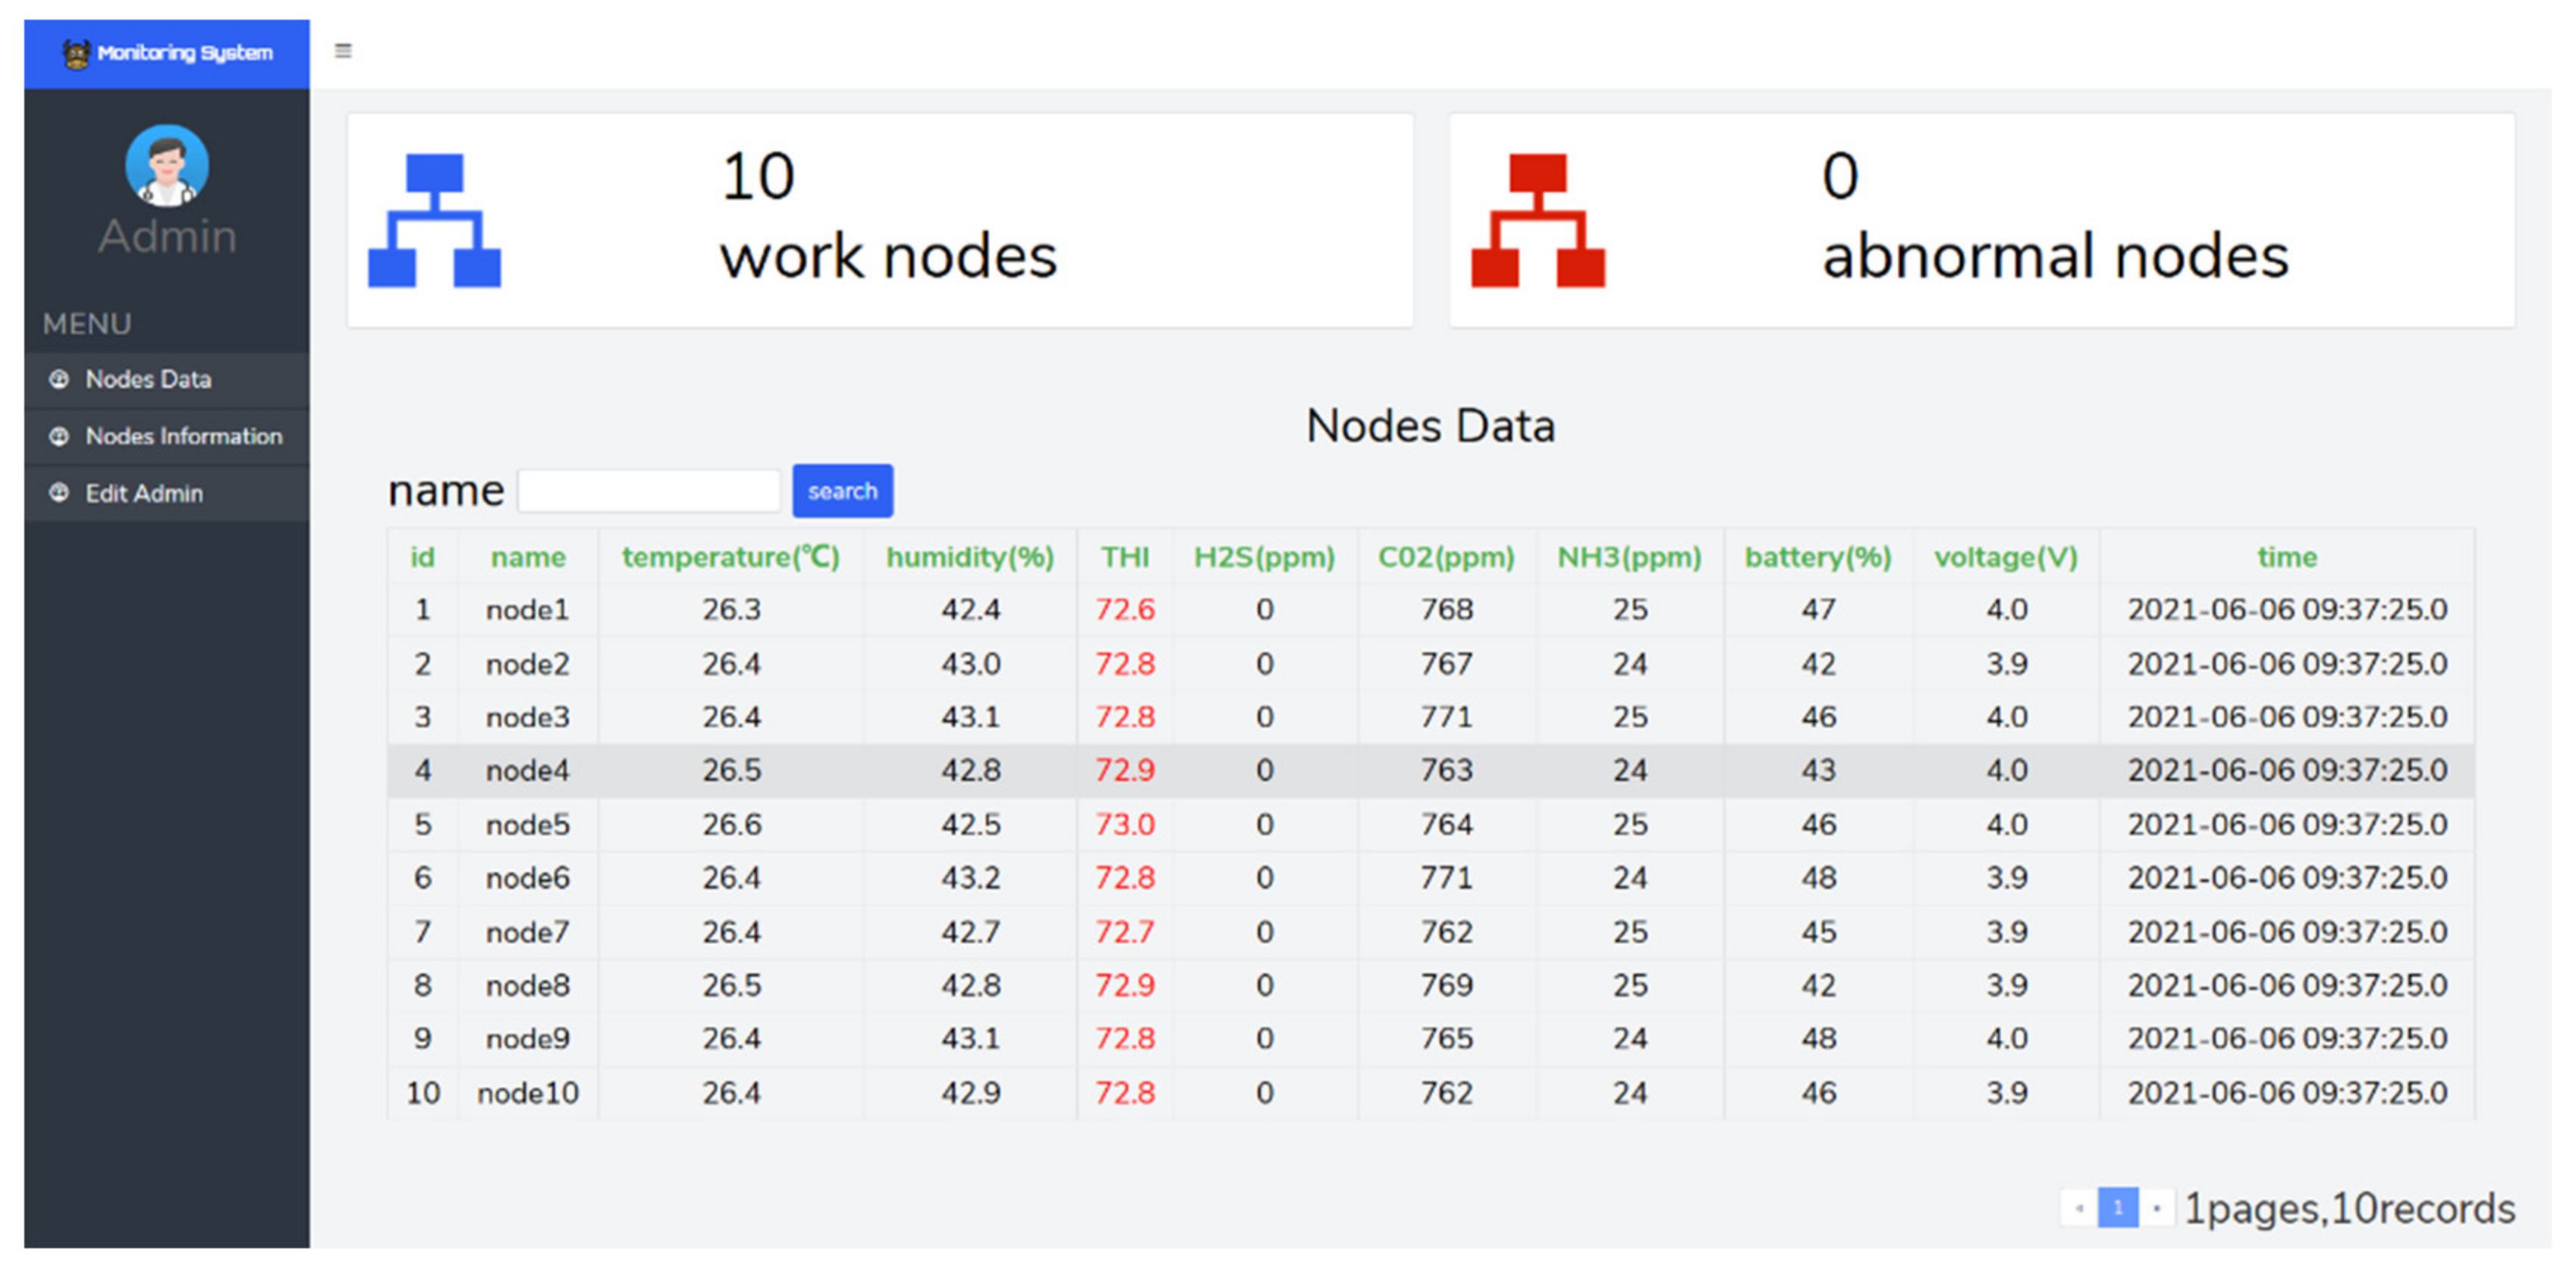
- A data visualization system based on the B/S architecture has been developed. Users in the local area network can monitor the environment through the browser of any smart device (mobile phone, tablet, laptop, etc.) without installing specific applications, which reduces the system’s deployment cost.
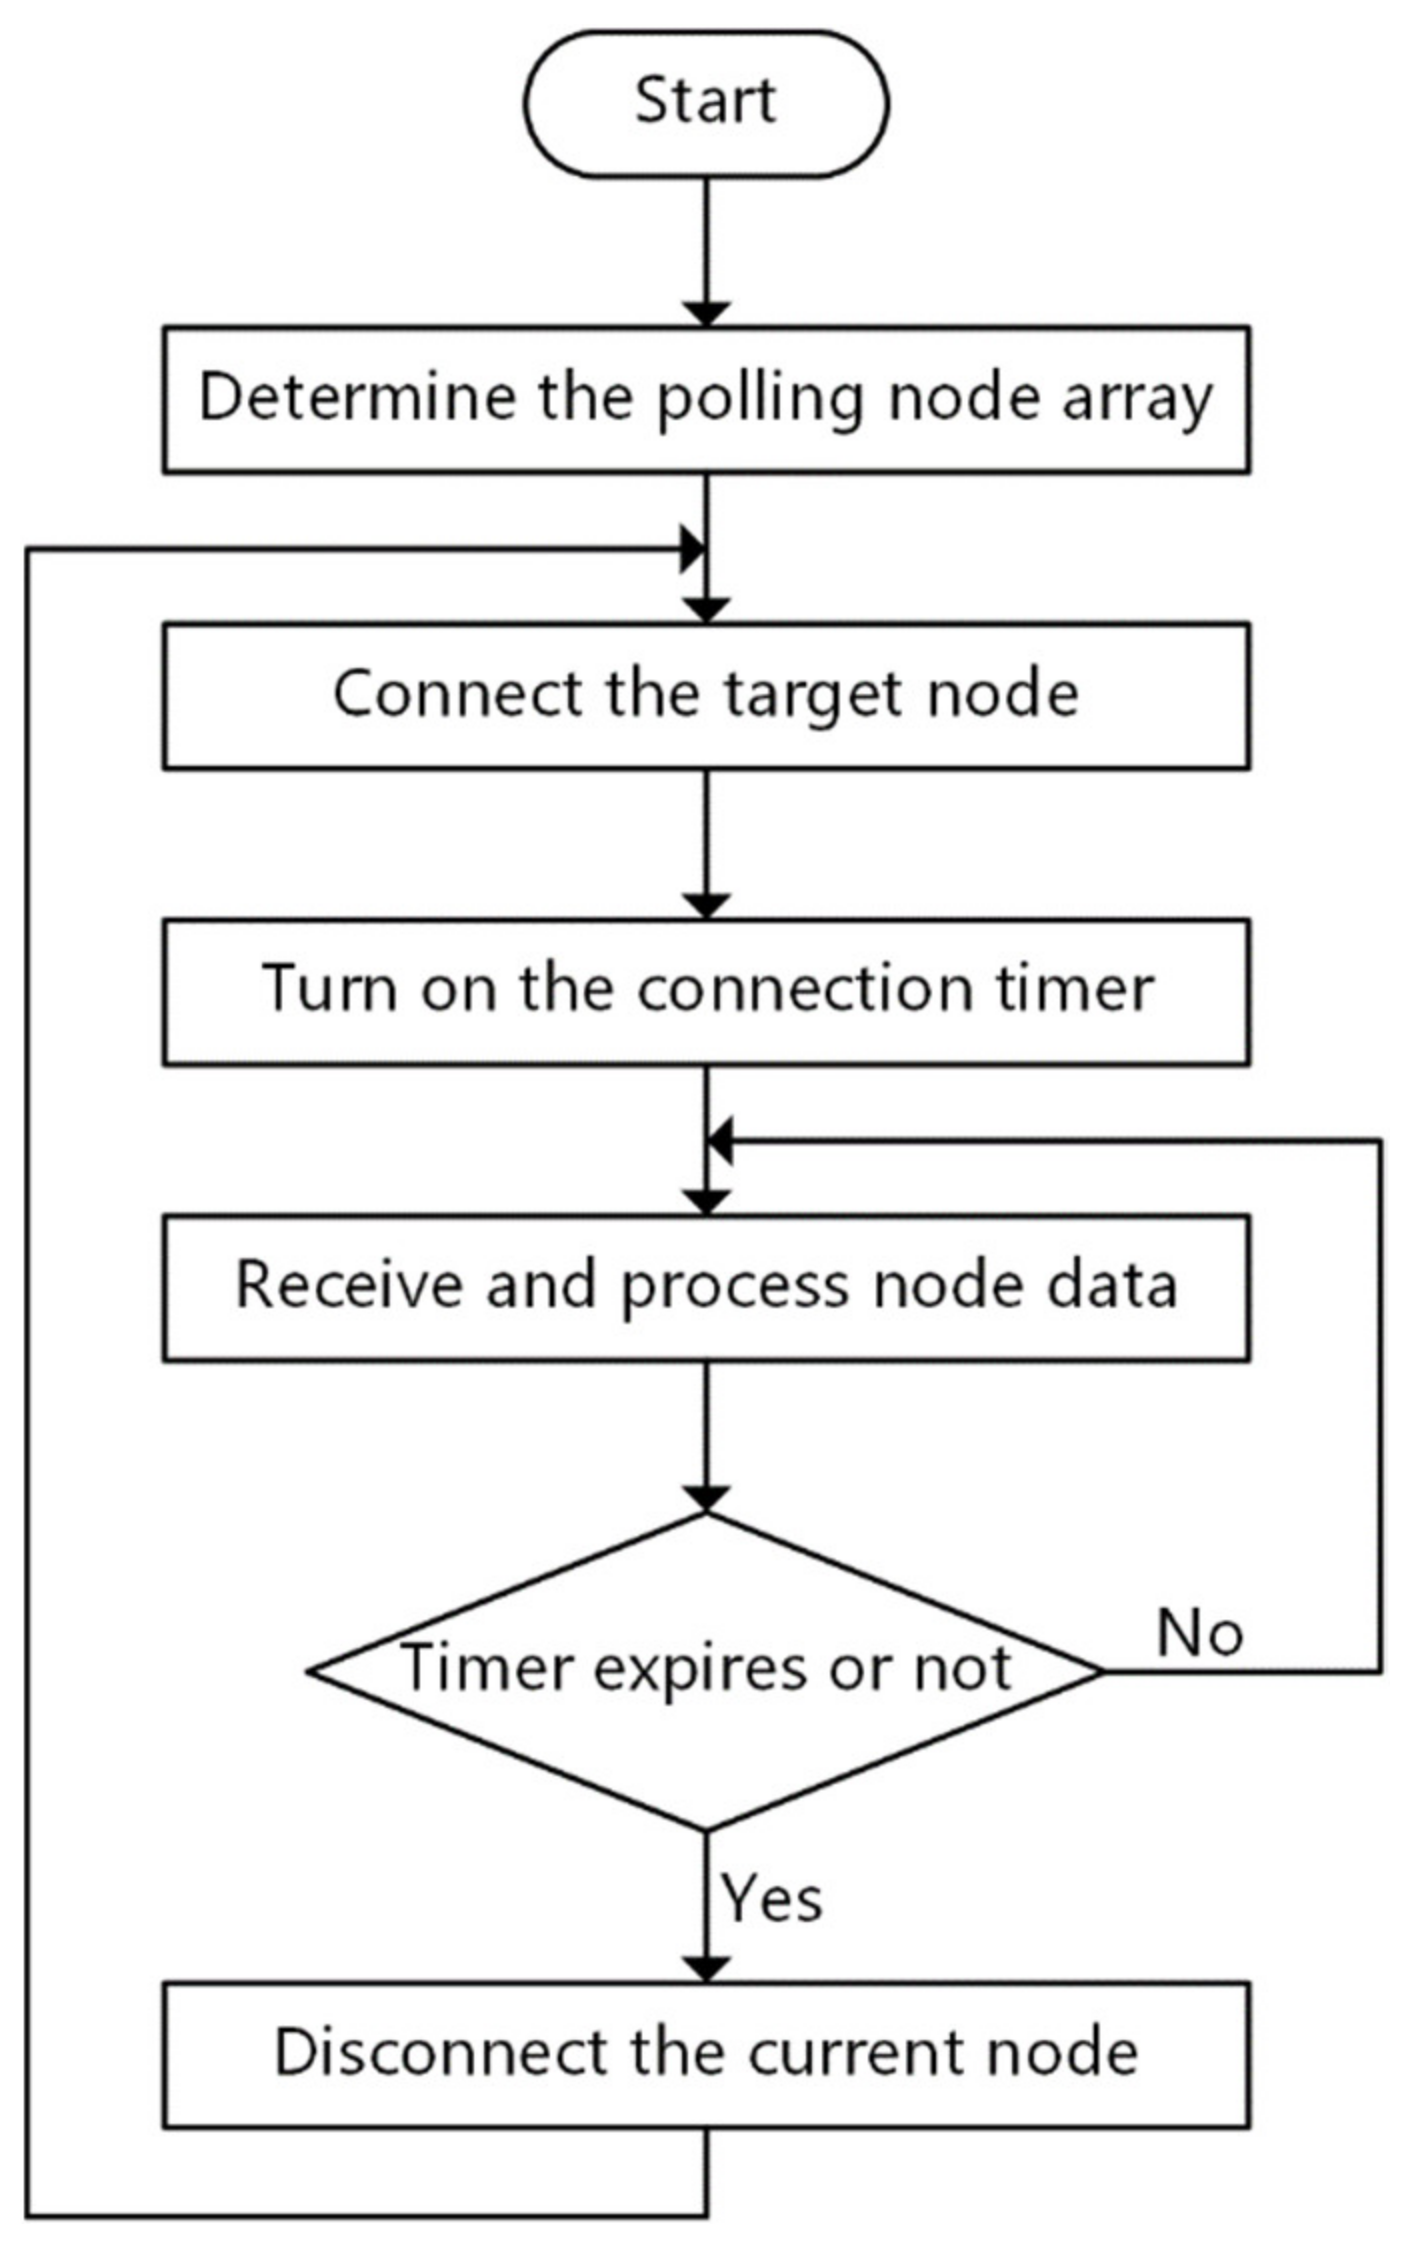
- The data visualization system is designed with a time-sharing connection mechanism to control the gateway to actively disconnect the acquisition node, which enhances the stability of the Bluetooth connection under the star structure. The introduction of an autonomous control mechanism for the sampling period effectively reduces the energy consumption of the acquisition node.
2. Materials and Methods
2.1. Acquisition Node
2.1.1. Multi Sensor Module
2.1.2. Power Management Module
2.1.3. Data Storage Function
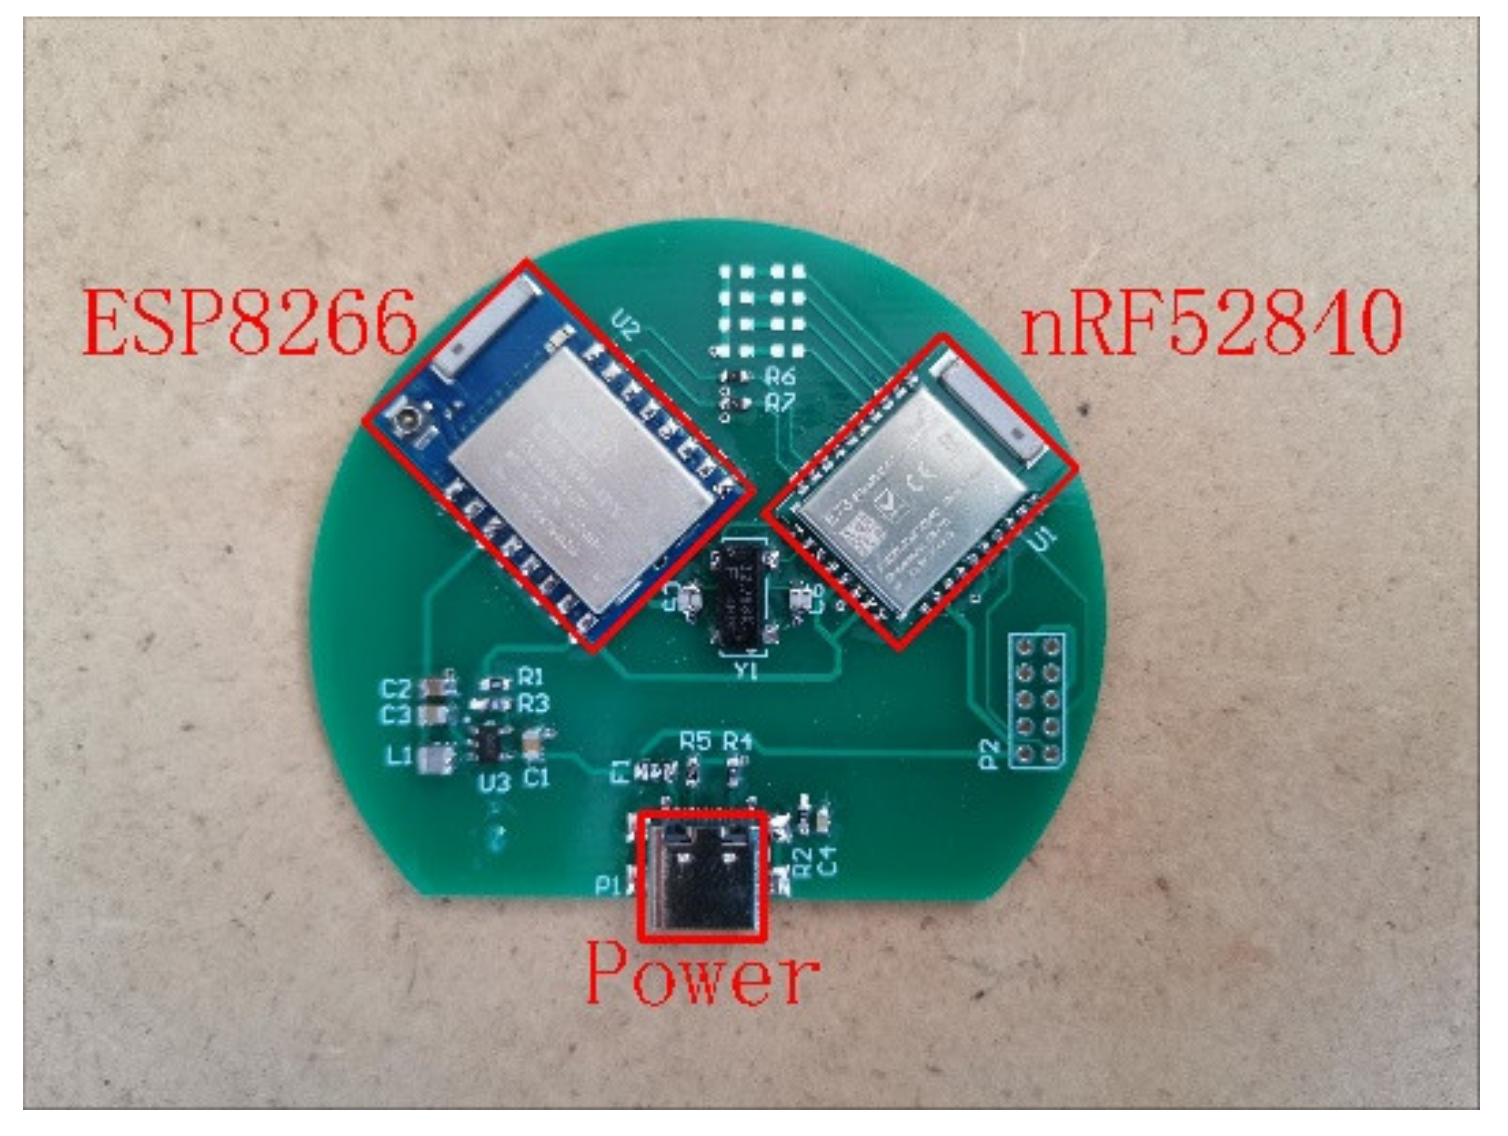
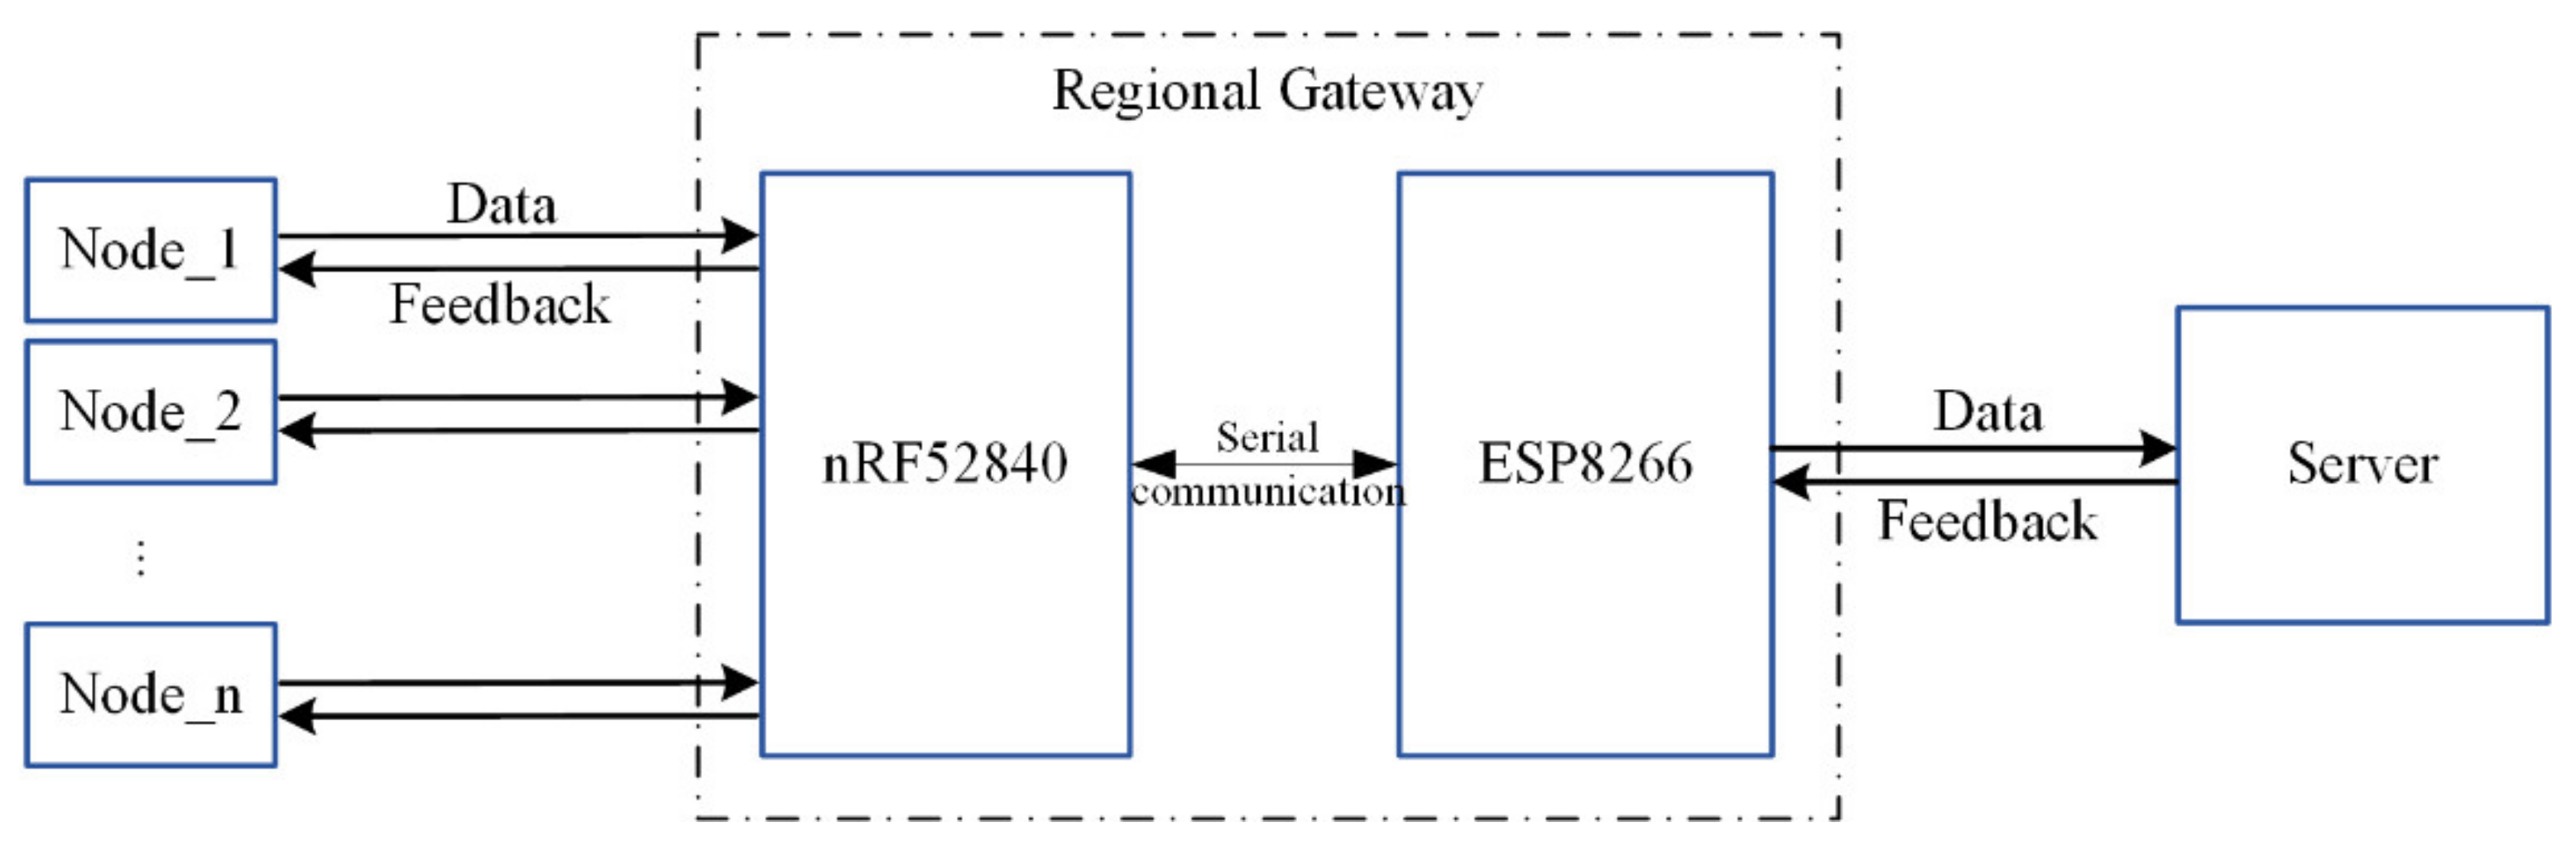
2.2. Gateway
2.3. Data Visualization System
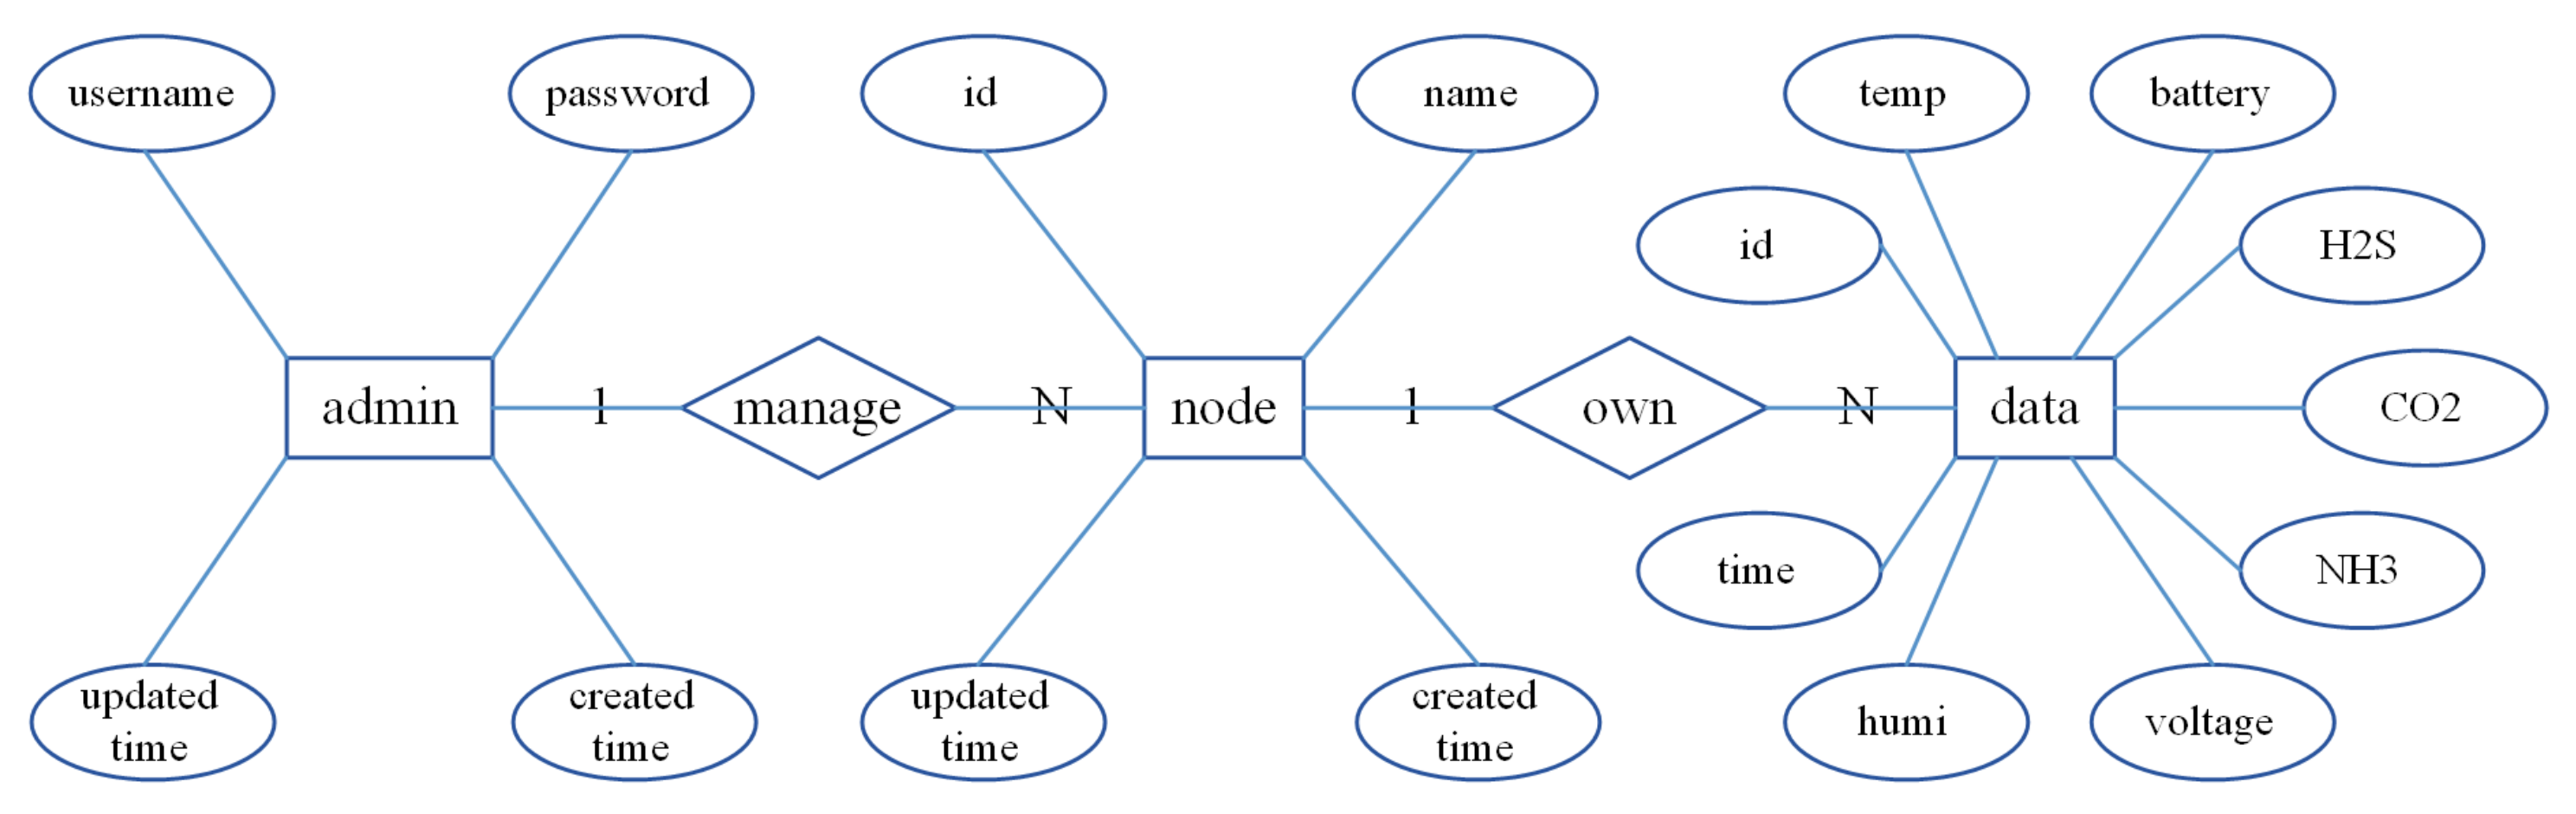
2.3.1. Database
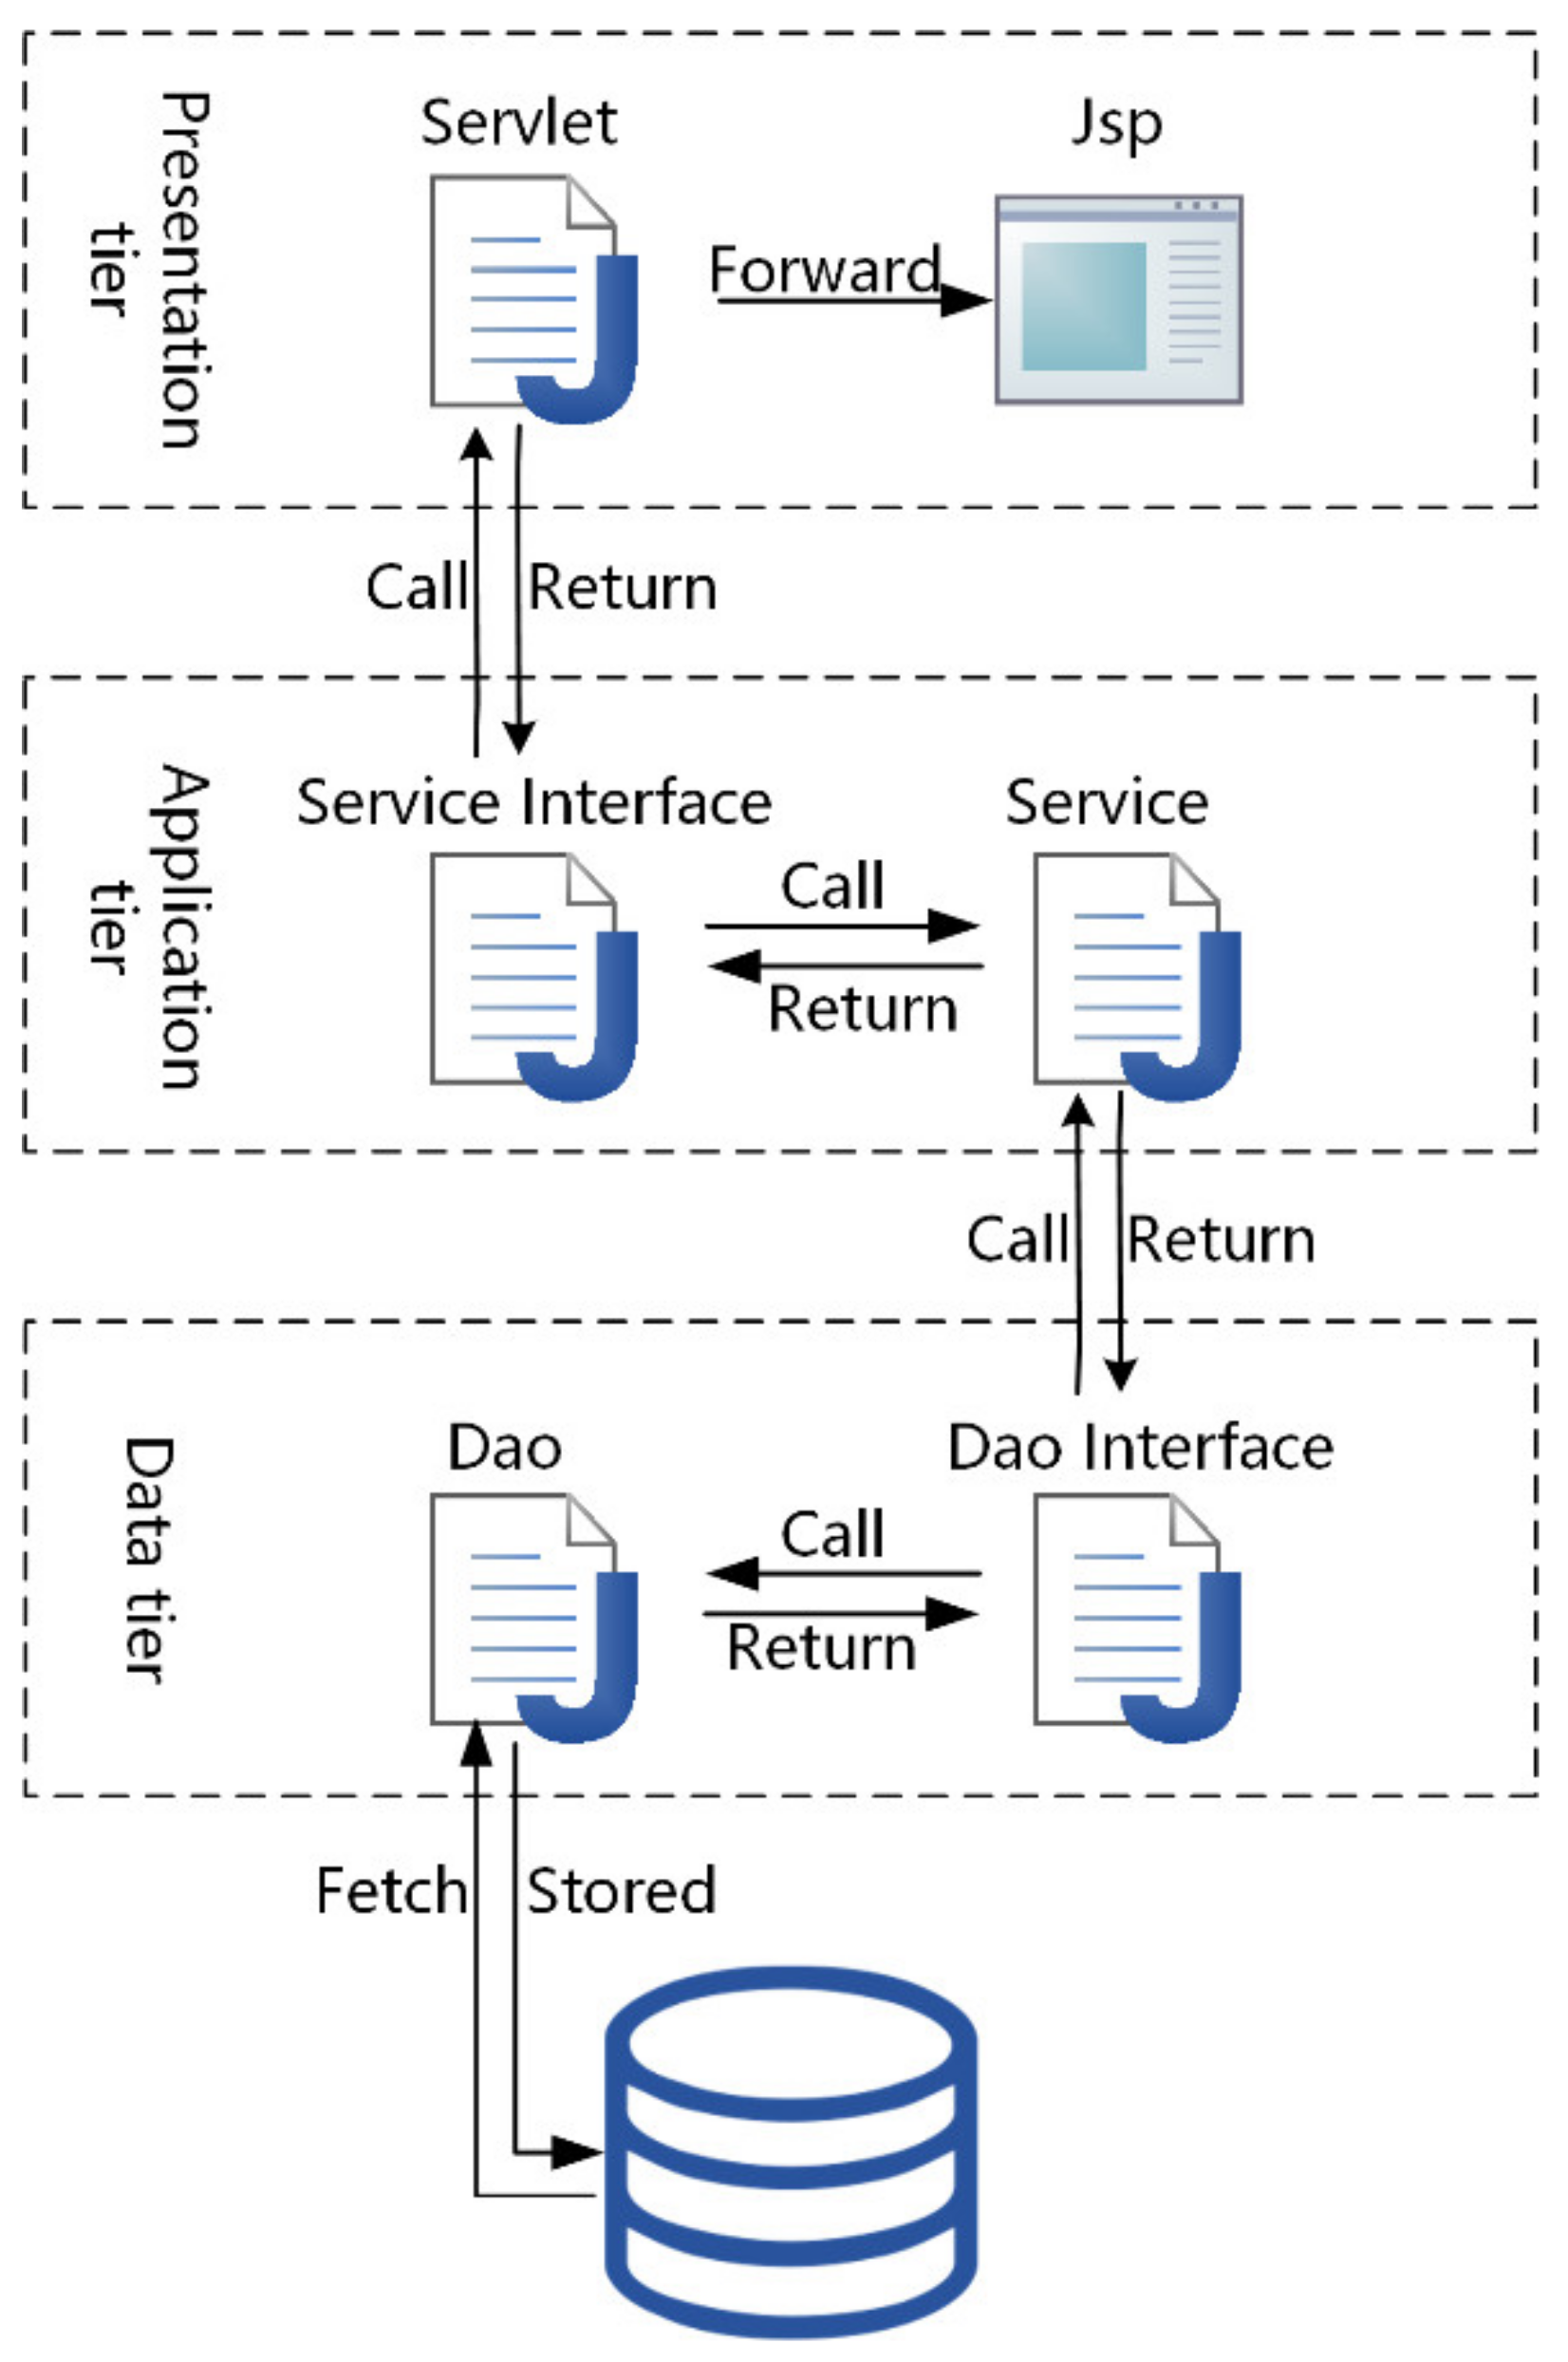
2.3.2. Server
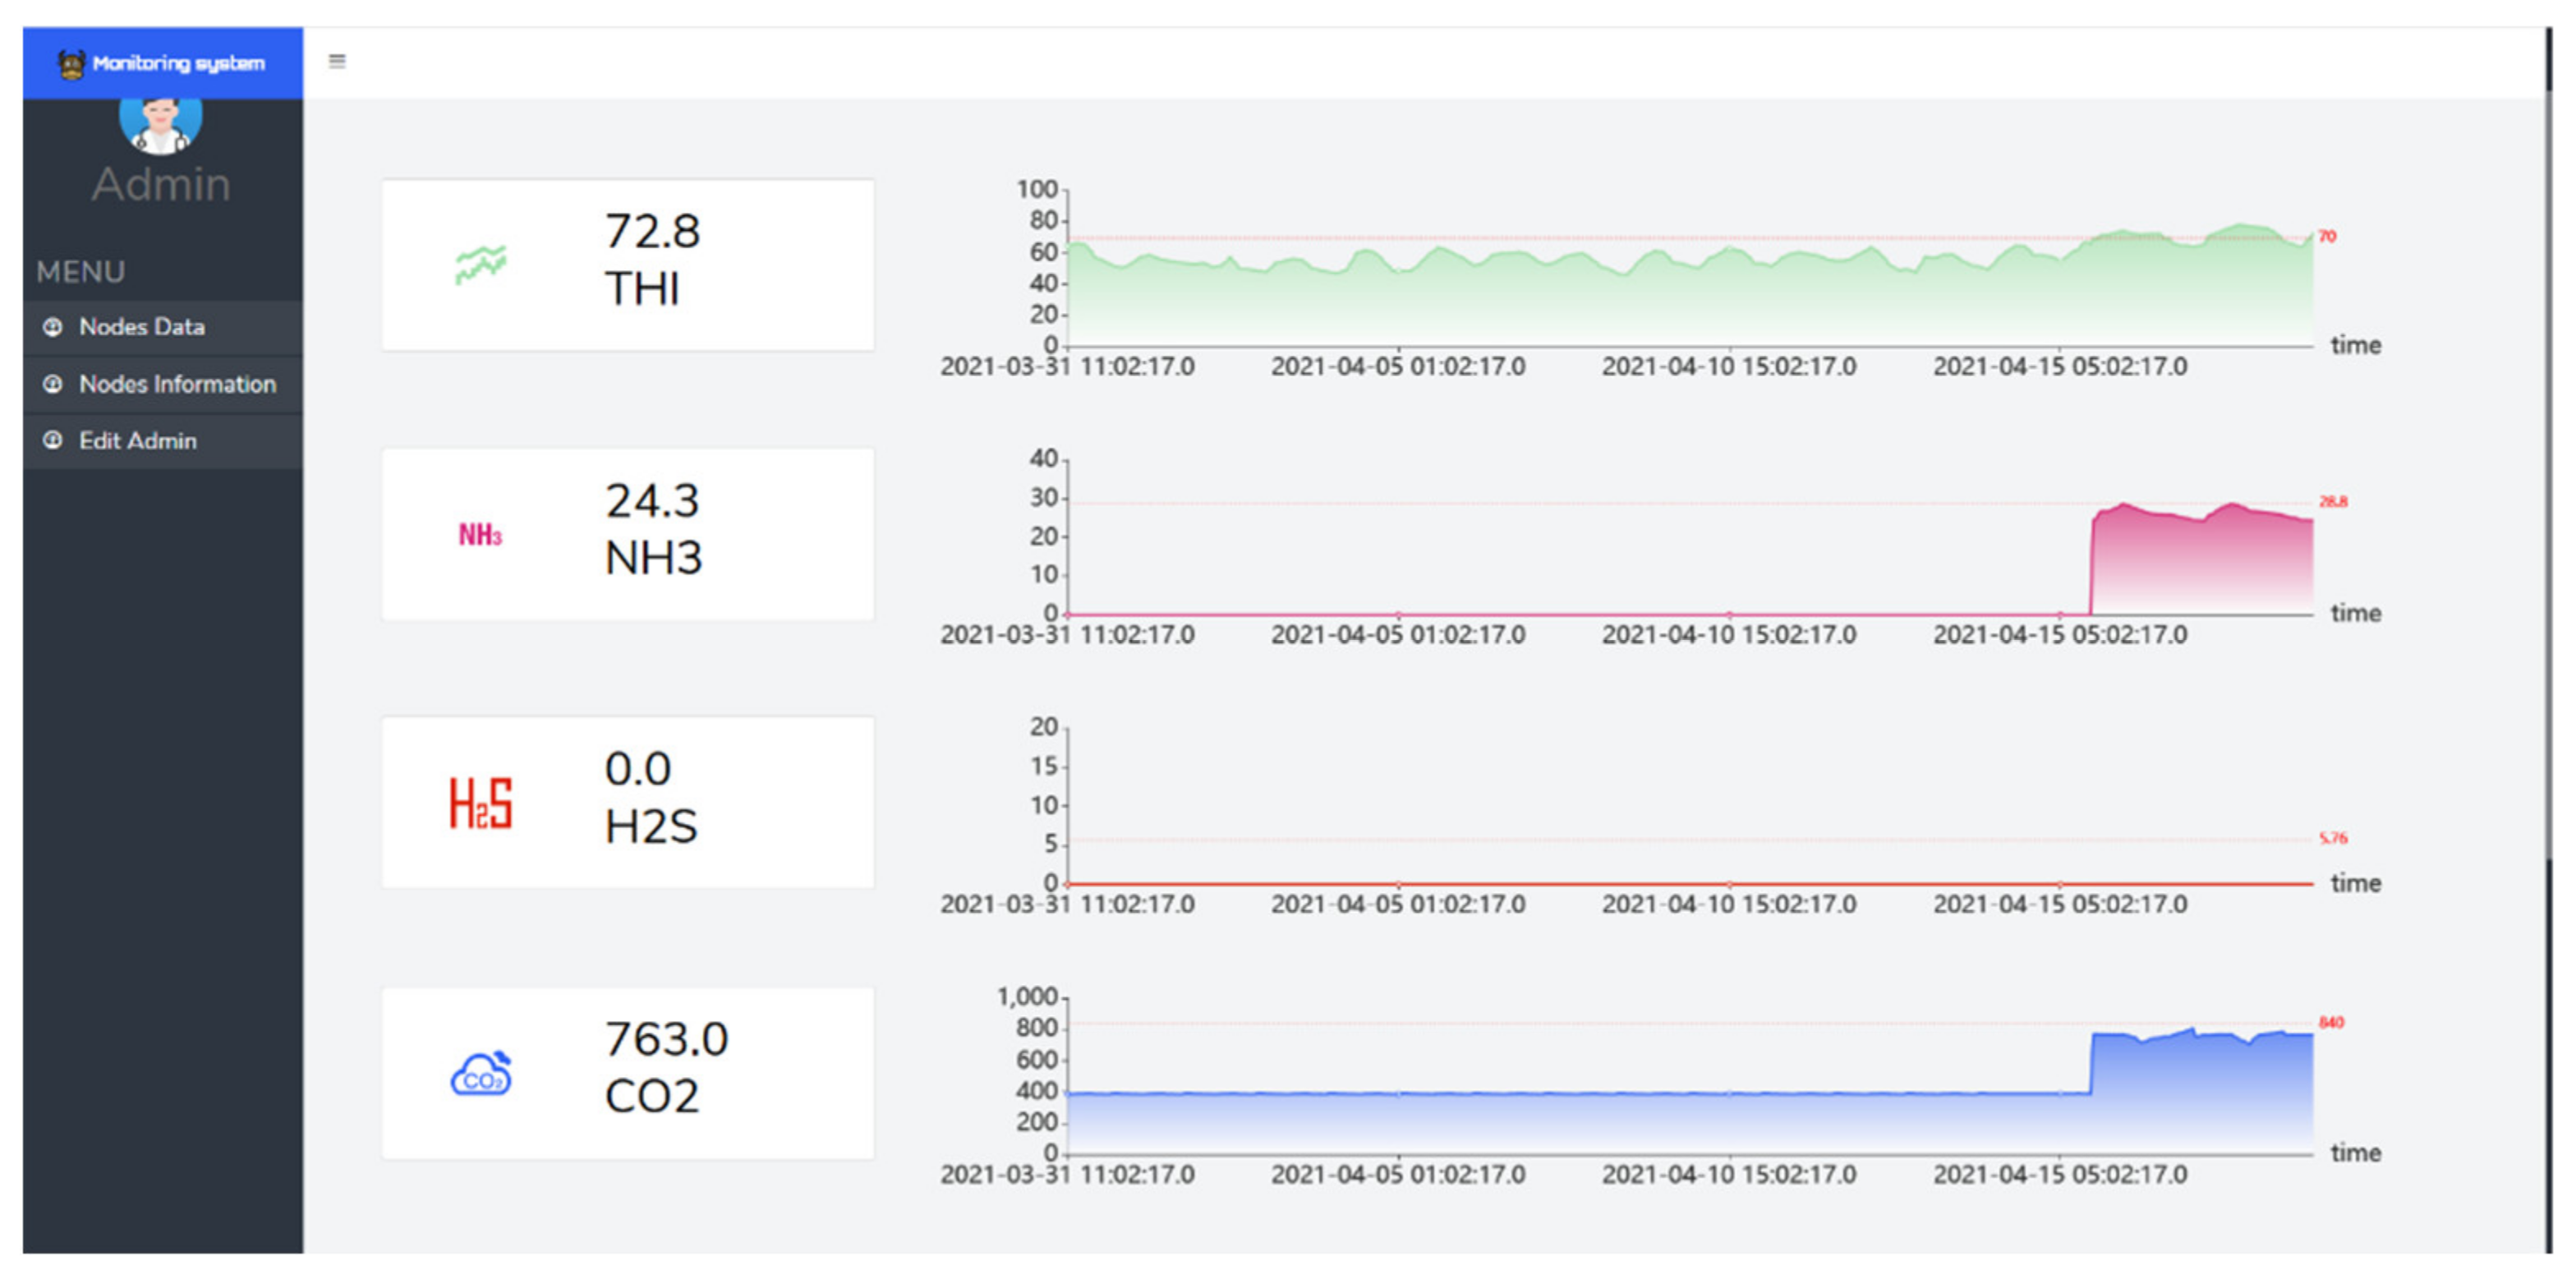
3. Results
4. Discussion
Author Contributions
Funding
Institutional Review Board Statement
Informed Consent Statement
Data Availability Statement
Conflicts of Interest
References
- Herrero, M.; Henderson, B.; Havlik, P.; Thornton, P.K.; Conant, R.; Smith, P.; Wirsenius, S.; Hristov, A.N.; Gerber, P.; Gill, P.S.M.; et al. Greenhouse gas mitigation potentials in the livestock sector. Nat. Clim. Chang. 2016, 6, 452–461. [Google Scholar] [CrossRef] [Green Version]
- Dairy Production and Products: Social and Gender Issues. Available online: http://www.fao.org/dairy-production-products/socio-economics/social-and-gender-issues/en/ (accessed on 1 July 2021).
- Food and Agriculture Organization of the United Nations. Food Outlook Biannual Report on Global Food Markets |Policy Support and Governance. 2018. Available online: http://www.fao.org/policy-support/resources/resources-details/en/c/1169716/ (accessed on 1 July 2021).
- Milk and Milk Product Statistics—Statistics Explained. 2018. Available online: https://ec.europa.eu/eurostat/statistics-explained/index.php/Milk_and_milk_product_statistics#Milk_products (accessed on 1 July 2021).
- Fleming, K.; Waweru, P.; Wambua, M.; Ondula, E.; Samuel, L. Toward quantified small-scale farms in Africa. IEEE Internet Comput. 2016, 20, 63–67. [Google Scholar] [CrossRef]
- Li, X.; Zhang, J.; Jin, W.; Liu, W. Key technology implementation of poultry breeding system for 5G intelligent IOT. In Proceedings of the 2020 IEEE Conference on Telecommunications, Optics and Computer Science (TOCS), Shenyang, China, 11–13 December 2020; pp. 372–376. [Google Scholar]
- Zhang, W.; Chen, C. Design and implementation of an android-based broiler production environment monitoring system. In Proceedings of the 2020 IEEE 3rd International Conference on Automation, Electronics and Electrical Engineering (AUTEEE), Shenyang, China, 20–22 November 2020; pp. 125–128. [Google Scholar]
- Zeng, Z.; Zeng, F.; Han, X.; Hamza, E.; Yu, Q.; Lu, E. Real-time monitoring of environmental parameters in a commercial gestating sow house using a zigbee-based wireless sensor network. Appl. Sci. 2021, 11, 972. [Google Scholar] [CrossRef]
- Tang, J.; Dong, T.; Li, L.; Shao, L. Intelligent monitoring system based on internet of things. Wirel. Pers. Commun. 2018, 102, 1521–1537. [Google Scholar] [CrossRef]
- Putra, G.D.; Pratama, A.R.; Lazovik, A. Comparison of energy consumption in Wi-Fi and bluetooth communication in a smart building. In Proceedings of the 2017 IEEE 7th Annual Computing and Communication Workshop and Conference (CCWC), Las Vegas, NV, USA, 2–5 December 2017; pp. 1–6. [Google Scholar]
- Choi, M.; Han, J.; Lee, I. An efficient energy monitoring method based on bluetooth low energy. In Proceedings of the 2016 IEEE International Conference on Consumer Electronics (ICCE), Las Vegas, NV, USA, 9–11 January 2016; pp. 359–360. [Google Scholar]
- Han, J.; Zhang, Y. IoT USN system and hybrid architecture application. 2020 Chinese Automation Congress (CAC), Shanghai, China, 6–8 November 2020; pp. 514–518. [Google Scholar] [CrossRef]
- Tao, S.; Rivas, R.M.O.; Marins, T.N.; Chen, Y.-C.; Gao, J.; Bernad, J.K. Impact of heat stress on lactational performance of dairy cows. Theriogenology 2020, 150, 437–444. [Google Scholar] [CrossRef] [PubMed]
- Li, G.; Chen, J.; Peng, D.; Gu, X. Short communication: The lag response of daily milk yield to heat stress in dairy cows. J. Dairy Sci. 2021, 104, 981–988. [Google Scholar] [CrossRef] [PubMed]
- Dikmen, S.; Hansen, P.J. Is the temperature-humidity index the best indicator of heat stress in lactating dairy cows in a subtropical environment? J. Dairy Sci. 2009, 92, 109–116. [Google Scholar] [CrossRef] [PubMed] [Green Version]
- Miranda, C.; Soares, A.S.; Coelho, A.C.; Trindade, H.; Teixeira, C.A. Environmental implications of stored cattle slurry treatment with sulphuric acid and biochar: A life cycle assessment approach. Environ. Res. 2021, 194, 110640. [Google Scholar] [CrossRef] [PubMed]
- SHT21 Semiconductor Sensor for Temperature and Humidity. 2021. Available online: http://www.farnell.com/datasheets/1780639.pdf (accessed on 1 July 2021).
- MG811 Semiconductor Sensor for Carbon Dioxide. 2021. Available online: https://sandboxelectronics.com/files/SEN-000007/MG811.pdf (accessed on 1 July 2021).
- MQI37 Semiconductor Sensor for Ammonia. 2020. Available online: https://cdn.datasheetspdf.com/pdf-down/M/Q/1/MQI37-Hanwei.pdf (accessed on 1 July 2021).
- MQ136 Semiconductor Sensor for Sulfur Dioxide. 2020. Available online: http://www.china-total.com/Product/meter/gas-sensor/MQ136.pdf (accessed on 1 July 2021).
- nRF52832. 2021. Available online: https://www.mouser.com/datasheet/2/297/nRF52832%20Product%20Brief%20v1.2-890472.pdf (accessed on 1 July 2021).
- Juteau, N.; Gosselin, B. Wearable wireless-enabled oscillometric sphygmomanometer: A flexible ambulatory tool for blood pressure estimation. IEEE Trans. Biomed. Circuits Syst. 2020, 14, 1287–1298. [Google Scholar] [CrossRef] [PubMed]
- Semiconductor, N. nRF52840 Product Specification v1. 0. nRF52840 Datasheet. Available online: https://infocenter.nordicsemi.com/pdf/nRF52840_PS_v1.0.pdf (accessed on 1 July 2021).
- Parsons, D. Java Web Servers and the HttpClient; Springer: Berlin, Germany, 2020; pp. 565–585. [Google Scholar]
- Jose, B.; Abraham, S. Performance analysis of NoSQL and relational databases with MongoDB and MySQL. Mater. Today Proc. 2020, 24, 2036–2043. [Google Scholar] [CrossRef]
- Patil, M.M.; Hanni, A.; Tejeshwar, C.H. A qualitative analysis of the performance of MongoDB vs MySQL database based on insertion and retriewal operations using a web/android application to explore load balancing—Sharding in MongoDB and its advantages. In Proceedings of the 2017 International Conference on I-SMAC (IoT in Social, Mobile, Analytics and Cloud), Palladam, India, 10–11 February 2017; pp. 325–330. [Google Scholar]
- Abdelrahman, M.M.; Zhan, S.; Chong, A. A three-tier architecture visual-programming platform for building lifecycle data management. SimAUD 2020. [Google Scholar] [CrossRef]
- Permpool, T.; Nalintippayawong, S.; Atchariyachanvanich, K. Interactive SQL learning tool with automated grading using MySQL sandbox. In Proceedings of the 2019 IEEE 6th International Conference on Industrial Engineering and Applications (ICIEA), Tokyo, Japan, 26–29 April 2019; pp. 928–932. [Google Scholar]
- Ashley, D. Foundation Dynamic Web Pages with Python; Apress: Berkeley, CA, USA, 2020; pp. 29–69. [Google Scholar]
- Li, D.; Mei, H.; Shen, Y.; Su, S.; Zhang, W.; Wang, J.; Zu, M.; Chen, W. ECharts: A declarative framework for rapid construction of web-based visualization. Vis. Inform. 2018, 2, 136–146. [Google Scholar] [CrossRef]
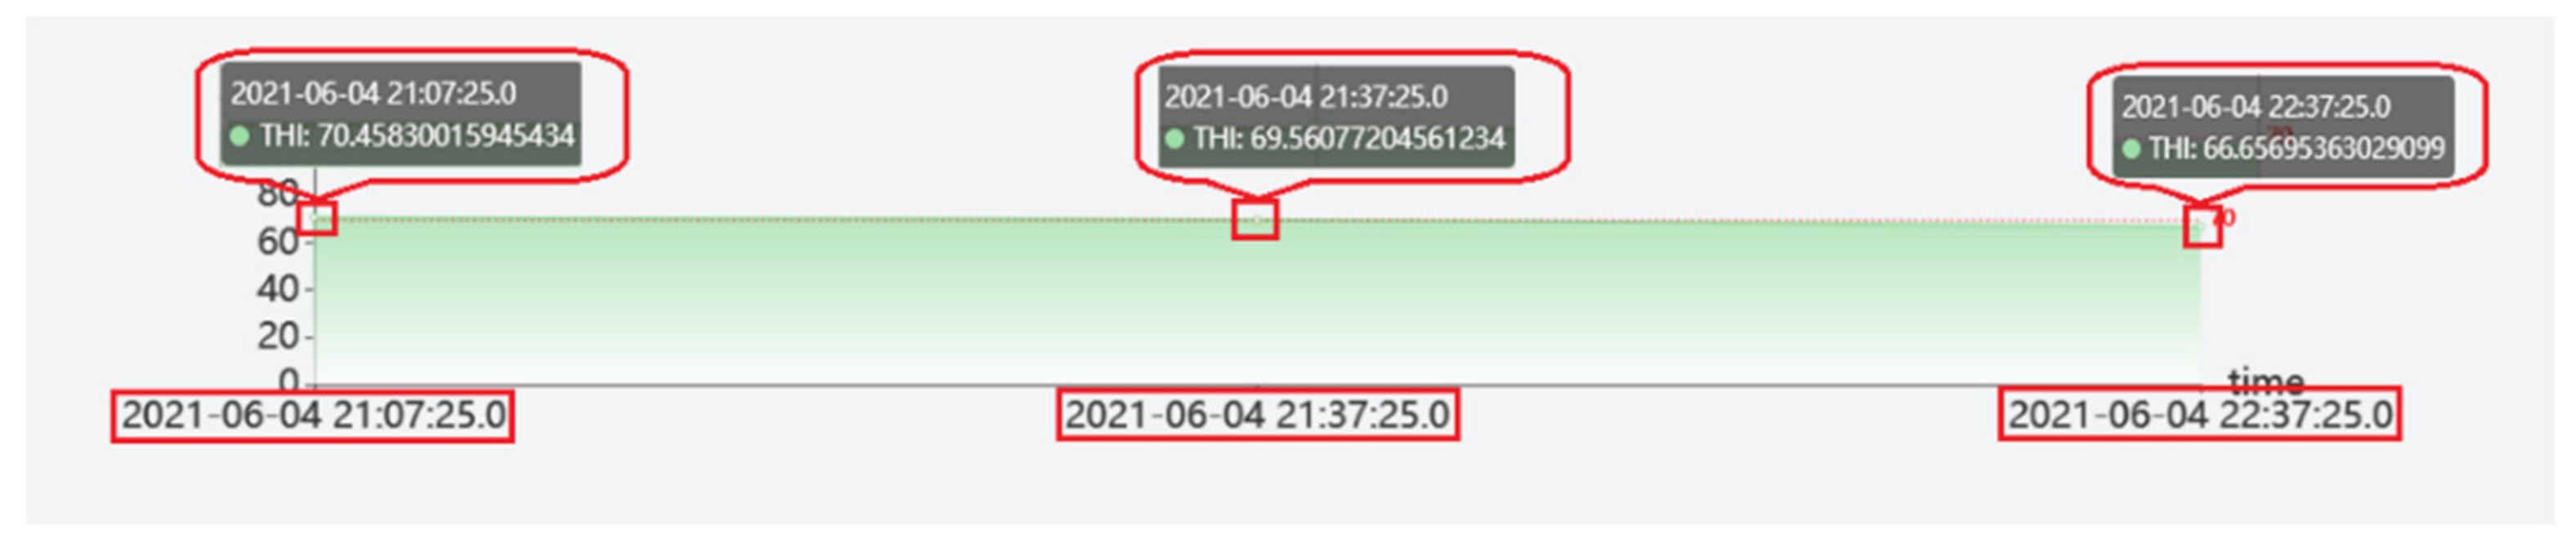
- Pinto, S.; Hoffmann, G.; Ammon, C.; Amon, T. Critical THI thresholds based on the physiological parameters of lactating dairy cows. J. Therm. Biol. 2020, 88, 102523. [Google Scholar] [CrossRef] [PubMed]


| Temperature (℃) | Humidity (%RH) | (ppm) | (ppm) | (ppm) | |
|---|---|---|---|---|---|
| Model | SHT21 | MG-811 | MQ137 | MQ136 | |
| Range | −40~125 | 0~100 | 0~10000 | 5~500 | 1~200 |
| Resolution | 0.01 | 0.04 | Rs(in air)/Rs (50 ppm ) ≥ 3 | Rs(in air)/Rs (50 ppm ) ≥ 3 | |
| Precision | ±0.3 | ±2 | 0.6() | 0.6() | |
| Number of abnormal parameters | 0 | 1 | 2 | 3 | 4 |
| Sampling period (min) | 60 | 30 | 10 | 5 | 1 |
Publisher’s Note: MDPI stays neutral with regard to jurisdictional claims in published maps and institutional affiliations. |
© 2021 by the authors. Licensee MDPI, Basel, Switzerland. This article is an open access article distributed under the terms and conditions of the Creative Commons Attribution (CC BY) license (https://creativecommons.org/licenses/by/4.0/).
Share and Cite
Qu, Y.; Sun, G.; Zheng, B.; Liu, W. Environment Monitoring System of Dairy Cattle Farming Based on Multi Parameter Fusion. Information 2021, 12, 273. https://doi.org/10.3390/info12070273
Qu Y, Sun G, Zheng B, Liu W. Environment Monitoring System of Dairy Cattle Farming Based on Multi Parameter Fusion. Information. 2021; 12(7):273. https://doi.org/10.3390/info12070273
Chicago/Turabian StyleQu, Yunlong, Guiling Sun, Bowen Zheng, and Wang Liu. 2021. "Environment Monitoring System of Dairy Cattle Farming Based on Multi Parameter Fusion" Information 12, no. 7: 273. https://doi.org/10.3390/info12070273
APA StyleQu, Y., Sun, G., Zheng, B., & Liu, W. (2021). Environment Monitoring System of Dairy Cattle Farming Based on Multi Parameter Fusion. Information, 12(7), 273. https://doi.org/10.3390/info12070273