Review

Effects of User Interfaces on Take-Over Performance: A Review of the Empirical Evidence

1
Department of Human-Centered Design, Faculty of Industrial Design Engineering, Delft University of Technology, 2628 CE Delft, The Netherlands
2
Department of Cognitive Robotics, Faculty of Mechanical, Maritime and Materials Engineering, Delft University of Technology, 2628 CD Delft, The Netherlands
*
Author to whom correspondence should be addressed.
Information 2021, 12(4), 162; https://doi.org/10.3390/info12040162
Submission received: 10 February 2021 / Revised: 29 March 2021 / Accepted: 7 April 2021 / Published: 10 April 2021

Abstract

:
In automated driving, the user interface plays an essential role in guiding transitions between automated and manual driving. This literature review identified 25 studies that explicitly studied the effectiveness of user interfaces in automated driving. Our main selection criterion was how the user interface (UI) affected take-over performance in higher automation levels allowing drivers to take their eyes off the road (SAE3 and SAE4). We categorized user interface (UI) factors from an automated vehicle-related information perspective. Short take-over times are consistently associated with take-over requests (TORs) initiated by the auditory modality with high urgency levels. On the other hand, take-over requests directly displayed on non-driving-related task devices and augmented reality do not affect take-over time. Additional explanations of take-over situation, surrounding and vehicle information while driving, and take-over guiding information were found to improve situational awareness. Hence, we conclude that advanced user interfaces can enhance the safety and acceptance of automated driving. Most studies showed positive effects of advanced UI, but a number of studies showed no significant benefits, and a few studies showed negative effects of advanced UI, which may be associated with information overload. The occurrence of positive and negative results of similar UI concepts in different studies highlights the need for systematic UI testing across driving conditions and driver characteristics. Our findings propose future UI studies of automated vehicle focusing on trust calibration and enhancing situation awareness in various scenarios.

1. Introduction

Cars and other road vehicles see increasing levels of support and automation. The majority of current and near-future automated vehicles (AVs) will still need a capable driver on-board who can take control of the vehicle when manual driving is preferred or in driving conditions that are not supported by the automation. This requires information provided by the user interface (UI) to prepare drivers and guide transitions between automated and manual driving.
Driving automation systems are classified by the American Society of Automotive Engineers (SAE) [1] into six levels, from level 0 (no driving automation) to level 5 (full driving automation). Level 1 automates longitudinal control (advanced cruise control) or lateral control (lane-keeping assist). Level 2 simultaneously automates longitudinal and lateral control. However, drivers are always required to monitor the surroundings in Level 2 automation. In Levels 3 to 5, drivers may take their eyes off the road, creating the opportunity to engage in non-driving-related tasks (NDRTs). In Level 3, drivers need to be ready to resume manual control in reaction to take-over requests (TORs) issued by the automation [2]. Such TOR can be issued when the vehicle leaves the operational design domain (ODD) of the automation. In Level 4, the automation may issue TOR but will resort to a minimal risk control strategy if drivers do not take back control. In Level 5, automation is fully capable of driving under all conditions.
The take-over process comprises several time-consuming stages: perception of TOR stimuli via drivers’ sensory system, interruption of the NDRTs, drivers’ motoric readiness, rebuilding of situation awareness (SA), and cognitive state meeting the demands of manual driving [3,4]. Drivers should take-over control within the “time budget”, which is the time from TOR to the automation system limit. The time needed for a safe transition of control depends on the complexity of the driving context and has been estimated to be at least 10 s [5]. The take-over of control is an essential situation where drivers return from a passive driving or monitoring role to an active driving role. During the transition, the driver and the vehicle have critical interactions from a safety perspective. In automated mode, drivers can perform NDRTs or relax, leading to a lower level of situation awareness and alertness. A widely accepted definition of situation awareness has been provided by Endsley as “the perception of environmental elements and events with respect to time or space, the comprehension of meaning, and the projection of states in the near future” [6]. Studies have shown that the rapid transition from a low level of alertness and of situational awareness into active vehicle control may yield reduced performance in safety-critical situations [7]. Therefore, a properly designed user interface is needed to inform and guide the driver before and during take-over.
A wide range of experimental studies has addressed take-over performance, and several reviews and meta-studies have summarized their findings [3,8,9,10,11,12]. However, there is no review yet that interprets take-over studies in terms of a holistic user experience during the transition of control. Hence, this paper reviews empirical studies that identify the effect of UI on take-over performance. Zhang [8] and Weaver [9] performed meta-analyses, and McDonald [10] provided an empirical review. Zhang reviewed the effect of time budget, modality, and urgency on only take-over time in Levels 2 and 3 of driving. Weaver reviewed the effect of time budget, NDRTs, and information support on take-over time and the quality of the take-over at Level 3. McDonald analyzed the impact of secondary task, modality, TOR presence, driving environment, automation level, and driver state in experimental studies on take-over time and quality during Levels 2, 3, and 4 of driving. Other papers reviewed factors such as time budget [11] and NDRTs [3]. One study categorized interface studies [12] but did not quantify the benefits of the various UI concepts.
Our study uniquely quantifies the effect of UI in Levels 3 or 4 automation. In particular, we reviewed the effectiveness of advanced UI informing the users on the automation status and take-over procedure that help guiding the user during TOR. Where most take-over studies employed “simple signals”, i.e., basic sounds, light signals, and icons, our review addresses the benefits of “advanced UI” using contextual messaging, language-based sounds, graphical displays, and augmented reality in heads-up displays. We categorized UI factors from an AV-related information perspective based on driving situation and information type (Figure 1). In addition, we reviewed empirical studies to identify their impact on take-over performance. Finally, we conclude with a comprehensive interpretation of the UI effects in the empirical studies and provide recommendations for UI design and evaluation.

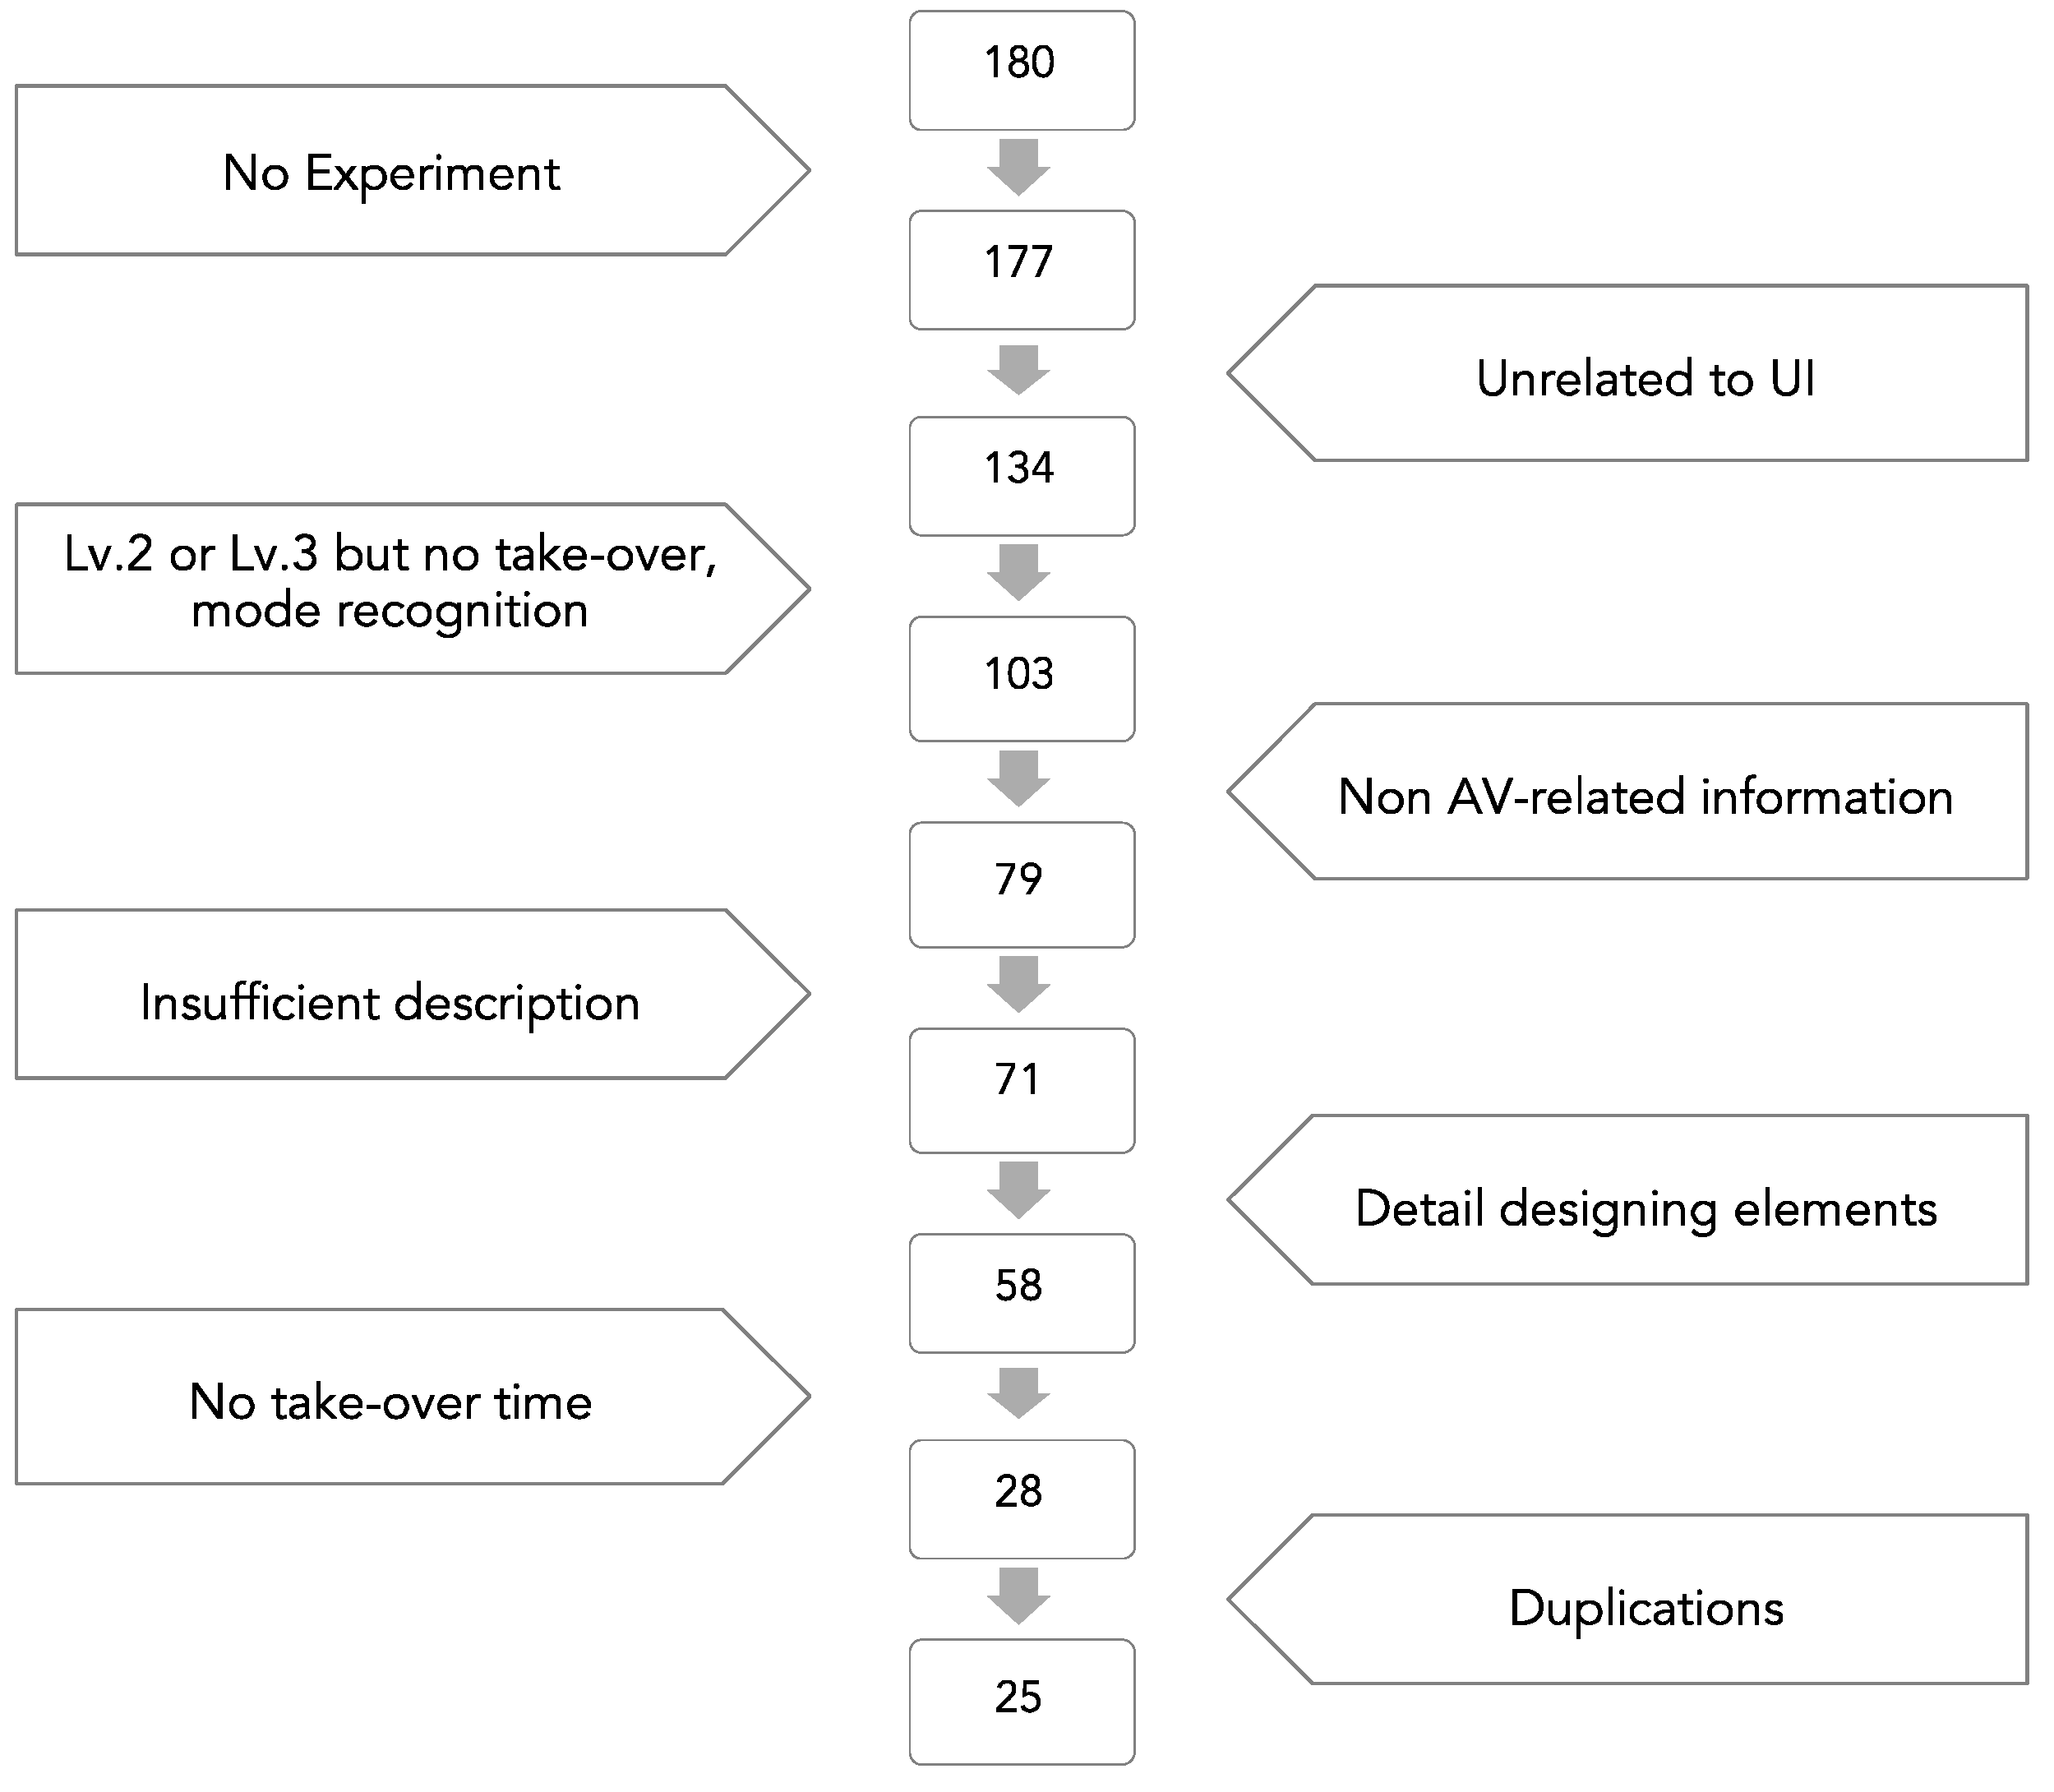
2. Materials and Methods

We conducted a literature search on publications from 2013 through 2020 evaluating user interfaces in take-over situations. We searched for papers covering “interfaces” affecting “transition performance” in “automated vehicles”. Searches were performed using: Google Scholar and ScienceDirect (Elsevier), selecting keywords, title and abstract. In Google Scholar, ‘cited by’ was also used. In addition, we scanned the reference lists of selected papers. We used the following keywords: ‘take-over’, ‘take-over request’, ‘TOR,’ or ‘transition of control’ combined with interface (or UI) and combined with automated vehicle. The review included only published journals and conference proceedings.
For selection, studies had to meet all following criteria:
  • The study covers SAE level 3 or higher (i.e., conditionally automatic driving, highly automated driving).
  • The study includes transitions of control from automated mode to manual mode.
  • The study includes experiments with human participants in a real vehicle or a driving simulator.
  • The study includes a change in the user interface that carries the TOR, such that the effectiveness of the UI can be quantified.
  • The study includes objective data on take-over time after take-over requests (where available we also analyzed take-over quality relevant for safety and we analyzed subjective data relevant for UI acceptance).
Thousands of papers included keywords related to Criteria 1–3, but keywords related to Criteria 4 and 5 were highly restrictive, resulting in 180 papers selected for full text review. As illustrated in Figure 2, reviewing the full text, 155 papers were removed for the following reasons: no experiment (3 papers), unrelated to UI (43 papers), only Level 2 (16 papers), Level 3 but no take-over (11 papers) or for mode recognition between Level 3 and other levels (4 papers), no AV-related information in the UI (i.e., tutoring, general warning) (24 papers), insufficient description of experimental conditions (8 papers), focus on detail designing elements rather than providing contents itself (i.e., seating pattern, auditory type, message sentence) (13 papers), no take-over time (30 papers). Three remaining papers were excluded as duplications, considering that the same author made similar experimental designs on the same interface element. So, in the end, twenty-five papers met our criteria. These remaining studies were only performed in driving simulators, and not in real vehicles.
We systematically classified the experimental conditions and findings, including effect direction, size, and statistical significance. The full classification is provided as Supplementary Material (Table S1). Conditions were classified regarding driver characteristics, experimental set-up, automation system, user interface, and transition scenario. Transition performance was classified by take-over time, and quality (Table 1). The take-over time is measured from the TOR start to measurable driver reactions and the take-over quality measures how well the transition is performed and implies potential driver danger [13]. We also classified the papers in terms of subjective measures of driver trust and driver attention and objective measures of situation awareness (e.g., awareness of other vehicles).
Information presented by UI was classified in terms of: when, how and what according to Figure 1. Regarding timing (when), we discriminate information preceding the TOR, the actual TOR signal and guiding information following the first TOR signal. We do not focus on time budget between TOR and system limit as this has been well addressed in other reviews [8,14].

3. Results

We analyzed twenty-five papers (Table 2) that addressed the driver’s performance and the user interface (UI) role in transitions of control. The papers addressed the following single or multiple aspects of user interfaces: ten papers studied the effect of the information channel on the take-over requests (TORs) channels via visual or auditory or tactile modality, including two papers that studied TOR on the device used by the driver in non-driving-related tasks (NDRTs) (simple information); two papers investigated the benefits of an explanatory message following an abstract auditory TOR (situation information—additional explanations); two papers studied the benefits of TOR signals with different levels of urgency (situation information—urgency level); four papers presented vehicle information such as system capability and vehicle’s action (vehicle information—vehicle action/system capability); three papers studied surrounding information during automated driving (surrounding information); eight papers provided driver transition guiding information, including four papers using AR (guiding information).
In the twenty-five papers, twenty-seven results of UI variations were described in terms of take-over time. When there were two different types of take-over time results, if one type was significantly reduced and the other non-significantly reduced, we counted this as a positive result.
The twenty-seven results include seventeen cases in which the reaction time decreased significantly, three cases in which the reaction time was increased significantly, and eight cases with non-significant effects. In the three cases with increased reaction time, in two cases, a visual text or an icon was added to an auditory-only TOR, and one case added augmented reality to a tactile-only TOR.
Five studies evaluated the effects of UI on situation awareness; four studies provided vehicle and surrounding information during automated driving; one study presented TOR via different channels. Channels are types of communication that are basically human senses, and each of the different independent single channels is called a modality [15]. All five studies showed that advanced UI helped drivers be aware of the driving situation. The effects were significant in four out of the five studies.
The selected papers evaluate UI, including auditory, visual, and tactile modalities. Auditory is the key TOR modality and was present in at least one condition in twenty-one papers. Tactile is used in ten papers and visual in twenty papers, where visual was in a heads-up display (HUD), instrument panel, mid-console display, or NDRTs.
Information complexity varied from single beeps to complex contextual information shown in HUD, including augmented reality (AR). We divided the UI into simple signals’ and ‘complex signals’ according to the information type. Simple signals present alarms, while complex signals provide contextual information and guidance. Below we present TOR channels and simple signals in Section 3.1, followed by complex signals and contextual information in Section 3.2.

3.1. TOR Channel and Simple Signals

In SAE Level 3, one of the key design issues is which modality is used for TOR [41]. Seven studies investigated the effects of a single modality or multiple modalities (Table 3). Three papers studied modality effects on reaction time [30,31,40]; two papers investigated the effects of using both auditory and tactile signals to complement the visual modality [28,32]; two papers identified the effects of adding visual and tactile signals to the auditory modality [34,36].
Modality-related studies show the following trends. First, TOR only presented as a visual signal yielded the longest take-over time. Auditory signals are effective in decreasing reaction time. Finally, multi-modal TORs do not necessarily lead to faster reaction times. Take-over time and significant differences in the modality-related studies are shown in Table 3.
Several studies [28,30,31,32,40] concluded that visual-only TOR should be avoided for safety, given that TOR with visual-only signals yielded the longest take-over time. In Politis [31], visual-only TOR was more than 4 s slower than single tactile and auditory. Lane positioning was also poor with visual-only TOR [28,31]. When adding auditory signals to visual-only TOR, take-over time was reduced by more than 50% from 6.19 to 2.29 s and 9.46 to 3.84 s, respectively, in Naujoks [28] and Razin [32]. In Naujoks, participants were reading magazines, whereas, in Razin, it is not mentioned which task participants were doing during automated driving. On the other hand, adding visual signals to auditory TOR made the take-over time significantly longer in two studies [34,36]. However, no significant difference in take-over time was found in other single modality and multi-modality comparisons [30,40], and combining all three modalities did not always yield the fastest take-over time [32,36].
In Level 3 or 4 of automated driving, drivers will not always monitor the driving task but will perform NDRT such as reading, texting, or gaming on smartphones or on integrated information systems. Several studies integrated TOR messages in NDRT devices. However, UI that presented visual TOR on an NDRT device did not significantly affect the take-over time when auditory TOR was also presented [27,38]. In Melcher [27], the TOR was presented in two conditions. If the TOR was only presented through the instrument panel and audio, the reaction time was 3.78 s, whereas it decreased to 3.44 s with a TOR provided on a smartphone, but this improvement was non-significant. However, the driver’s subjective trust increased when providing TOR on the NDRT device [38]. It can be beneficial to provide TOR using modalities not used in the NDRT. However, no significant benefits were found by Petermeijer and Yoon [30,40] in terms of take-over time.
Tactile TOR have the advantage of delivering stimuli to channels that are unused in monitoring automation or NDRT. Tactile TOR studies focused on seating vibration rather than steering wheel or pedal vibration because in the higher automation levels the steering wheel and pedals are mostly not used [29,30,35]. Tactile TOR yields similar reaction times as auditory TOR [30,40]. However, in some combinations with other modalities, adding vibration in the seat as a tactile stimulus results in insignificant or even counter-productive effects [32,36].
Modality directly affects the initial reaction time, such as hands-on time or first-gaze time. However, the effects of modality on reaction time decreased in the later stages of transitions and when more time budget was available [30].
The above results review simple signals and their effectiveness to elicit timely initial reactions. Advanced UI can further support the driver, as detailed below.

3.2. Complex Signals and Contextual Information

In conventional vehicles, drivers do not receive the same information as the driving role is shared with the AV. We categorized UI information in AVs based on Figure 1 and present results in Table 4. The information delivered during automated driving includes vehicle and surrounding information. Vehicle information provided feedback for drivers to be aware of the automation mode and their own vehicle’s technical status. Surrounding status information helped drivers notice the traffic state and road hazards. This information helped drivers to stay ‘in the loop’ even during automation. As a result, it eventually affected the transition response time and quality.

3.2.1. Vehicle System Capability

Awareness of the system capability is essential for drivers to gain an understanding of the current situation [42]. Since Level 2 systems require drivers to resume instant control, it is an important design problem to provide sufficient feedback to prevent over-trust in automation [41]. In Level 3 of automation, drivers are not expected to monitor the driving environment but should respond when the vehicle requests a transition of control. Therefore, sufficient system feedback will be required to enable drivers to recognize the automation status for safe driving.
In previous work, the automation system’s state was presented with seven levels of capability [21], or the level of uncertainty was indicated as a heart-beat animation with numerical display [23]. In another study, the sensing capabilities of the system and the external hazards were presented on a center console tablet using icons of different colors [37]. When the automation states of the system were provided, take-over times were reduced significantly [21,37] or reduced but not significantly [23]. System feedback improved driver readiness, which supports Ekman’s finding of uncertainty in information for transition readiness [43]. Interestingly, displaying the capability of the system reduced the subjective trust of drivers while using the system in conditions with a limited visibility range caused by snow or fog [21].

3.2.2. Vehicle Action

Cohen-Lazry [17] communicated the vehicle’s actions and information on surrounding vehicles on a gaming device. The difference in TOR reaction time was not significant when this action and/or context information was provided. When the vehicle’s action information was provided, the glance ratio (the number of glances made in reaction to the information relative to the number of total information) was only about two out of ten, whereas, with information of surrounding vehicles, the glance ratio was about eight out of ten. Since drivers expect the vehicle to drive autonomously until the vehicle requests take-over at Level 3, vehicle action information seems not to be very effective in attracting the driver’s attention.

3.2.3. Surrounding

Drivers can perceive the surrounding context by windows, mirrors, cameras, and sensors. However, because the situation awareness decreases during automated driving, it can be beneficial to inform drivers of the surrounding context using additional stimuli. Take-over time was shortened, and situation awareness was significantly increased when watching a movie was interrupted by showing the driving forward scene every 30 s [22]. On the other hand, when surrounding road information such as approaching vehicles was provided, the road glance ratio was increased, but take-over time was not affected [17]. The author interpreted this result in terms of Endsley’s model that the information only assisted the perception stage, which is the first stage in rebuilding situation awareness, but did not support the comprehension and projection stages. Furthermore, the demonstrated benefits may be simply related to the interruption of NDRTs, which directly encourages the driver to redirect attention towards the road. In Yang [39], the vehicle’s intention (vehicle action) and detection of a potential hazard (surrounding) were displayed using ambient light. The effect of each information type was not studied separately. The number of road glances increased, but the mean glance duration was not affected. Take-over time was also reduced, although this was not statistically significant. However, trust was increased.

3.2.4. TOR Additional Explanations

TOR were generally initiated by simple warning signals, such as beeps or lights, but also included more complex signals containing additional information. For example, speech explaining what to do after a warning signal has been referred to as a header sound [44]. Visual displays may provide similar textual information or icons.
The addition of a speech explanation to a simple auditory signal (beep) as a TOR had no significant effect on the first-gaze reaction time but did reduce hands-on time. Explanations also significantly improved subjective satisfaction and usefulness [20]. On the other hand, when a single auditory TOR was accompanied by a visual explanation holding the steering wheel, the take-over time was longer [36]. The author interpreted this as an increased processing time for the additional TOR information. Such an increased take-over time can be detrimental in time-critical situations but can also signify a better rebuilding of situation awareness and preparation for the transition of control.

3.2.5. Urgency Level

High urgency TOR can reduce reaction time, but there may be side effects such as cognitive load and decreased response accuracy. TOR’s urgency level can also be included in the header sound if appropriately designed.
Providing different speech wording and tactile stimuli at different levels of urgency reduced take-over time [31]. However, the number of take-over reactions to TOR was reduced, with drivers failing to take back control occasionally, and lateral deviations after transitions increased.
TOR with a high urgency level did not significantly affect take-over time when drivers already perceived a high urgency from direct situational observation [33]. When the time budget was 7 s, the take-over time was faster with the high urgency level TOR. However, the TOR urgency level’s effect on drivers’ reaction time was insignificant when the time budget was 3 s. Also, the satisfaction level was better with the long time budget.

3.2.6. Guiding Information

Guiding information includes transition support and driving support. Transition support can yield a safer transition behavior. When drivers received a message to check for hazards during the transition, it did not affect the take-over time but led drivers to check the road risks using mirrors [37]. Driving support information can elicit desired manual driving behavior immediately after the transition. Ambient lighting, in combination with an auditory TOR, resulted in faster control times of the steering wheel when the lighting indicated the direction of lane change and was lower for illumination without directional information [16]. Similarly, when using directional seat vibration TOR to guide lane change direction, steering-wheel control time was shortened compared to a non-directional TOR. Furthermore, the lane change direction accuracy was increased [18]. In addition, the time of the lane change was reduced by seat vibration indicating an approaching vehicle’s direction and increased the percentage of road safety checks by mirrors [35].

3.2.7. AR—Situation and Guiding information

Heads-up displays (HUDs) can support drivers to keep an eye on the road by displaying information on the windshield or combiner glass. With an HUD, the vehicle can provide visual information necessary to carry out the driving task. Augmented reality (AR) extends the three-dimensional world by enhancing the drivers’ real-world perception with information displayed on the windshield. Therefore, it allows for information mapped to the real driving context that is helpful for the detection of an object, its analysis, and the required reaction [45]. During the transition, AR provides additional explanations of situations and guiding information that support manual driving. Thus, it helps drivers rebuild situational awareness and perform safe driving.
Intervention time showed no significant difference between with and without AR [19,24,25,26]. With auditory TOR [24,25,26] or seating tactile TOR [19], adding AR visual information does not seem to affect the initial reaction. Although measures of evaluation of take-over performance varied over studies, all showed a positive effect on driving behavior after the transition when AR visual information was used [19,24,25,26]. In Table 5, the information provided by the AR for each paper is shown. ‘Present the danger’ indicates the road’s risk factors that made the transition. ‘Guide the manual driving’ is information that helps manual driving, such as carpet trajectory or arrow direction.
Lorenz [26] used AR red, highlighting a corridor showing a risk location, and AR green representing a road surface where lane changes should be made. As a result, 80% of participants performing the task without AR only controlled the steering wheel during the transition, whereas approximately 50% of the participants using the highlight coloring by the AR used both the steering wheel and the braking pedal. In other words, drivers using AR performed safer transitions than without AR. According to this study, the framed information by AR affects the take-over behavior differently. Twenty-five percent of the participants stopped using brakes and did not change lanes in AR red, whereas no participants stopped using only brakes in AR green. Furthermore, no AR red participants checked the corridor next to the vehicle during lane changes. All AR green drivers drove in similar tracks around the obstacle using the recommended corridor. It seems drivers regard ‘AR red’ as a warning and ‘AR green’ as a recommendation. In addition, AR green has a positive effect on the transition, such as safe lane changes and similar road trajectories.
Langlois [24] provided situation and guiding information via AR in scenarios of lane changes on highways or exits and analyzed the take-over quality with longitudinal control and distance to the maneuver limit point. With AR, participants adapted well to the slow traffic on the destination lane, resulting in less sharp longitudinal control compared to the control group. The distance to the maneuver limit point with AR was also significantly longer than without AR.
Even though providing AR does not affect take-over time and helps drivers understand the situation, the driver seems to need time to process the information provided by AR for driving tasks after take-over [25]. In other words, providing peripheral information with AR seems to be positive in situations when the time budget is sufficient for drivers to make a decision. Therefore, it may be more useful to provide direct warnings or intuitive guides in an urgent situation than to explain the surrounding situation.
Lindemann [25] used AR to provide situation and guiding information in transitions of control due to a construction site, system failure, and traffic rule ambiguity. In scenarios requiring steering control after transitions, lateral deviations were reduced with AR. The information provided by AR seemed to help drivers to understand the situation, which is also supported by the subjective evaluation results. Understanding the situation can elicit smooth manual driving in situations where steering control is required.
Eriksson [19] identified AR information’s impact with a time-budget of 12 s before the vehicle would collide with the front vehicle after the transition of control. If there was sufficient distance from the upcoming vehicles in the next lane, drivers should change the lane; otherwise, drivers should use the braking pedal to slow down. Three AR displays were compared to a baseline without AR. One AR shows the front slowly moving vehicle using a sphere sign and color carpets or arrows to guide the others. Although there was no significant difference in the initial reaction, the driving task time, such as lane change and braking time, was reduced by the carpet and arrow AR. The arrows guide more directly, meaning that braking time is shorter than with the carpet guide.
Hence, we conclude that AR does not significantly affect drivers’ initial take-over time. However, AR enhances the drivers’ situation awareness and helps drivers’ decision-making process after the transition. To design the AR in AVs, it is necessary to adapt AR information to the contextual circumstances because the impact on drivers’ behavior varied depending on the road situation and framed information.

4. Discussion

This paper reviewed the literature for empirical studies on how user interfaces (UIs) affect take-over performance in automated vehicles. Most studies showed positive effects of advanced UI, but some studies showed no significant benefits, and a few studies showed negative effects. The occurrence of positive and negative results of similar UI concepts in different studies highlights the need for systematic UI testing across driving conditions and driver characteristics.
Intervention time seems a prominent objective dependent factor in the study of driver performance in transitions of control. Other take-over times, such as first-gaze time and hands-on time, provide complementary information. However, take-over times are not sufficient to predict safe transitions. Hence, future studies need to evaluate take-over quality (Table 1) and visual scanning to assess how well drivers regain situation awareness (SA) and are the ‘in-the-loop’. UI design supporting take-over conditions needs to ensure that drivers take-over safely within the available time budget. In general, a shorter take-over time is seen as positive, but it can also result in drivers acting before they are sufficiently aware of the situation. Hence, a somewhat longer take-over time with an advanced UI can actually present a safer transition [24]. Therefore, future studies shall jointly evaluate take-over time and quality to predict safety in the transition of control. Some of the studies in this review also measured trust. Even though take-over time was reduced with an advanced UI, trust was increased in one study [38] and decreased in another study [21]. Over-trust may delay the driver’s control in situations requiring driver intervention [46]. Future research is needed to determine the effect of advanced UI on subjective drivers’ factors, such as trust or perceived risk.
Several studies indicated that unnecessary or too much information led to non-significant or negative results. The higher the level of automation, the less effective it seems to be to implement continuous feedback [47]. In addition, contextual information in urgent situations may not be helpful in the handling of urgent driving tasks.
Although not all studies have shown significant positive results, we identify the following benefits of well-designed advanced UI in AVs:
  • Allow drivers to enjoy AV’s advantages while maintaining situation awareness (SA) during automated driving.
  • Present clear alerts, allowing drivers to easily understand the situation and enhance SA quickly when resuming control.
  • Guiding information improves manual driving performance after transitions.
To improve take-over performance, the level of situation awareness needs to be increased. Considering that there are three stages (perception, comprehension, and projection) of SA [6], simple UI signals may only assist in the perception phase. Our review shows benefits of advanced UI that supports the next two stages (i.e., comprehension and projection). UI with vehicle and surrounding information can maintain some level of SA even before the take-over, and advanced UI in HUDs can support a full rebuilding of situation awareness during the transition of control.
During automated driving at Level 3 or higher, drivers do not have to monitor the automation and the road enabling engagement in NDRT. However, drivers need to be ready to resume control when requested. Vehicle and surrounding status information may enhance drivers’ situation awareness and also prevent that drivers’ under-trust or over-trust. Status information allows drivers to understand the driving situation, but further research is needed on how trust in AVs is affected by the UI. In addition, the feedback of the vehicle may not always affect the SA process. Therefore, it should be considered that information may end at the perception level.
When TORs are presented, drivers detect the request, stop the NDRTs, become aware of the situation, and conduct the driving task. Modality and urgency levels affect TOR perception, which leads to the initial reaction. The urgency level describes the situation, incorporated into the TOR signal itself, allowing drivers to perceive an urgent TOR rather than assisting the drivers’ situation awareness. After TOR perception, drivers need time to determine why the transitions should be made and which driving tasks should be carried out. An explanation of the situation is shown to support the comprehension stage of situation awareness. The effectiveness of providing explanations using auditory modalities has been demonstrated [27]. However, the effectiveness of presenting explanations visually needs further research as one study found longer take-over times without measurable improvement of SA [36].
After the TOR, information that supports the transition leads to a safer transition behavior, and information for driving support helps to improve manual driving. AR appears to be useful in that it can project the guiding information directly to the actual road screen. However, this type of information may require additional cognitive processing by the driver. In some cases, advanced or multimodal UIs even induced slightly higher intervention times. Consequently, it seems necessary to be careful in certain situations and to prevent an increase in drivers’ cognitive workload by advanced UI.
Some aspects in the design of a UI for AVs need specific attention. The information should be accurately communicated to drivers. In AVs, sharing the driver’s role with the vehicle reduces the burden of driving. However, this also leads to more complex interactions between the driver and the vehicle. Because different types of information are presented in various ways, the interface should align with the drivers’ understanding of the situation. For example, the reaction time at transition was not significantly shortened when the system state was provided by various color changes in the ambient lighting [48]. This was caused by participants’ misunderstanding of the interface in the experiment.
It has been shown that NDRT devices can be used as an important additional UI in automated vehicles. Several studies successfully integrated TOR in NDRT devices and have shown beneficial effects on acceptance but no significant effects on intervention time. Safety shall have the highest priority in designing a UI, but integrating the NDRT in the design of the UI appears to be an essential prerequisite to come to an acceptable holistic solution. In other words, rather than unconditionally blocking the drivers’ NDRT, it seems reasonable to provide the driving situation, vehicle information, or even the TOR onto the NDRT device. It can help to enhance SA and building trust between driver and vehicle. For emergency situations in which a fast transition is required, it seems to be useful to block NDRT devices.
Several limitations in current methods and knowledge have emerged from this review. First of all, simulation scenarios vary from study to study, making it difficult to generalize results. In addition, different variables have been manipulated. The number of scenarios is also limited in the reported experiments and has not covered all imaginable transition situations. Our review has shown conflicting results over papers in which similar UI concepts were studied. In some papers, UI concepts yielded a positive effect, whereas in other studies, effects were non-significant or even negative. Varying conditions in terms of time budget [14], traffic [2], and secondary task [49] may well explain the reported conflicting results. For example, adding an auditory modality to a visual-only TOR showed time reduction [28,32] or a non-significant difference [31]. Even within one study [24], AR’s effects vary depending on the take-over situation. Hence, we recommend that future research and product developments evaluate UI in a wide range of scenarios covering the essential factors across a range of conditions representing the real-world driving context.
Furthermore, different definitions of take-over time in the studies limited the analysis of how UI elements affected driving behavior. For example, looking ahead and controlling by turning the steering or pushing the brakes are different reactions. It is recommended that at least intervention time, rather than first-gaze time, is reported as a measure of take-over performance. In order to assess the situation awareness in future research, it is essential to analyze the take-over quality because situation awareness cannot be assessed from take-over time. In this review, take-over quality and attention analysis were relatively insufficiently studied because most studies focused on take-over time.
With the development of AVs, we see that drivers are being relieved of the manual driving task, but we also see a need for additional information by the driver before, during and after TOR. The resulting gap between driver safety and usefulness can be narrowed by advanced UI.

Supplementary Materials

The following are available online at https://www.mdpi.com/article/10.3390/info12040162/s1, Table S1: Classification list of studies

Author Contributions

Conceptualization, S.K.; methodology, S.K.; formal analysis, S.K.; writing—original draft preparation, S.K.; writing—review and editing, S.K., R.v.E., and R.H; supervision, R.v.E. and R.H. All authors have read and agreed to the published version of the manuscript.

Funding

This research was funded by the European Union’s Horizon 2020 research and innovation programme, Hadrian under grant number 875597.

Institutional Review Board Statement

Not applicable.

Informed Consent Statement

Not applicable.

Data Availability Statement

Not applicable.

Conflicts of Interest

The authors declare no conflict of interest.

References

  1. SAE International. Taxonomy and Definitions for Terms Related to Driving Automation Systems for On-Road Motor Vehicles (J3016); SAE International: Warrendale, PA, USA, 2018. [Google Scholar]
  2. Gold, C.; Körber, M.; Lechner, D.; Bengler, K. Taking over Control from Highly Automated Vehicles in Complex Traffic Situations. Hum. Factors 2016, 58, 642–652. [Google Scholar] [CrossRef] [PubMed]
  3. Jarosch, O.; Gold, C.; Naujoks, F.; Wandtner, B.; Marberger, C.; Weidl, G.; Schrauf, M. The Impact of Non-Driving Related Tasks on Take-over Performance in Conditionally Automated Driving—A Review of the Empirical Evidence. In Proceedings of the 9th Tagung Automatisiertes Fahren, Munich, Germany, 21–22 November 2019. [Google Scholar]
  4. Naujoks, F.; Befelein, D.; Wiedemann, K.; Neukum, A. A review of non-driving-related tasks used in studies on automated driving. In Advances in Intelligent Systems and Computing; Springer: Cham, Switzerland, 2018; pp. 525–537. [Google Scholar]
  5. Merat, N.; Jamson, A.H.; Lai, F.C.; Daly, M.; Carsten, O.M. Transition to Manual: Driver Behaviour when Resuming Control from a Highly Automated Vehicle; Elsevier Ltd.: Amsterdam, The Netherlands, 2014; pp. 274–282. [Google Scholar]
  6. Endsley, M.R. Toward a Theory of Situation Awareness in Dynamic Systems. Hum. Factors 1995, 37, 32–64. [Google Scholar] [CrossRef]
  7. Mok, B.K.-J.; Johns, M.; Lee, K.J.; Ive, H.P.; Miller, D.; Ju, W. Timing of unstructured transitions of control in automated driving. In Proceedings of the IEEE Intelligent Vehicles Symposium, Seoul, Korea, 28 June–1 July 2015; Institute of Electrical and Electronics Engineers Inc.: New York, NY, USA, 2015. [Google Scholar]
  8. Zhang, B.; de Winter, J.; Varotto, S.; Happee, R.; Martens, M. Determinants of take-over time from automated driving: A meta-analysis of 129 studies. Transp. Res. Part F Traffic Psychol. Behav. 2019, 64, 285–307. [Google Scholar] [CrossRef]
  9. Weaver, B.W.; DeLucia, P.R. A Systematic Review and Meta-Analysis of Takeover Performance During Conditionally Automated Driving. Hum. Factors 2020. [Google Scholar] [CrossRef] [PubMed]
  10. McDonald, A.D.; Alambeigi, H.; Engström, J.; Markkula, G.; Vogelpohl, T.; Dunne, J.; Yuma, N. Toward Computational Simulations of Behavior During Automated Driving Takeovers: A Review of the Empirical and Modeling Literatures. Hum. Factors 2019, 61, 642–688. [Google Scholar] [CrossRef] [PubMed]
  11. Eriksson, A.; Stanton, N.A. Takeover Time in Highly Automated Vehicles: Noncritical Transitions to and From Manual Control. Hum. Factors 2017, 59, 689–705. [Google Scholar] [CrossRef] [PubMed]
  12. Mirnig, A.G.; Gärtner, M.; Laminger, A.; Meschtscherjakov, A.; Trösterer, S.; Tscheligi, M.; McCall, R.; McGee, F. Control transition interfaces in semiautonomous vehicles: A categorization framework and literature analysis. In Proceedings of the AutomotiveUI 2017—9th International ACM Conference on Automotive User Interfaces and Interactive Vehicular Applications, Oldenburg, Germany, 24–27 September 2017; Association for Computing Machinery, Inc.: New York, NY, USA, 2017; pp. 209–220. [Google Scholar]
  13. Kerschbaum, P.; Lorenz, L.; Bengler, K. Highly Automated Driving With a Decoupled Steering Wheel; Highly Automated Driving With a Decoupled Steering Wheel. In Proceedings of the Human Factors and Ergonomics Society 58th Annual Meeting, Chicago, IL, USA, 27–31 October 2014; SAGE Publications: Los Angeles, CA, USA, 2014. [Google Scholar]
  14. Gold, C.; Damböck, D.; Lorenz, L.; Bengler, K. Take over! How long does it take to get the driver back into the loop? In Proceedings of the Human Factors and Ergonomics Society 57th Annual Meeting, San Diego, CA, USA, 30 September–4 October 2013; SAGE Publications: Los Angeles, CA, USA, 2013; pp. 1938–1942. [Google Scholar]
  15. Karray, F.; Alemzadeh, M.; Saleh, J.A.; Arab, M.N. Human-Computer Interaction: Overview on State of the Art. Int. J. Smart Sens. Intell. 2008, 1, 137–159. [Google Scholar] [CrossRef] [Green Version]
  16. Borojeni, S.S.; Chuang, L.; Heuten, W.; Boll, S. Assisting drivers with ambient take-over requests in highly automated driving. In Proceedings of the AutomotiveUI 2016—8th International Conference on Automotive User Interfaces and Interactive Vehicular Applications, Ann Arbor, MI, USA, 24–26 October 2016. [Google Scholar]
  17. Cohen-Lazry, G.; Borowsky, A.; Oron-Gilad, T. The Effects of Continuous Driving-Related Feedback on Drivers’ Response to Automation Failures. In Proceedings of the Human Factors and Ergonomics Society Annual Meeting, Austin, TX, USA, 9–13 October 2017; pp. 1980–1984. [Google Scholar]
  18. Cohen-Lazry, G.; Katzman, N.; Borowsky, A.; Oron-Gilad, T. Directional tactile alerts for take-over requests in highly-automated driving. Transp. Res. Part F Traffic Psychol. Behav. 2019, 65, 217–226. [Google Scholar] [CrossRef]
  19. Eriksson, A.; Petermeijer, S.M.; Zimmermann, M.; De Winter, J.C.F.; Bengler, K.J.; Stanton, N.A. Rolling Out the Red (and Green) Carpet: Supporting Driver Decision Making in Automation-to-Manual Transitions. IEEE Trans. Hum. Mach. Syst. 2019, 49, 20–31. [Google Scholar] [CrossRef] [Green Version]
  20. Forster, Y.; Naujoks, F.; Neukum, A.; Huestegge, L. Driver compliance to take-over requests with different auditory outputs in conditional automation. Accid. Anal. Prev. 2017, 109, 18–28. [Google Scholar] [CrossRef] [PubMed]
  21. Helldin, T.; Falkman, G.; Riveiro, M.; Davidsson, S. Presenting system uncertainty in automotive UIs for supporting trust calibration in autonomous driving. In Proceedings of the 5th International Conference on Automotive User Interfaces and Interactive Vehicular Applications, AutomotiveUI 2013, Eindhoven, The Netherlands, 28–30 October 2013; ACM: New York, NY, USA, 2013. [Google Scholar]
  22. Köhn, T.; Gottlieb, M.; Schermann, M.; Krcmar, H. Improving take-over quality in automated driving by interrupting non-driving tasks. In Proceedings of the 24th International Conference on Intelligent User Interfaces, Los Angles, CA, USA, 16–20 March 2019; ACM: New York, NY, USA, 2019. [Google Scholar]
  23. Kunze, A.; Summerskill, S.J.; Marshall, R.; Filtness, A.J. Automation transparency: Implications of uncer-tainty communication for human-automation interaction and interfaces. Ergonomics 2019, 62, 345–360. [Google Scholar] [CrossRef] [PubMed] [Green Version]
  24. Langlois, S.; Soualmi, B. Augmented reality versus classical HUD to take over from automated driving: An aid to smooth reactions and to anticipate maneuvers. In Proceedings of the IEEE Conference on Intelligent Transportation Systems (ITSC), Rio de Janeiro, Brazil, 1–4 November 2016. [Google Scholar]
  25. Lindemann, P.; Muller, N.; Rigolll, G. Exploring the use of augmented reality interfaces for driver assistance in short-notice takeovers. In Proceedings of the 2019 IEEE Intelligent Vehicles Symposium (IV), Paris, France, 9–12 June 2019. [Google Scholar]
  26. Lorenz, L.; Kerschbaum, P.; Schumann, J. Designing take over scenarios for automated driving: How does augmented reality support the driver to get back into the loop? In Proceedings of the Human Factors and Ergonomics Society 58th Annual Meeting, Chicago, IL, USA, 27–31 October 2014; SAGE Publications: Los Angeles, CA, USA, 2014. [Google Scholar]
  27. Melcher, V.; Rauh, S.; Diederichs, F.; Widlroither, H.; Bauer, W. Take-Over Requests for Automated Driv-ing. Procedia Manuf. 2015, 3, 2867–2873. [Google Scholar] [CrossRef]
  28. Naujoks, F.; Mai, C.; Neukum, A. The Effect of Urgency of Take-Over Requests During Highly Automated Driving Under Distraction Conditions. In Proceedings of the 5th International Conference on Applied Human Factors and Ergonomics AHFE, Krakow, Poland, 19–23 July 2014. [Google Scholar]
  29. Petermeijer, S.; Cieler, S.; De Winter, J. Comparing spatially static and dynamic vibrotactile take-over re-quests in the driver seat. Accid. Anal. Prev. 2017, 99, 218–227. [Google Scholar] [CrossRef] [PubMed]
  30. Petermeijer, S.; Doubek, F.; De Winter, J. Driver response times to auditory, visual, and tactile take-over requests: A simulator study with 101 participants. In Proceedings of the 2017 IEEE International Conference on Systems, Man, and Cybernetics (SMC), Banff, AB, Canada, 5–8 October 2017. [Google Scholar]
  31. Politis, I.; Brewster, S.A.; Pollick, F.E. Language-based multimodal displays for the handover of control in autonomous cars. In Proceedings of the 7th International Conference on Automotive User Interfaces and Interactive Vehicular Applications, Nottingham, UK, 1–3 September 2015; ACM: New York, NY, USA, 2015. [Google Scholar]
  32. Razin, P.; Matysiak, A.; Kruszewski, M.; Niezgoda, M. The impact of the interfaces of the driving automation system on a driver with regard to road traffic safety. In Proceedings of the 12th International Road Safety Conference GAMBIT 2018, Gdansk, Poland, 12–13 April 2018. [Google Scholar]
  33. Roche, F.; Brandenburg, S. Should the urgency of auditory-tactile takeover requests match the criticality of takeover situations? In Proceedings of the IEEE Conference on Intelligent Transportation Systems (ITSC), Maui, HI, USA, 4–7 November 2018. [Google Scholar]
  34. Roche, F.; Somieski, A.; Brandenburg, S. Behavioral Changes to Repeated Takeovers in Highly Automated Driving: Effects of the Takeover-Request Design and the Nondriving-Related Task Modality. Hum. Factors 2019, 61, 839–849. [Google Scholar] [CrossRef] [PubMed]
  35. Telpaz, A.; Rhindress, B.; Zelman, I.; Tsimhoni, O. Haptic Seat for Automated Driving: Preparing the Driver to Take Control Effectively. In Proceedings of the 7th International Conference on Automotive User Interfaces and Interactive Vehicular Applications; Automotive UI 2015, Nottingham, UK, 1–3 September 2015; ACM Publishing: New York, NY, USA, 2015. [Google Scholar]
  36. Beukel, A.P.V.D.; van der Voort, M.C.; Eger, A.O. Supporting the changing driver’s task: Exploration of interface designs for supervision and intervention in automated driving. Transp. Res. Part F Traffic Psychol. Behav. 2016, 43, 279–301. [Google Scholar] [CrossRef]
  37. White, H.; Large, D.R.; Salanitri, D.; Burnett, G.; Lawson, A.; Box, E. Rebuilding Drivers’ Situation Awareness During Take-Over Requests in Level 3 Automated Cars. In Proceedings of the Contemporary Ergonomics & Human Factors, Stratford-upon-Avon, UK, 29 April–1 May 2019. [Google Scholar]
  38. Wintersberger, P.; Riener, A.; Schartmüller, C.; Frison, A.; Weigl, K. Let me finish before I take over: Towards attention aware device integration in highly automated vehicles. In Proceedings of the 10th International ACM Conference on Automotive User Interfaces and Interactive Vehicular Applications, AutomotiveUI 2018, Toronto, ON, Canada, 23–25 September 2018; ACM: New York, NY, USA, 2018. [Google Scholar]
  39. Yang, Y.; Karakaya, B.; Dominioni, G.C.; Kawabe, K.; Bengler, K. An HMI Concept to Improve Driver’s Visual Behavior and Situation Awareness in Automated Vehicle. In Proceedings of the IEEE Conference on Intelligent Transportation Systems, Proceedings (ITSC), Maui, HI, USA, 4–7 November 2018; pp. 650–655. [Google Scholar]
  40. Yoon, S.H.; Kim, Y.W.; Ji, Y.G. The effects of takeover request modalities on highly automated car control transitions. Accid. Anal. Prev. 2019, 123, 150–158. [Google Scholar] [CrossRef] [PubMed]
  41. Seppelt, B.D.; Victor, T.W. Potential Solutions to Human Factors Challenges in Road Vehicle Automation. In Road Vehicle Automation 3; Springer International Publishing: Cham, Switzerland, 2016; pp. 131–148. [Google Scholar]
  42. McGuirl, J.M.; Sarter, N.B. Supporting trust calibration and the effective use of decision aids by presenting dynamic system confidence information. Hum. Factors J. Hum. Factors Ergon. Soc. 2006, 48, 656–665. [Google Scholar] [CrossRef] [PubMed]
  43. Ekman, F.; Johansson, M. Creating Appropriate Trust for Autonomous Vehicles. A Framework For HMI Design. IEEE Trans. Hum.-Mach. Syst. 2015, 48, 95–101. [Google Scholar] [CrossRef]
  44. Heydra, C.G.; Jansen, R.J.; Van Egmond, R. Auditory Signal Design for Automatic Number Plate Recognition System. In Proceedings of the Chi Sparks 2014 Conference, The Hague, The Netherlands, 3 April 2014. [Google Scholar]
  45. Pauzie, A. Head up Display in Automotive: A New Reality for the Driver; Springer: Cham, Switzerland, 2015; pp. 505–516. [Google Scholar]
  46. Miller, D.; Johns, M.; Mok, B.; Gowda, N.; Sirkin, D.; Lee, K.; Ju, W. Behavioral Measurement of Trust in Automation. In Proceedings of the Human Factors and Ergonomics Society Annual Meeting, Prague, Czech Republic, 19–23 September 2016; pp. 1849–1853. [Google Scholar]
  47. Norman, D.A. The ‘problem’ with automation: Inappropriate feedback and interaction, not ‘over-automation’. Philos. Trans. R. Soc. Lond. Ser. B Biol. Sci. 1990, 327, 585–593. [Google Scholar]
  48. Yang, Y.; Götze, M.; Laqua, A.; Dominioni, G.C.; Kawabe, K.; Bengler, K. A method to improve driver’s situation awareness in automated driving. In Proceedings of the 2017 Annual Meeting of the Human Factors and Ergonomics Society Europe Chapter, Rome, Italy, 28–30 September 2017. [Google Scholar]
  49. Yoon, S.H.; Ji, Y.G. Non-driving-related tasks, workload, and takeover performance in highly automated driving contexts. Transp. Res. Part F Traffic Psychol. Behav. 2019, 60, 620–631. [Google Scholar] [CrossRef]
Figure 1. User interface (UI) categorization from an automated vehicle (AV) information perspective.
Information 12 00162 g001
Figure 2. Full text selection process resulting in twenty-five papers.
Information 12 00162 g002
Table 1. Constructs and their definitions of the two categories take-over time and take-over quality defining take-over performance.
CategoryDefinition
Take over time *
First-gaze timeDriver redirects gaze to the forward road
Hands-on timeDriver has hands on the steering wheel
Press button timeDriver presses a specific button
Intervention timeDriver initiates the driving action such as pressing the brake pedal or turning the steering wheel >2 degree
Driving task timeDriver finishes a driving task such as a lane change
Take-over quality
Time to collisionMinimum time towards a forward hazard (minimum distance divided by relative speed)
Lane positioningVehicle lateral movement deviation (Standard deviation of lane position)
Lateral position changeMaximum lateral acceleration/Steering wheel angle
Longitudinal position changeMaximum longitudinal acceleration/Average deceleration
Note. * Take-over time was measured from the start of the TOR.
Table 2. UI category and take-over performance reported in the literature.
No.StudyNNDRTsUI CategoryDependent Factor
1(Borojeni, Chuang et al. 2016) [16]21Tablet 1-back taskGuiding—
Driving support
Intervention time
2(Cohen-Lazry, Borowsky et al. 2017) [17]16GameSurrounding,
Vehicle—Action
Intervention time
3(Cohen-Lazry et al. 2019) [18]27GameGuiding—
Driving support
Intervention time
4(Eriksson, Petermeijer et al. 2019) [19]25Game (tablet)Guiding—
Driving support (AR)
First-gaze time,
Hands-on time,
Intervention time,
Driving task time
5(Forster, Naujoks et al. 2017) [20]17Reading a
magazine
Situation—Additional
explanations
Frist-gaze time,
Hands-on time,
Press button time
6(Helldin, Falkman et al. 2013) [21]57Read paper of eat sweetsVehicle—
System capability
Intervention time
7(Köhn, Gottlieb et al. 2019) [22]53Passive task (Watching)
Active task (Little man task)
SurroundingIntervention time
8(Kunze et al. 2019) [23] 34Searching (tablet)Vehicle—
System capability
Intervention time,
Lateral position change,
Longitudinal position change
9(Langlois and Soualmi 2016) [24]26Video GameGuiding—
Driving support (AR)
Hands-on time,
Press button time,
Intervention time,
Lateral position change
Longitudinal position change
10(Lindemann, Muller et al. 2019) [25]18Game (tablet)Guiding—
Driving support (AR)
Intervention time,
Lane positioning,
Lateral position change
11(Lorenz, Kerschbaum et al. 2014) [26]46Surrogate
Reference Task (Center console)
Guiding—
Driving support (AR)
First-gaze time,
Hands-on time
Intervention time,
Lane positioning
Lateral position change,
Longitudinal position change
12(Melcher, Rauh et al. 2015) [27]44Game (smart phone)Simple informationIntervention time
13(Naujoks, Mai et al. 2014) [28]16Reading magazinesSimple informationHands-on time,
Lane positioning,
Lateral position change
14(Petermeijer, Cieler et al. 2017) [29]18N-back taskSimple informationHands-on time,
Intervention time,
Driving task time,
Lane positioning,
Lateral position change
15(Petermeijer, Doubek et al. 2017) [30]101Reading/Calling/ WatchingSimple informationFirst-gaze time,
Intervention time,
Driving task time,
Lane positioning,
Lateral position change
16(Politis, Brewster et al. 2015) [31]21Game (tablet)Simple information,
Situation—
Urgency level
Press button time,
Lane positioning
17(Razin, Matysiak et al. 2018) [32]30-Simple informationIntervention time
18(Roche and Brandenburg 2018) [33]52Game (tablet)Situation—
Urgency level
Intervention time
19(Roche, Somieski et al. 2019) [34]40Game (tablet)Simple informationIntervention time,
Time to collisionLane positioning,
Lateral position change
20(Telpaz, Rhindress et al. 2015) [35]26TextingGuiding—Driving supportIntervention time,
Driving task time
21(van den Beukel, van der Voort et al. 2016) [36]37Watching,
Reading
Simple information
Situation—
Additional explanations
Intervention time,
Time to collision
22(White, Large et al. 2019) [37]49Chosen activitiesVehicle—System capability,
Guiding—Transition support
Intervention time, Lane positioning
23(Wintersberger, Riener et al. 2018) [38]18TextingSimple informationIntervention time,
Time to collision
24(Yang et al. 2018) [39]50Smart phoneSurrounding
Vehicle—Action
Intervention time,
Time to collision,
Lane positioning
Lateral position change,
Longitudinal position change
25(Yoon, Kim et al. 2019) [40] 20No-task/Calling/Smart phone/Video watchingSimple informationHands-on time,
Press button time
Table 3. Take-over time of modality studies (times are given in seconds).
StudyNDRTDependent FactorVisualAuditoryTactileA + VA + TT + VA + T+VSignificant
Difference
(Petermeijer, Doubek et al. 2017) [30]Reading/Calling/WatchingFirst-gaze time 1.941.571.44 A < V/T < V
Intervention time 2.291.541.47 A <V/T < V
(Politis, Brewster et al. 2015) [31]Tablet GameMean Press button time6.912.242.852.122.322.372.21A,AT,AV,TV,ATV < T < V
(Yoon, Kim et al. 2019) [40]WatchingHands on time1.841.611.641.31.31.541.26A,T,AV,AT,VT,AVT < V
Press button time2.422.232.181.972.051.881.95A,AV,AT,VT,AVT < V
(Naujoks, Mai et al. 2014) [28]ReadingHands on time6.19 2.29 AV < V
(Razin, Matysiak et al. 2018) [32]-Intervention time 9.46 3.84 5.64No mention but significant
(Roche, Somieski et al. 2019) [34]Tablet gameIntervention time 3.24 4.61 A < AV
(van den Beukel, van der Voort et al. 2016) [36]Watching/ReadingIntervention time 4.32 4.88
(Visual: icon)
5.31
(Visual:light)
A < AV
Note. A: Auditory, T: Tactile, V: Visual.
Table 4. Example information types in advanced UI.
WhenInformationExampleRelated Study
Automated drivingVehicle system capability- Display the sensor detection accuracy level[21,23,37]
Vehicle action- Alert “Increasing speed to 130 km/h”
- Display intended lane change direction
[17,39]
Surrounding- Display the surrounding view or hazards
- Alert “Vehicle approaching from behind”
[17,22,39]
With TORAdditional
explanations
- Alert “Unclear lane ahead, please take over soon“
- Display ‘Steering wheel holding’ symbol with TOR
- Display a danger point motivating the TOR in AR
[20,36]
[19,24,25,26]
Urgency level- High urgency: Alert “Danger! Collision Imminent, You have control!”
- Low urgency: Alert “Notice! Toll ahead, Want to take over?”
[31,33]
Right after
TOR
Transition support- Display “Check for hazards” message[37]
Driving support- Directional steering light indicating lane change direction
- Display lane to be changed in AR
[16,35]
[19,24,25,26]
Table 5. Augmented reality (AR) information.
AR UIPresent the DangerGuide the Manual Driving
(Lorenz, Kerschbaum et al. 2014) [26]AR RedO-
AR Green-O (Carpet trajectory)
(Langlois and Soualmi 2016) [24]AR-O (Arrow direction)
(Lindemann, Muller et al. 2019) [25]AROO (Carpet trajectory)
(Eriksson, Petermeijer et al. 2019) [19]Sphere conditionO-
Carpet condition-O (Available road)
Arrow condition-O (Arrow direction)
Publisher’s Note: MDPI stays neutral with regard to jurisdictional claims in published maps and institutional affiliations.

