Article

Analysis of the Temporal and Spatial Characteristics of Material Cultural Heritage Driven by Big Data—Take Museum Relics as an Example

1
Chongqing Geomatic and Remote Sensing Center, Chongqing 401147, China
2
School of Geosciences and Info-Physics, Central South University, Changsha 410083, China
*
Author to whom correspondence should be addressed.
Information 2021, 12(4), 153; https://doi.org/10.3390/info12040153
Submission received: 16 March 2021 / Revised: 1 April 2021 / Accepted: 3 April 2021 / Published: 6 April 2021
(This article belongs to the Section Information Processes)

Abstract

:
Museum cultural relics represent a special material cultural heritage, and modern interpretations of them are needed in current society. Based on the catalogue data of cultural relics published by the State Administration of Cultural Heritage, this paper analyzes the continuity and intermittentness of cultural relics in time series by using the method of continuity judgment of cultural relics, analyzes the aggregation and migration of cultural relics in space by using the method of spatial analysis, and then uses cosine similarity to explain the similarity distribution in space and time. The results show that the overall distribution of cultural relics exhibits the characteristics of class aggregation, dynasty aggregation and regional aggregation. From the perspective of a time scale, cultural relics have different “life cycles”, displaying continuity, intermittentness, and similarity. From the perspective of a spatial scale, the cultural relic distribution forms a small “cultural communication circle”, showing aggregation, migration, and similarity. The temporal and spatial distribution of cultural relics exhibited more similar characteristics among dynasties that were closer together than those that were far away.

1. Introduction

With a long history of 5000 years and a colorful ancient civilization, China has accumulated a cultural heritage with great variety, quantity, and value. According to the provisions of UNESCO [1,2], there are various types of cultural heritage, which can be divided into two categories: tangible cultural heritage and intangible cultural heritage. The tangible cultural heritage includes immovable historical buildings, museums, cultural relics, movable paintings, murals, and furniture. Therefore, as a special tangible cultural heritage, museum cultural relics carry the long history and culture of mankind and are the testimony of human survival and development. Regulations on Museums issued by the Chinese government in 2015 state the following [3]: “The museum is an important window to showcase human civilization, promote cultural exchanges, and satisfy the spirit and culture of citizens,” Li said, “Museum relics are important witnesses of society, economy and culture in different periods, and are of great significance to the study of China’s material and cultural heritage in different periods.”
China has attached great importance to the protection of cultural heritage in every period. Through understanding China’s protection of cultural heritage [4], it was discovered that after 1949, with the establishment of the People’s Republic of China, China has gradually paid more attention to the protection of cultural heritage through the formation of laws and corresponding institutions. In the early period, scholars mainly explored the issue of cultural heritage from a qualitative perspective, and their focus were largely on the protection of cultural heritage and refined to agricultural cultural heritage [5,6], architectural cultural heritage [7,8], ancient villages [9,10], etc. However, with the rise of historical GIS [11,12,13], the study of cultural heritage has shifted from a qualitative study to a combination of qualitative and quantitative research, but scholars have mostly focused on the spatial distribution of cultural heritage, not only lacking quantitative analysis of its chronological evolution but also neglecting the study of the historical culture reflected behind it. Among others, the museum, as an important place to carry history and culture, as well as a special material cultural heritage, is of great significance to the research. However, previous scholars have conducted profound discussions on the significance, role, education, management of museums, and the influence of museums on regional culture [14,15], but they have neglected the research into museum cultural relics with a strong historical atmosphere.
The advent of the explosive era of network big data [16,17,18] has made it easier for us to obtain public data sets, the forms of data sources for cultural heritage research have become more abundant, and the research dimensions are no longer restricted to spatial distribution. Some scholars even carry out interdisciplinary cooperation and are no longer constrained to study cultural heritage from a single data source or a single explanatory angle. With the rise of machine learning and deep learning, research into cultural heritage has entered a new stage. Although the development of technology has gradually enriched the research related to cultural heritage, there is still a lack of research into the special time-series cultural heritage of museum cultural relics, and the discussion of the physical meaning behind it has also been neglected. At the same time, the quantification of cultural heritage has always been a key and difficult point: how to combine the multidimensional characteristics of cultural heritage to carry out a more comprehensive numerical quantification is the focus of attention.
The purpose of this paper is to study the spatial and temporal distribution characteristics of China’s material cultural heritage. Take the example of cultural heritage data of museums as a starting point, combining the multidimensional characteristics of museum cultural relics to carry out numerical quantitative analysis, in order to reflect the spatial and temporal patterns of the dynastic culture behind them. This paper uses the continuity discriminant method of cultural heritage to analyze the continuity and intermittentness of cultural heritage in time series. The standard deviation ellipse and PageRank [19] method are adopted to explore the aggregation and migration of cultural relics in space. Combined with their multidimensional attributes, this paper explains the spatial and temporal similarity distribution of cultural relics by constructing vectors and using cosine similarity method. Based on the conventional time analysis, this paper provides a judgment method for exploring the continuity and intermittentness of time-series data of cultural relics, and explores the spatial and temporal distribution from the angle of vectors with the help of cosine similarity, which are of reference significance for studying the spatial and temporal distribution characteristics of China’s material cultural heritage.
The structure of this paper is as follows: Section 2 describes the work related to this study. Section 3 describes the data sources and methods used in this article, including the discriminant formula of continuity and discontinuity, standard deviation ellipse, and cosine similarity. Section 4 analyzes the temporal and spatial characteristics of museum cultural relics. Section 5 is the conclusion and discussion of the work.

2. Related Work

Most of the previous research into cultural heritage was focused on protection strategies, mainly based on qualitative descriptions. Liu Linzi [20] proposed the digitization of intangible cultural heritage with public libraries as the starting point, and discussed the preservation and dissemination of “Guqin”; JIANG Lili [21] used cartography to analyze ancient Chinese maps and discussed their historical, scientific, and artistic value, which are very rare relics of cultural heritage providing an important reference for the development of cultural heritage. Through the first systematic survey of Xinjiang’s geological heritage, Huang Song [22] confirmed that insufficient coordination between protection and development is the main reason for the backward protection of Xinjiang’s geological heritage. He also proposed a solution of six main protection steps, including determining the protection type, protection form, protection mode, protection level, protection sequence and determining the protection area.
However, with the development of historical GIS, research methods have changed from qualitative to quantitative. Scholars have used cultural heritage data such as intangible cultural heritage [23,24], traditional villages [25,26], ancient landscapes [27], human relics [28,29], street names [20,30], etc., combined with GIS spatial analysis methods to discuss the temporal and spatial distribution and influencing factors. Y Ding [31] analyzed the temporal and spatial distribution of Zhejiang’s national intangible cultural heritage and found that it showed a tendency gathering, and its temporal and spatial distribution was affected by the development of Zhejiang’s natural geographic environment and historical culture. DJ Liu [32] analyzed the spatial distribution characteristics and spatial autocorrelation of traditional villages with spatial analysis methods and found that the spatial distribution density of ethnic traditional villages was greatly affected by geographical environmental factors. Li Zhongxuan [33] discussed the influence of climate on the formation of the unique regional culture of Longshan in Henan Province based on human sites and climate data. Wu Li [34] studied the temporal and spatial distribution of prehistoric culture in Zhejiang and found that the climate environment was an important factor in the development, expansion, and contraction of prehistoric culture in Zhejiang, and had an important impact on the distribution, spread, and evolution of culture. However, most of the above-mentioned studies only discussed about the temporal and spatial distribution of cultural heritage, and could not measure the temporal and spatial distribution characteristics of cultural heritage in specific numerical values, and there was a lack of analysis of the historical culture behind it.
With the advent of the era of big data and the computer era, data and research methods related to cultural heritage have become more abundant. Nesreen [35] used a machine learning approach that generates adversarial networks, and optimizes training through clustering, to generate the method for repairing images of damaged artwork. Janković R [1] used four different image classification methods to classify cultural heritage, performing with high accuracy in a large number of data sets, and greatly reduced the computational cost caused by the amount of calculation. Yasser A [36] combined a digital approach and machine learning methods to preserve cultural heritage, and provided new ideas for the related exhibition and dissemination of cultural heritage. J Llamas [37] introduced deep learning to the classification task of cultural heritage, interpreting and classifying a large number of images of cultural heritage, and evaluating the use of deep learning techniques for analyzing cultural heritage images.
At the same time, compared to the traditional visualization based on GIS spatial analysis, the visualization research of cultural heritage at this stage has incorporated more new elements and become more comprehensive. Huibin Li [38] took mural paintings as the research object of cultural heritage protection. Considering the various risks to which the mural is now exposed, a visualization analysis method based on the risk management process was proposed, to evaluate the mural paintings from multiple perspectives and scales, providing practical suggestions for the protection of cultural heritage. Jiawan Zhang [39] also performed research into the protection of murals, but used multidimensional visualization technology to visually analyze the degradation of murals, identify and understand the degradation patterns of murals, to discover the patterns of temporal and spatial degradation, which can help cultural heritage experts to preserve grotto murals to the greatest extent. Faced with the rapid growth of cultural data, V. Deufemia [40] invented an interactive visualization system that could simultaneously discover and learn from textual documents, pictures and drawings related to rock carvings, in order to explain abnormal vehicle inspections and new insights. Although the advent of new technologies has made the study of cultural heritage more diversified, the above-mentioned works still lack the analysis of the historical culture behind the cultural heritage.

3. Materials and Methods

3.1. Materials

The main data (http://www.1937china.com/views/kzww/kzww_xxcx.html, assecced on 5 April 2021) set of this paper was the list of cultural relics published by the National Cultural Heritage Administration, which was obtained with the help of the Scrapy method in the python web crawler. The data was saved in excel format. The data on museum collections mainly includes the museum where the collection is located, the name of the collection, the type of collection, the age of the collection, and the provincial division of the collection. In this paper, the collection was divided into 21 dynasties according to the age of the collection: 31 inland regions of China according to the provincial divisions of the collection (except for Taiwan Province, Hong Kong Administrative Region, and Macao Administrative Region); and 35 categories of cultural relics according to the type of the collection, such as rubbings of rubbings, specimen fossils tooth bone horns and so on. For simplicity, this paper abbreviates the dynasty, category, and region of the cultural relics, which can be seen in Appendix A.
The data adopted in this paper exhibited a certain deviation, and the specific reasons for the error can be discussed in terms of the following three aspects. One is the data integrity. The digitization process of the National Collection Museum is still constantly being updated. The museum cultural relic data used in this paper only represents a part of all cultural relic data, with certain deficiencies. However, partial data has no actual impact on the distribution characteristics of cultural relics. Second, the error of the data itself is an issue. Because the digitization process of museums in different places is inconsistent, the classification of cultural relics in different museums boasts certain partiality and subjectivity. For example, some museums classify both porcelain and pottery as objects in the pottery category, which can lead to small discrepancies in the number of objects in different regions. However, since this paper does not involve the study of the distribution of cultural relics in different regions, the errors caused by museum classification preference can be ignored. Third, is the error caused by objective factors. With the passage of time, the earlier the cultural relics are, the more difficult it is to be preserved. Therefore, the distribution of cultural relics in different dynasties displays a large deviation. The deviation of data caused by objective factors may cause slight differences in the overall distribution of cultural relics in different dynasties. However, by analyzing the overall distribution characteristics of cultural relics, this paper finds that the Zhou Dynasty and the Han Dynasty are far apart from each other, but the total proportion of cultural relics is relatively high. Therefore, the conclusions of this paper are still universal under the influence of objective factors.

3.2. Methods

3.2.1. Continuity and Intermittentness

The temporal distribution of cultural relics of different categories varies greatly. This paper explores the temporal distribution of cultural relics by describing their continuity and intermittentness. The discriminant index is defined as follows:
C = c i n × m m i ,
G = g i n × m m i ,
In the formula, C represents the continuity, where the higher the value, the better the continuity of cultural relics, and the more obvious the continuity; G represents the discontinuity, where the higher the value, the more obvious the intermittentness. n represents the whole research stage, and in this paper, 21 dynasties are taken as the longest continuous dynasties; and c i refers to the longest continuous time of a certain cultural relic in the whole research stage. Similarly, g i represents the longest intermittent dynasties, which refers to the longest continuous time of a certain cultural relic in the whole research stage. m i refers to the number of segments of a certain cultural relic, which is caused by the fault of cultural relics during the whole research stage, the more segments, the worse the continuity of cultural relics and the more obvious the intermittentness of cultural relics. Continuity and intermittentness, respectively, examine the continuous and intermittent characteristics of cultural relics. It is an independent calculation, investigating the characteristics of the cultural relics’ time series. This formula is applicable to all time-series data with attributes. m is the maximum number of segments. In this paper, the maximum number of segments among all the values of 35 categories is 21.

3.2.2. Standard Deviation Ellipse

In order to study the mobility of the spatial distribution of cultural relics, the standard deviation ellipse method is used in this paper [41,42], to analyze the center of the gravity migration direction of the spatial distribution of cultural relics in different dynasties. The center of gravity of the ellipse indicates the relative position of a cultural relic in the spatial distribution, where the azimuth indicates the main trend direction of the distribution of cultural relics; the long axis represents the degree of cultural relic dispersion in the main trend direction; and the short axis represents the degree of cultural relic dispersion in the secondary direction, namely the range of the cultural relic data distribution. The greater the difference between the values of the long and short axes, the more obvious the directivity of the data will be; in contrast, the closer the two values are, the less obvious the directivity will be.
To determine the standard deviation ellipse, the center of the circle should be calculated as follows
S D E x = i = 1 n ( x i x ¯ ) 2 n
S D E y = i = 1 n ( y i y ¯ ) 2 n
where; S D E x , S D E y are the X , Y axe corresponding to the center of the ellipse, x i , y i are the coordinates of the i sub-region; ( x ¯ , y ¯ ) represents the center of gravity of the region; and n is the number of subregions. Secondly, the direction of the ellipse should be determined. The direction is based on the X axis, and the direction due north is 0 degrees. The calculation formula is as follows:
tan θ = A + B C
A = ( i = 1 n x ˜ i 2 i = 1 n y ˜ i 2 )
B = ( i = 1 n x ˜ i 2 i = 1 n y ˜ i 2 ) 2 + 4 ( i = 1 n x ˜ i 2 y ˜ i 2 ) 2
C = 2 i = 1 n x ˜ i y ˜ i
where; θ is the rotation angle, and x ˜ i , y ˜ i represents the deviation between the coordinates of the i region and the center of gravity. Finally, the major axis and half axis of the ellipse should be determined, and the formula is as follows:
σ x = 2 i = 1 n ( x ˜ i sin θ y ˜ i cos θ ) 2 n
σ y = 2 i = 1 n ( x ˜ i sin θ + y ˜ i cos θ ) 2 n

3.2.3. Cosine Similarity

Cosine similarity [43] is a method employed to evaluate the similarity between two vectors by calculating the cosine value of the angle between them. This paper takes 21 dynasties and 31 regions as research nodes, constructing node vectors based on the attributes of cultural relics, and uses the cosine similarity method from the perspective of vectors to measure the similarity distribution characteristics of cultural relics in time and space. The calculation formula of cosine between two vectors is as follows:
s i m i l a r i t y = i = 1 n A i × B i i = 1 n A i 2 × i = 1 n B i 2
where; A i , B i respectively represent the components of the A , B vector, and A , B 0 .

3.2.4. PageRank

The PageRank is a link analysis algorithm based on the search system created by the founder of Google in 1997. It was originally used by Google to identify the importance of web pages. The main idea is to use the number of links in a webpage to perform link analysis. The more links a webpage has, the more important the webpage is. The PageRank algorithm includes quantitative and qualitative assumptions. The quantitative assumption refers to the number of in-links being proportional to the importance of web pages. The qualitative assumption is that the higher the quality of the in-link web page, the more important the web page. This paper is based on the number assumption of the PageRank algorithm. For a webpage A, its PR value calculation formula is:
P R ( A ) = ( 1 d ) + d ( P R ( T 1 ) / C ( T 1 ) + + P R ( T n ) / C ( T n ) )
where; P R ( A ) is the PR value of page a; P R ( T i ) is the PR value of page T i , and page T i refers to a certain page among all pages of A; C ( T i ) is the out-degree of page T i , which refers to the number of edges that T i points to other pages; d is the damping coefficient, which refers to the probability that the user will continue to browse backwards after reaching a certain page. The PR value of each dynasty is calculated by the above formula until the convergence condition is reached. The PageRank algorithm in this paper is implemented by python.

4. Results and Discussion

4.1. General Characteristics of Cultural Relics

The cultural relics of different dynasties have categories and regional attributes. This paper selected 21 dynasties as the research stage and employed statistics on the total number of cultural relics, percentage of total cultural relics, maximum value of total cultural relics, and corresponding categories of 21 dynasties (Table 1). It can be seen that the overall distribution of cultural relics across time shows aggregation of dynasties, categories, and regions.
From the perspective of the time-series distribution of the cultural relics, the distribution of the cultural relics is concentrated in a few prosperous dynasties. Among them, the dynasties with a highest total number were Qing Dynasty, Republic of China, Han Dynasty, Song Dynasty, Ming Dynasty, Zhou Dynasty. They account for 41.5 percent, 10.8 percent, 10.01 percent, 8.16 percent, 7.55 percent and 6.80 percent of the total cultural relics; respectively, representing 84.82 percent of the total cultural relics.
In terms of the overall distribution of cultural relics, the large numbers of cultural relics are found in a few categories, such as porcelain, coins, bronze ware and pottery. Among them, there are seven dynasties with porcelain, five dynasties with coins, and two dynasties with bronze ware. In addition, the maximum number of corresponding categories of the Xia, Shang, Jin, Song, and Yuan dynasties accounts for nearly half or more of the total amount of cultural relics of that dynasty, indicating that cultural relics of different dynasties exhibited a kind of aggregation.
From the perspective of the regional distribution of the overall cultural relics, the maximum number of different dynasties of relics were basically concentrated in Beijing, Shanghai, Gansu province, Heilongjiang province, Hubei province, and other more developed regions with a long history, while one of the six dynasties were of Beijing, and Shanghai, Gansu province, Heilongjiang province, respectively, corresponding to two dynasties. Therefore, cultural relics as a whole showed spatial aggregation in terms of the regional distribution, which was mainly inclined to the north.

4.2. Temporal Characteristics of Cultural Relics

4.2.1. Continuity and Intermittentness

  • “Life Cycle” of Cultural Relics
In this paper, the continuous and intermittent processes of different types of cultural relics in different dynasties are defined as the “life cycle” of the cultural relics. By counting the number of dynasties in the different categories of cultural relics, the distribution characteristics of cultural relics in the time series are preliminarily judged. Due to the data deviation, in order to uniformly measure the number of dynasties where each category emerged, the total number of cultural relics in a category of less than five was regarded as a classification error, and was not included in the total number. The cultural relics “life cycle” is shown in the diagram (Figure 1), where the horizontal axis is the dynasty; and the vertical axis represents the different categories.
Among others, the longest continuous dynasty and the longest intermittent dynasty of each type of cultural relic can determine the continuity and intermittentness of the time-series distribution of the cultural relics of that category. The larger the value of the longest continuous dynasty and the longer the continuous time, the more obvious the continuity characteristics of the cultural relic will be, and the more universal the cultural relic of this kind will be. The larger the value of the longest continuous dynasty, the more obvious the intermittentness, and the more obvious the intermittent characteristics of cultural relics and their particularity are. As shown in Figure 1, first of all, the “life cycle” of each type of cultural relic is greater than 1; that is, all categories of cultural relic show a certain continuity. Secondly, bronze ware, pottery, stone carvings, brick, and tiles appeared in all dynasties, with the longest continuous time and the most obvious continuous features, while stamp products, audio-visual products and relics of celebrities were the three categories of cultural relics with the most obvious intermittent features. Through the interpretation of the “life cycle” diagram of cultural relics, different categories of cultural relics can be classified by their continuity and intermittentness.
2.
Discrimination of continuity and intermittentness
In order to quantify the distribution characteristics of cultural relics on the time scale, this paper measures them by discriminating formulas of continuity and intermittentness (Table 2). The continuity and intermittentness of cultural relics almost coexist, but bronze ware, pottery, stone carving, brick and tiles only display continuity and lack intermittentness. That is to say, these three categories of cultural relics have good universality in different dynasties. The categories of cultural relics can be divided into three types according to their quantitative values of continuity and intermittentness. The first one is that the continuity is greater than the intermittentness, and there is a large gap, that is, the categories of cultural relics mainly show continuity. Pottery, bronze ware, sculpture, coins, and imperial seals are representative of continuity. The “life cycle” of cultural relics is more continuous and long-lasting. The second is that the intermittentness is greater than the continuity, and the gap is large, that is, the cultural heritage category mainly presents intermittent. For example, for bones, audio and video products, bills, stamp products, relics of celebrities, and other representatives with an intermittent nature, corresponding to the cultural relics of the “life cycle” with poor continuity, the continuity is longer. Third is that the continuity and intermittent value difference is small, for example, for jade stone gemstones, weapons, weighing apparatus, glass, etc., and for the corresponding cultural relics of the “life cycle” intermittent and continuity characteristics appear alternately, and the value of intermittentness is higher.
3.
Background interpretation of continuity and intermittentness
Different categories of cultural relics in terms of continuity and intermittent characteristics are closely related to their historical background. This article chose pottery as representative of cultural relics with similar characteristics, stamps, oracle bones as representatives of the culturally intermittent characteristic, and jade, stone and gems as representative of the intermittentness of cultural relics and alternate reliability characteristics, for background reading.
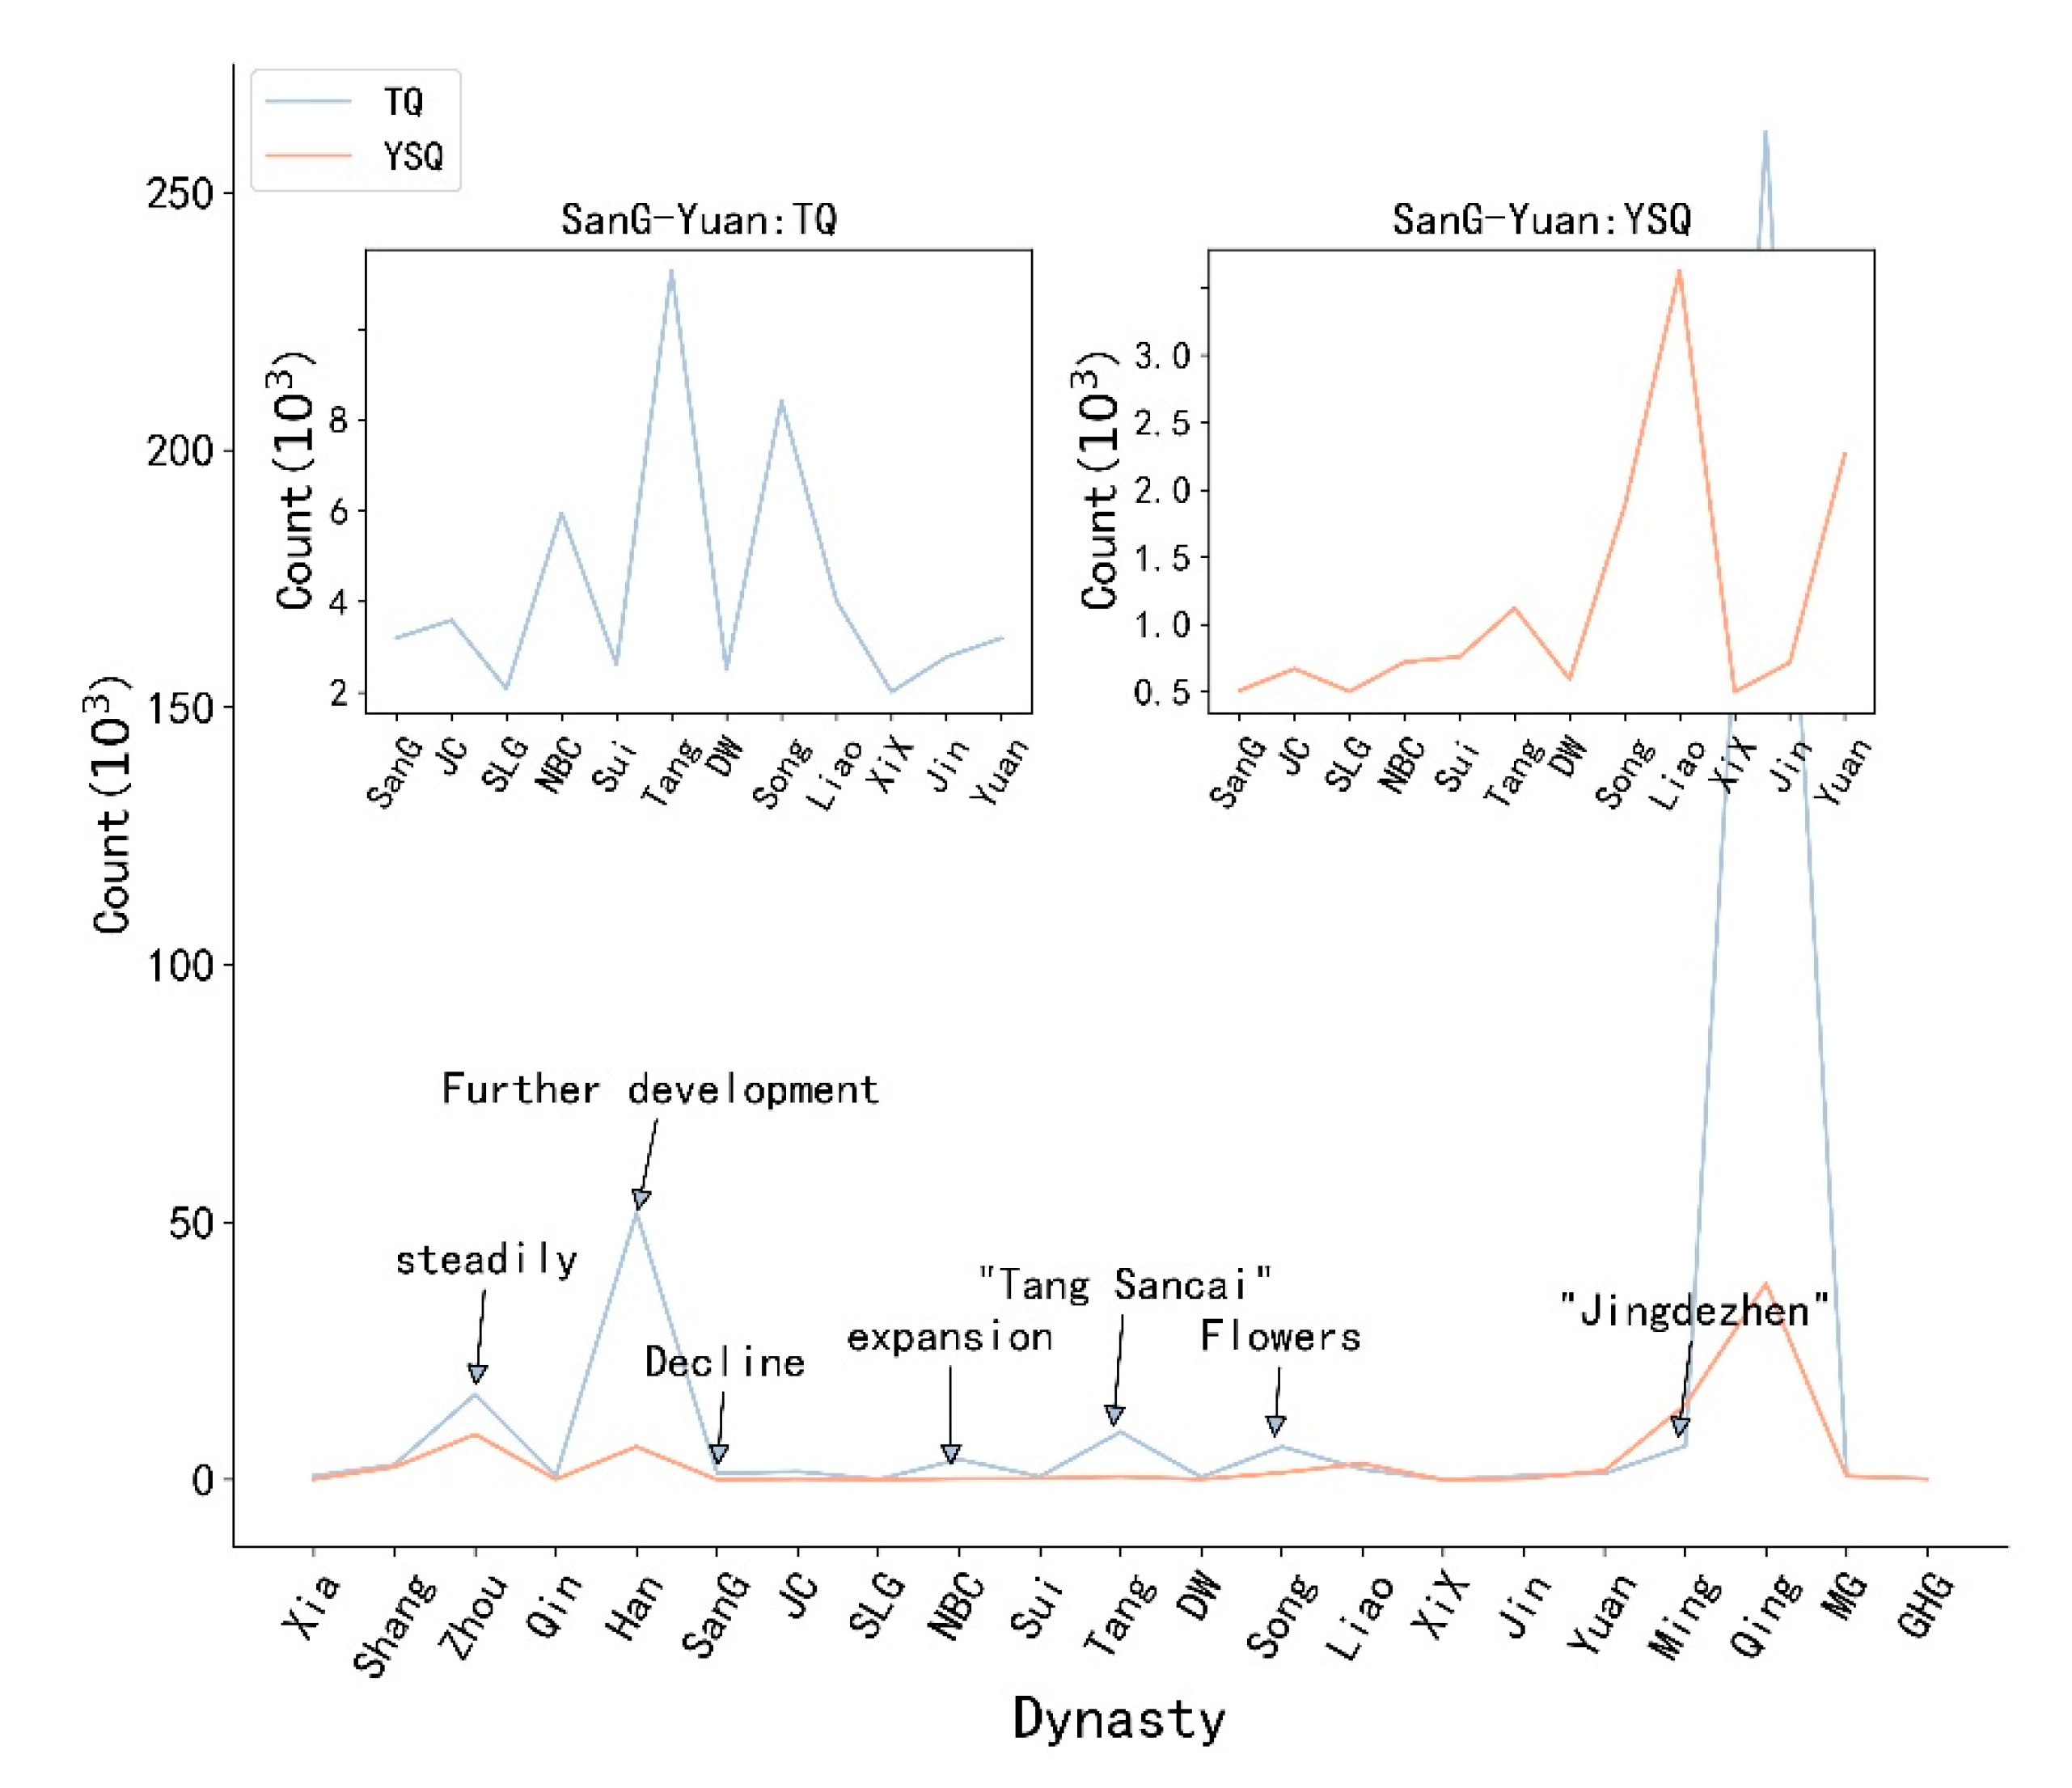
By marking the important turning points of pottery in different dynasties, the background interpretation of its continuity characteristics can be explored (Figure 2). The sub-diagram shows the temporal distribution changes from The Three Kingdoms period to the Yuan Dynasty. Pottery appeared in the Neolithic age. In the Xia, Shang, and Zhou dynasties, pottery entered a stage of stable development as a common tool for daily life. In the early Han Dynasty, pottery was further developed due to social stability, agricultural prosperity, and the booming of handicraft industry. In the Northern and Southern Dynasties, the number of ceramics increased further due to the expansion of production areas. The Tang Dynasty was famous for its special “tri-colored glazed pottery”, mainly featuring a large number of figures and animal statues, forming the unique pottery culture of the Tang Dynasty. During the Liao, Song, and Jin dynasties, the variety of porcelain became more and more abundant, forming a prosperous scene of making porcelain. During the Yuan, Ming, and Qing dynasties, Jingdezhen became the center of China’s ceramics industry, and colorful ceramics became a new development trend.
China is known as the “country of jade”. Jade and stone in Xia and Zhou dynasties were ceremonial implements, mostly in the form of animals and imaginary gods. The Spring and Autumn period and the Warring States Period were transitional periods for the development of jade and stone. In the Han and Jin dynasties, the shapes were flexible, and the upper nobility used “burying jade” on a much larger scale than in the past. Due to the split of the political power, traffic congestion and other reasons, the Wei, Jin and Southern and Northern Dynasties gradually went to the trough. The Tang and Song dynasties tended to be secular and folk in nature. Jade, stone, and gems were mostly used in daily life, as well as for appreciation. Additionally, the style was dominated by natural themes, with a fresh life atmosphere and significant fashion. During the Liao and Jin dynasties, the aesthetic tastes of ethnic minorities were mostly based on hunting, which had unique cultural characteristics. Against the background of commodity economic prosperity in the Yuan and Ming dynasties, jade and gems were more widely used. The Yuan Dynasty was good at deep carving technology, while the Ming Dynasty boasted rough and steel manufacturing, known as “Rough and bright”. The Qing Dynasty was overelaborate and delicate, representing the development of a craft level.
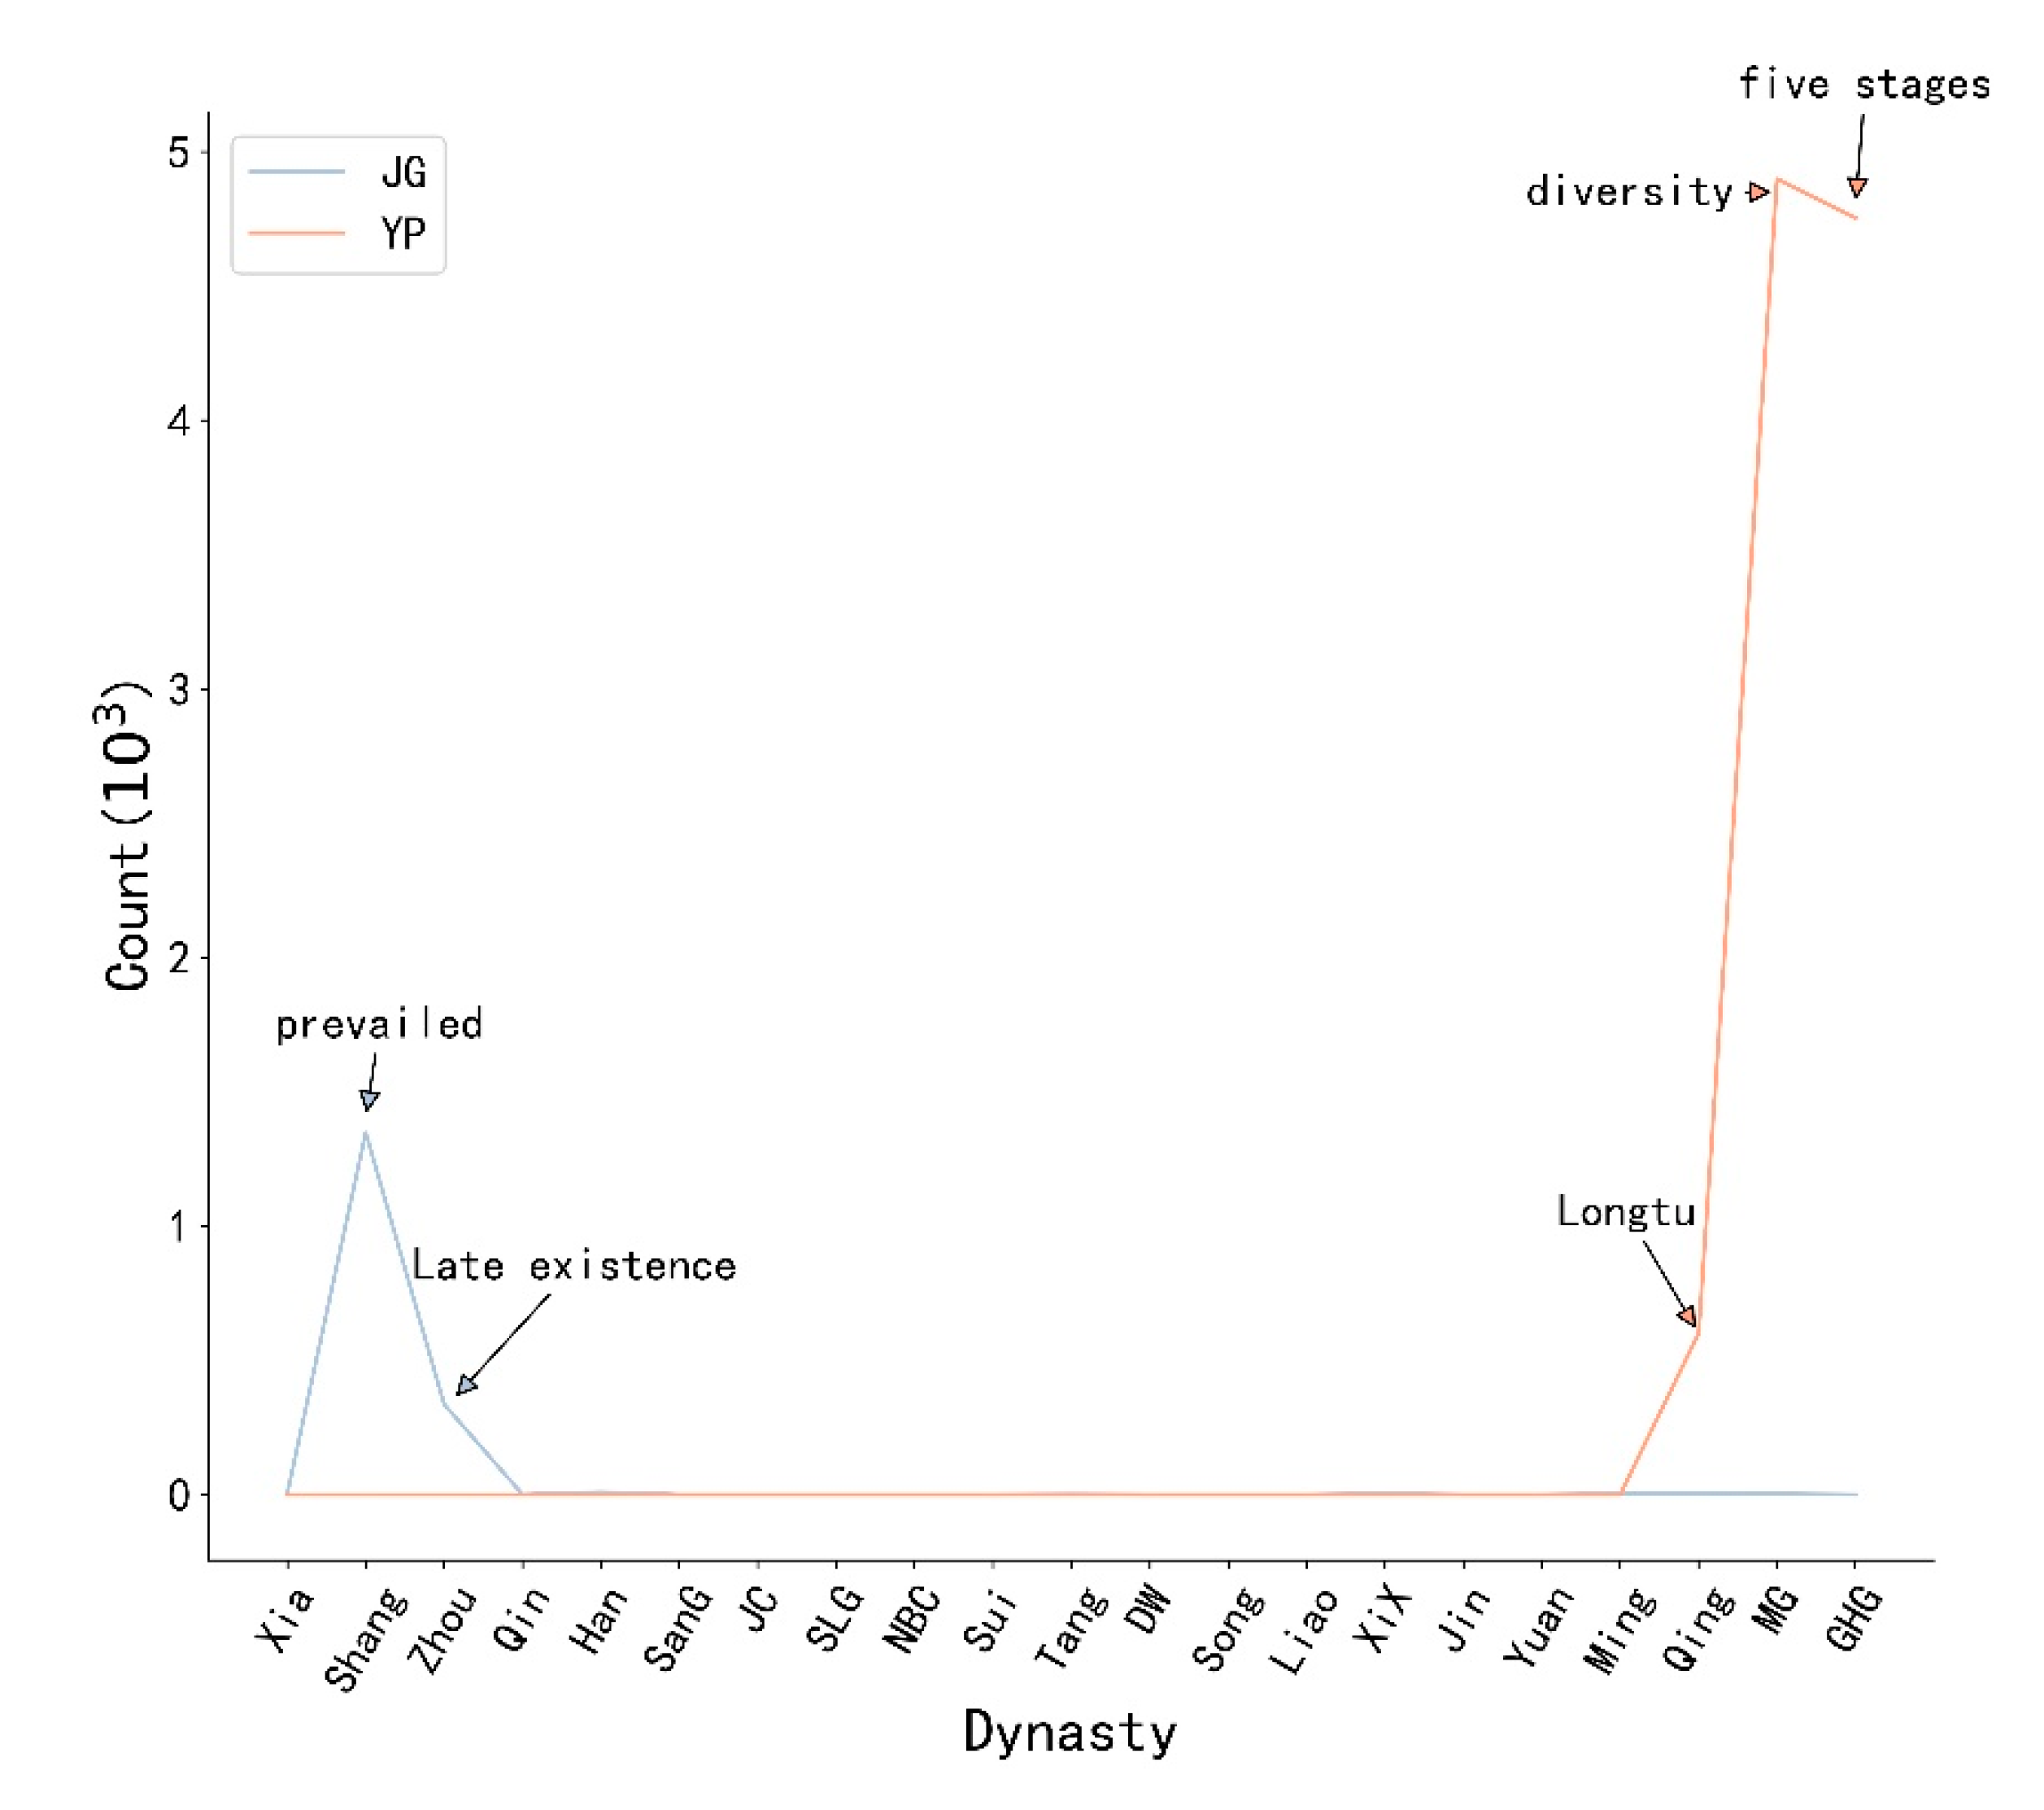
Most of the oracle bones only appeared in the Shang and Zhou dynasties, which lasted for a short time. Stamp products were emerging products with development over time, and only exhibit continuity in the special historical background. As shown in Figure 3, oracle bones were first discovered in the Neolithic Period, prevailed in the Shang Dynasty, and existed until the early Zhou Dynasty or later. The discovery of oracle bone inscriptions showed Chinese characters and even the world recognized Chinese Civilization advance to the Shang Dynasty, greatly contributing to our understanding of the history and culture of the Shang Dynasty. In the Qing Dynasty, most stamp products appeared as a “dragon chart”, which represented the supremacy of imperial power. In the Republic of China, stamp products gradually diversified. After the founding of the New China, stamp products passed through five different stages of development and became more and more abundant.

4.2.2. Similarity

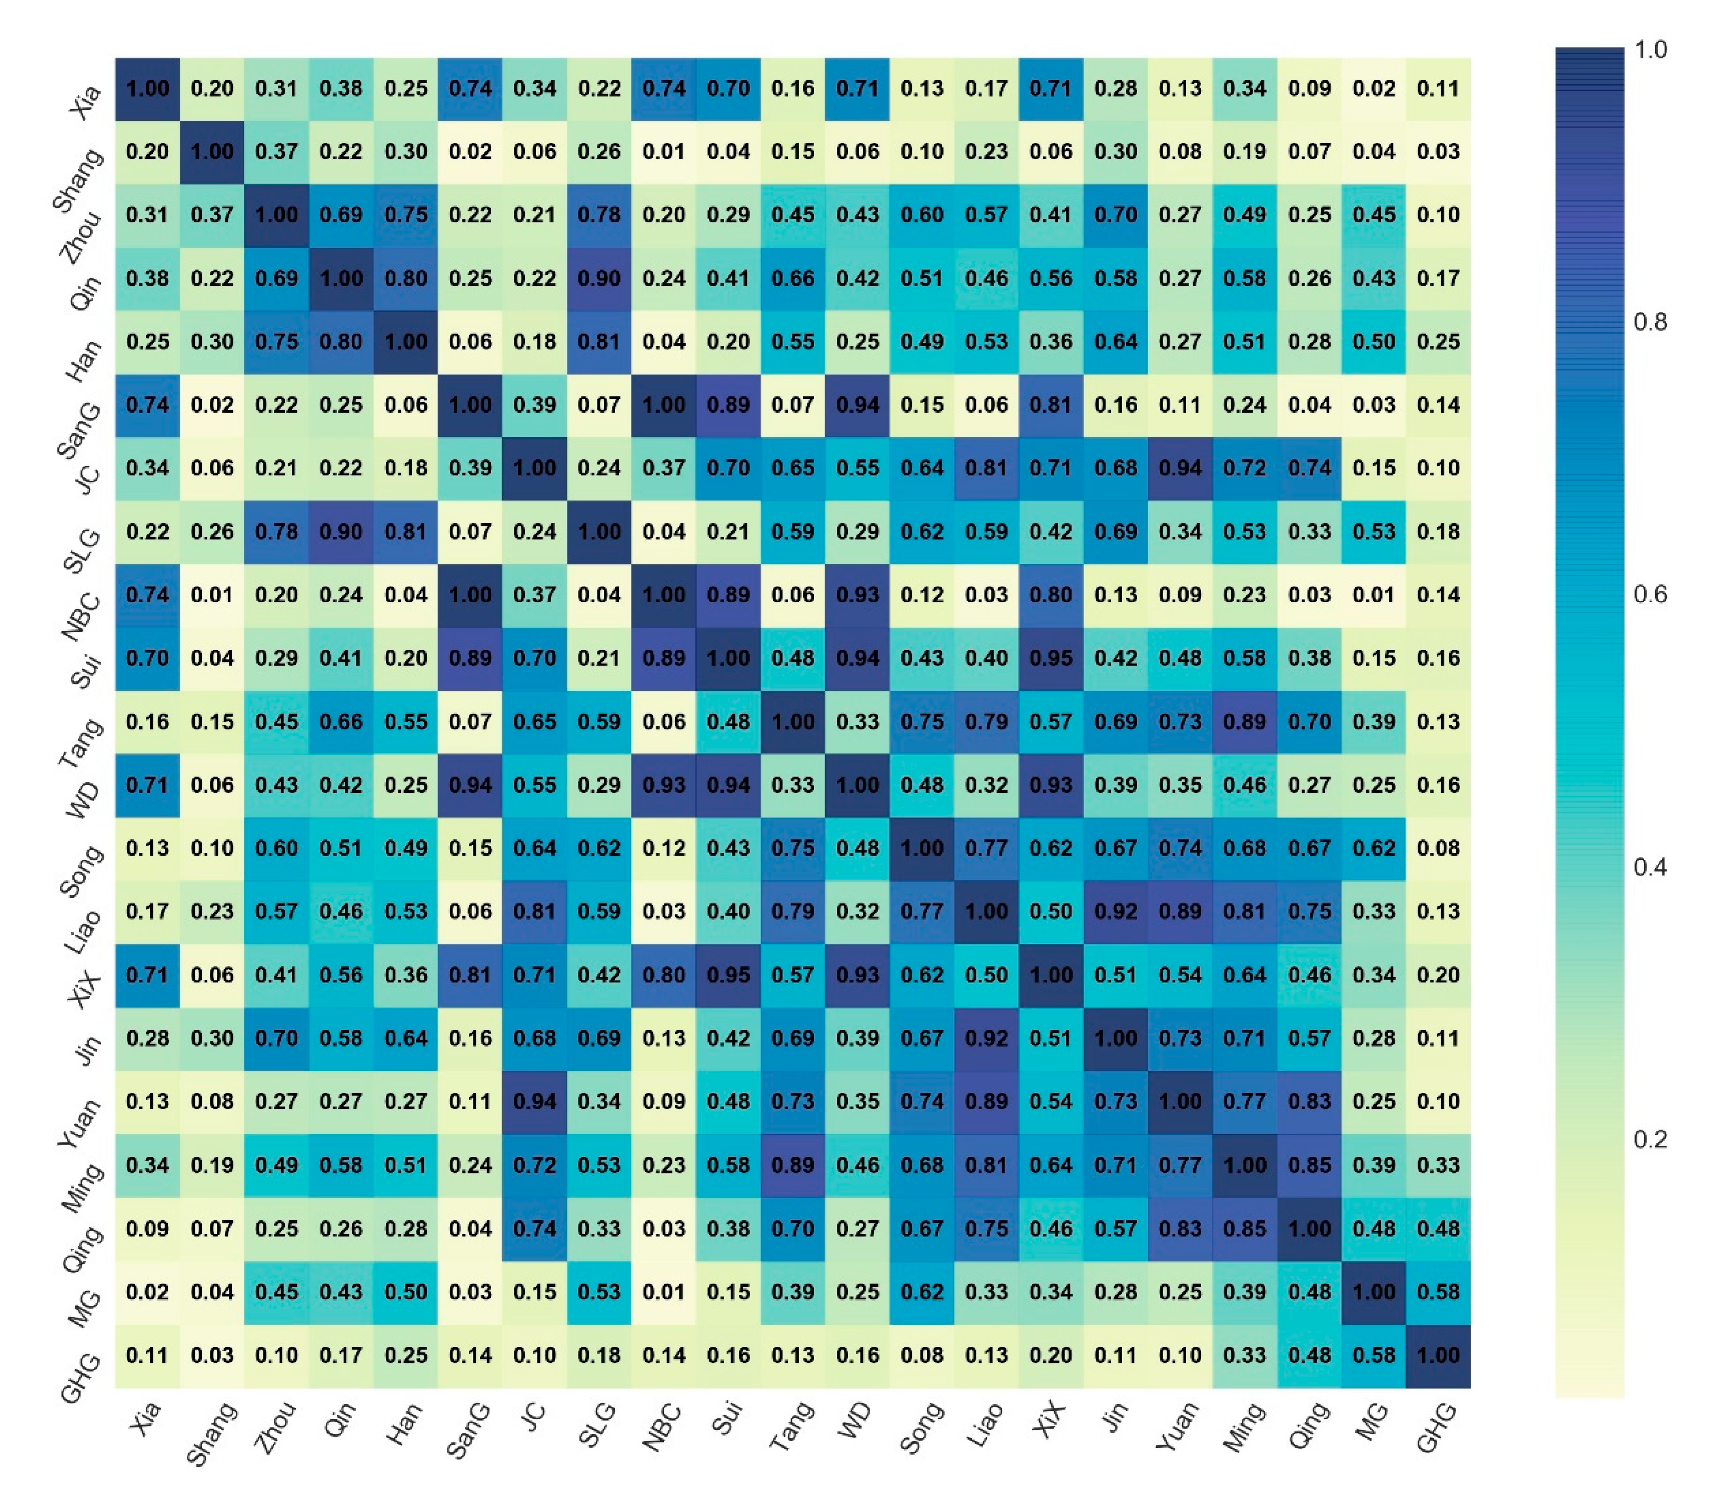
Taking different dynasties as nodes and the distribution of different types of cultural relics of dynasties as the attributes of the node, a dynasty node vector was constructed. A 21 × 35 vector matrix was constructed, using the cosine similarity formula to calculate the similarity between vectors; exploring its distribution law on a time scale. The result is shown in Figure 4.
The values near the main diagonal showed an obvious distribution trend of “nine grids”, which indicated that the similarity values between the vectors of similar dynasties would be higher. For example, the “nine Palaces” composed of the Zhou, Qin, and Han dynasties had values of 0.69, 0.75, and 0.8, respectively. As another example, the matrix formed by the Song dynasty and the Qing Dynasty exhibited a high similarity. In addition, most of the time, the similarity between the dynasties that were close to each other was higher than that between dynasties that were far apart. In other words, when the dynasties were close to each other, the similarity of cultural relics was more obvious.
Due to the deviation of the data distribution, the similarity between dynasties with a large difference in the total amount of cultural relics was also high, because there was a certain inclusion relationship between dynasties with a large amount of cultural relics and those with a small amount of cultural relics, which led to a high similarity between them. For example, the similarity between the Xia dynasty and the Northern and Southern Dynasties was 0.74, and the similarity between the five dynasties, ten States and the Northern and Southern Dynasties was 0.93.

4.3. Regional Characteristics of Cultural Relics

4.3.1. Aggregation and Migration

4.
“Cultural Communication Circle”
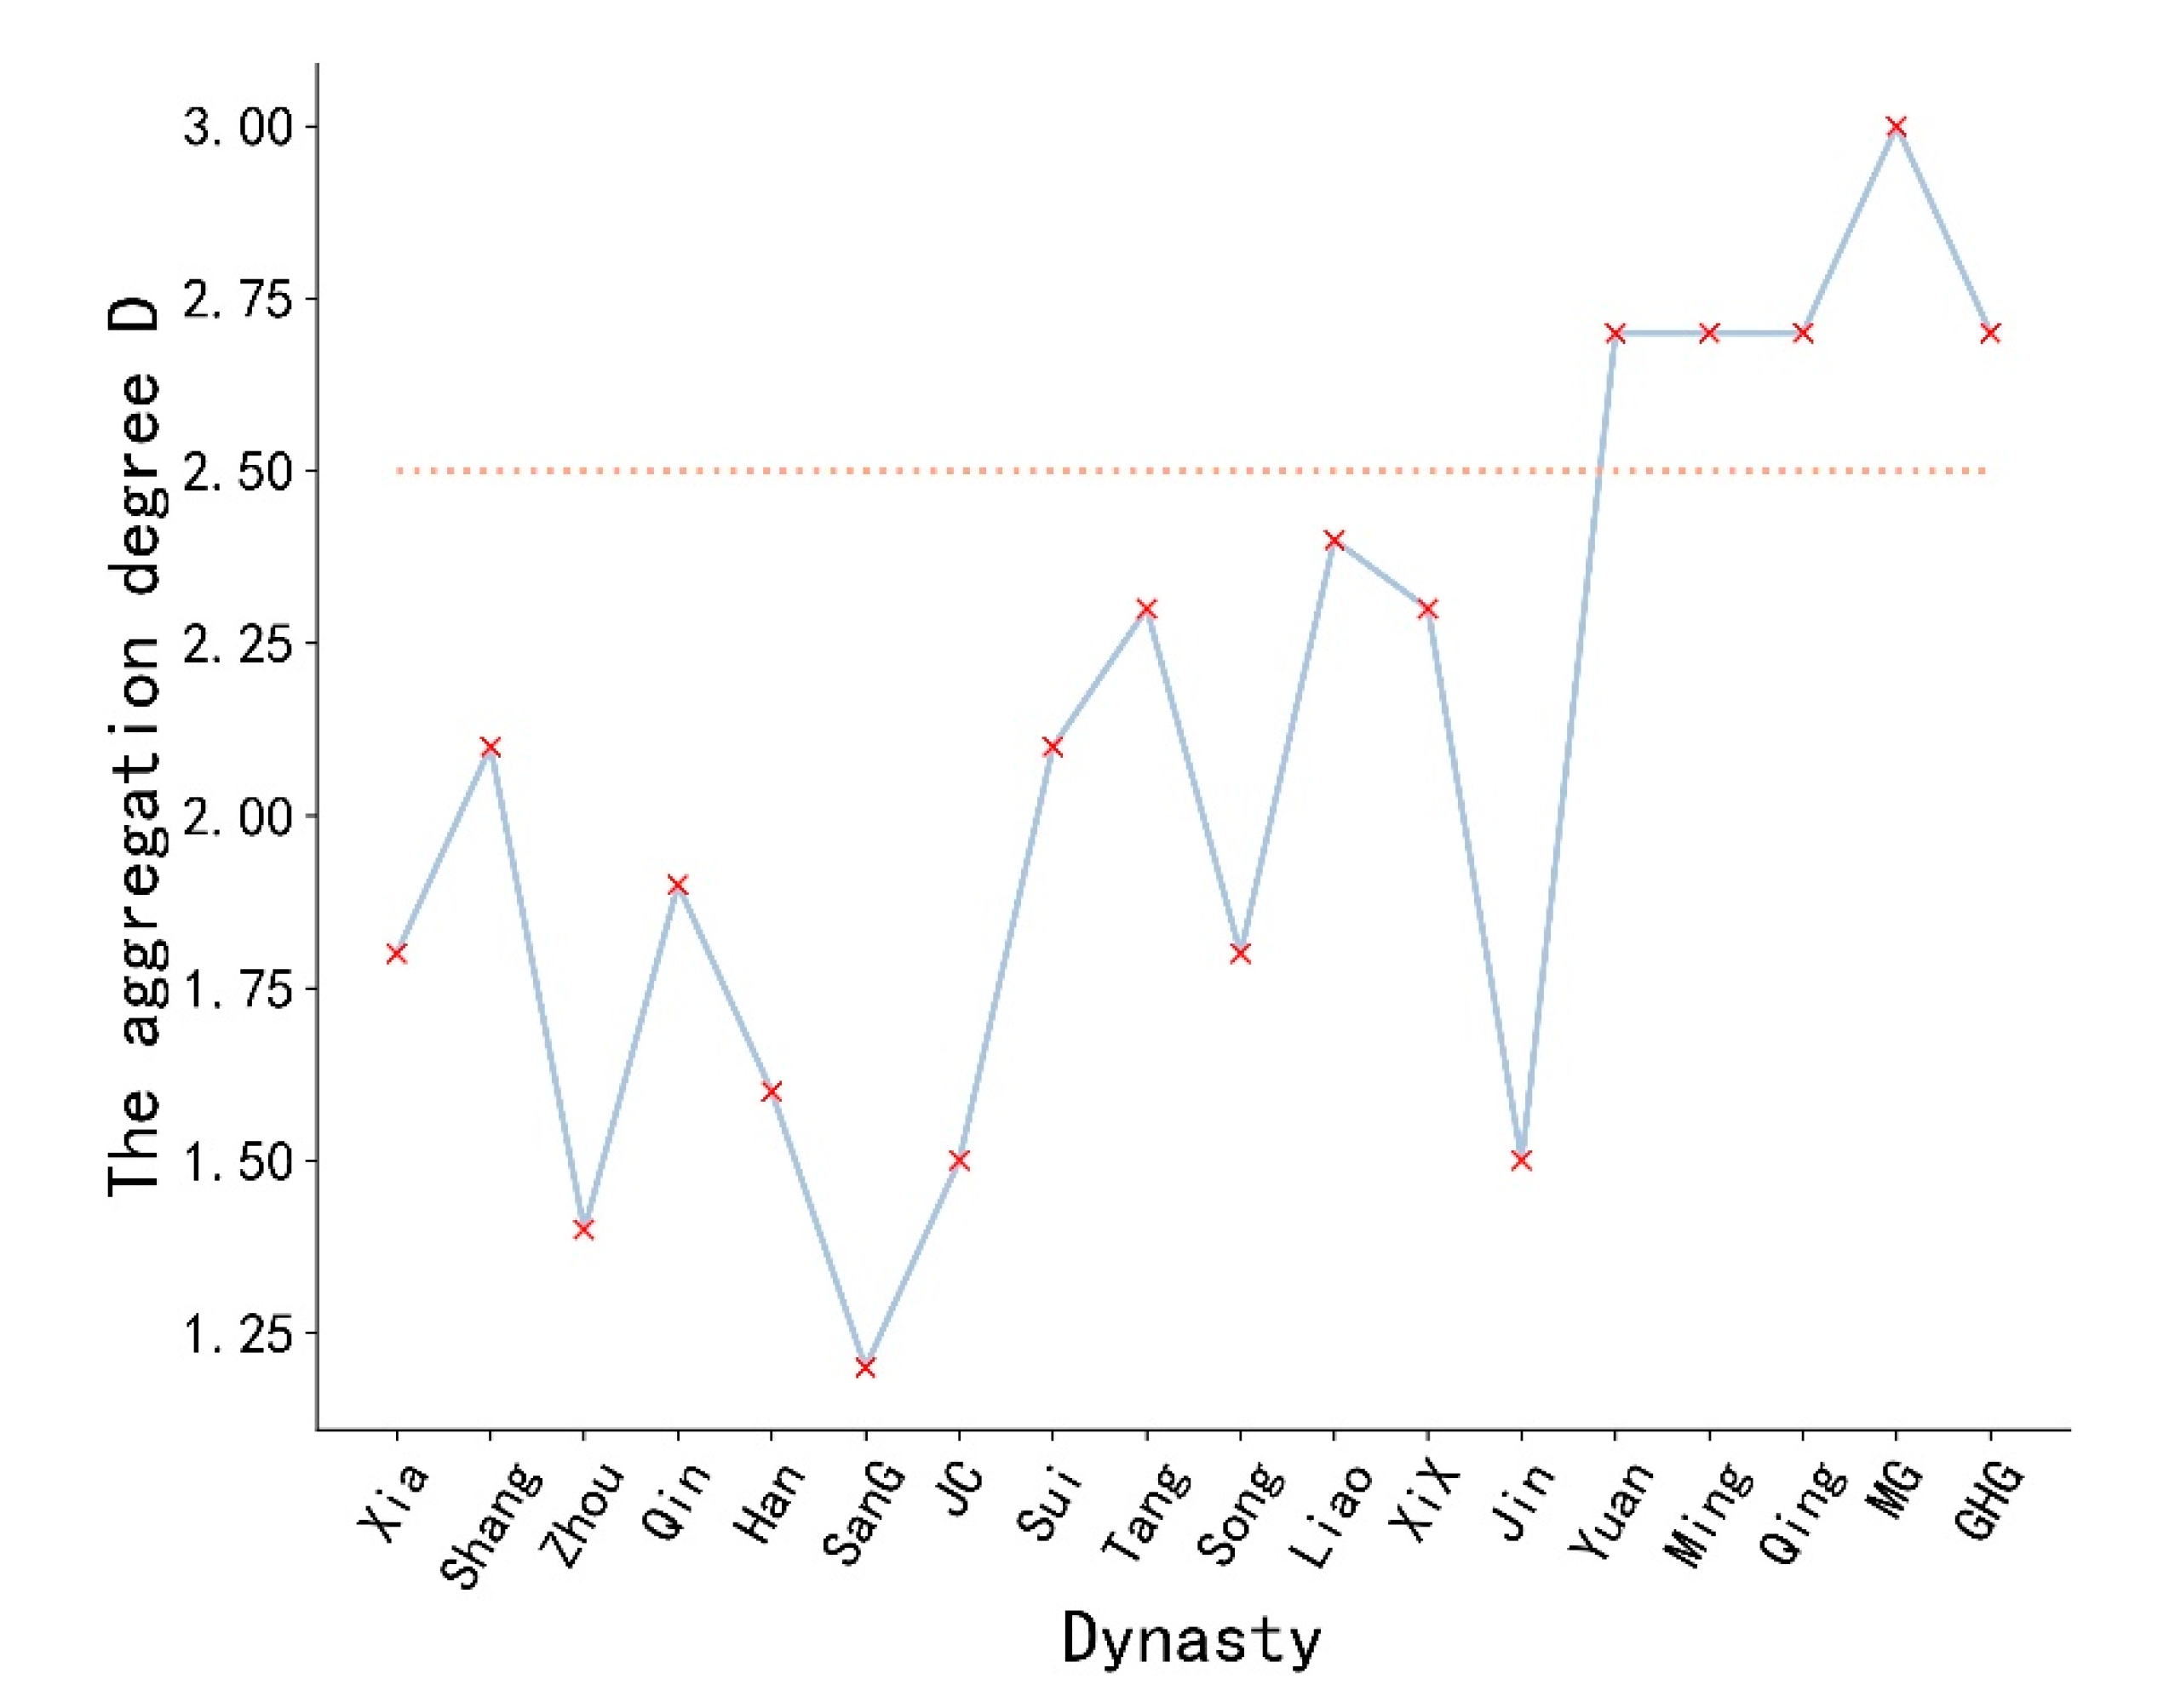
In order to characterize the spatial distribution of cultural relics, this study calculated the region corresponding to the top ten ranking of the number of cultural relics in each dynasty and its geographical adjacency relationship with its dynasty capital. The average value of the geographical adjacency relationship was used as the aggregation degree of its spatial distribution, which was represented by the letter D (Figure 5). Among other things, the geographical adjacency relationship was defined as the geographical location relationship between two regions on the map of China’s inland provinces. If there was more than one capital in a dynasty, the capital with the closest geographical location was taken as a reference in the statistical geographical adjacency relation. Since there were many vassal states of the Sixteen States, the Northern and Southern Dynasties, the Five Dynasties and the Ten States, it was impossible to conduct a one-to-one comparison with their capitals, so this paper only selected 18 other dynasties for statistical analysis.
In Figure 5, the aggregation degree of most dynasties was lower than 2.5; that is, they were mainly located near the first- or second-order neighborhood of the capital of their dynasties. Starting from the Yuan Dynasty, the geographical distribution scope was slightly expanded, which was related to the territorial area of the Yuan Dynasty and the increased mobility of cultural relics in the later period. In this study, the spatial distribution of the top ten cultural relics of the different dynasties was graded and displayed by the natural segmentation method (Figure 6). The areas framed in blue in the Figure represent the capital of the dynasty, and the colors from red to blue represent the gradual increase of the number of cultural relics. Taking the capital of the dynasty as the center, the spatial distribution of its cultural relics showed obvious circle clustering, mainly in the geographical adjacent areas of the first or second order of the capital of the dynasty. Cultural relics were spread in a small range of the “cultural communication circle”. Among them, the more important the nodes in the “cultural communication circle”, the more favorable the influence on the communication would be.
5.
Significance discrimination of nodes in the “cultural communication circle”
Taking the region of the capital of the dynasty as the starting node, and the top ten regions of all other dynasties as the terminating node, a capital-region “connection” was constructed. The 9 capitals corresponding to 18 dynasties were Beijing, Henan, Shaanxi, Zhejiang, Shanxi, Sichuan, Ningxia Hui Autonomous Region, Liaoning, and Jiangsu. The PageRank algorithm was used to calculate the importance of the regional departure nodes in the “cultural communication circle”. The results were 0.035 in Shanxi Province, 0.209 in Henan Province, 0.156 in Shaanxi Province, 0.017 in Sichuan Province, 0.047 in Jiangsu Province, 0.035 in Zhejiang Province, 0.022 in Liaoning Province; and Ningxia, 0.093 for Hui Autonomous Region and 0.315 for Beijing. As Beijing, Henan Province, and Shaanxi Province contained most of the capitals of the previous dynasties, their nodes became more important to the current dynasty’s “cultural communication circle”.
The departure point highlighted the importance of the capital of a dynasty to its “cultural communication circle”, but other areas adjacent to the capital as its termination point also had a positive impact on it. In this study, the importance of the termination nodes was measured by the total number of nodes pointing to each region (Figure 7). The vertical axis represents the nodes in each termination region, while the horizontal axis represents the number of times that the capitals of each dynasty connected the nodes in the termination region. The different colors represent departure nodes in different capitals. The larger the value is, the more times the region was connected, and the greater its contribution to the “cultural communication circle” of each dynasty.
The figures of Beijing, Heilongjiang, Hubei, Shaanxi, Anhui, Jilin and Shanghai were relatively large. First, they showed that the total number of cultural relics of the dynasties collected in these regions was relatively large. Second, the cultural relics in the corresponding region belonged to many dynasties, and the cultural relics in this region had a large time span, which reflected the historical and cultural significance in this region. Third, it was found that the scope of “cultural communication circle” was mainly in the north, which was closely related to the political power center in the north. The spatial distribution of cultural relics in different dynasties was mainly concentrated in the north and near the first-order or second-order neighborhood of the capital of the dynasty, and the spatial distribution of cultural relics displayed aggregation.
6.
The mobility of weapons as cultural relics
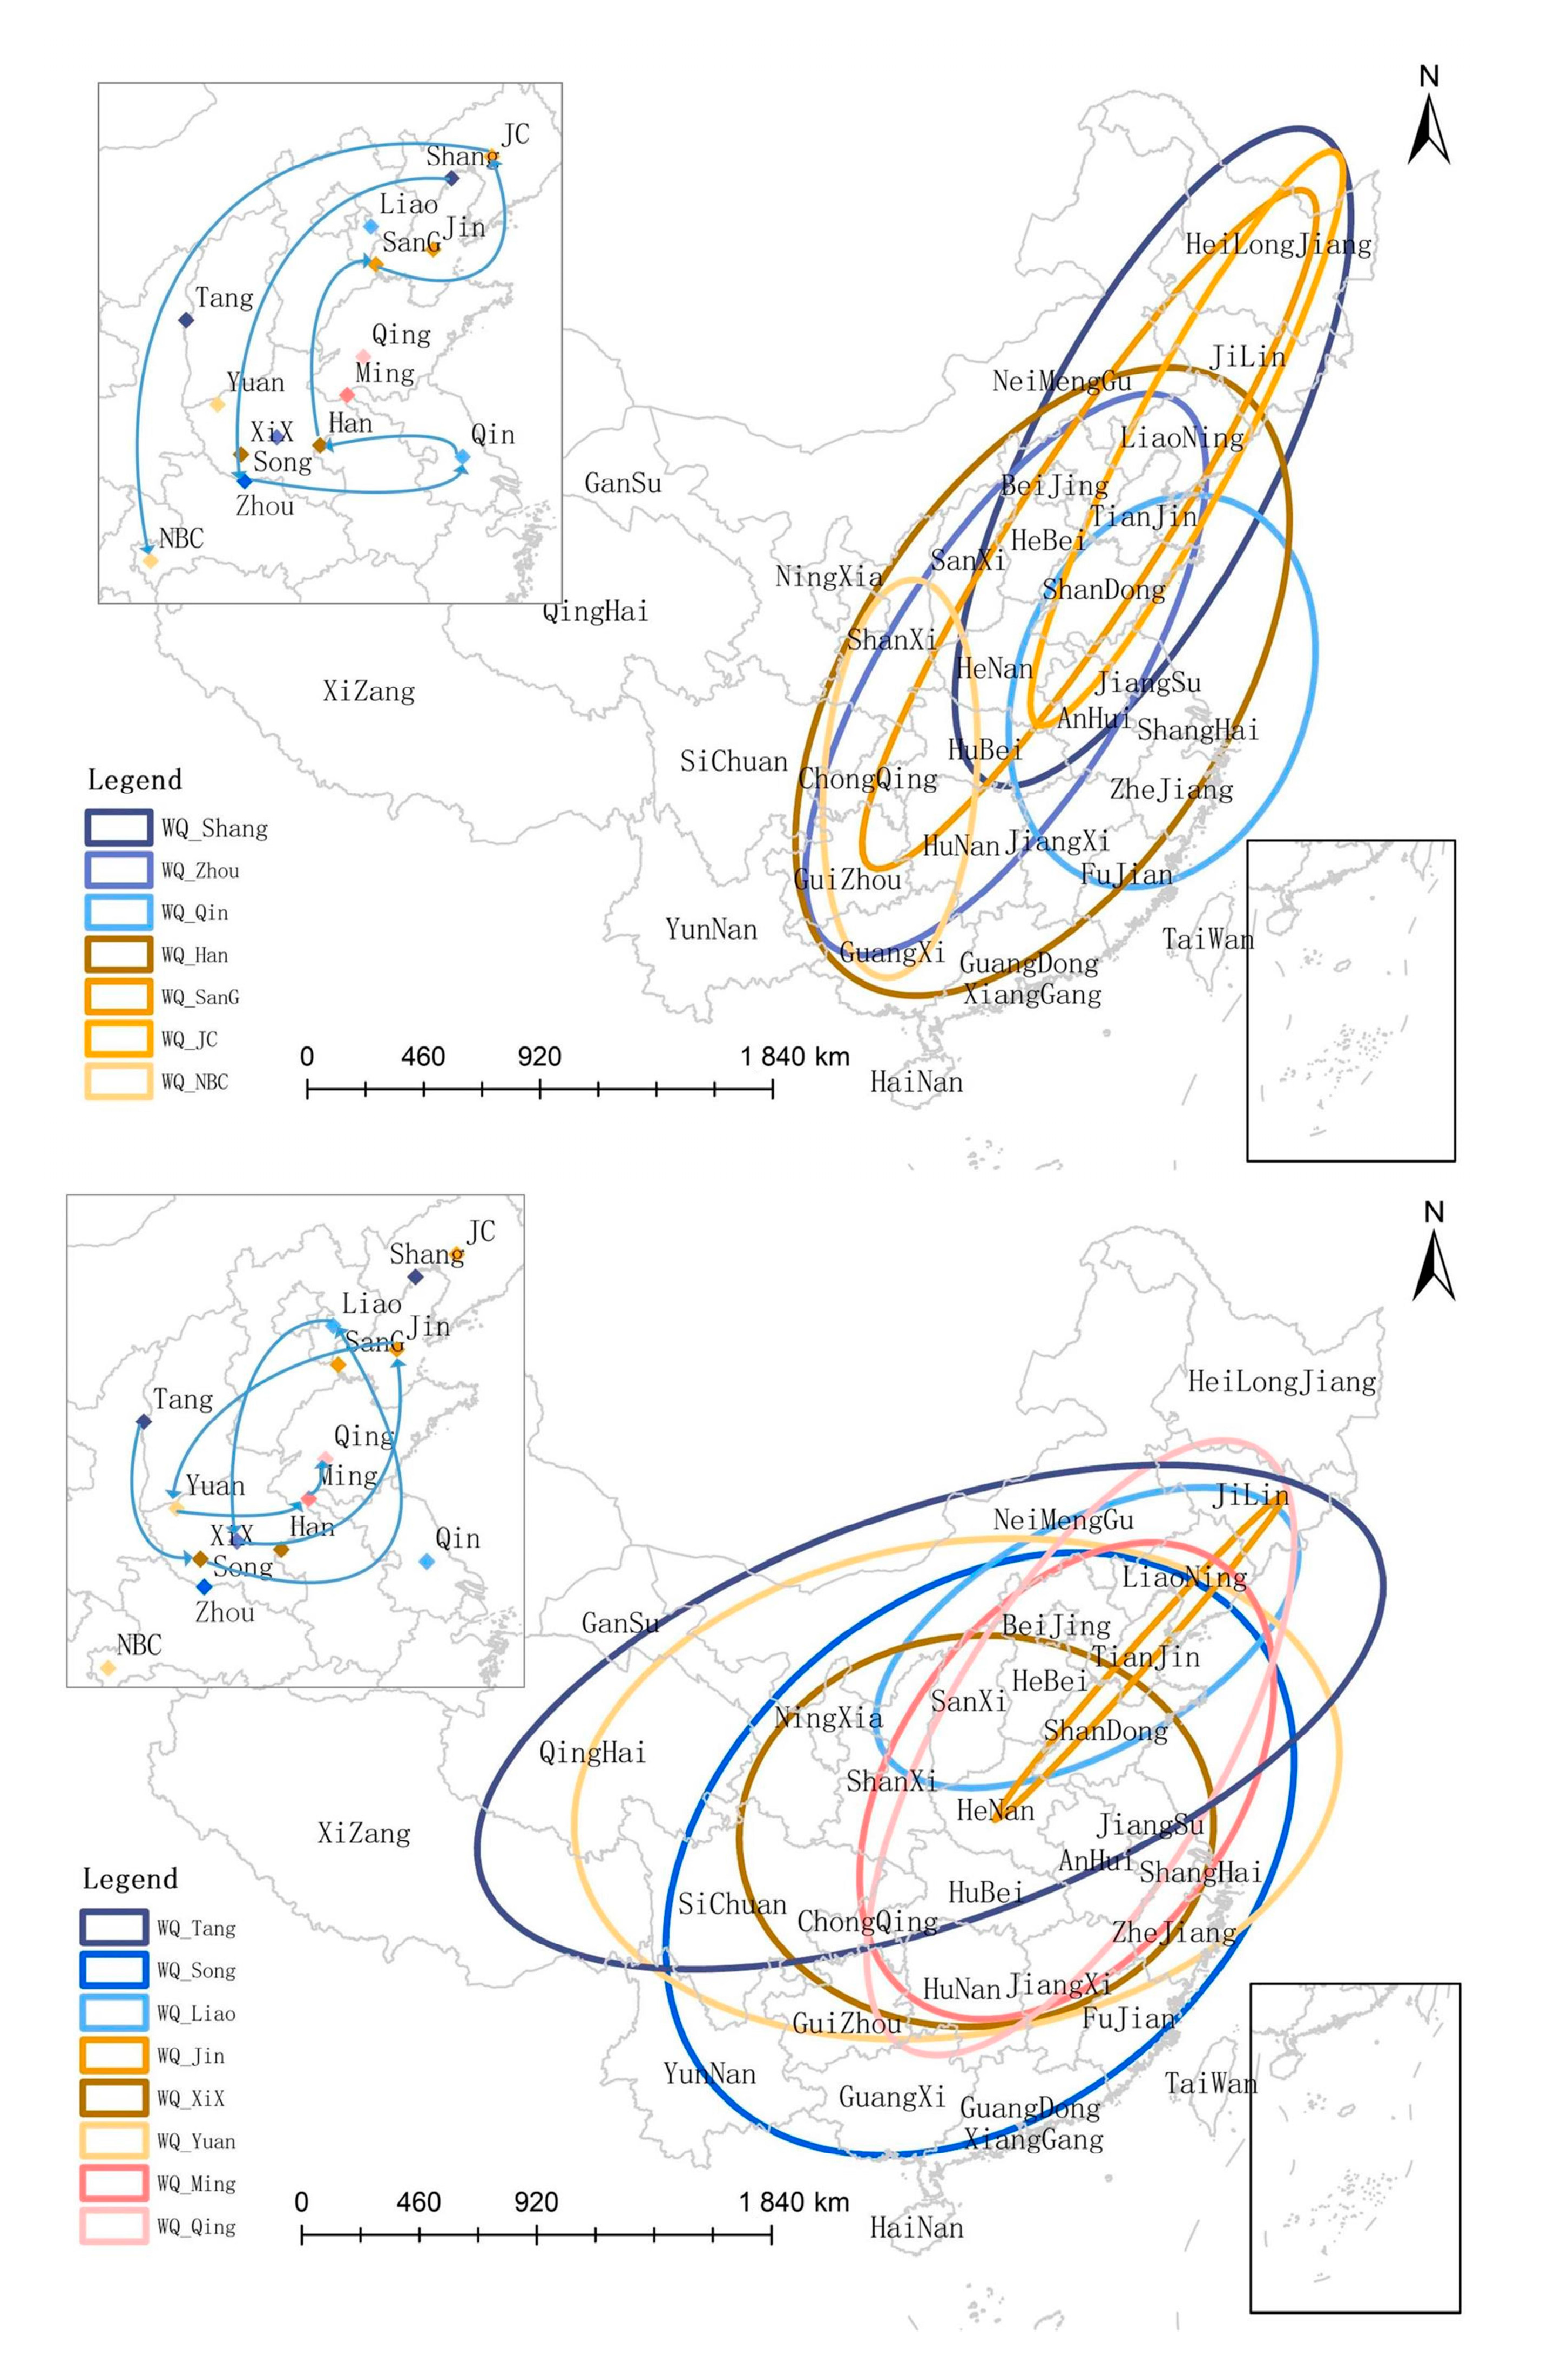
The center of gravity and its standard deviation ellipse in the spatial distribution of weapons as cultural relics were calculated and a superposition analysis conducted to obtain the evolution path of the center of gravity and standard deviation ellipse of the spatial distribution of weapons as the cultural relics of different dynasties (Table 3). From the Shang Dynasty to the Han Dynasty, the x-axis length presented an increasing trend, while the y-axis presented a declining trend. In this stage, the directional distribution of weapons as cultural relics was more obvious. The weapon center of gravity in the Zhou Dynasty was in the southeast direction, which was related to the frequent wars in the Spring and Autumn period and the Warring States Period. During the Han Dynasty, there were many vassal states and the current situation was unstable. Therefore, the x-axis and y-axis of the Han Dynasty increased rapidly compared with that of the Qin Dynasty, and the distribution range of weapons and cultural relics expanded. During the Jin Dynasty of The Three Kingdoms, the x-axis and y-axis showed a downward trend, but the gap between them was gradually decreasing and the dispersion degree of their distribution was narrowing. From the Tang Dynasty to the Qing Dynasty, the center of gravity of weapons and cultural relics was in the general direction of southwest and northeast. From the Tang Dynasty to the Western Xia Dynasty, the gap between the x-axis and y-axis showed a decreasing trend. The centripetal force of the weapon distribution was enhanced, and the centripetal force reached the maximum in the Jin Dynasty. Due to the expansion of its territory, the distribution of weapons and cultural relics in the Yuan Dynasty was more dispersed than that in the Liao and Jin dynasties, but its center of gravity was still in the north, and remained in the north until the Qing Dynasty.
Taking the Tang Dynasty as the boundary, the spatial distribution of weapons was divided into two periods, namely, the Shang Dynasty to the Northern and Southern Dynasties, and the Tang Dynasty to the Qing Dynasty (Figure 8). The subgraph in the upper left corner represents the migration path of the center of gravity of different dynasties. It can be seen from the Figure that the range of the standard deviation ellipse was mainly around the capital of the dynasty. From the Shang Dynasty to the Northern and Southern Dynasties, the center of gravity first shifted to the southwest and; then gradually moved to the northwest and northeast, before finally returning to the southwest. From the Tang Dynasty to the Qing Dynasty, the center of gravity first shifted to the northeast, constantly moved back and forth in the southwest and northeast, and finally returned to the northeast, indicating that the spatial distribution of cultural relics was not only migratory, but also cyclical. In this paper, only the weapon relics were used as examples for providing a detailed explanation, but the spatial distribution of the other relics was also mobile.

4.3.2. Similarity

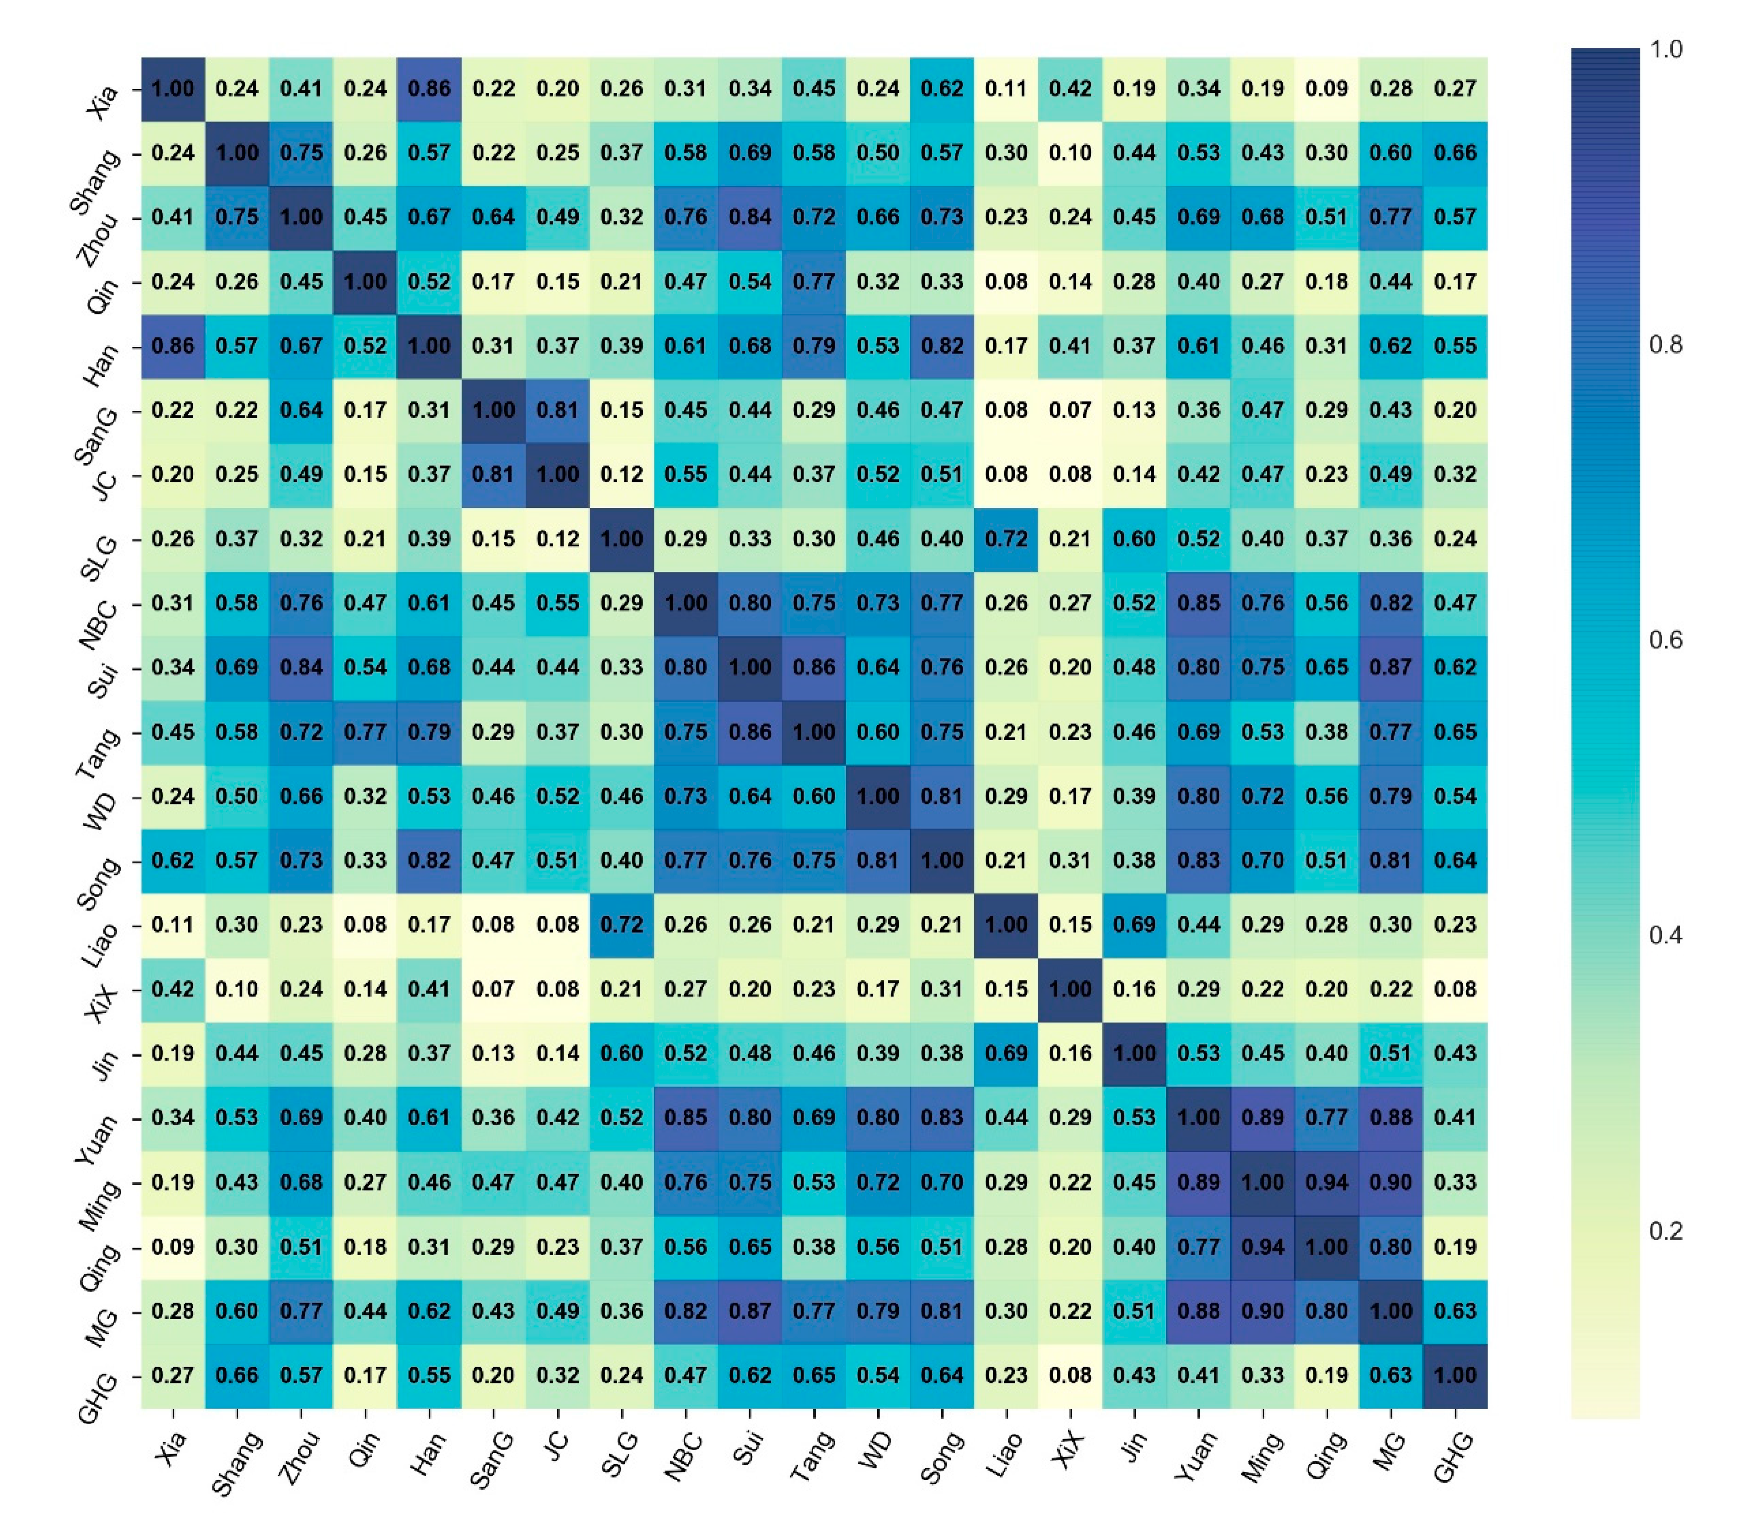
Taking different dynasties as nodes, and the spatial distribution of cultural relics in different regions as the attributes of the node, a dynasty node vector and 21 × 31 vector matrix were constructed, and the cosine similarity formula was used to calculate the similarity between the vectors (Figure 9).
The diagonals also showed an obvious distribution trend of the “nine palaces”, and the spatial distribution of cultural relics between similar dynasties was relatively similar. For example, for the 5 × 5 matrix composed of the Southern and Northern Dynasties to the Song Dynasty, and the 6 × 6 matrix composed of the Jin Dynasty to the People’s Republic of China, the vector similarity values between dynasties were high. Similarly, the similarity between most of the near dynasties was higher than that between the far dynasties, and the similarity of cultural relics was more obvious in the near dynasties.
In terms of data deviation and the liquidity enhancement of late cultural relics, dynasties like the Zhou Dynasty, the Han Dynasty, Northern and Southern Dynasties, the Tang Dynasty and Song Dynasty, the Ming and Qing dynasty when relics accounted for more dynasties, had a higher spatial distribution similarity with other dynasties, which may correspond to the large number of relics leading to a similar distribution in different areas. Meanwhile, the dynasties with a small number of cultural relics, such as the Liao Dynasty and the Western Xia Dynasty, had a low similarity with the history and culture of other dynasties. This may be because the number of cultural relics was too small, so the cultural relics of corresponding dynasties were mainly concentrated in a few areas, and the spatial distribution was too deviant.

4.4. Discussion

Research into China’s material cultural heritage usually involves data from traditional villages, public libraries and human sites, and is rarely focused on the data of museum cultural relics. However, the history carried by museum relics is of great research value, providing a good window for people to understand the history and culture, as well as the material cultural heritage, of China. Most scholars focus on the importance of museums to culture, and as cultural relics are indispensable to museums, the exploration of their spatial and temporal distribution is one of the important breakthrough points for directly understanding China’s material and cultural heritage. Based on previous studies of the temporal and spatial distribution, this paper puts forward a discriminant formula of the continuity and intermittentness characteristics with time-series data on cultural relics in museums as an example, which provide a new way of thinking and a new direction for future studies on China’s material cultural heritage.
Based on previous research of cultural heritage, this paper combines spatial analysis and cosine similarity methods to compare and analyze the temporal and spatial distribution characteristics of the cultural relics list data disclosed by the National Cultural Heritage Administration, and establishes continuity and intermittent discriminant formula for time-series data with attributes. The discontinuous discriminant formula adds a new perspective on the basis of traditional visualization using GIS, to achieve the research into the historical culture reflected behind the cultural relics. The cosine similarity method also combines the multidimensional attributes of culture at the same time, which can more comprehensively perform the time and space analysis of cultural relics. The discriminant formula of continuity and discontinuity obtains the “life cycle” of cultural relics, and the temporal trend of cultural relics has specific numerical values. The “cultural communication circle” is obtained from the geographical adjacency, combined with the PageRank node importance judgment, further explaining the characteristics of cultural communication, and also providing new ideas and thinking directions for subsequent research into China’s material cultural heritage.
However, there are still some shortcomings in this article. Culture is not a single individual, but a very complex combination. A single cultural datum cannot consider all aspects of culture. How to combine more sources of cultural data to analyze culture still needs further exploration and research.

5. Conclusions

In this paper, the spatial and temporal distribution characteristics of the cultural relics in the collections of the National Cultural Heritage Administration have been discussed by spatial analysis and cosine similarity. In order to explore the continuity and intermittentness characteristics of the time-series data of cultural relics, this study created a discriminant formula for continuity and intermittentness, and quantified the time-series distribution characteristics. The main conclusions are as follows:
(1) The overall distribution of cultural relics shows characteristics of class aggregation, dynasty aggregation and regional aggregation. It is mainly concentrated in pottery, porcelain, coins, bronze ware, and a few other kinds of cultural relics, and most of them belong to daily necessities. For Qing Dynasty, Republic of China, Han Dynasty, Song Dynasty, Ming Dynasty, Zhou Dynasty and other relatively prosperous dynasties, Beijing, Shanghai, Gansu Province, Heilongjiang Province, Hubei Province, and other relatively developed regions, and tended to be inclined to the north;
(2) Different categories of cultural relics have unique “life cycles”, and their time sequence distribution shows the characteristics of continuity and intermittentness. Cultural relics can be divided into three types: continuity greater than intermittentness, with a large gap; intermittentness greater than continuity, with a large gap; and the small difference between continuity and intermittentness and with more interruptions. The time sequence characteristics of different types of cultural relics are closely related to their historical background. Pottery used to be a daily necessity in different dynasties. Jade was practical and could also be used as ornamental stones. As a special product of the Shang and Zhou dynasties, the oracles and bones were not reproducible. Stamp products are popular products in the new era, increasing with the progress of current society;
(3) The spatial distribution of the different dynasties’ relics presents clustering and mobility. Aggregation embodied in the fact that the different dynasty’s relics are mainly distributed in that dynasty’s capital and the capital near one or two orders of geographical adjacency, forming a small “culture circle”. Through the PageRank algorithm, we found Beijing, Heilongjiang, Hubei, Shaanxi Province, Anhui Province, Jilin Province, Shanghai and other regions’ contribution more to the small-scale culture circle. Taking weapon relics as an example, their spatial distribution had a certain mobility and the migration direction presented a “circulation” rule, but mainly inclined to the north. Similarly, the characteristics of the spatial and regional distribution of other cultural relics are also applicable;
(4) By taking dynasties as nodes, categories and regions as the attributes of their nodes, and constructing the node vectors of their dynasties, it was found that their spatial and temporal distributions all showed similar characteristics and were more similar between dynasties with a shorter time distance than those with a longer time distance.

Author Contributions

P.L., Y.D., Z.M., H.X., L.Z. and H.L. responsible for monitoring; Z.S. responsible for method, writing, experiment. All authors have read and agreed to the published version of the manuscript.

Funding

This research received no external funding.

Institutional Review Board Statement

“Not applicable” for studies not involving humans or animals.

Informed Consent Statement

Informed consent was obtained from all subjects involved in the study.

Data Availability Statement

Publicly available datasets were analyzed in this study. This data can be found here: [https://github.com/Coolgiserz/Data-Driven-History-Research] (accessed on 5 April 2021)

Conflicts of Interest

The authors declare no conflict of interest.

Appendix A

Table A1. Abbreviation of dynasty, category and province.
Province NameAbbreviationCategory NameAbbreviationDynasty NameAbbreviation
AnhuiAHjade, gemsYSQXia DynastyXia
BeijingBJpotteryTQShang DynastyShang
ChongqingCQporcelainCQZhou DynastyZhou
FujianFJ:bronzeBRQin DynastyQin
GansuGSgold and silverwareJYQHan DynastyHan
Guangdong province,GDironware, other metalwareIMThe Three Kingdoms periodSanG
Guangxi Autonomous RegionGXlacquerwareQQJin DynastyJC
GuizhouGZsculptureDSThe SixteenSLG
HainanHNstone tools,
stone carvings, bricks and tiles
SQNorthern and Southern DynastiesNBC
HebeiHEBcalligraphy, paintingSF,Sui DynastySui
HenanThe HENstationeryWJTang DynastyTang
HeilongjiangHLJoracleJGFive dynasties and Ten statesWD
HubeiHBseal talismanXYSong DynastySong
HunanHNcoinQBThe CenterLiao
JilinJLangular apparatusYGXixiaXiX
JiangsuJSbamboo wood carvingZMDJin DynastyJin
JiangxiJXfurnitureJJYuan DynastyYuan
LiaoningLNenamelwareFLMing DynastyMing
NeimengguNMembroideryZXQing DynastyQing
Ningxia Autonomous RegionNXancient booksGJRepublic of ChinaMG
QinghaiQHrubbings of rubbingsBTPeople’s Republic of ChinaGHG
ShandongSDarmsWQ
ShanxiSXstampsYP
ShanxiShXdocuments, promotional materialsWJX
ShanghaiSHarchival documentsDA
SichuanSCcelebrity relicsMR
TianjinTJglasswareBLQ
XinjiangXZmusical instrumentsYQ
XinjiangXJleatherPG
YunnanYNaudiovisual productsYX
ZhejiangZJbillPJ
transportationJT
weights and measuresDL
specimen, fossilsBB
otherothers

References

  1. Janković, R. Machine learning models for cultural heritage image classification: Comparison based on attribute selection. Information 2020, 11, 12. [Google Scholar] [CrossRef] [Green Version]
  2. Ronchi, A.M. eCulture: Cultural Content in the Digital Age; Springer: Berlin/Heidelberg, Germany, 2009. [Google Scholar]
  3. Zhengshan, L. The Significance of the Regulations on Museum and the Future of Museums. China Cult. Herit. Entific Res. 2015, 2, 1–5. [Google Scholar]
  4. Li, J.; Fang, H.; Underhill, A.P. The History of Perception and Protection of Cultural Heritage in China; Springer: Berlin/Heidelberg, Germany, 2016. [Google Scholar]
  5. Qingwen, M. Responding to common questions on the conservation of agricultural heritage systems in China. Acta Geogr. Sin. (Engl. Ed.) 2016, 26, 969–982. [Google Scholar]
  6. Altieri, M.A.; Koohafkan, P. Globally Important Ingenious Agricultural Heritage Systems (GIAHS): Extent, significance, and implications for development. In Proceedings of the Second International Workshop and Steering Committee Meeting for the Globally Important Agricultural Heritage Systems (GIAHS) Project; FAO: Rome, Italy, 2004; pp. 7–9. [Google Scholar]
  7. Zheng, S. Reflections on Architectural Heritage Conservation in Shanghai. Built Herit. 2017, 1, 1–13. [Google Scholar] [CrossRef]
  8. Mei, Q. Constructing New Meanings of Chinese Architectural Heritage in the World Heritage Sites of Malacca Straits. Built Herit. 2017, 1, 26–35. [Google Scholar] [CrossRef]
  9. Li, W.; Lin, L.U.; Shi-Rong, T.; Song, L.U.; Zhao, Y.; Yong, W.; Dong-Dong, L. Residents’ attitudes to tourism development in ancient village resorts. Chin. Geogr. Sci. 2004, 14, 170–178. [Google Scholar]
  10. Zhao, G.; Deng, Z.; Shen, J.; Ryan, C.; Gong, J. Carrying capacity and its implications in a Chinese ancient village: The case of Hongcun. Asia Pac. J. Tour. Res. 2018, 23, 260–280. [Google Scholar] [CrossRef]
  11. Towers, G. Rediscovering rural Appalachian communities with historical GIS. Southeast. Geogr. 2010, 50, 58–82. [Google Scholar] [CrossRef]
  12. Knowles, A.K.; Hillier, A. Placing History: How Maps, Spatial Data, and GIS Are Changing Historical Scholarship (Review); ESRI, Inc.: Redlands, CA, USA, 2009. [Google Scholar]
  13. Hagge, P.D. Toward spatial humanities: Historical GIS & spatial history. Soc. Cult. Geogr. 2015, 17, 1–2. [Google Scholar]
  14. Duckett, B. A Companion to Museum Studies. Ref. Rev. 2007, 2, 10–11. [Google Scholar]
  15. De Wever, P.; Guiraud, M. Geoheritage and Museums; Elsevier: Amsterdam, The Netherlands, 2018; pp. 129–145. [Google Scholar]
  16. Wigan, M.R.; Clarke, R. Big Data’s Big Unintended Consequences. Computer 2013, 46, 46–53. [Google Scholar] [CrossRef]
  17. Bail, C.A. The cultural environment: Measuring culture with big data. Theory Soc. 2014, 43, 465–482. [Google Scholar] [CrossRef]
  18. Mclaughlin, T.R.; Whitehouse, N.J.; Schulting, R.J.; Mcclatchie, M.; Barratt, P.; Bogaard, A. The Changing Face of Neolithic and Bronze Age Ireland: A Big Data Approach to the Settlement and Burial Records. J. World Prehistory 2016, 29, 117–153. [Google Scholar] [CrossRef] [Green Version]
  19. Tian, T.; Ni, L. Problem of unequal authorities assignment based on pagerank algorithm. Jisuanji Gongcheng/Comput. Eng. 2007, 33, 53–55. [Google Scholar]
  20. Chloupek, B.R. Public memory and political street names in Koice: Slovakia’s multiethnic second city. J. Hist. Geogr. 2019, 64, 25–35. [Google Scholar] [CrossRef]
  21. Lili, J.; Qizhang, L.; Qingwen, Q.I.; Yanjun, Y.E.; Xun, L. The heritage and cultural values of ancient Chinese maps. Acta Geogr. Sin. (Engl. Ed. ) 2017, 27, 1521–1540. [Google Scholar]
  22. Huang, S. The geological heritages in Xinjiang, China: Its features and protection. J. Geogr. Sci. 2010, 20, 357–374. [Google Scholar] [CrossRef]
  23. Cheng, Q.; Ling, S. Geographical distribution and affecting factors of the intangible cultural heritage in China. Sci Geogr Sin 2013, 33, 1166–1172. [Google Scholar]
  24. Ruirui, L.; Wei, Z.; Jing, C. Structure and distribution of the intangible cultural heritage in Fujian. Areal Res. Dev. 2014, 33, 97–102. [Google Scholar]
  25. Chen, X.; Xie, W.; Li, H. The spatial evolution process, characteristics and driving factors of traditional villages from the perspective of the cultural ecosystem: A case study of Chengkan Village—ScienceDirect. Habitat Int. 2020, 104, 102250. [Google Scholar] [CrossRef]
  26. Kim, G.; Kang, W.; Park, C.R.; Lee, D. Factors of spatial distribution of Korean village groves and relevance to landscape conservation. Landsc. Urban Plan. 2018, 176, 30–37. [Google Scholar] [CrossRef]
  27. Matless, D. Properties of ancient landscape: The present prehistoric in twentieth-century Breckland. J. Hist. Geogr. 2008, 34, 68–93. [Google Scholar] [CrossRef]
  28. Nikolaou, P. Authoring the ancient sites of Cyprus in the late nineteenth century: The British Museum excavation notebooks, 1893–1896. J. Hist. Geogr. 2017, 56, 83–100. [Google Scholar] [CrossRef]
  29. Ren-zhi, H. Ancient city ruins in the deserts of the Inner Mongolia Autonomous Region of China. J. Hist. Geogr. 1985, 11, 241–252. [Google Scholar] [CrossRef]
  30. Stelian, M. Shifting urban namescapes: Street name politics and toponymic change in a Romanian(ised) city. J. Hist. Geogr. 2019, 65, 48–58. [Google Scholar]
  31. Ding, Y.; Ye, C.Y.; Ma, R.F. Evolution of Temporal and Spatial Distribution of Zhejiang’s Intangible Cultural Heritage and Its Influencing Factors. J. Sichuan Norm. Univ. (Soc. Sci. Ed.) 2016, 4, 61–66. [Google Scholar]
  32. Liu, D.J.; Hu, J.; Chen, J.; XV, X. The study of spatial distribution pattern of traditional villages in China. China Popul. Resour. Environ. 2014, 24, 157–162. [Google Scholar]
  33. Li, Z.; Zhu, C.; Wu, G.; Zheng, C.; Shao, S.; Feng, F.; Wang, N. Spatial and temporal distribution of prehistoric human sites and its driving factors in Henan Province. Acta Geogr. Sin. 2013, 68, 1527–1737. [Google Scholar]
  34. Wu, L.; Zhu, C.; Zheng, C. Response of prehistoric culture to climatic environmental changes since Holocene in Zhejiang, East China. Acta Geogr. Sin. 2012, 67, 903–916. [Google Scholar]
  35. Jboor, N.H.; Belhi, A.; Al-Ali, A.K.; Bouras, A.; Jaoua, A. Towards an Inpainting Framework for Visual Cultural Heritage. In Proceedings of the IEEE Jordan International Joint Conference on Electrical Engineering and Information Technology, Amman, Jordan, 9–11 April 2019. [Google Scholar]
  36. Yasser, A.; Clawson, K.; Bowerman, C.; Lévêque, M. Saving cultural heritage with digital make-believe: Machine learning and digital techniques to the rescue. In Proceedings of the HCI’17: Proceedings of the 31st British Computer Society Human Computer Interaction Conference, Nicosia, Cyprus, 31 October–5 November 2016; pp. 1–5. [Google Scholar]
  37. Llamas, J.; Lerones, P.M.; Zalama, E.; Gómez-García-Bermejo, J. Applying deep learning techniques to cultural heritage images within the inception project. In Proceedings of the Euro-Mediterranean Conference, Barcelona, Spain, 13 July 2016; pp. 25–32. [Google Scholar]
  38. Li, H.; Zhang, J.; Sun, J. A visual analytics approach for deterioration risk analysis of ancient frescoes. J. Vis. 2016, 19, 529–542. [Google Scholar] [CrossRef]
  39. Zhang, J.; Kang, K.; Liu, D.; Yuan, Y.; Yanli, E. Vis4Heritage: Visual Analytics Approach on Grotto Wall Painting Degradations. IEEE Trans. Vis. Comput. Graph. 2013, 19, 1982–1991. [Google Scholar] [CrossRef] [PubMed]
  40. Deufemia, V.; Paolino, L.; Tortora, G.; Traverso, A.; Mascardi, V.; Ancona, M.; Martelli, M.; Bianchi, N.; De Lumley, H. Investigative Analysis across Documents and Drawings: Visual Analytics for Archaeologists. In Proceedings of the International Working Conference on Advanced Visual Interfaces 2012, Capri Island, Italy, 22–26 May 2012. [Google Scholar]
  41. Yuill, R.S. The standard deviational ellipse; an updated tool for spatial description. Geogr. Ann. Ser. B Hum. Geogr. 1971, 53, 28–39. [Google Scholar] [CrossRef]
  42. Scott, L.M.; Janikas, M.V. Spatial statistics in ArcGIS. In Handbook of Applied Spatial Analysis; Springer: Berlin/Heidelberg, Germany, 2010; pp. 27–41. [Google Scholar]
  43. Muflikhah, L.; Baharudin, B. Document clustering using concept space and cosine similarity measurement. In Proceedings of the 2009 International Conference on Computer Technology and Development, Kota Kinabalu, Malaysia, 13–15 November 2009; pp. 58–62. [Google Scholar]
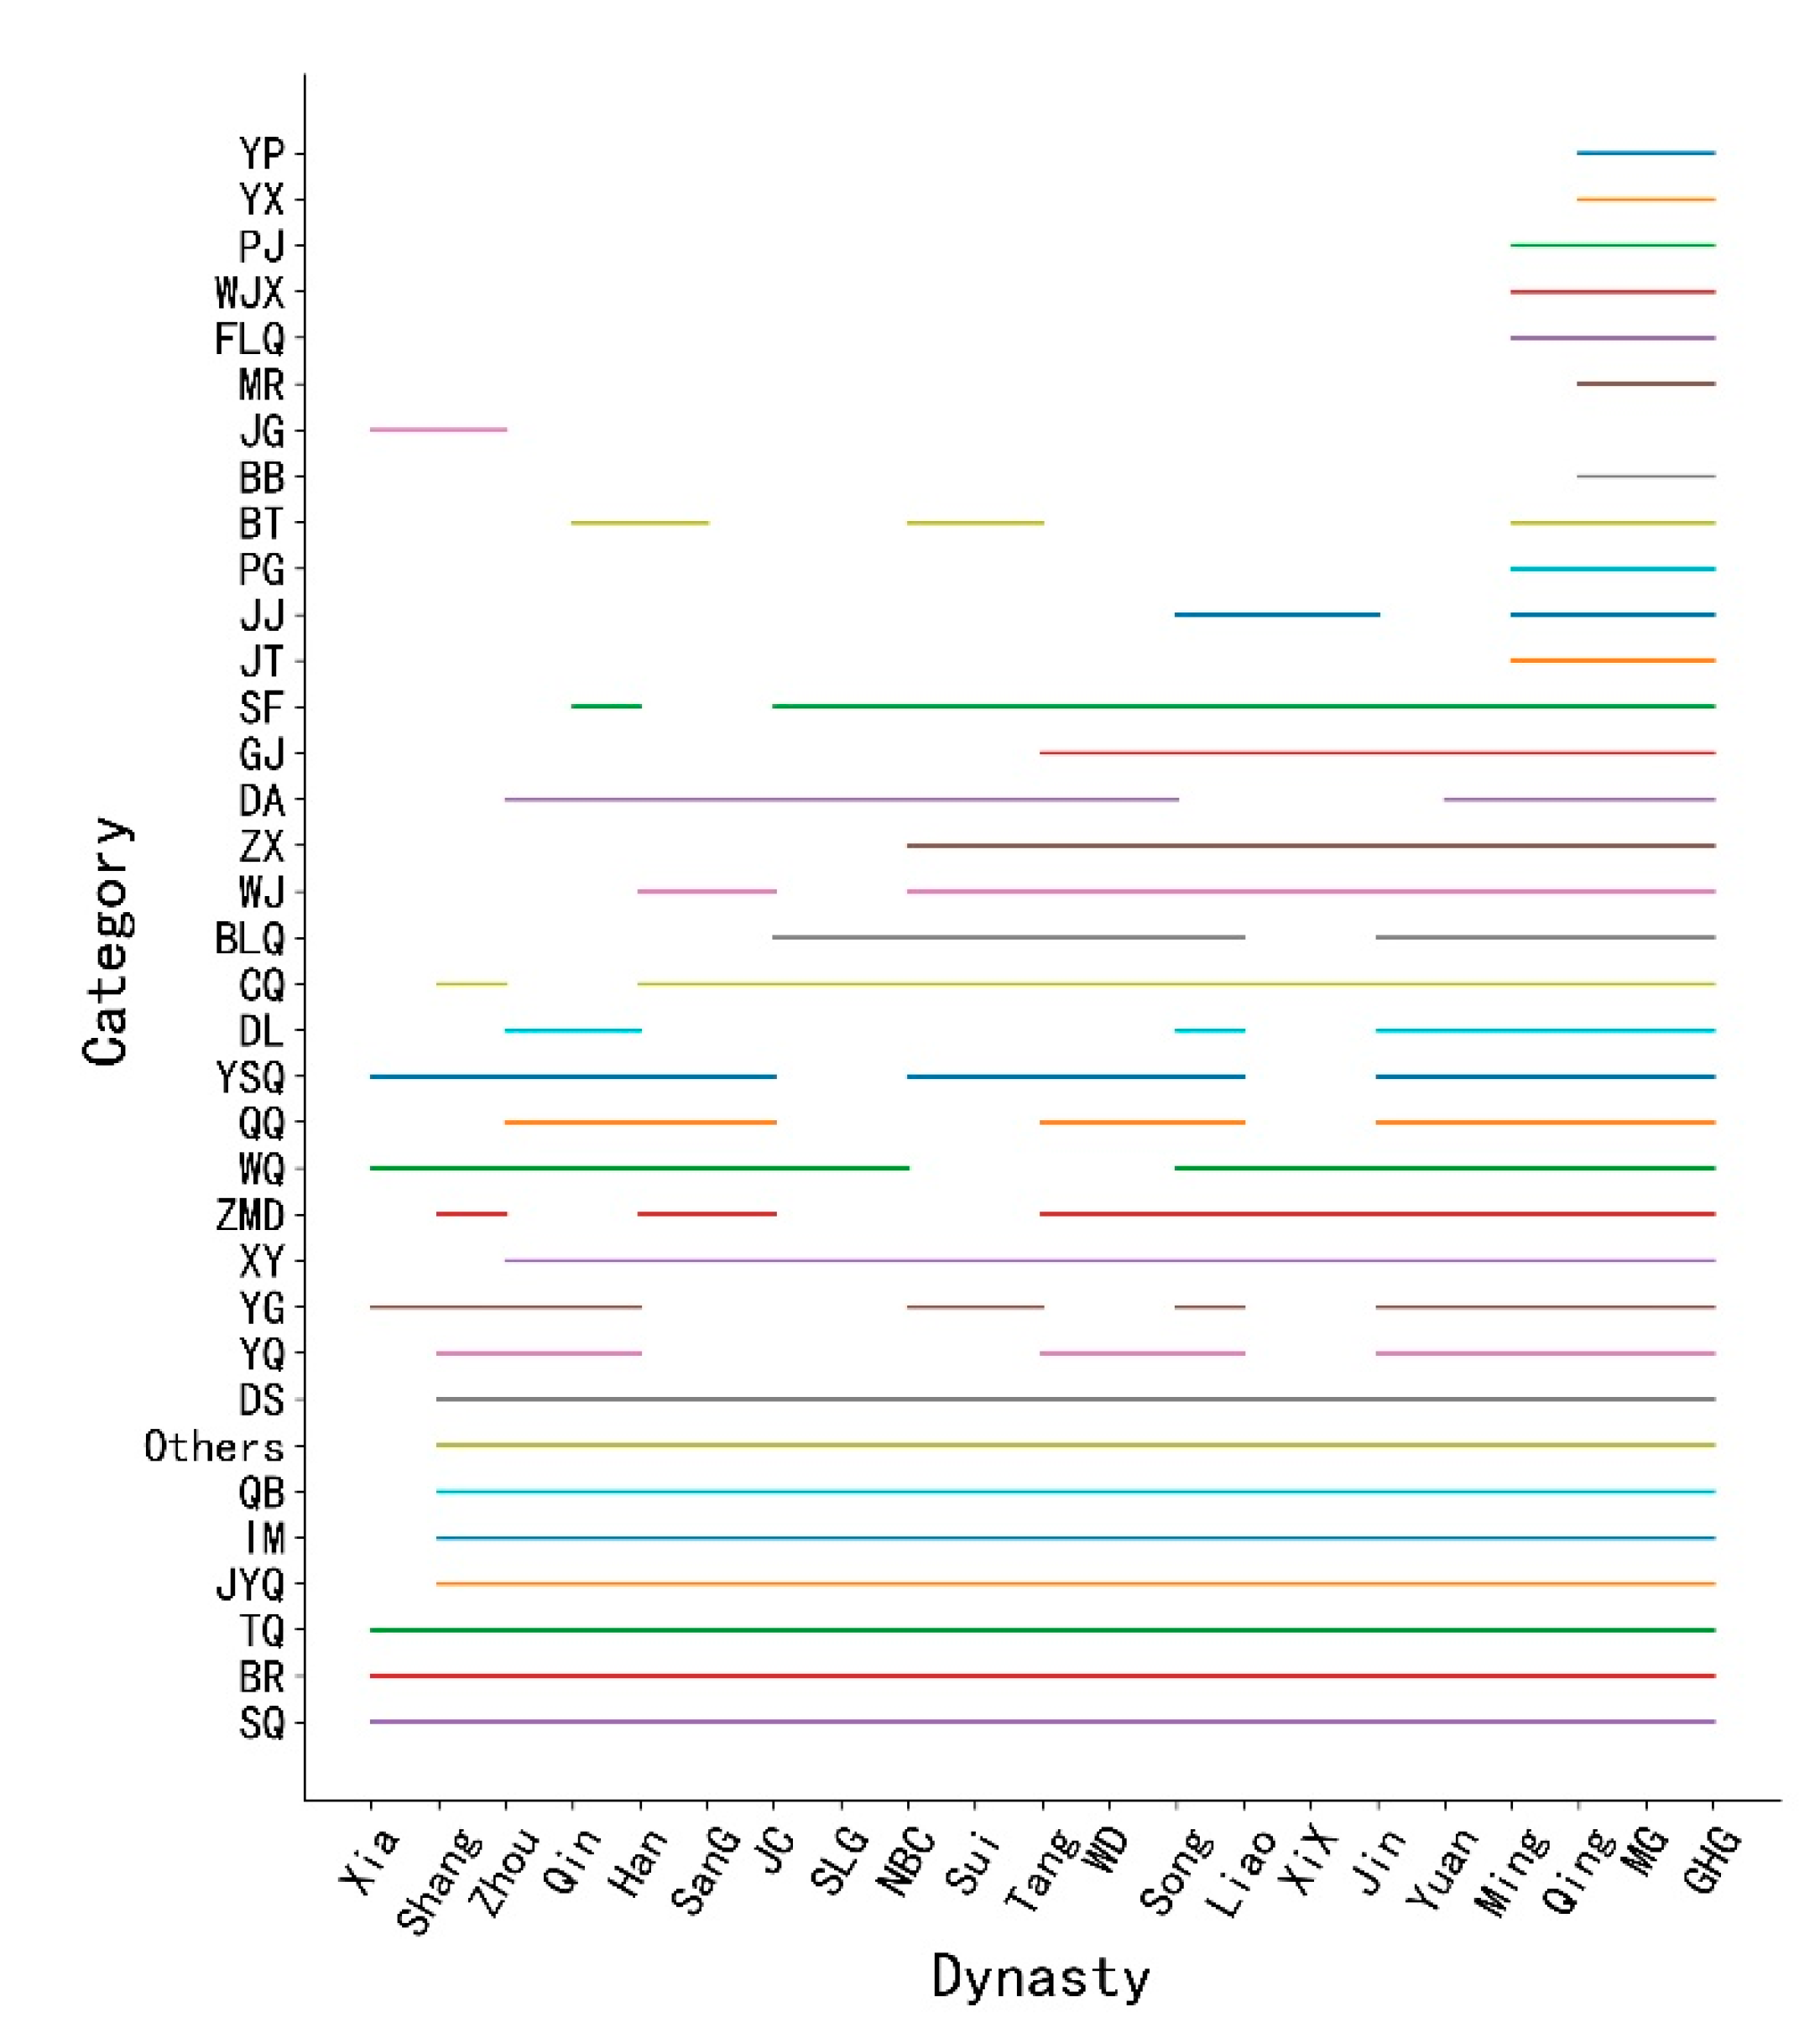
Figure 1. “Life Cycle” diagram of cultural relics.
Information 12 00153 g001
Figure 2. Vein of the “life cycle” of pottery, jade stone and gem.
Information 12 00153 g002
Figure 3. “Life cycle” of bones and stamp products.
Information 12 00153 g003
Figure 4. Similarity measurement of the distribution of cultural relics in different dynasties.
Information 12 00153 g004
Figure 5. Aggregation degree of the spatial distribution in a dynasty.
Information 12 00153 g005
Figure 6. Geographical adjacency diagram.
Information 12 00153 g006
Figure 7. Capital-regional “connectivity” statistical diagram.
Information 12 00153 g007
Figure 8. Center of gravity migration path and standard deviation ellipse of weapon relics from the Shang Dynasty to Northern and Southern Dynasties (up) and the Tang Dynasty to Qing Dynasty (down).
Information 12 00153 g008
Figure 9. Similarity measurement of the spatial distribution of cultural relics in different dynasties.
Information 12 00153 g009
Table 1. Basic distribution of cultural relics in different dynasties.
DynastyThe TotalTotal Percentage (%)Maximum Percentage of Category (%)Largest Proportion of Districts (%)DynastyThe TotalTotal Percentage (%)Maximum Percentage of Category (%)Largest Proportion of Districts (%)
Xia11390.06TQ: 65.5GS: 48.2WD83420.41QB: 38.7SC: 13.7
Shang31,6161.57JG: 42.6SX: 26.2Song164,2238.16QB: 43.3HLJ: 14.6
Zhou136,7296.80BR: 31.4HB: 15.5Liao10,2380.51CQ: 24.7LN: 34.4
Qin65860.33QB: 17.4SH: 45.3XiX23750. 12CQ: 26.0NX: 45.5
Han201,37410.01TQ: 25.7GS: 23.2Jin16,3310. 81BR: 27.1HeN: 20.5
SanG69960.35CQ: 24.1HB: 33.7Yuan34,6081.72CQ: 50.5BJ: 17.5
JC14,9890.75CQ: 55.1JL: 30.6Ming151,8537.55CQ: 20.1BJ: 30.1
SLG7160.04QB: 19.7LN: 41.8Qing834,19041.5TQ: 31.4BJ: 55.0
NBC25,2361.25DS: 24.9BJ: 10.6MG217,36110.80QB: 23.2BJ: 19.7
Sui70270.35CQ: 36.8BJ: 17.4GHG63,0903.14SF: 22.1HLJ: 31.2
Tang76,6703.81DS: 22.6SH: 19.4
Table 2. Measurement statistics on the continuity and intermittentness of cultural relics of different categories.
CategoryC/GCategoryC/GCategoryC/GCategoryC/GCategoryC/G
SQ6/0DS5.71/0.29YSQ0.67/0.10GJ0.79/0.21JG0.43/2.29
BR6/0YQ0.43/0.21DL0.27/0.10SF2.14/0.43MR0.86/5.14
TQ6/0Others5.71/0.29CQ2.43/0.14JT0.29/0.57FLQ1.14/4.86
JYQ5.71/0.29XY5.43/0.57BLQ0.57/0.14JJ0.29/0.50WJ1.24/0.19
IM5.71/0.29ZMD 0.79/0.07WJX1.14/4.86PG0.38/1.14PJ1.14/4.86
QB5.71/0.29WQ0.86/0.10ZX0.93/0.13BT0.29/0.29YX0.86/5.14
YG0.34/0.06QQ0.43/0.14DA1.05/0.19BB0.17/0.29YP0.86/5.14
Table 3. The evolution of the center of gravity of the weapon spatial distribution and the standard deviation ellipse parameters.
DynastyLongitude (°E)Latitude (°N)The Direction ofx-Axis Standard Deviationy-Axis Standard DeviationAngle of Theta (°)
Shang121.0440.76 479.021442.6827.02
Zhou113.6233.61southwest480.161278.8032.13
Qin120.0932.56southeast576.25798.6519.58
Han115.1433.29northwest750.131392.8532.12
SanG117.7538.51northeast281.521593.5932.92
JC122.7241.21northeast212.021278.5727.38
NBC109.0830.02southwest301.07791.274.33
Tang110.4937.22northeast186.62802.7569.88
Song112.4132.33southwest1381.991000.3648.65
Liao117.7239.65northeast912.37445.5761.02
XiX112.3233.15southwest930.19765.9984.70
Jin119.9638.76northeast44.09853.0341.54
Yuan111.5434.66southwest1509.61963.8980.78
Ming116.2434.71northeast661.931044.4735.30
The Qing116.9535.82northeast547.301362.0630.47
Publisher’s Note: MDPI stays neutral with regard to jurisdictional claims in published maps and institutional affiliations.