Article

A Private Strategy for Workload Forecasting on Large-Scale Wireless Networks

by
Pedro Silveira Pisa
1,2,†,
Bernardo Costa
2,†,
Jéssica Alcântara Gonçalves
2,†,
Dianne Scherly Varela de Medeiros
1,† and
Diogo Menezes Ferrazani Mattos
1,*,†
1
LabGen/MídiaCom, PPGEET/TCE/IC, Universidade Federal Fluminense (UFF), Niterói 24210-240, Brazil
2
Solvimm, Rio de Janeiro 20090-003, Brazil
*
Author to whom correspondence should be addressed.
These authors contributed equally to this work.
Information 2021, 12(12), 488; https://doi.org/10.3390/info12120488
Submission received: 25 September 2021 / Revised: 19 November 2021 / Accepted: 20 November 2021 / Published: 23 November 2021

Abstract

:
The growing convergence of various services characterizes wireless access networks. Therefore, there is a high demand for provisioning the spectrum to serve simultaneous users demanding high throughput rates. The load prediction at each access point is mandatory to allocate resources and to assist sophisticated network designs. However, the load at each access point varies according to the number of connected devices and traffic characteristics. In this paper, we propose a load estimation strategy based on a Markov’s Chain to predict the number of devices connected to each access point on the wireless network, and we apply an unsupervised machine learning model to identify traffic profiles. The main goals are to determine traffic patterns and overload projections in the wireless network, efficiently scale the network, and provide a knowledge base for security tools. We evaluate the proposal in a large-scale university network, with 670 access points spread over a wide area. The collected data is de-identified, and data processing occurs in the cloud. The evaluation results show that the proposal predicts the number of connected devices with 90% accuracy and discriminates five different user-traffic profiles on the load of the wireless network.

1. Introduction

Mobile and Wi-Fi networks are increasingly ubiquitous and have constant and significant growth in their adoption. The structures of these networks grew 71% in 2017, and at the end of that same year, the volume of data transferred per month reached 11.5 million exabytes. The accumulated growth is 17 times between 2014 and 2019 [1], being strongly driven by the widespread adoption of 4G and 5G technologies. However, there is still a global trend of data migration to infrastructure Wi-Fi networks that are variants of the Wi-Fi standard (IEEE 802.11). The load on these networks will exceed 100 exabytes a month by 2022, making Wi-Fi networks responsible for more than 59% of mobile traffic. IEEE 802.11 wireless (Wi-Fi) networks become present in many environments [2]. An example that illustrates the trend is the use of free Wi-Fi networks in the New York City subway, one of the largest subway networks in the world, where users migrate from the cellular mobile data network to the provided infrastructure Wi-Fi network.
Wireless networks were initially used for exchanging messages, quick queries, and accessing websites. Today, they are widely used for multimedia applications such as voice calls, social networking, and video access, encompassing various usage profiles. It is estimated that, by 2022, 79% of wireless network traffic will be video [1], requiring network adaptation to the new demand. The load increase in Wi-Fi networks requires the consequent increase in network capacity and availability. Therefore, it is necessary to design their size properly to accommodate the number of users and distinct profiles. However, network dimensioning and predicting the required traffic are challenging tasks.
The popularization and variety of uses of wireless networks foster the growth in the number of access points in confined areas and, thus, result in increased interference between neighboring access points [3]. In addition, a more significant number of access points contributes to clients constantly changing the access point to which they are connected [4]. These characteristics make it even more challenging to predict the network size and expected traffic correctly. This scenario encourages the creation of intelligent network traffic analysis mechanisms that are aware of the expected users’ access profile. Furthermore, intelligent mechanisms must provide accurate data to properly size the network and the base for detecting anomalous behaviors in the network [5].
This paper proposes a strategy for identifying user-traffic profiles in wireless networks and predicting the workload on each of the access points. The goal is to scale the network appropriately, according to the users’ profile of each location and according to the number of users in each access point. The proposed strategy is based on an architecture for data capture on monitored networks, and processing for profile identification and workload forecasting is outsourced to a cloud computing environment. We model the transition of users among access points as a Markovian process. Thus, we use first-order Markov chains to predict the expected load on each access point [6], according to the users’ profile at any given time. In turn, the usage profile is obtained from the analysis of network traffic using the K-means unsupervised machine learning algorithm for clustering. Aggregation into profiles contributes to data de-identification, in compliance with data law regulations such as the Brazilian General Data Protection Law (Lei Geral de Proteção de Dados—LGPD) (Available in Portuguese at http://www.planalto.gov.br/ccivil_03/_ato2015-2018/2018/lei/l13709.htm. Accessed on 11 November 2021) and European General Data Protection Regulation (GDPR) (Available at https://ec.europa.eu/info/law/law-topic/data-protection/data-protection-eu_en. Accessed on 11 November 2021). The extracted information allows the proposed strategy to size the network, ensuring availability properly. In addition, compliance with user privacy laws is mandatory for the proposal since the data processing occurs in a commercial, public cloud environment (We run the proposed strategy in the Amazon Web Services (AWS) cloud to obtain the results available in this paper.). The proposed strategy generates models that also detect anomalies in the network and enable intelligent applications, such as caching at the network edge and personalized service performance guarantees. Furthermore, the proposal allows the implementation of control tools that improve the efficiency and security of the network. For example, it is possible to block network flows that transgress the expected pattern, preventing the availability of the network for other users from being affected.
We analyze our proposal using traffic data obtained from the campi wireless network of the Universidade Federal Fluminense, which is one of the biggest public universities in Brazil, considering number of students. The network is composed of 670 access points distributed throughout 16 different university campi, powering more than 90 buildings, capable of serving more than 60,000 unique users with access peaks of more than 5000 simultaneous connected users. The considered data compress one-week traffic and represent the communication flows between clients on the wireless network and Internet services for one campus, comprising 363 access points. The collected data were de-identified to ensure users’ privacy. The obtained results show that, in the analyzed network, it is possible to classify users into five different users’ profiles and that the proposed strategy predicts the workload on access points with an average accuracy of 90%, considering a confidence interval of 90%. In summary, the contribution of the paper is three-fold:
  • Modeling large-scale wireless network access as a Markovian chain;
  • Predicting the workload of each network access point in a timely, resource-efficient, and private way using a commercial cloud infrastructure;
  • Identifying and forecasting accurate users’ behaviors that are important to plan network infrastructure expansion and maintenance.
The remainder of this paper is organized as follows. Section 2 discusses related work. Section 3 introduces the forecasting problem and proposes the strategy for load forecasting and profiling. The strategy is evaluated in a real large-scale wireless network scenario and the results are presented in Section 4. Finally, Section 5 concludes the paper and points out future work.

2. Related Works

Previous works focus on analyzing the connection of new devices in wireless networks [7], identifying performance bottlenecks in access point [3], characterizing the applications’ data traffic profile [8,9], analyzing applications’ performance in constrained scenarios [10,11], or are based on feature selection algorithms for detecting and resolving security incidents in real-time [12]. User profile’s characterization in wireless networks and adequately dimension the network to accommodate users have a fundamental role in the quality of experience of the network. Oliveira et al. investigate and classify user activities in university networks and urban networks, concluding that there is a linear correlation between the number of sessions and the number of access points in the network [10]. However, Reis et al. show that users keep connected at few network access points throughout the day even if there is a substantially high number of nearby access points [13]. The authors also show that the interference generated by each network depends on the workload to which the network is subjected. Biswals et al. show that monitoring wireless networks requires examining the radio channel used by each Wi-Fi network [3] because channel usage may be low in comparison to other networks’ usage. Differently, we adopt a data collection model that follows the approach of monitoring the flows in the network, consolidating them with metadata about the device address and the access point to which each device associates [10].
Ghosh et al. perform the profile characterization based on the arrival of users in the network and, therefore, combine static clustering with Poisson regression to model the process of new device arrival in the wireless network [7]. Quian et al. consider the applications, which users run in network, to characterize and to optimize network traffic [8]. The authors propose a cross-layer approach to identify traffic signatures of popular applications and optimize radio control communication for inefficient radio-layer applications, reducing network bottlenecks. Shye et al. characterize the wireless network usage by observing that mobile devices are more numerous, and each application generates a distinct data consumption signature on the network [9]. In turn, our proposal considers analyzing network flows through an unsupervised clustering to identify network users’ profiles and forecast usage at each access point based on these profiles. Lopes et al. perform a similar approach focusing on security anomaly detection but using supervised classification algorithms, which require a labeled dataset to train their mechanism [12].
Meireles et al. propose to offload vehicular network traffic to Wi-Fi standard access points located on the vehicle paths [14]. The proposal relies on predicting the data rate each access point can provide the vehicles. Thus, the authors collect spatially-indexed performance measurements in a Wi-Fi-diverse vehicular environment and evaluate data-rate forecasting algorithms that leverage real-time and historical mobility and performance information. The proposed prediction algorithm is simple and relies on the arithmetic mean of historical data rates observed over a window. The results show the forecasting feasibility and reveal a trade-off between the extended range provided by 802.11n and the higher data rates provided by 802.11ac and 802.11ad. However, the proposal only handles the data-rate forecasting in contrast with our proposal that focuses on forecasting the network load and the users’ profile.
Forecasting network workload involves predicting the user associations at each access point. Lyu et al. use a Markov chain of K-order to predict the next access point to which a device will connect, considering a series of k previous connections [15]. Differently, in our work, we consider a first-order Markov chain because the goal is to determine the probability of the device being associated with a particular access point and not to define the probable track performed by a user. To validate the premise that the currently connected access point only depends on the previous state and, consequently, to validate the use of a first-order Markov chain, we consider an additional “not connected” state that describes the devices that are currently out of the network. Mattos et al. apply a similar approach in state forecasting of software-defined network controllers based on the network demands [16].
Marques et al. introduce network-load forecasting as an essential technique for mobile network operators to achieve great accuracy on self-organizing networks [17]. The authors claim that network-load forecasting applies either numerical techniques or artificial intelligence algorithms. Marques et al. deploy an Auto-Regressive Integrated Moving Average (ARIMA) model to forecast the average number of users per hour in a wireless hotspot located in a city public park, according to weather conditions. The data analysis considers users’ access during a month (January 2017) and the average daily city temperature. The proposal predicts users’ access for one week, using a month’s data as historical. The authors evaluate the proposal feasibility and discuss seasonal users’ behaviors. However, the authors neglect to evaluate the quality of their forecasting quantitatively. Moreover, the proposal is limited to predicting the network load for a single access point, whereas our proposal focuses on predicting the network load for all access points in a large-scale wireless network.
Due to the complexity and the processing requirements for forecasting time series, Son, Linh, and Dang propose a method that combines Autoregressive (AR) and Long Short-Term Memory (LSTM) neural networks to forecast linear and non-linear components of time series [18]. The authors evaluate their method over a dataset that contains the number of times that each user accesses public Wi-Fi per day, and the proposal forecasts the next 30 days’ data. The authors conclude that autoregressive models are good at forecasting linear data, and LSTM performs better on non-linear data. Moreover, the authors verify that the combined model outperforms ARIMA or LSTM exclusive models. Similarly, Barbosa et al. propose to apply the Discrete Wavelet Transform to decompose the time series of the entropy values of network traffic features into linear and non-linear components and, then, apply ARIMA and LSTM to predict network users’ behavior [19]. Barbosa et al. show that the LSTM neural network provided low error in predicting both linear and non-linear components, whereas ARIMA provided a lower upper-bounded error than LSTM to the linear component. Moreover, the authors also claim that the linear component expresses much of the data noise. Nevertheless, these proposals do not focus on forecasting the number of connected users in each network access point. Instead, the proposals focus on forecasting the entire network behavior.
Chatzoglou et al. extend the well-known AWID corpus (Available at https://icsdweb.aegean.gr/awid/. Accessed on 11 November 2021) [20]. The AWID extension accounts for sample traces of various attacks against the IEEE 802.1X Extensible Authentication Protocol (EAP). The authors focus on enterprise-level networks because they provide stronger security mechanisms, including Protected Management Frames (PMF), introduced with the IEEE 802.11 W, and support for alternative network architectures. Although Chatzoglou et al. characterize well-known attacks, e.g., deauthentication, disassociation, (re)association and rogue access point, and new attacks, such as krack and kr00k, against wireless networks, they do not envision to provide a dataset to study the well-behaved users’ profile in the network.

3. Network Load Forecasting and Profile Identification Strategy

Analyzing network traffic for users’ profiling and load forecasting in large-scale wireless networks is essential for network security because it enhances network availability. Moreover, large-scale wireless networks are prone to various attacks against the IEEE 802.1X [20] and, thus, user profiling is also a valuable mechanism to identify misuse or faulty behaviors in the network. However, accurate load forecasting is challenging due to the [6]:
  • Large volume of data originated from a large-scale network;
  • Variety of data sources represented by the various access points and network users;
  • Adaptability of the model to the executed network applications;
  • Variability of applications and uses of the network to which the load forecasting model should anticipate proactively;
  • Need for high-quality historic data to train or fit the model;
  • Complexity of the proposed forecasting method that should be insignificant for time and space;
  • Data granularity with which the network usage is measured;
  • Pattern length that is selected to fit the most popular patterns and behaviors in the network.
The first challenge is data collection, performed at the geographically distributed access points and network output routers. Access points store connection activity and client association and disassociation activity, while outbound network routers gather network traffic flow summaries. Thus, it is necessary to enrich each network traffic flow with the correct access point to which the user is currently associated at the time of the occurring flow, accomplished through recording data about associating and disassociating clients to the access point. The enriched data occurs before processing the collected data. The second challenge is data analysis, which requires large storage availability and high processing power to train the machine learning algorithms and execute the forecasting models.
To accomplish data collection, we deployed NetFlow, developed by Cisco for routers to monitor and standardize export information about the network flow statistics [21]. Outgoing network routers inspect the packets arriving on their interfaces and collect statistics of the flows based on the 5-tuple information consisting of source and destination IP addresses, transport protocol, and source and destination transport ports. The collected data is periodically sent to a flow management device according to preconfigured timers. The volume of network traffic analyzed in this paper is up to 3 gigabytes of data per day and must be processed near real-time. The speed and volume of collected data is a challenge for determining users’ profiles and load forecasting in a large-scale wireless network, featuring a Big Data problem. In this paper, we propose to use a cloud processing solution, which allows allocating computing resources on demand. The data is processed as soon as they are collected, in near real-time. We also use the Spot server functionality from the Amazon Web Services (Available at https://aws.amazon.com/ec2/spot/. Accessed on 11 November 2021) cloud, which reduces costs by up to 90%, allowing us to create an efficient and cost-effective tool [22]. We analyze one day in 32 min using a single server with 8 processors, 32 GB of RAM, and a T4 Tensor Core with 16 GB of GPU memory. The configuration reveals that the proposed strategy processes data in near real-time and enables it to scale using more servers if needed by the network traffic volume.
The paper proposes a strategy for identifying users’ profiles in wireless networks and forecasting the load on each access point. The main goal is to allow the network to be adequately dimensioned according to the load based on the users’ profiles of each location. The strategy deploys a mechanism that harmonizes data capture over the wireless network and a cloud computing architecture. The collected data is associated with a unique random identifier generated from a cryptographic function that acts upon the device’s MAC address to ensure user privacy. This procedure ensures the data de-identification to protect users’ privacy. The strategy consists of 3 steps. In the first step, the goal is to obtain the expected load on each access point. The second step identifies the users’ profiles existing in the network. Finally, the expected users’ profiles and the predicted load at each access point are identified in the third step. Therefore, the proposal consists of a private, agile, and assertive strategy to estimate the load on each access point in the network according to the network users’ profile.
Figure 1 presents the proposed strategy. The access points and edge routers send the data to a central server. The central server sends data to the Amazon AWS cloud environment using a Virtual Private Network (VPN). The AWS environment uses a data ingestion service to send the raw data to Tier 1 (Tier is the nomenclature used in big data projects for each stage of data storage in a decoupled stream of processing.). After storing data in Tier 1, a processing service enriches the network flow data with the access-point characteristics. The enriched data are transported to Tier 2 to feed the training of the k-means clustering algorithm used to obtain the users’ profiles. We periodically re-train the k-means model to adjust it for the data better. In parallel, the processing phase, called Profile Calculation, generates the user’s profile for each network flow considering the current k-mean method. Tier 3 stores the results for each network flow data grouped per users’ profile. Finally, the enriched and classified-by-profile data input to the Markov chain, which applies the proposed strategy to predict the probability of a user, from a given profile, associates with each AP.

3.1. Model for Predicting the Expected Load on Each Access Point

The collected data analysis is done in time intervals called Δ t . In this interval, the association of each user to the Access Points (AP) in the network is evaluated. A user who does not perform any network communication in the period is in the “not associated” state ( A P 0 ). The probability that a user switches from A P i to A P j in Δ t is calculated from the collected data by evaluating the ratio between the number of association switches between access points and the total number of association switches. The presence of the user flow at a new access point indicates the migration of the user from one access point to another. Our model assumptions are that users’ arrival follows a Poisson probability distribution, and the user’s probability of migrating between access points only depends on the access point with which the user is currently associated. Therefore, the current state depends only on the previous state. Thus, the arrival of new users summed with the probability of receiving a migrating user at an access point can be modeled by a non-stationary Poisson process [7,23]. It is possible to model the transitions between APs as first-order Markov chains. These transitions fill the Markov probability matrix. In this paper, the matrix T A P shows the probability that a user migrates from A P i to A P j during the specific Δ t . The matrix T A P dimensions are ( N + 1 ) t i m e s ( N + 1 ) , where N is the number of access points in the wireless network, and each element t i j A P represents the transition probability of a user from A P i to A P j . The A P 0 state is necessary to consider users that do not appear associated with any access point in the considered interval and acts as a neighbor state to all others since the user can connect to the network and disconnect from any access point [16]. Thus, for each user in the network, at each specific Δ t = m , a matrix T A P m is assembled, as follows
A P 0 A P 0 A P 0 A P 1 A P 0 A P N A P 1 A P 0 A P 1 A P 1 A P 1 A P N A P N A P 0 A P N A P 1 A P N A P N × A P 0 A P 1 A P N = λ A P 0 A P 1 A P N ,
where A P i A P j indicates the probability of users transitioning from the access point A P i to the A P j , and λ is an eigenvalue corresponding to the matrix decomposition into singular values. Choosing λ = 1 gives the eigenvector P n m which, normalized, represents the invariant probability that user n is connected at each access point at instant m x . Thus, for each instant m x , the expected value of the number of users associated with the access point A P k is given by the sum of the invariant probabilities of each user n at time m x for A P k , according to
E ( U s e r s i n A P k ) m = j N P j m [ A P k ] .
In this way, the workload of the access point is defined as a function of the expected value of the number of users associated to the AP throughout the day.

3.2. Model for Identification of Usage Profiles

The proposed strategy requires high computational power to process the data to predict the expected load on the access points, even if the analysis is based only on the network flows and the association records of the devices with the access points. The proposal uses Big Data techniques for processing in the cloud, as the data volume overgrows with the number of access points and network flows, implying that the analysis may be unfeasible in lower computing power scenarios. Thus, to increase our strategy efficiency, we propose grouping the flows into users’ profiles. The workload estimation based on users’ profiles save computational resources since the access point association activity can be discarded after processing and generating the probability vectors P j m [ A P k ] for each user and each access point in the network.
The collected NetFlow data are enriched with the information about the association between the user’s device and the access point used at the instant of each flow occurrence. Reis et al. describe the data capture phase, detail the dataset construction, and explain the key features of the dataset [13]. The enriched data have features related to the network flows, access points, and other categorical features. The flow-related features are the number of packets, duration, and number of transferred bytes. The access point features are the number of associated devices and the identification of the access point. Besides, the categorical features identify accessed services, transport protocols, transport protocol flags, and the access point each user is associated with. The categorical features expand the dataset into a space with more than 650 features, as each monitored access point becomes a flow feature (Although the dataset is anonymized, it still may contain sensitive information. Therefore, the dataset is publicly available under a non-disclosure agreement by contacting the corresponding author.). These data are the input of the K-means unsupervised clustering algorithm. The algorithm attempts to find the centroid of discrete K groups within the data. The members of one group are as close as possible to each other while maximizing the distance to members of other groups. Thus, the algorithm’s goal is to reduce the internal distance and increase the external distance. In the paper, the distance is the degree of similarity of the records, represented by the Euclidean distance. The proposed strategy uses a modified version of the clustering algorithm, K-means Web-Scale [24]. This version is more accurate than the original, maintaining the scalability characteristics even for large datasets, while training in a feasible time frame. The employed algorithm uses mini batches of training data, which are small, random sets of the original data. The k-means algorithm receives the data in tabular format, where the rows represent the collected traffic data, and the columns represent the features of the data. The n features in each row represent a point in an n-dimensional space. The Euclidean distance between these points is used to represent the similarity in each data flow, and the algorithm uses this distance function to group the network flow.
As it is an unsupervised learning algorithm, the final groups in the training set are unknown at first. Nevertheless, it is necessary to initiate the algorithm with the number of groups to be defined. Each group represents a user profile in the network. The effectiveness metric for determining model parameter optimization and obtaining the best assertiveness is defined as minimizing the mean squared distance of each point in each group to the center of the nearest group. The smaller the effectiveness metric, the better is the defined model. Therefore, the goal is to find the set of groups C of the group of centroids c n , where n is the number of features in the dataset and | C | = k is the number of users’ profiles that best describe the dataset. The algorithm minimizes the function
m i n x X | | f ( C , x ) x | | 2 ,
through a set X of the collected data, with a sample x X and x n , where f ( C , x ) returns the center c C closest to x using the Euclidean distance. Since this is an NP-hard problem, the algorithm terminates after the defined number of iterations. The number of iterations is also the subject of analysis in the experimental evaluation of the proposed strategy.

3.3. Model for Predicting Expected User Behavior and Expected Usage on Access Points

The third part of the proposal forecasts the workload at each access point based on the network users’ profiles. From the grouping of each flow and the probability of the user is associated with a given access point, the forecasting considers the probability of the user have a flow with a defined user profile. We assume that a given user that does not perform any network communication during the analyzed period is in the “no profile” state ( P U 0 ). Like the workload forecasting model, we build the transition matrix, T P U , where each element t i j P U represents the probability of a user switching from the user profile P U i to the user profile P U j . In this way, the matrix T P U represents the transition probabilities between users’ profiles and has dimensions ( K + 1 ) × ( K + 1 ) , where K is the number of detected users’ profiles in the wireless network. To this end, we assume that a user’s transition between different profiles is a Markovian process and thus independent of the previous states. The assumption is consistent with the observation that the network usage profile is associated with the network’s instantaneous occupancy and usage conditions.
Thus, for each user, we assemble the T P U m matrix of user profile transition, at each time interval Δ t = m of the collected flows.
Similar to workload forecasting, we perform the decomposition of the transition matrix into singular values. Selecting the normalized eigenvector U n m , the invariant of the matrix represents the probability that user n is generating network traffic associated with a given user profile at time m x . Since there is no historical correlation between flows, it is possible to use a first-order Markov chain as each flow is independent for a given application. Thus, we assume that the current profile depends only on the previous profile, and the transition from any user profile to any other profile is possible. Then, using the probabilities of a user assuming a profile and being connected to a given access point, it is possible to infer the probability that a flow of a given user profile is in use at an access point through conditional probability. Considering that the user being associated with a given access point and the user profile are independent variables, the probability that a profile w ( P U w ) is present at access point k ( A P k ) at time m x is given, for each user j, as the product P j m [ A P k ] × U j m [ P U w ] .
Thus, at each time m x , the expected value for a load of each user profile ( P U w ) at an access point k ( A P k ) is the sum of the probabilities of the invariants of each user n at that instant m x , according to:
E ( P U w e m A P k ) m = P a r a P U 0 j N P j m [ A P k ] × U j m [ P U 0 ] P a r a P U 1 j N P j m [ A P k ] × U j m [ P U 1 ] P a r a P U 5 j N P j m [ A P k ] × U j m [ P U 5 ] . .
Therefore, the expected workload of each network usage profile at each of the access points throughout the day can be defined.

4. Experimental Analysis of the Proposed Strategy

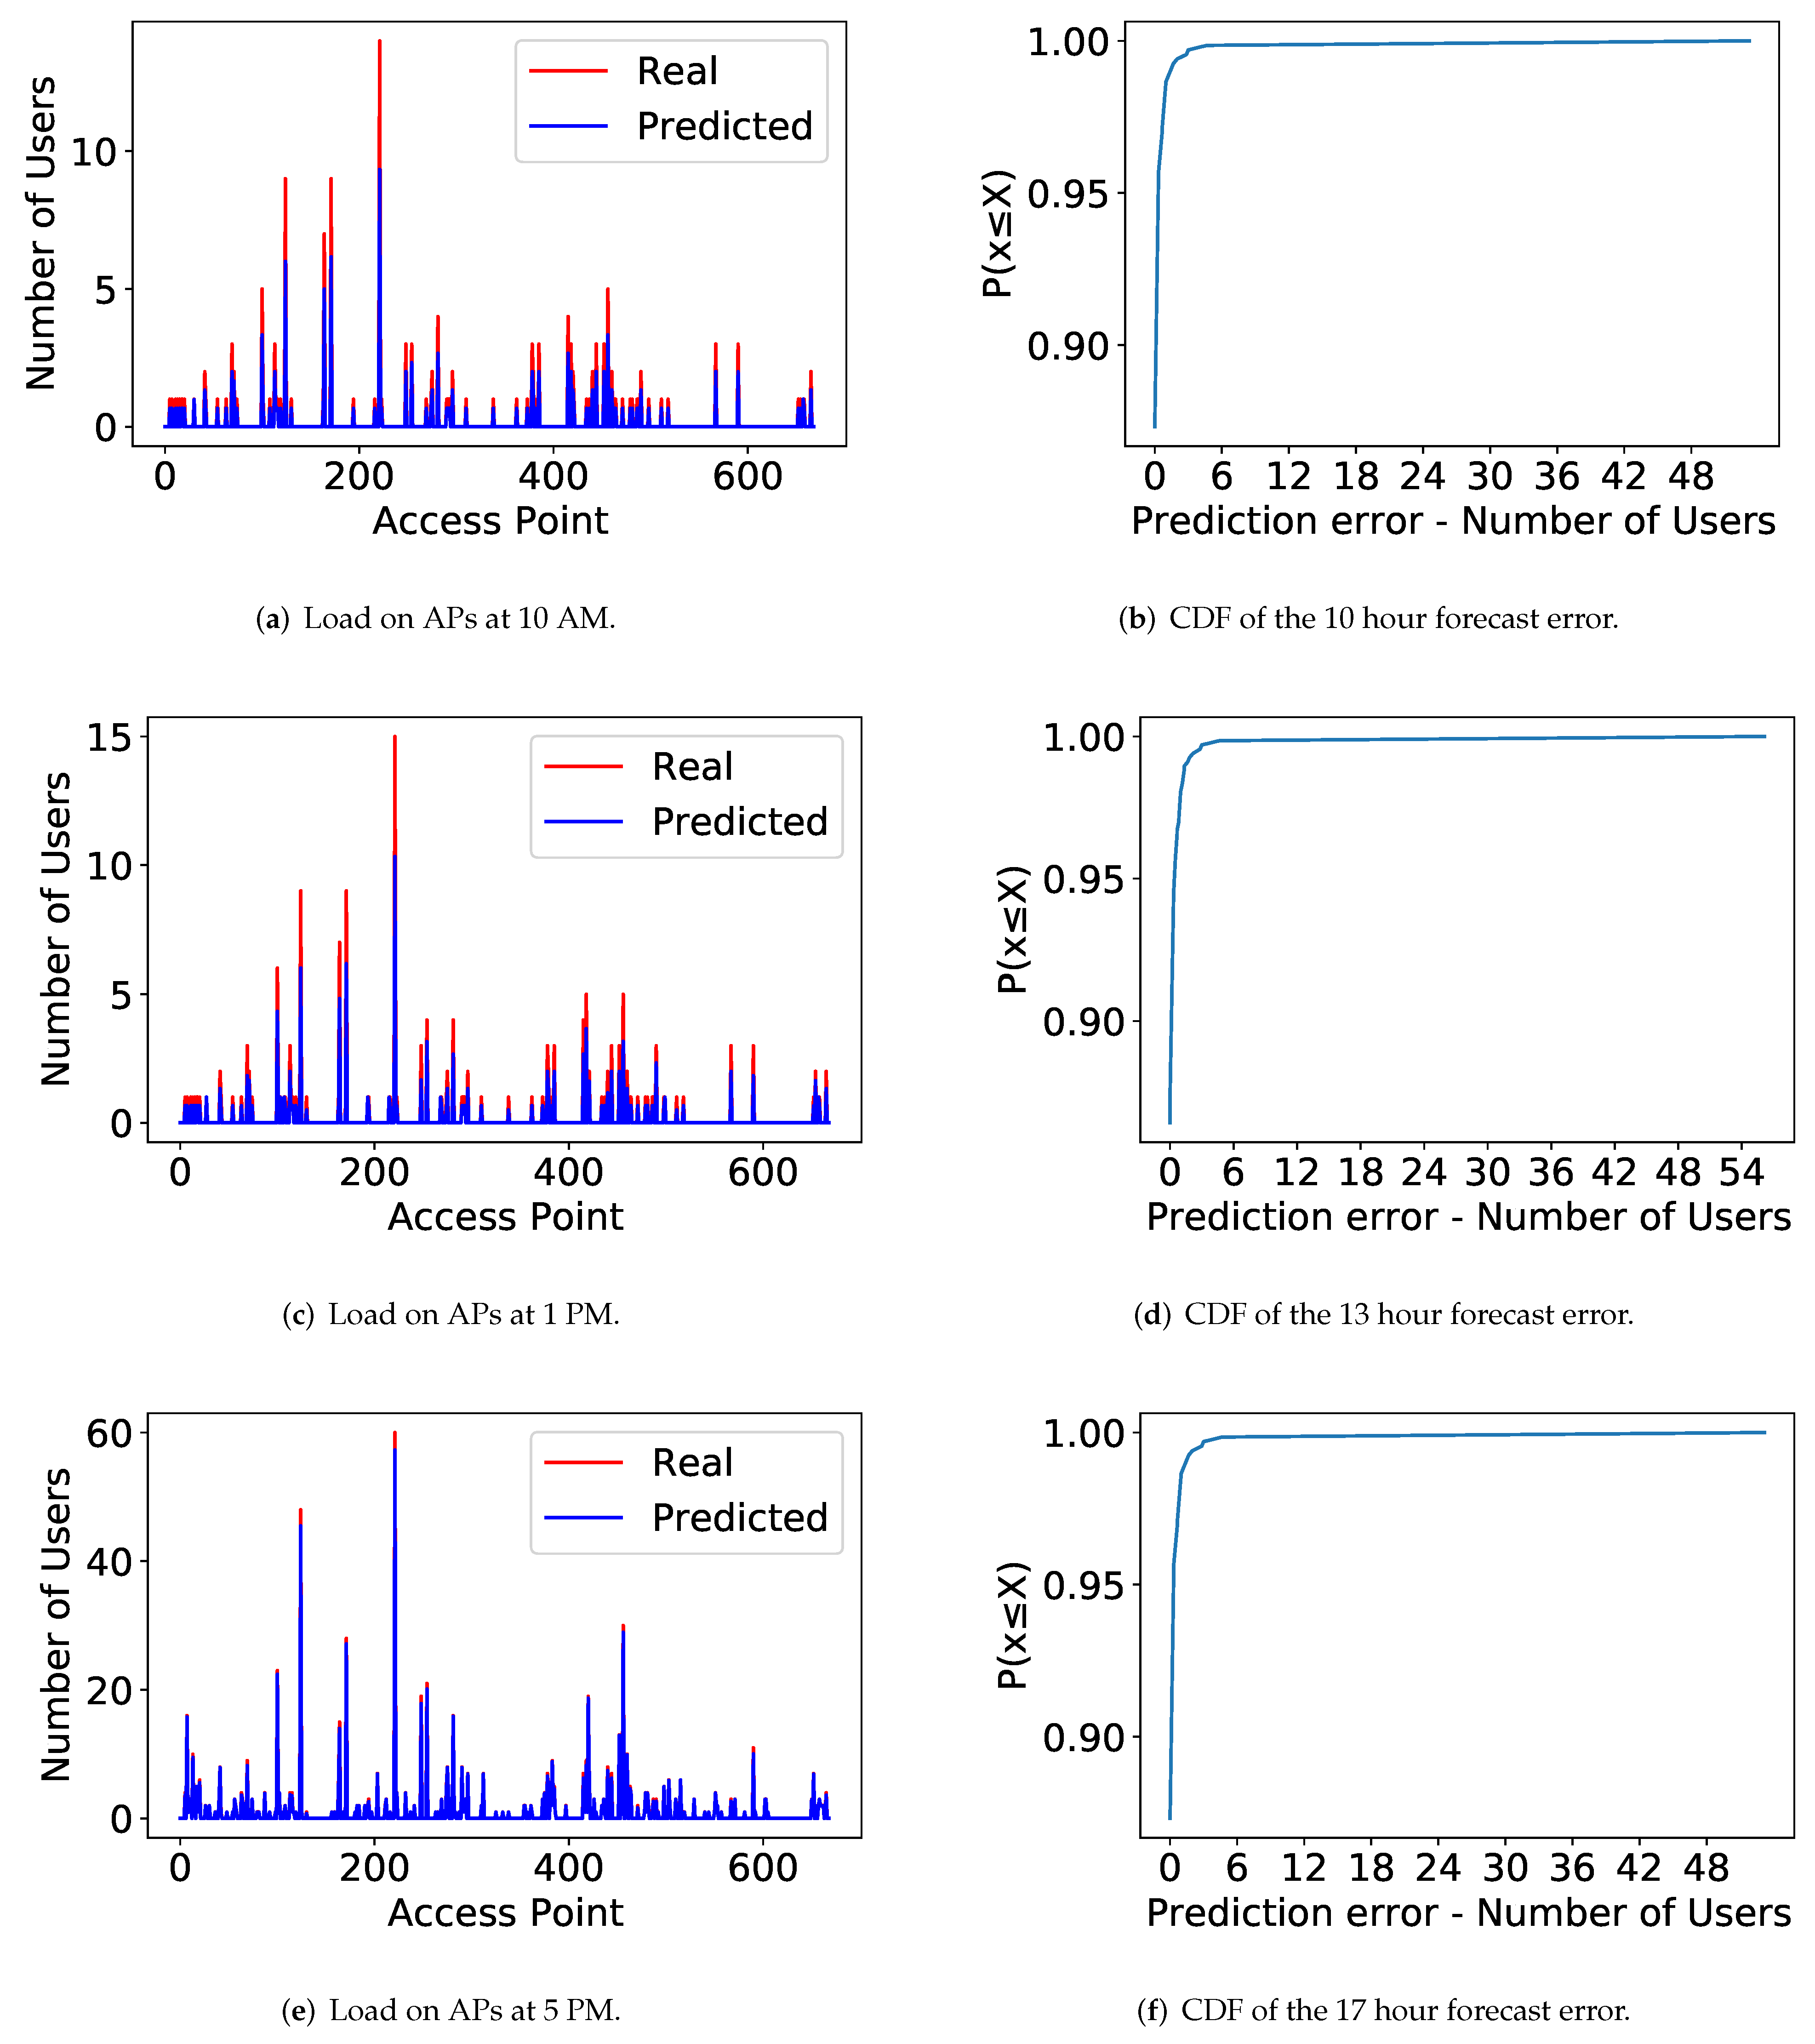
Considering the proposed strategy, in this paper, we deploy a virtual server on Amazon AWS with 32 GB of RAM to process all the traffic matrices of the academic network. Table 1 shows experiment characteristics. The load analysis on each network’s access points is carried out at fixed intervals, every 10 min, in which the association of each user to the APs in the network is evaluated. Figure 2 shows that the proposed model, based on first-order Markov chains, estimates the expected load on each access point with good predictive accuracy, achieving 90% assertiveness for all access points. Figure 2a,c,e present, respectively, the results obtained for the data collected at 10 AM, 1 PM and 5 PM for all access points. There is a large overlap between the values for predicted load and actual load for all access points, indicating that the prediction is assertive. It is worth noting that each time of day presents different load behaviors, with different numbers of users. To statistically evaluate the model assertiveness, Figure 2b,d,f show the cumulative distribution function for the model’s forecasting errors for each hour of the day represented. Regardless of the usage pattern for each hour of the day, the proposed model is accurate for more than 90% of the Access Points in the network within a confidence interval of 90%.
Figure 3 shows how the proposed model follows the actual access workload curve for two specific access points during the day. The chosen access points, AP 222 and AP 255, are critical in the network, as they are among the 20 most used in the entire network. AP 222 has the worst prediction, the greatest cumulative absolute error, and the highest use in the network among the access points. In contrast, AP 255 has the most accurate prediction, the smallest error. The comparison between the forecasted and the actual workload is shown in Figure 3a for the AP 222 and in Figure 3b for the AP 255. It is noteworthy that the model tends to predict access load with less assertiveness at the beginning of the network operation when there is less network traffic. As the number of flows in the network increases, the volume of data for analysis grows, improving model accuracy for both APs. Examples in Figure 2 ratify this conclusion, as the model precision is greater for the analysis at 5 PM in comparison to analysis in previous hours. The observation is consistent for all access points. This characteristic is favorable to the proposed model since the forecast accuracy increases with the number of associations to the network.
Figure 4 compares three different model evaluation metrics for traffic prediction. Figure 4a shows the Root Mean Square Error (RMSE) of the model. The RMSE is a way of evaluating the difference between an estimator and the true value of the estimated quantity. MSE is the Mean Square Error, with the error being the amount by which the estimator differs from the quantity to be estimated. MSE is defined as:
M S E ( θ ^ ) = 1 N i ( θ ^ i θ i ) 2 ,
where θ ^ is the estimator being evaluated, and θ i represents the actual values. The results show that the mean square error is less than 0.15 for any access point throughout the day. It is noteworthy that the minimum error value is reached when there is the highest volume network usage. R 2 score shows the ratio of the prediction variance that the model can correctly forecast. R 2 score is given by:
R 2 = 1 i ( y i f i ) 2 i ( y i y ¯ ) 2 ,
where y i represents the actual measured value, f i represents the predicted value, and y ¯ is the average of the values. Figure 4b shows the results for the consolidated R 2 score for all access points. The results show that the model predicts more than 0.80 of workload variation at the access points throughout the day. The result also confirms that the model’s precision increases at times of greater use of the network. Finally, Figure 4 shows the maximum error between the forecast and the current load of the access points throughout the day. It turns out that the maximum error is limited to five users per access point for most of the day. However, the maximum error, approximately seven users per access point, occurs when there is a discontinuity in the network load caused by the abrupt drop in network usage at the end of the day. It is a limitation of using Markovian models.
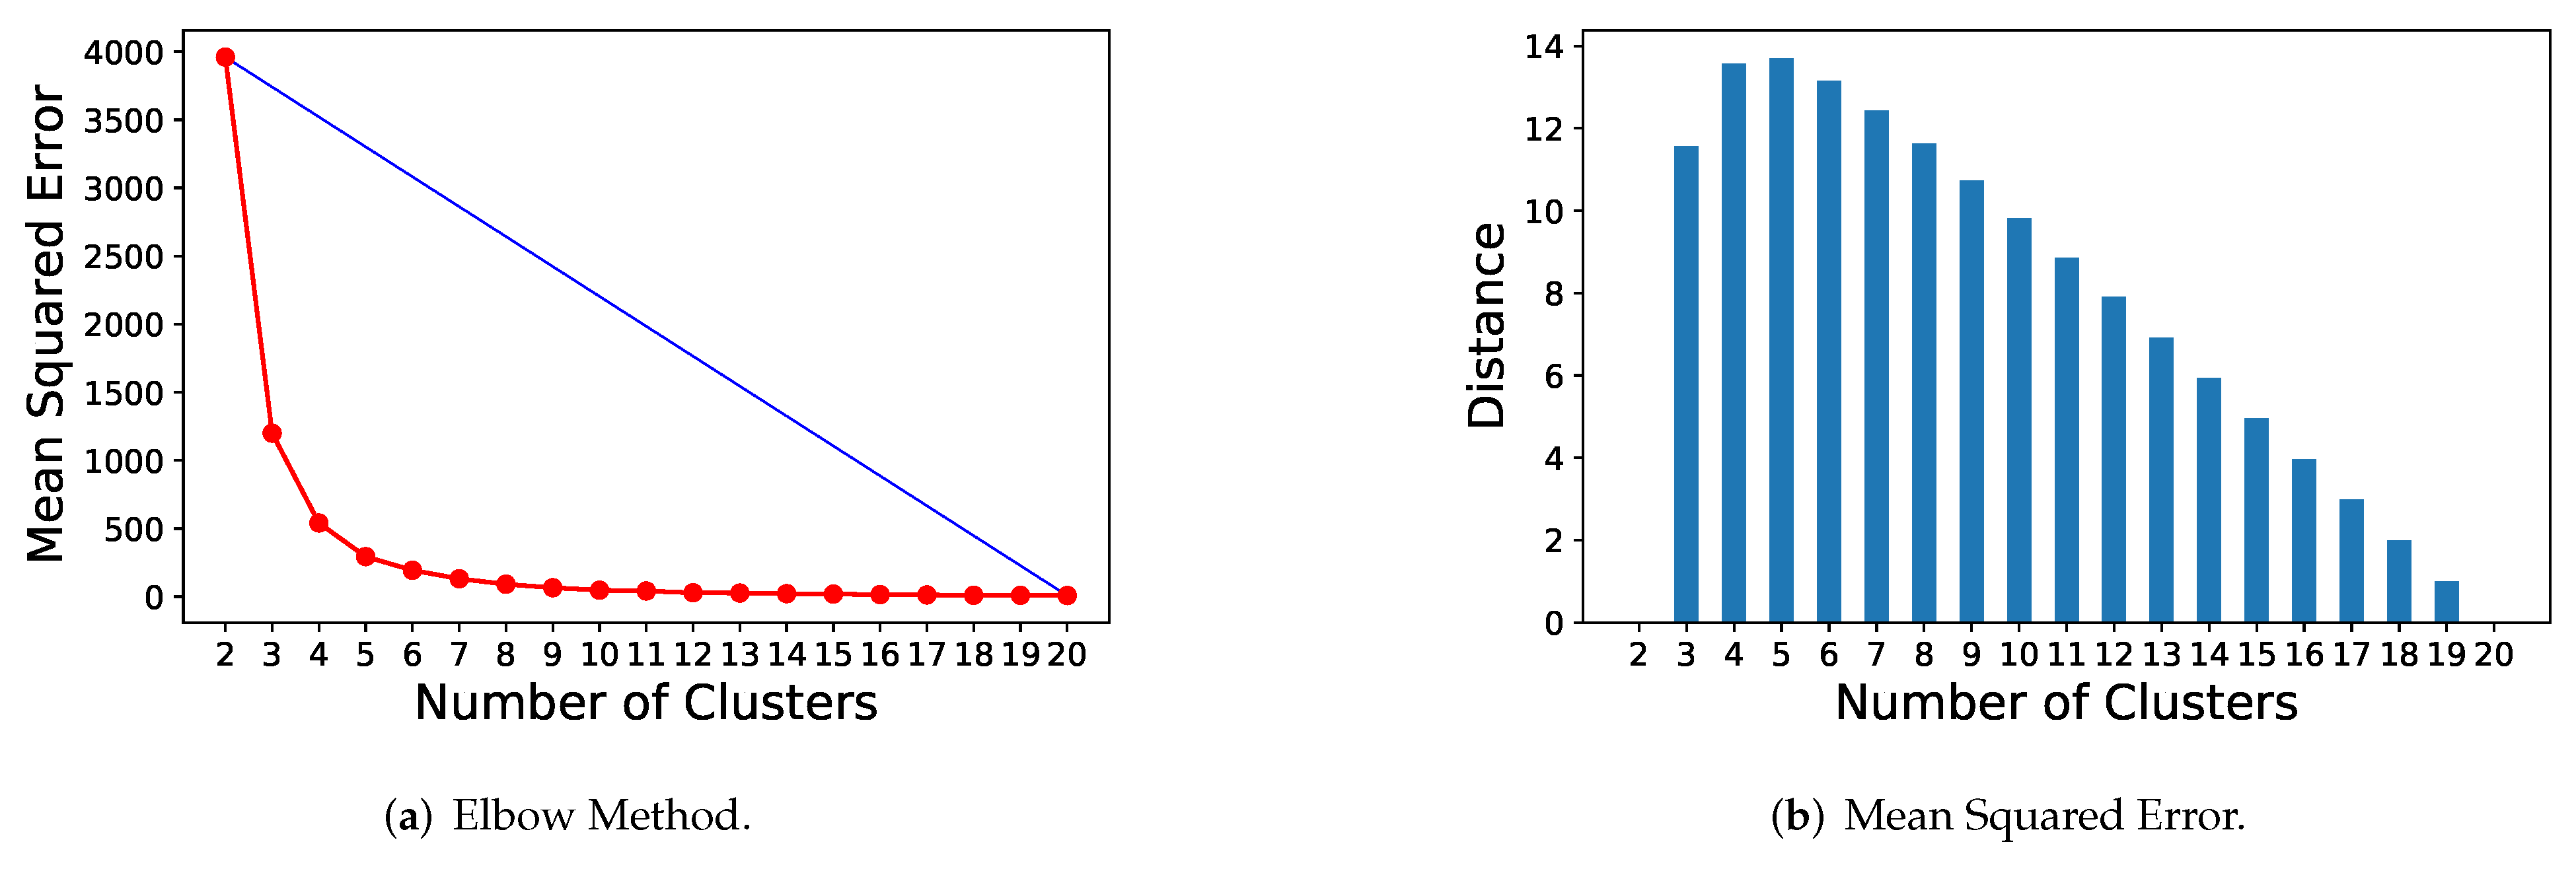
Besides the workload forecasting, the proposal also evaluates the users’ profiles. The proposal is based on the k-means Web-Scale algorithm to identify network users’ profiles. Figure 5a presents the comparison of the Mean Square Error for the distance between samples and the cluster centroid for clustering the dataset into 2 up to 20 clusters. According to the Elbow method, we conclude that the ideal number of clusters for the analyzed data is five groups. The Elbow method aims to identify the best balance between processing cost and data modeling quality, determining when the gain is no longer significant to add one more cluster. The Elbow method consists in drawing a straight support line connecting the two ends of the error curve by the number of clusters, in blue, and calculate the distance between the Mean Square Error curve for a given number of groups and the straight support line in blue [25,26]. The best number of clusters is the one that presents the most significant distance between the point in the Mean Square Error curve and the support line. Figure 5b shows the comparison between the distance of errors per number of groups and the support line. The algorithm’s configuration that presented the best performance is the one with five clusters. At this point, there is an inversion in the error growth trend, indicating the best trade-off between the number of clusters and processing. Therefore, five user profiles are considered in the analyzed network. In this way, it is possible to quickly apply to each new flow reported by NetFlow, the clustering model of network flows for user’ profiles and, thus, determine the workload pattern that best applies to the users on an access point.
Using the data enriched by the users’ profiles, it is possible to execute the proposed strategy and forecast the workload at each access point according to the users’ profiles. Figure 6 shows the cumulative probability distributions of forecast errors for each of the profiles at three times of the day: 10 AM, shown in Figure 6a, 1 PM in Figure 6b and 5 PM in Figure 6c. The results reveal that the workload prediction based on profiles is accurate for all profiles since the number of errors is less than five for more than 90% of the cases evaluated.

5. Conclusions

Large-scale wireless networks are increasingly common, and their adoption has grown considerably. However, it is still challenging to forecast the workload on these networks and estimate users’ behavior into different access points. In this paper, we proposed to build a workload prediction model for each user profile using network flow data, reported by the NetFlow, and the registries of device association with access points in the network. We evaluated our proposal in a subset of 363 access points of the wireless network from the Universidade Federal Fluminense (UFF), one of the Brazilian biggest public universities, with more than 60,000 registered users for its wireless network, registering peaks of 5000 concomitant users. The proposed strategy accurately forecasts the workload in 90% of the tested scenarios. The evaluation of the proposed strategy shows that its assertiveness is more significant when there is more network traffic, as there is a more significant data volume for analysis. In the case of little data to analyze, the error margin increases as there is less information to model the forecasting. The results show that the proposed strategy achieves a normalized Mean Squared Error between 0.10 and 0.15 for all access points during evaluation periods. Moreover, we show that the proposal achieves a r 2 score always greater than 0.80, which indicates a high correlation between the predicted model variations and the data. The absolute maximum error metric shows that seven users are the upper limit of the error between predicted and real values of the number of users in an access point. The proposal further considers estimating users’ profiles through an unsupervised machine learning algorithm (k-means), which proves to have the best performance with five different user profiles. Our proposal shows that the users’ profiles combined with the access forecast at each access point are powerful tools to predict future network behaviors precisely.
The proposal is an enabling technology for building smart campus networks, network anomaly detection systems, planning frameworks, and energy-saving solutions through the disconnection of underused access points. Moreover, the proposed strategy is also the basis for implementing intelligent data caching and quality of service control solutions. As future work, we intend to analyze the users’ movement in the network, mapping movement in the university campus using deep neural networks for processing traffic matrices as a function of time.

Author Contributions

All authors equally contributed for this research. All authors have read and agreed to the published version of the manuscript.

Funding

This research was funded by CNPq, CAPES, FAPERJ, FAPESP (2018/23062-5), RNP, and the City Hall of Niterói/FEC/UFF (PDPA 2020).

Institutional Review Board Statement

Not applicable.

Informed Consent Statement

Not applicable.

Data Availability Statement

Not applicable.

Conflicts of Interest

The authors declare no conflict of interest. The funders had no role in the design of the study; in the collection, analyses, or interpretation of data; in the writing of the manuscript, or in the decision to publish the results.

References

  1. Forecast, C.V. Cisco Visual Networking Index: Global Mobile Data Traffic Forecast Update, 2017–2022 White Paper; Wiley: Hoboken, NJ, USA, 2019. [Google Scholar]
  2. Divgi, G.; Chlebus, E. Characterization of user activity and traffic in a commercial nationwide Wi-Fi hotspot network: Global and individual metrics. Wirel. Netw. 2013, 19, 1783–1805. [Google Scholar] [CrossRef]
  3. Biswas, S.; Bicket, J.; Wong, E.; Musaloiu-E, R.; Bhartia, A.; Aguayo, D. Large-scale Measurements of Wireless Network Behavior. In Proceedings of the 2015 ACM Conference on Special Interest Group on Data Communication, London, UK, 17–21 August 2015; ACM: London, UK, 2015; pp. 153–165. [Google Scholar] [CrossRef]
  4. Balbi, H.; Fernandes, N.; Souza, F.; Carrano, R.; Albuquerque, C.; Muchaluat-Saade, D.; Magalhães, L. Centralized channel allocation algorithm for IEEE 802.11 networks. In Proceedings of the 2012 Global Information Infrastructure and Networking Symposium (GIIS), Choroni, Venezuela, 17–19 December 2012; pp. 1–7. [Google Scholar]
  5. Ferraz, L.H.G.; Mattos, D.M.F.; Duarte, O.C.M.B. A two-phase multipathing scheme based on genetic algorithm for data center networking. In Proceedings of the 2014 IEEE Global Communications Conference, Austin, TX, USA, 8–12 December 2014; pp. 2270–2275. [Google Scholar]
  6. Masdari, M.; Khoshnevis, A. A survey and classification of the workload forecasting methods in cloud computing. Clust. Comput. 2020, 23, 2399–2424. [Google Scholar] [CrossRef]
  7. Ghosh, A.; Jana, R.; Ramaswami, V.; Rowland, J.; Shankaranarayanan, N.K. Modeling and characterization of large-scale Wi-Fi traffic in public hot-spots. In Proceedings of the 2011 Proceedings IEEE INFOCOM, Shanghai, China, 10–15 April 2011; pp. 2921–2929. [Google Scholar] [CrossRef]
  8. Qian, F.; Wang, Z.; Gerber, A.; Mao, Z.; Sen, S.; Spatscheck, O. Profiling Resource Usage for Mobile Applications: A Cross-layer Approach. In Proceedings of the 9th International Conference on Mobile Systems, Applications, and Services, Washington, DC, USA, 28 June–1 July 2011; ACM: Bethesda, MD, USA, 2011; pp. 321–334. [Google Scholar] [CrossRef]
  9. Shye, A.; Scholbrock, B.; Memik, G.; Dinda, P.A. Characterizing and modeling user activity on smartphones: Summary. In Proceedings of the ACM SIGMETRICS International Conference on Measurement and Modeling of Computer Systems, New York, NY, USA, 14–18 June 2010; Volume 38, pp. 375–376. [Google Scholar]
  10. Oliveira, L.; Obraczka, K.; Rodríguez, A. Characterizing User Activity in WiFi Networks: University Campus and Urban Area Case Studies. In Proceedings of the 19th ACM International Conference on Modeling, Analysis and Simulation of Wireless and Mobile Systems, Malta, 13–17 November 2016; pp. 190–194. [Google Scholar] [CrossRef]
  11. Medeiros, D.S.V.; Cunha Neto, H.N.; Lopez, M.A.; Magalhães, L.C.S.; Fernandes, N.C.; Vieira, A.B.; Silva, E.F.; Mattos, D.M. A survey on data analysis on large-Scale wireless networks: Online stream processing, trends, and challenges. J. Internet Serv. Appl. 2020, 11, 6. [Google Scholar] [CrossRef]
  12. Lopez, M.A.; Mattos, D.M.; Duarte, O.C.M.; Pujolle, G. A fast unsupervised preprocessing method for network monitoring. Ann. Telecommun. 2019, 74, 139–155. [Google Scholar] [CrossRef]
  13. Reis, L.H.A.; Magalhães, L.C.S.; de Medeiros, D.S.V.; Mattos, D.M.F. An Unsupervised Approach to Infer Quality of Service for Large-Scale Wireless Networking. J. Netw. Syst. Manag. 2020, 28, 1228–1247. [Google Scholar] [CrossRef]
  14. Meireles, R.; Rodrigues, A.; Stanciu, A.; Aguiar, A.; Steenkiste, P. Exploring Wi-Fi Network Diversity for Vehicle-To-Infrastructure Communication. In Proceedings of the 2020 IEEE Vehicular Networking Conference (VNC), New York, NY, USA, 16–18 December 2020; pp. 1–8. [Google Scholar] [CrossRef]
  15. Lyu, F.; Ren, J.; Cheng, N.; Yang, P.; Li, M.; Zhang, Y.; Shen, X.S. Big Data Analytics for User Association Characterization in Large-Scale WiFi System. In Proceedings of the IEEE ICC 2019—Empowering Intelligent Communications (ICC’19), Shanghai, China, 20–24 May 2019. [Google Scholar]
  16. Mattos, D.M.; Duarte, O.C.M.; Pujolle, G. Profiling software defined networks for dynamic distributed-controller provisioning. In Proceedings of the 2016 7th International Conference on the Network of the Future (NOF), Buzios, Brazil, 16–18 November 2016; pp. 1–5. [Google Scholar]
  17. Marques, H.; Torres, P.M.B.; Marques, P.; Dionísio, R.; Rodriguez, J. Load Forecasting in WiFi Access Points over the LTE Network. In Proceedings of the International Conference of Mechatronics and Cyber-MixMechatronics—2017; Gheorghe, G.I., Ed.; Springer International Publishing: Cham, Switzerland, 2018; pp. 132–137. [Google Scholar]
  18. Son, T.A.; Linh, N.T.T.; Dang, N.N. Solving Resource Forecasting in Wifi Networks by Hybrid AR-LSTM Model. In Intelligent Systems and Networks; Tran, D.T., Jeon, G., Nguyen, T.D.L., Lu, J., Xuan, T.D., Eds.; Springer: Singapore, 2021; pp. 327–336. [Google Scholar]
  19. Barbosa, G.; Andreoni Lopez, M.; Medeiros, D.; Mattos, D.M.F. An Entropy-based Hybrid Mechanism for Large-Scale Wireless Network Traffic Prediction. In Proceedings of the 2021 International Symposium on Networks, Computers and Communications (ISNCC): Wireless and Mobile Networks (ISNCC-2021 WMN), Dubai, United Arab Emirates, 1–3 June 2021. [Google Scholar]
  20. Chatzoglou, E.; Kambourakis, G.; Kolias, C. Empirical Evaluation of Attacks Against IEEE 802.11 Enterprise Networks: The AWID3 Dataset. IEEE Access 2021, 9, 34188–34205. [Google Scholar] [CrossRef]
  21. Claise, B. Cisco Systems Netflow Services Export Version 9; Technical Report; IETF: Fremont, CA, USA, 2004. [Google Scholar]
  22. Singh, V.K.; Dutta, K. Dynamic price prediction for Amazon spot instances. In Proceedings of the 2015 48th Hawaii International Conference on System Sciences, Kauai, HI, USA, 5–8 January 2015; pp. 1513–1520. [Google Scholar]
  23. Papadopouli, M.; Shen, H.; Spanakis, M. Modeling client arrivals at access points in wireless campus-wide networks. In Proceedings of the 2005 14th IEEE Workshop on Local Metropolitan Area Networks, Chania, Greece, 18–21 September 2005; p. 6. [Google Scholar] [CrossRef]
  24. Sculley, D. Web-scale k-means clustering. In Proceedings of the 19th International Conference on World Wide Web, ACM, Raleigh, NC, USA, 26–30 April 2010; pp. 1177–1178. [Google Scholar]
  25. Bholowalia, P.; Kumar, A. EBK-means: A clustering technique based on elbow method and k-means in WSN. Int. J. Comput. Appl. 2014, 105, 17–24. [Google Scholar]
  26. Syakur, M.; Khotimah, B.; Rochman, E.; Satoto, B. Integration K-Means Clustering Method and Elbow Method for Identification of The Best Customer Profile Cluster. In IOP Conference Series: Materials Science and Engineering; IOP Publishing: Bristol, UK, 2018; Volume 336, p. 012017. [Google Scholar]
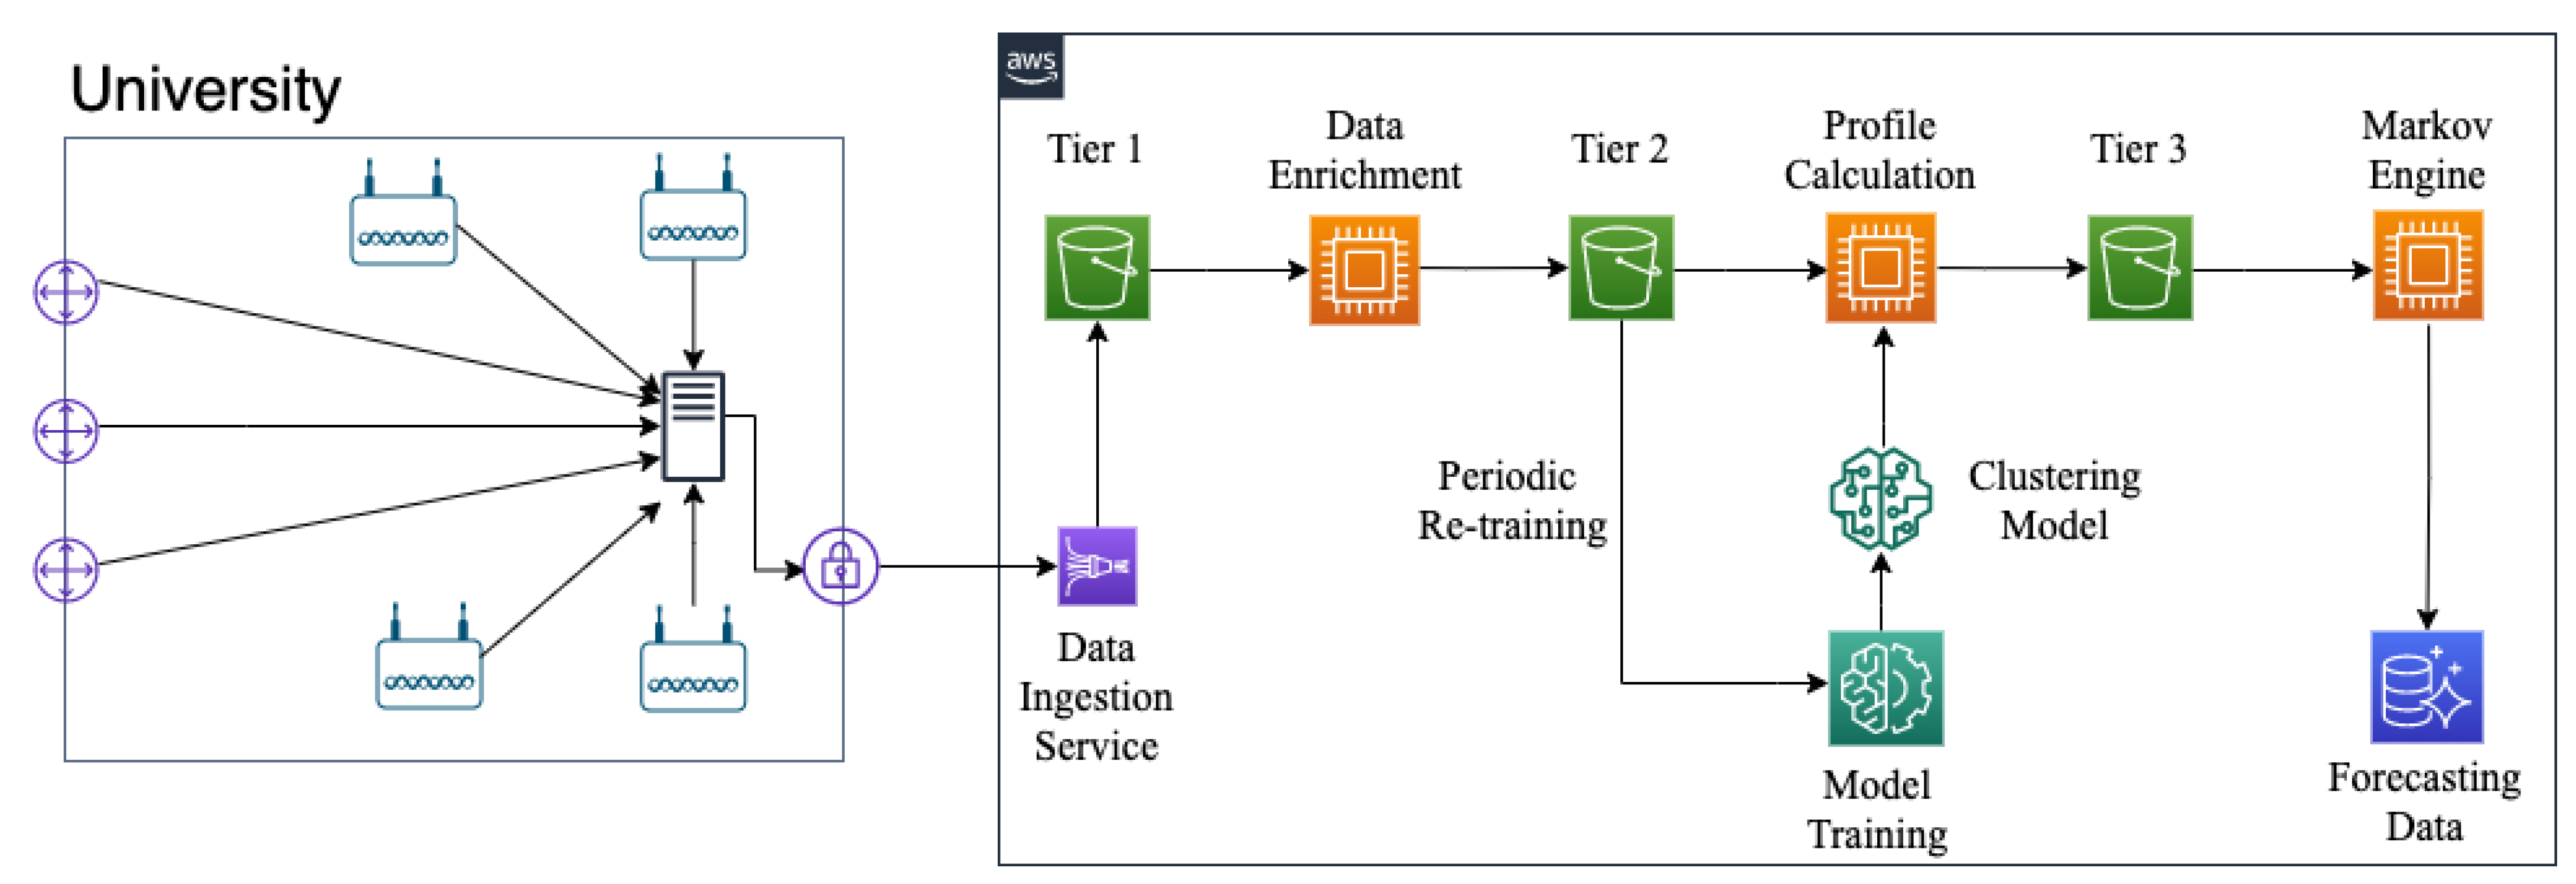
Figure 1. Diagram of the proposed strategy for users’ profile identification and load forecasting on the network. Data are de-identified in the central server at the University, and the de-identified data are processed in the AWS cloud environment.
Information 12 00488 g001
Figure 2. The comparison between the actual load and the load predicted load. The Cumulative Distribution Function (CDF) of the model prediction errors show that the proposed model has prediction assertiveness always above 90% for all access points.
Information 12 00488 g002
Figure 3. Comparison between actual and predicted load for Access Points 222 and 255 which are among the 20 most used APs. (a) AP 222 has the largest absolute cumulative error of the prediction. (b) AP 255 has the smallest absolute cumulative error.
Information 12 00488 g003
Figure 4. Workload prediction quality metrics for the proposed strategy. Metrics are applied to all access points over a day. (a) The more significant is the load on the network, the smaller is the error. (b) The model predicts more than 0.80 of the variation for all cases. (c) The model error is limited to 7 users per access point.
Information 12 00488 g004
Figure 5. Representation of the number of clusters that best represents the data set. (a) The Elbow method searches for the number of clusters, red curve, that is furthest from the support line in blue. (b) Mean square error between the samples and the centroid in each configuration with different number of clusters.
Information 12 00488 g005
Figure 6. Comparison of the cumulative distribution functions (CDF) of the profile load forecast errors at the grid points at (a) 10 AM, (b) 1 PM and (c) 5 PM.
Information 12 00488 g006
Table 1. Experimental set-up features. The large-scale wireless network accounts for up to 5000 concurrent users and serves more than 60,000 users in total.
FeatureExperimental Set-Up Value
Access Points363
Internet Gateways5
Collected Days8
Unique Devices Detected6770
Peak network traffic100 Mb/s
Publisher’s Note: MDPI stays neutral with regard to jurisdictional claims in published maps and institutional affiliations.