1. Introduction
Motivated by the massive use of social media e.g., Facebook, Instagram, and Twitter, etc. and enhancements in image processing software applications, image forgery has become very popular and hence the need for image forgery detection has also increased.
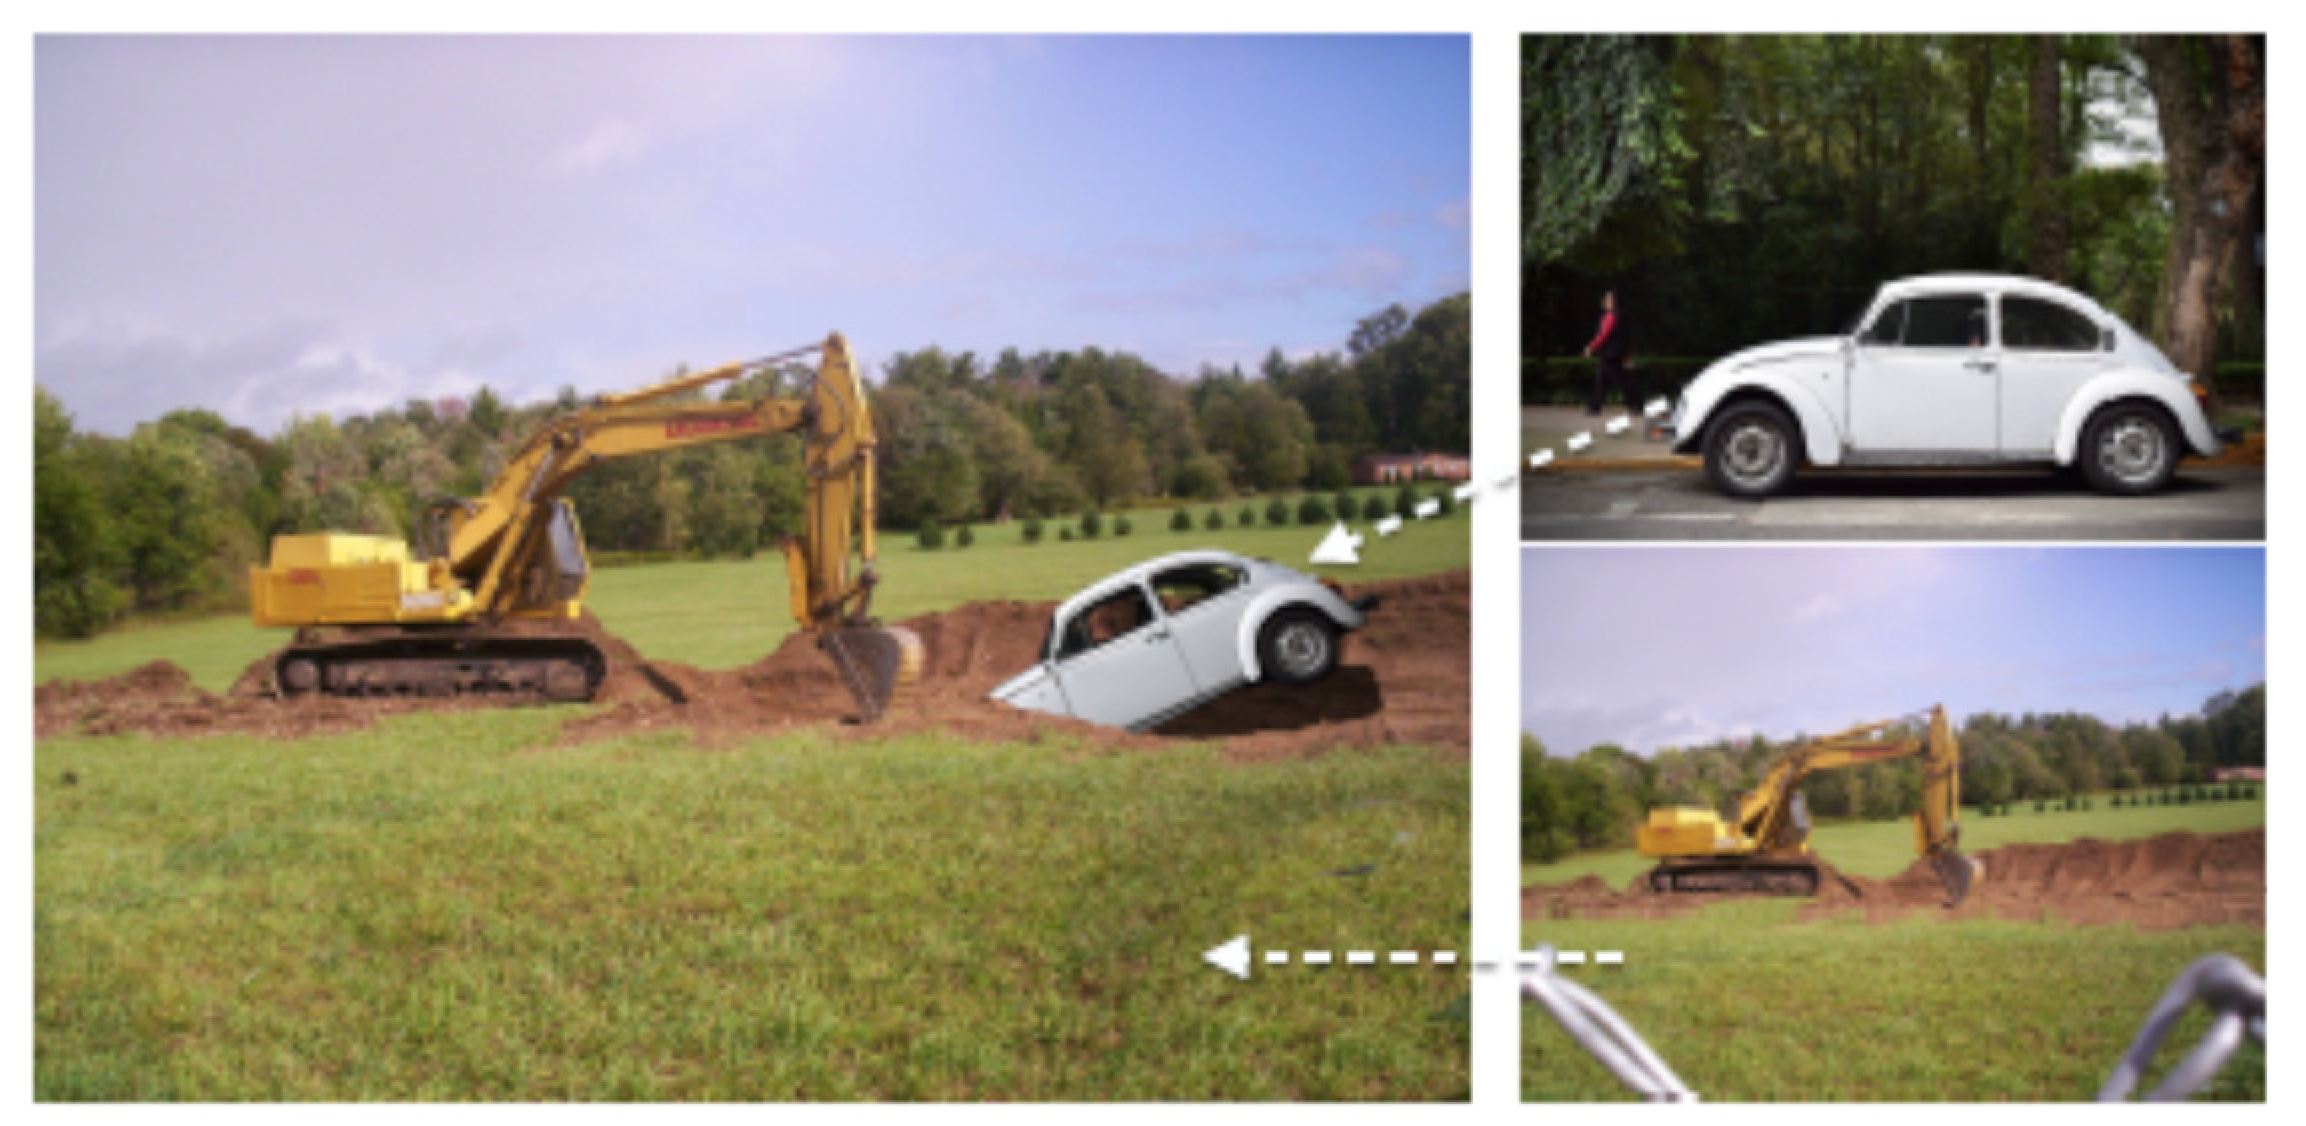
Image manipulations that are done by the procedure of clipping and pasting areas, are one of the most well-known forms of digital image editing. This manipulation is distinguished as a copy–move image forgery. Image splicing is the most well-known type of image faking. It cuts and pastes areas from one or more different images cautiously to produce new synthesized digital images as shown in
Figure 1. Therefore, detection and localization of these forgeries to reliably and automatically determine the authenticity of images have become an important and popular issue.
Recently, deep learning interest has grown and various noteworthy results are becoming visible. By this motivate, tampering detection researchers have attempted the use of deep learning to detect the images’ changes without human intervention. Deep learning has been convenient in the field of image processing science. Two crucial areas are driving the success of deep learning use in image processing:
First, convolution neural network (CNN) architecture takes the fact that pixels and their neighborhood are highly correlated. Therefore, a CNN does not use one-to-one links among all pixels (as in major neural networks).
Second, CNN architecture counts on feature sharing, and so each channel or feature map is formed from a convolution operation using the same kernel at all positions [
2].
The manipulation and editing of digital images has become a significant issue nowadays. There are various applications such as digital forensics, scientific publications, medical imaging, journalism, insurance claims, political campaigns, where image manipulation can be easily made. To specify whether an image is genuine or forged is a major challenge to researchers. The detection models proposed are beneficial to many applications in which the authenticity of a digital image has an influential impact.
Additionally to this, there are numerous editing processes executed on the forged areas to appear similar to the genuine areas. This demands the development of a universal forgery detection model that not only detects various image editing manipulations present in the forged image, but also can be capable of being generalized to editing manipulations not present in the forged image. This will let the model be more generalized to detect any type of editing or manipulations even if the model is not trained on it. The majority of the existing forgery detection models focalize on identifying a particular forgery editing (e.g., copy–move or splicing). Therefore, these models cannot perform better for other kinds of forgery. Additionally, it is impracticable and unrealistic to suppose that manipulation editing will be known in advance. In real-life, an image forgery detection model should be able to detect all types of manipulation editing rather than focalizing on a certain type.
Therefore, some questions exist with the account to CNNs design and training for image forgery detection:
Do design parameters like the pooling mechanism or activation function choice have considerable effects on the accuracy?
What effect do various normalization techniques like batch normalization and local contrast normalization have on CNN’s accuracy?
To lead the research for using CNN models in image security, it is remarkable to address these issues. In this paper, we consistently analyze CNN design choices for image forgeries detection. Specifically, we investigate:
The effect of activation functions selection on the performance.
The effect of different normalization approaches such as batch normalization and local contrast normalization.
The variation between softmax classifier and SVM classifier.
Besides that, we prove that CNN can be designed to carry out several diverse forensic issues. The investigation done reveals that both general CNN design principles that are important regardless of the forensic assignment, along with other design choices that must be appropriately selected depending on the chosen forensic assignment. To ensure that the proposed model is robust, k-fold cross-validation is implemented, which means that the training process and testing process are executed on varieties of datasets that have been collected separately. The major contributions of the work done in this paper are as indicated in the following:
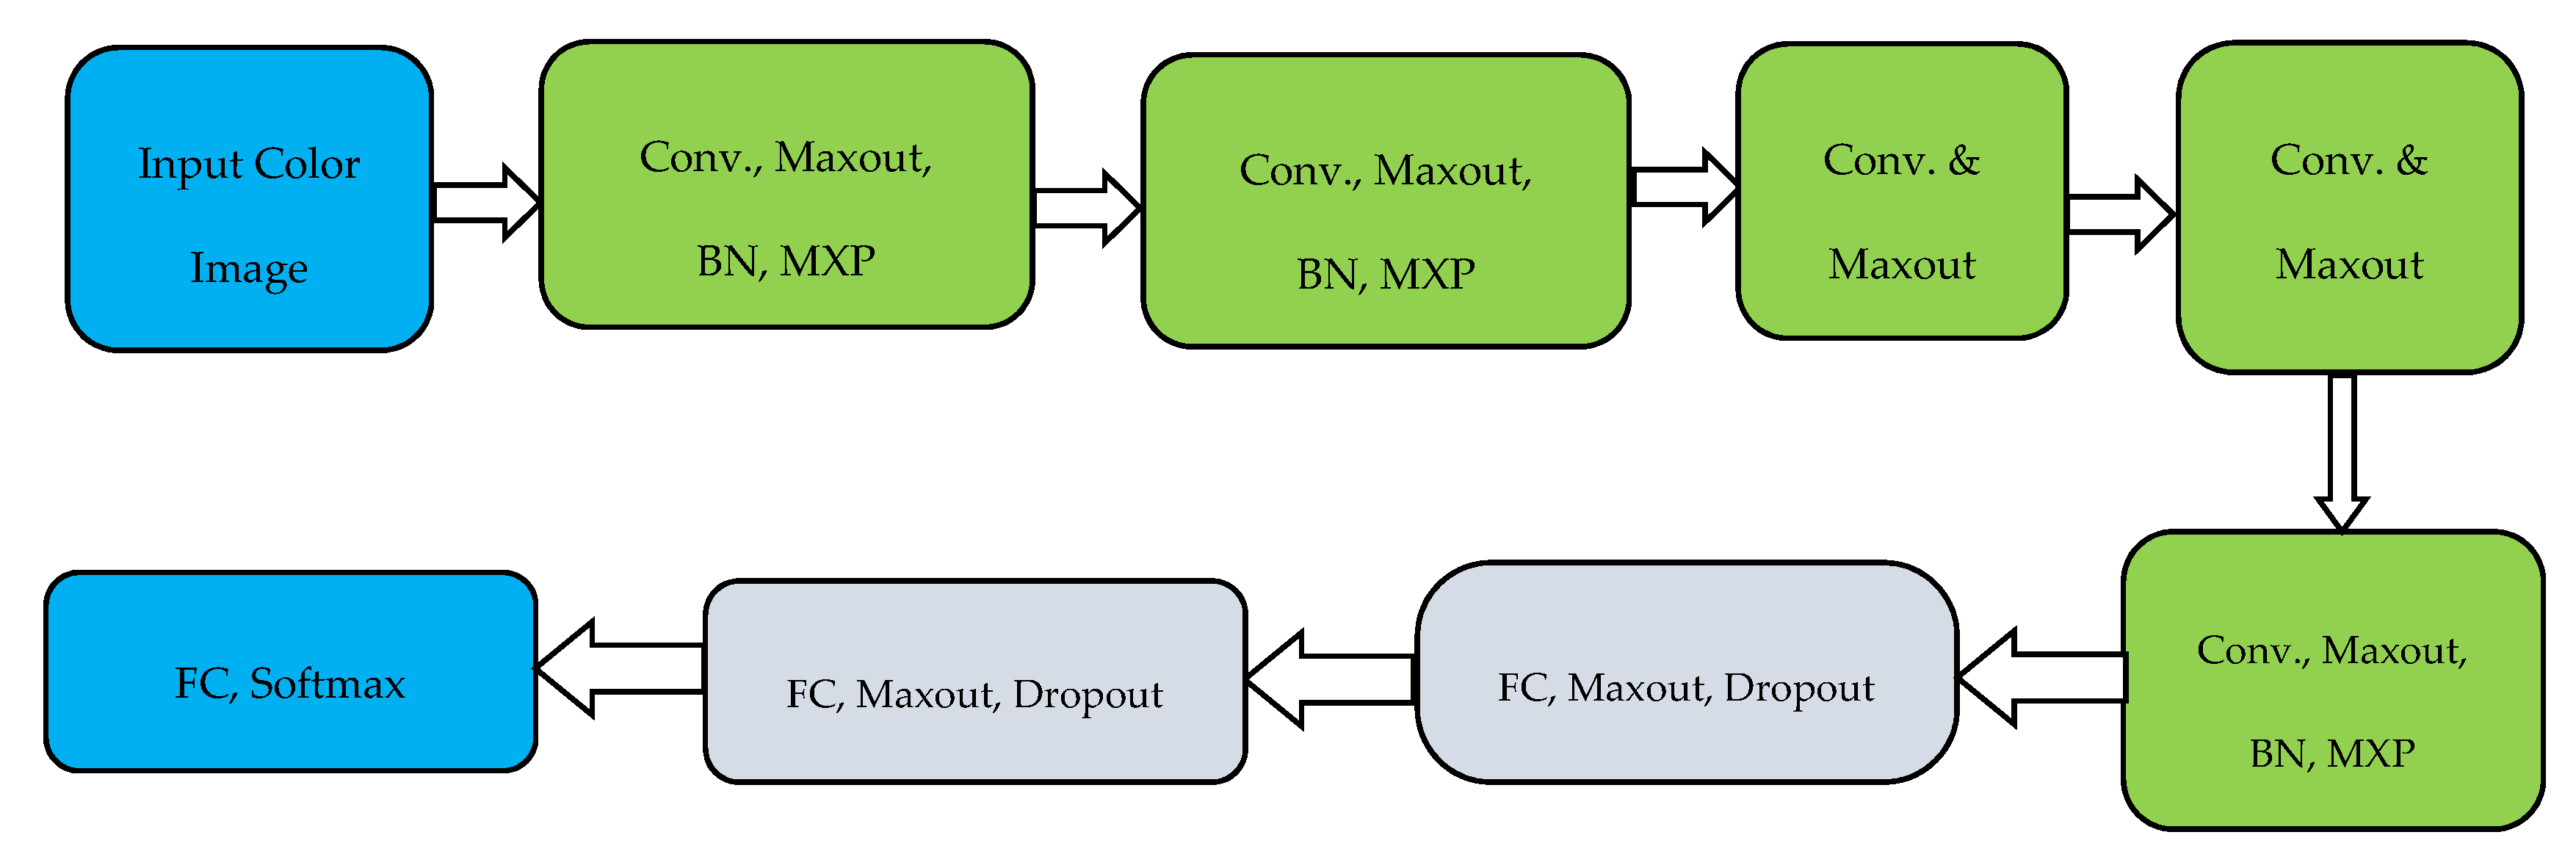
We propose an AlexNet model that is capable of detecting various image tampering and manipulations.
We introduce the proposed modified AlexNet model architecture, provide a detailed discussion of how it is constructed, as well as provide intuition into why it works.
We conduct a large scale experimental evaluation of the proposed architecture and show that it can outperform existing image manipulation detection techniques, can differentiate between multiple editing operations even when their parameters change, can localize fake detection results, and can provide excessively accurate forgery detection results when trained using a huge training dataset.
The motivation and reason behind choosing AlexNet as a core of the proposed model are that the ability of fast network training and its capability of reducing overfitting. The reasons why the AlexNet model is suitable for the analysis of forged images are its deep structure, its simple structure, fast training time, and less memory occupation. Provided that, the improvements we have made to the model (using max-out and batch normalization). All of these reasons lead the AlexNet to be one of the best choices in the forgery detection process. Through experiments sequence, the proposed AlexNet model can be learned automatically to discover and detect multiple types of image editing. This eliminates the need for time-consuming human intervention to outline forensic detection features. AlexNet is used to make the training faster and reducing overfitting. The remainder of this paper is organized as follows:
Section 2 discusses the related works and gives an overview of how to use CNN in image forgery detection.
Section 3 presents our study to obtain robust image manipulation and our framework to detect image forgeries.
Section 4 shows our experimental results; and we conclude this paper in
Section 5.
2. Related Work
In the latest years, techniques based on deep learning have become assertive. Some early work proposed CNN architectures with the first layer of high-pass filters, either fixed [
3], [
4] or trainable [
5], meant to extract feature maps. It has been shown in [
6] that successful methods based on handcrafted features can be recast as CNN and fine-tuned for improved performance. In Ref. [
7] these low-level features are augmented with high-level ones in two-stream CNN architecture. In both [
8,
9], it was clarified that the constrained first layer used is better only for small networks and datasets. Given a reasonable large training dataset, deep models provide the identical results in favorable cases, but ensure higher robustness to compression and misalignments of training/test.
Several papers, beginning with paper [
4] and followed by more recent papers [
10] and [
11], train the network to distinguish between homogeneous and heterogeneous patches which are known by the presence of both genuine and forged spaces. The case is to catch the features that describe transition regions, which are abnormal with respect to the background, to localize forgeries. This idea is followed also in [
12], where the hybrid CNN-LSTM (long short term memory) model is trained to generate a binary mask for forgery localization. These methods, although, require ground truth maps to train the network, which may not be available.
For architectonic constraints, most of the methods perform a patch-based analysis, functioning on reasonably small patches, with additional steps needed to calculate a global outcome at the image-level. In Ref. [
3], for example, CNN extracted features patch-wise and later aggregates them in a global feature vector used to feed an SVM (support vector machines) classifier. A major limitation is the need for large training and test datasets. Some methods, for example [
5,
11], use only one database and are split into groups of training and test; others [
5] require fine-tuning on the target data. Such models and its procedures prove that the supervised learning generalization ability is shortened and limited.
Bayer and Stamm studied image manipulation detection by adding a new convolution layer [
5]. Accordingly, CNN used a convolutional layer to identify the structural relationships among pixels anyhow of the image content. This model learned automatically how to detect image editing without relying on preprocessing or specific features. The model gave a high detection rate when only one of these specific attacks were implemented: median filtering, Gaussian blurring, additive white Gaussian noise, or resampling. If any other manipulations editing was applied to the forged image, this model failed and gave a bad detection rate.
Choi et al. studied CNN-based multi-operation detection to detect multiple attacks, not just only one attack [
12]. Their technique proposed three types of processing, that have occurred repeatedly during image manipulation and were identified when they are applied to images. The model was convenient enough to detect these three manipulations. It can only solve three types of editing (GB: Gaussian blurring, MF: median filtering, GC: gamma correction). If this model applied on any different manipulations, it would give a low detection rate.
Salloum et al. [
10] used a fully convolutional network (FCN) instead of CNN to locate the spliced regions. It classified each pixel in a spliced image as spliced or authentic. Two output branches of multi-task FCN are used to learn the labels and the spliced regions’ edges respectively, and the two branches intersection output is considered to be the localization result. The model was evaluated on images from the Carvalho, CASIA v1.0, Columbia, and the NIST Nimble Challenge 2016 datasets. This model can solve splicing problem only with maximum F1 score 0.6117 on the Columbia dataset, and maximum MCC score 0.5703 on NIST 2016 dataset, which are very low to be used in the real-life problems.
In Ref. [
3], the model applied max-pooling technique to the feature maps. The model consisted of 8 convolutional layers, three pooling layers and one fully-connected layer with a softmax classifier. They applied the framework on the public CASIA v1.0, CASIA v2.0 and DVMM datasets. The model used the SRM (spatial rich model) as a weight initialization instead of a random generation. SRM helps to improve the generalization ability and accelerate the convergence of the network. Major SRM problems can be listed as: it arises overfitting in some cases, increasing the processing time, and may other problems that lead the framework to unwanted results. This framework has another disadvantage is the rectified linear unit (ReLU) implementation as an activation function in the network. ReLU units can be fragile during training and can “die” which of course gives disappointing results.
Jaiswal, A. et al. [
13] proposed a framework based on a combination of pre-trained model resnet-50 and three discriminators (SVM, KNN, and Naïve Bayes). The model is applied and tested on CASIA V2.0 dataset [
14]. The result of this algorithm was not promising as the choice of resnet-50 was not good enough for the forgery problem. Resnet-50 construction is very complex and it needs a massive processing time for performing the process of both training and testing, and a big memory allocation which it is not accepted and valid in the actual forgery real problem-solving.
Qi, G. et al. [
15] proposed a framework structure consisting of 15 layers (5 convolutional layers, 2 pooling layers, four layers RPN(regional proposal network), 1 ROI pooling layer, 2 fully connecting layers and 1 output layer). This model used max-out as an activation function in the convolution layers. The detection process was made using three stages: 1—ROI extraction by applying the maximum variance algorithm combined with morphological operations. 2—The 15 layers model was used to extract the dominant features. 3—Classification of the results to get the exact ROI. The strength of this model is using RPN in the designed model. RPN can efficiently and rapidly inspect locations to determine if it required more handling in a certain area. The major problem this model faced was the first stage of ROI extraction applied. Firstly, an image was converted to grayscale and then applying the maximum variance and morphological operations. After this process, they reconverted the image again to color space. They lost a lot of details in the process of converting and reconverting from gray to color image. This process was considered to be one of the forgeries and editing applied to the image. This is the reason why the detection results were not satisfying enough. The recommendation to advance this model is to omit the first step of applying the maximum variance with morphology and applying batch normalization to their model. This will give a perfect result and can be applied in different applications.
As this paper is inspired by the AlexNet model architecture that was published and announced in 2012 [
16], we searched and emphasized the study done on the previously published work that is based on the AlexNet model. It is precious to mention that there are three research papers, the ultimate found and known, which focalize their research on AlexNet specifically.
J. Ouyang et al. [
17] proposed a framework that can only detect copy–move forgeries using AlexNet structure directly without any modifications to the network topology. They applied AlexNet on the ImageNet database. They applied AlexNet model on UCID, OXFORD flower, and CMFD datasets. The model obtained a good performance to the forgery image generated automatically by computer with a simple image copy–move operation, but is not robust to the copy–move forgery image of real scenario. The result was not satisfied enough and not robust to copy move in a real scenario. They also proved the concept that AlexNet can perform well in the forgery detection issue, and it was the first implementation of AlexNet in forgery detection. This work was the inspiration of other authors to start working on AlexNet as pre-trained network architecture.
A. Doegar et al. [
18] proposed AlexNet model-based deep with SVM classifier to be applied to the available benchmark dataset MICC-F220. The training was done by training SVM using AlexNet as deep features and for testing, the test images are applied to the trained SVM to determine whether or not the test image is forged. This model structure yields great results for the MICC-F220 dataset as it consists of geometrical transformations of a genuine image’s. The performance of the deep features extracted from the pre-trained AlexNet based model is quite satisfactory, the best accuracy of image forgery detection achieved is 93.94%. This proposed technique can only solve the problem of copy–move forgeries.
G. Muzaffer et al. [
19] proposed a framework using AlexNet as a feature extractor and hence using the similarity measure between feature vectors to detect and locate the forgeries. They tested their technique on the available GRIP that includes copy–move forgeries [
20]. This model was proven to give a more successful result on the GRIP dataset only. It was recommended to apply it on different datasets under different conditions.
Worthy massive research has been conducted on existing deep models for detecting and localizing digital image forgeries. The research investigates whether such techniques are sufficiently robust and whether they can properly model the manipulations that have occurred in images due to different types of forgeries that can faithfully classify an image as an authentic or fake image. This brief summary of the previously-published deep models clears that there is a high rising interest for novel solution models, to face the threats posed by increasingly sophisticated fake multimedia tools.
Author Contributions
Conceptualization, S.S.; methodology, S.S., and E.E.; software, S.S.; validation, S.S., E.E., K.E.-S., and H.O.; investigation, S.S., E.E., K.E.-S., and H.O.; writing—original draft preparation, S.S.; supervision, E.E., K.E.-S., and H.O. All authors have read and agree to the published version of the manuscript.
Funding
This research received no external funding.
Conflicts of Interest
The authors declare that there is no actual or potential conflict of interest regarding the publication of this article.
References
- The 2017 Nimble Challenge Evaluation Datasets. Available online: https://www.nist.gov/itl/iad/mig/nimble-challenge-2017-evaluation (accessed on 28 September 2019).
- Hadji, I.; Wildes, R.P. What do we understand about convolutional networks? arXiv 2018, arXiv:1803.08834v1. [Google Scholar]
- Rao, Y.; Ni, J. A deep learning approach to detection of splicing and copy-move forgeries in images. In Proceedings of the 2016 IEEE International Workshop on Information Forensics and Security (WIFS), Abu Dhabi, UAE, 4–7 December 2016; pp. 1–6. [Google Scholar] [CrossRef]
- Liu, Y.; Guan, Q.; Zhao, X.; Cao, Y. Image Forgery Localization based on Multi-Scale Convolutional Neural Networks. In Proceedings of the 6th ACM Workshop on Information Hiding and Multimedia Security—IH&MMSec ’18, Innsbruck, Austria, 20–22 June 2018; pp. 85–90. [Google Scholar]
- Bayar, B.; Stamm, M.C. A Deep Learning Approach to Universal Image Manipulation Detection Using a New Convolutional Layer. In Proceedings of the 4th ACM Workshop on Information Hiding and Multimedia Security, Vigo Galicia, Spain, 20–22 June 2016; pp. 5–10. [Google Scholar]
- Cozzolino, D.; Poggi, G.; Verdoliva, L. Recasting Residual-based Local Descriptors as Convolutional Neural Networks. In Proceedings of the 5th ACM Workshop on Challenged Networks-CHANTS ’10, Philadelphia, PA, USA, 20–21 June 2017; pp. 159–164. [Google Scholar]
- Zhou, P.; Han, X.; Morariu, V.I.; Davis, L.S. Learning Rich Features for Image Manipulation Detection. In Proceedings of the 2018 IEEE/CVF Conference on Computer Vision and Pattern Recognition, Salt Lake City, UT, USA, 18–23 June 2018; pp. 1053–1061. [Google Scholar]
- Marra, F.; Gragnaniello, D.; Cozzolino, D.; Verdoliva, L. Detection of GAN-Generated Fake Images over Social Networks. In Proceedings of the 2018 IEEE Conference on Multimedia Information Processing and Retrieval (MIPR), Miami, FL, USA, 10–12 April 2018; pp. 384–389. [Google Scholar]
- Rossler, A.; Cozzolino, D.; Verdoliva, L.; Riess, C.; Thies, J.; Niessner, M. FaceForensics++: Learning to Detect Manipulated Facial Images. In Proceedings of the 2019 IEEE/CVF International Conference on Computer Vision (ICCV), Seoul, Korea, 27 October–2 November 2019. [Google Scholar]
- Salloum, R.; Ren, Y.; Kuo, C.-C.J. Image Splicing Localization using a Multi-task Fully Convolutional Network (MFCN). J. Vis. Commun. Image Represent. 2018, 51, 201–209. [Google Scholar] [CrossRef]
- Zhang, Z.; Zhang, Y.; Zhou, Z.; Luo, J. Boundary-based Image Forgery Detection by Fast Shallow CNN. In Proceedings of the 2018 24th International Conference on Pattern Recognition (ICPR), Beijing, China, 20–24 August 2018; pp. 2658–2663. [Google Scholar]
- Choi, H.-Y.; Jang, H.-U.; Kim, D.; Son, J.; Mun, S.-M.; Choi, S.; Lee, H.-K. Detecting composite image manipulation based on deep neural networks. In Proceedings of the 2017 International Conference on Systems, Signals and Image Processing (IWSSIP), Poznan, Poland, 22–24 May 2017; pp. 1–5. [Google Scholar]
- Jaiswal, A.K.; Srivastava, R. Image Splicing Detection using Deep Residual Network. SSRN Electron. J. 2019, 8, 102. [Google Scholar] [CrossRef]
- Dong, J.; Wang, W. CASIA v1.0 and CASIA v2.0 Image Splicing Dataset. Available online: https://www.kaggle.com/sophatvathana/casia-dataset (accessed on 28 September 2019).
- Qi, G.; Wang, H.; Haner, M.; Weng, C.; Chen, S.; Zhu, Z. Convolutional Neural Network Based Detection and Judgment of Environmental Obstacle in Vehicle Operation. CAAI Trans. Intell. Technol. 2019, 4, 80–91. [Google Scholar] [CrossRef]
- Krizhevsky, A.; Sutskever, I.; Hinton, G.E. Pdf ImageNet classification with deep convolutional neural networks. Commun. ACM 2017, 60, 84–90. [Google Scholar] [CrossRef]
- Ouyang, J.; Liu, Y.; Liao, M. Copy-move forgery detection based on deep learning. In Proceedings of the 2017 10th International Congress on Image and Signal Processing, BioMedical Engineering and Informatics (CISP-BMEI), Shanghai, China, 14–16 October 2017; pp. 1–5. [Google Scholar] [CrossRef]
- Doegara, A.; Duttaa, M.; Kumar, G. CNN based Image Forgery Detection using pre-trained AlexNet Model. Proc. Int. Conf. Comput. Intell. IoT (ICCIIoT) 2019, 2. [Google Scholar]
- Muzaffer, G.; Ulutas, G. A new deep learning-based method to detection of copy-move forgery in digital images. In Proceedings of the 2019 Scientific Meeting on Electrical-Electronics & Biomedical Engineering and Computer Science (EBBT), Istanbul, Turkey, 24–26 April 2019. [Google Scholar] [CrossRef]
- Cozzolino, D.; Poggi, G.; Verdoliva, L. Copy-move forgery detection based on PatchMatch. In Proceedings of the 2014 IEEE International Conference on Image Processing (ICIP), Paris, France, 27–30 October 2014; pp. 5312–5316. [Google Scholar]
- A Walk Through AlexNet. Available online: https://medium.com/@smallfishbigsea/a-walk-through-of-alexnet-6cbd137a5637 (accessed on 5 April 2020).
- Architecture of AlexNet. Available online: https://iq.opengenus.org/architecture-and-use-of-alexnet/ (accessed on 19 May 2020).
- Available online: https://www.saagie.com/blog/object-detection-part1/ (accessed on 2 October 2019).
- Understanding Dropout with the Simplified Math Behind It. Available online: https://towardsdatascience.com/simplified-math-behind-dropout-in-deep-learning-6d50f3f47275 (accessed on 5 May 2020).
- Goodfellow, I.J.; Warde-Farley, D.; Mirza, M.; Courville, A.; Bengio, Y. Maxout Networks. arXiv 2013, arXiv:1302.4389v4 stat.ML. [Google Scholar]
- A Gentle Introduction to the Rectified Linear Unit (ReLU). Available online: https://machinelearningmastery.com/rectified-linear-activation-function-for-deep-learning-neural-networks/ (accessed on 4 May 2020).
- Romero, F.P.; Tang, A.; Kadoury, S. Multi-Level Batch Normalization in Deep Networks for Invasive Ductal Carcinoma Cell Discrimination in Histopathology Images. In Proceedings of the 2019 IEEE 16th International Symposium on Biomedical Imaging (ISBI 2019), Venice, Italy, 8–11 April 2019. [Google Scholar] [CrossRef]
- What Is Local Response Normalization in Convolutional Neural Networks. Available online: https://prateekvjoshi.com/2016/04/05/what-is-local-response-normalization-in-convolutional-neural-networks/ (accessed on 4 May 2020).
- Ng, T.T.; Chang, S.F. A Dataset of Authentic and Spliced Image Blocks Dept. Elect. Eng., Columbia Univ., New York, NY, USA, Tech. Rep. 203. Available online: http://www.ee.columbia.edu/ln/dvmm/newDownloads.htm (accessed on 27 September 2019).
- Sebastian, R. Model Evaluation, Model Selection, and Algorithm Selection in Machine Learning. arXiv 2018, arXiv:1811.12808v2 cs.LG. [Google Scholar]
- Understanding Confusion Matrix. Available online: https://towardsdatascience.com/understanding-confusion-matrix-a9ad42dcfd62 (accessed on 5 October 2019).
- Ioffe, S.; Szegedy, C. Batch normalization: Accelerating deep network training by reducing internal covariate shift. arXiv 2015, arXiv:1502.03167. [Google Scholar]
- Qi, X.; Wang, T.; Liu, J. Comparison of Support Vector Machine and Softmax Classifiers in Computer. In Proceedings of the Second International Conference on Mechanical, Control and Computer Engineering (ICMCCE), Harbin, China, 8–10 December 2017; pp. 151–155. [Google Scholar]
- Zeng, N.; Wang, Z.; Zhang, H.; Alsaadi, F.E. A Novel Switching Delayed PSO Algorithm for Estimating Unknown Parameters of Lateral Flow Immunoassay. Cogn. Comput. 2016, 8, 143–152. [Google Scholar] [CrossRef]
Figure 1.
A fake image is created by splicing together content from two different images [
1].
Figure 2.
Overall architecture of the proposed AlexNet layers: convolution, max-pooling, max-out, BN and, FC.
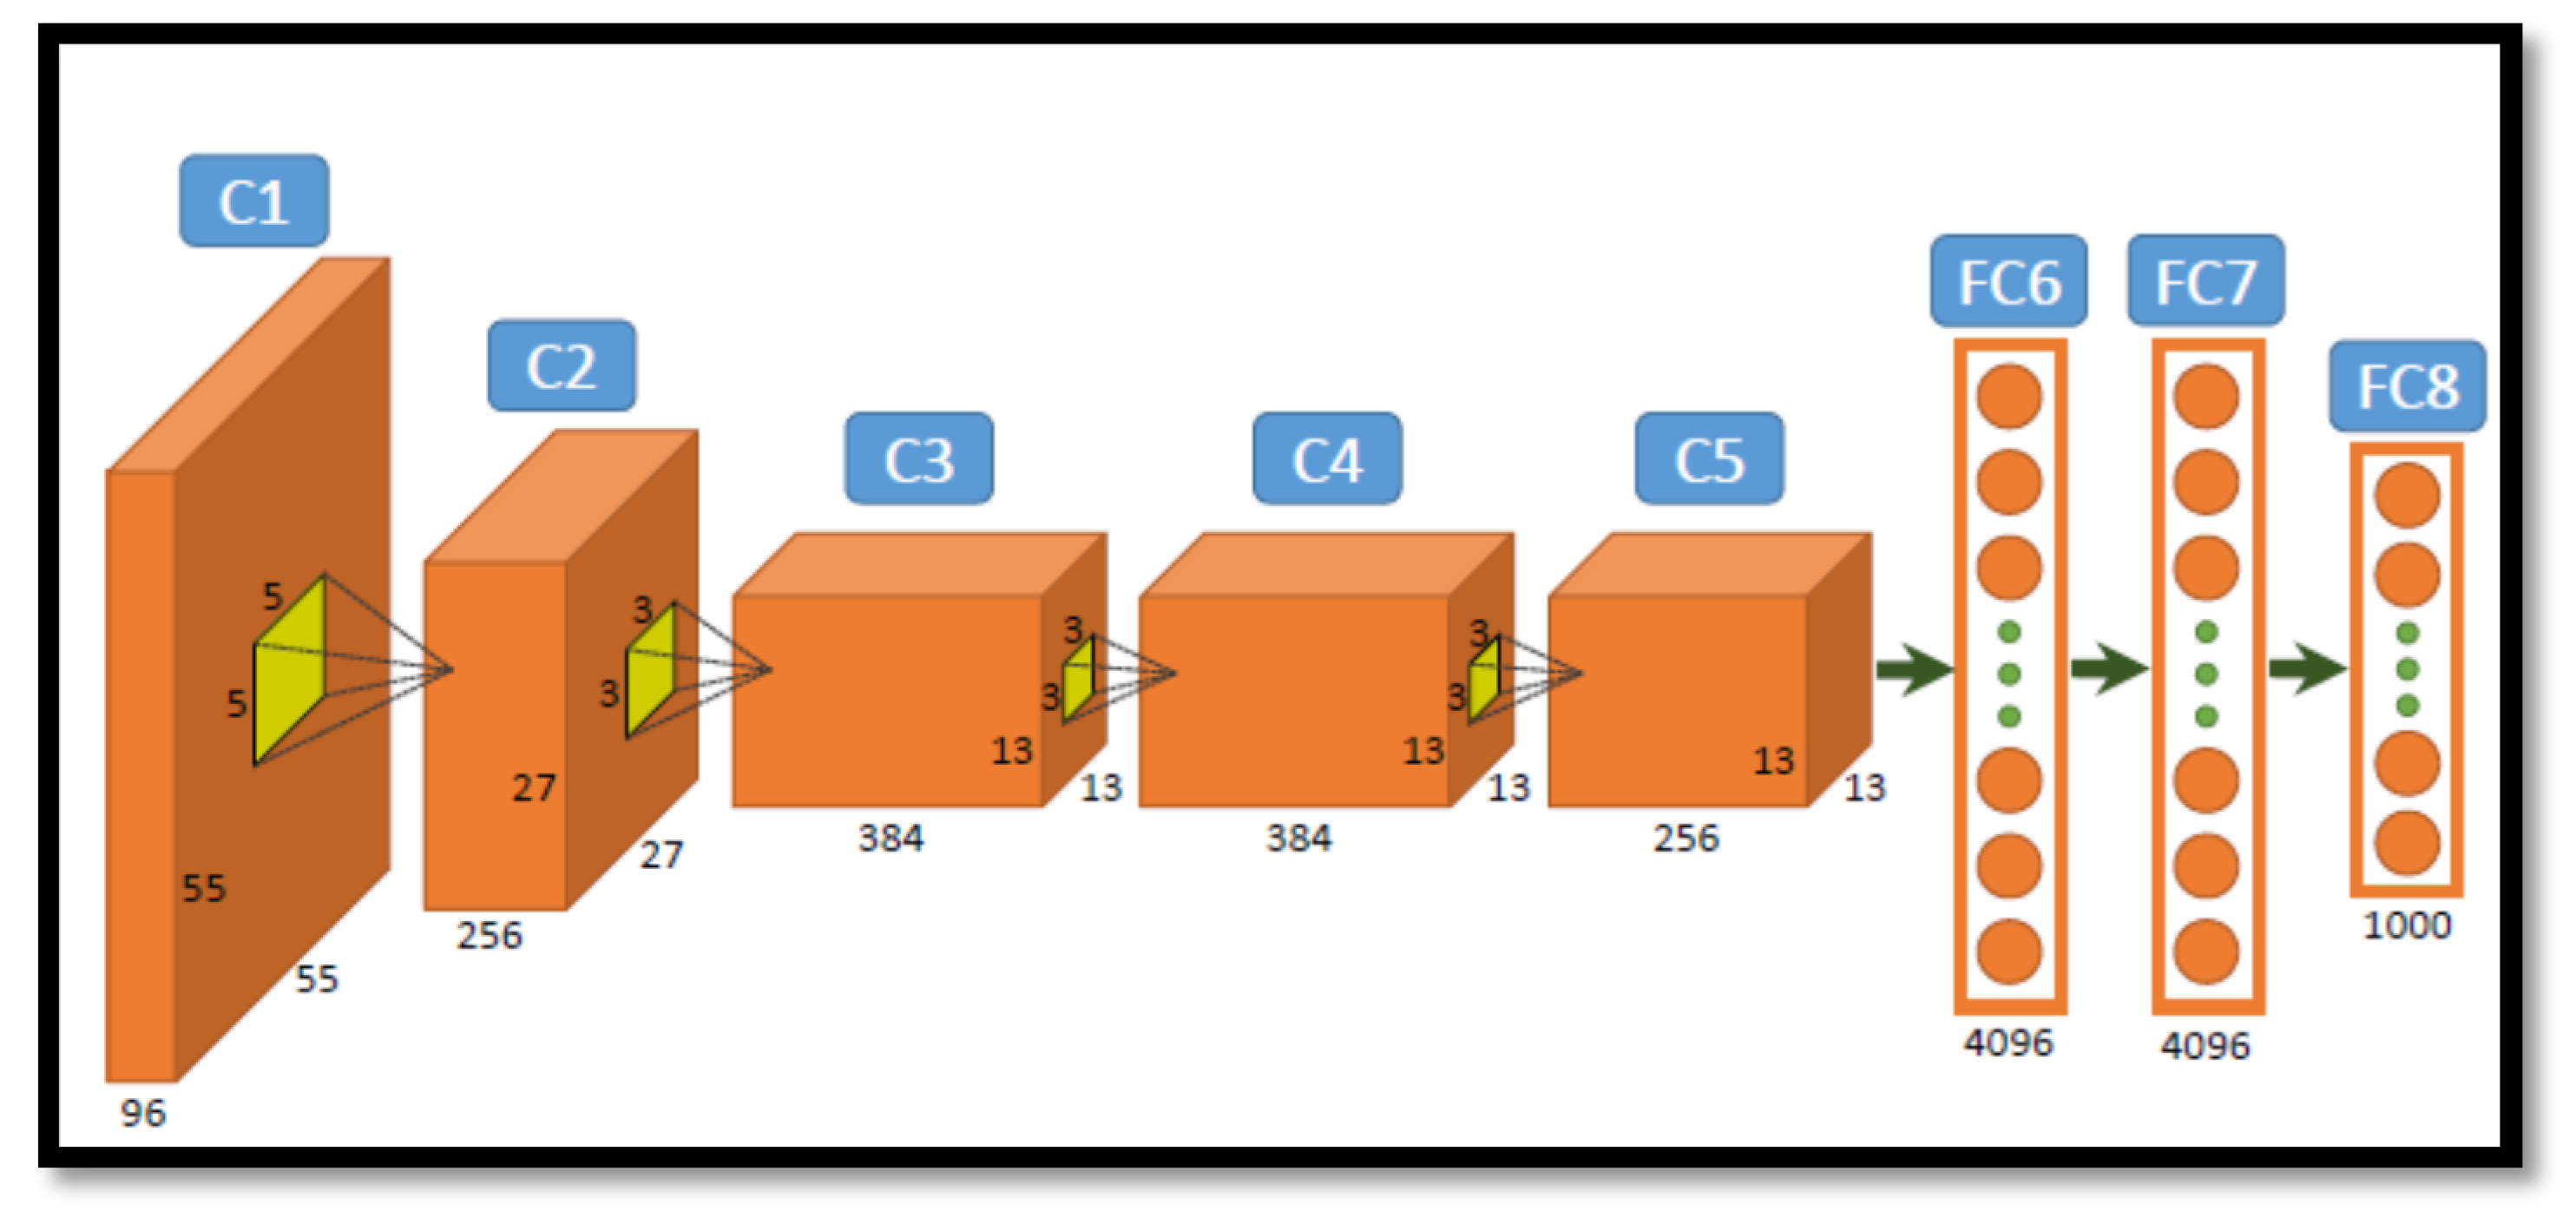
Figure 3.
The overall architecture of AlexNet [
23].
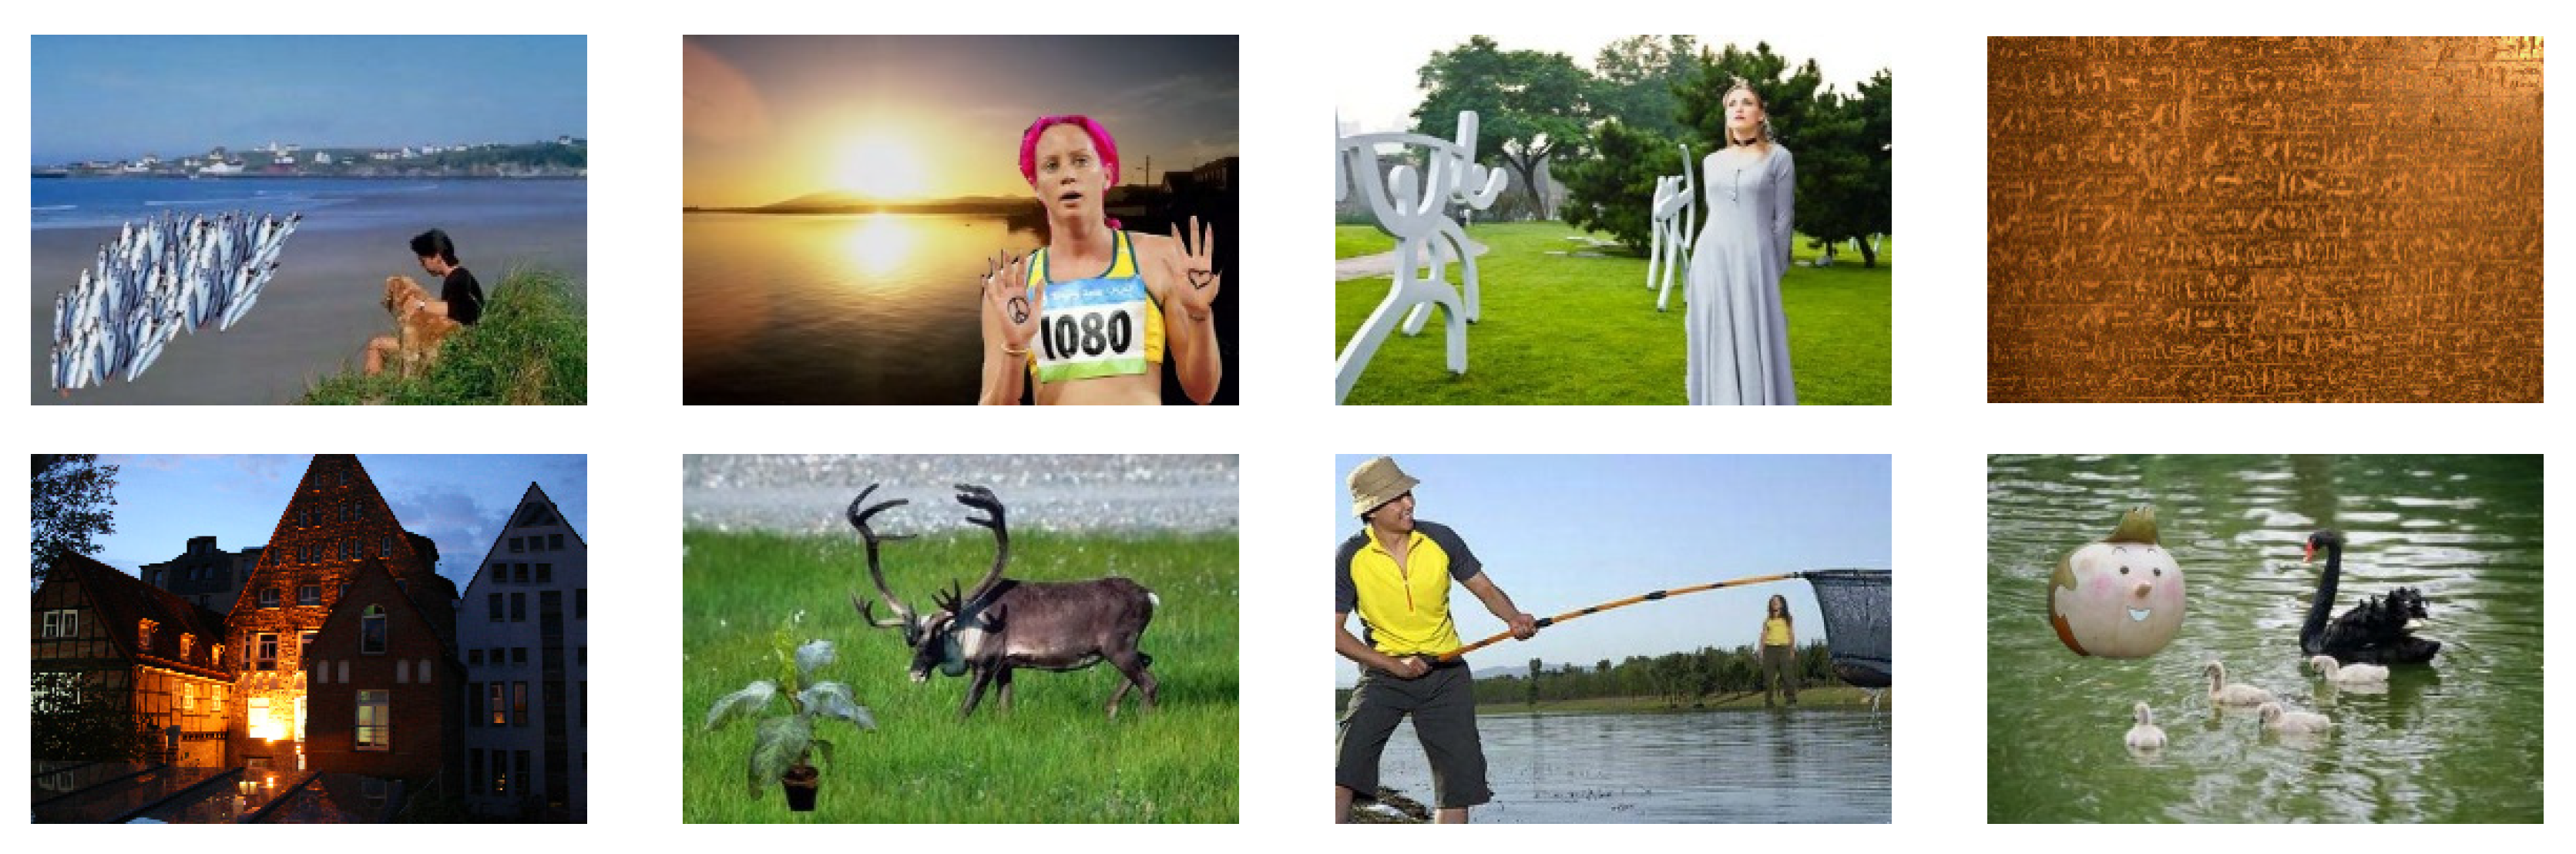
Figure 4.
Examples of different kinds of image forgeries.
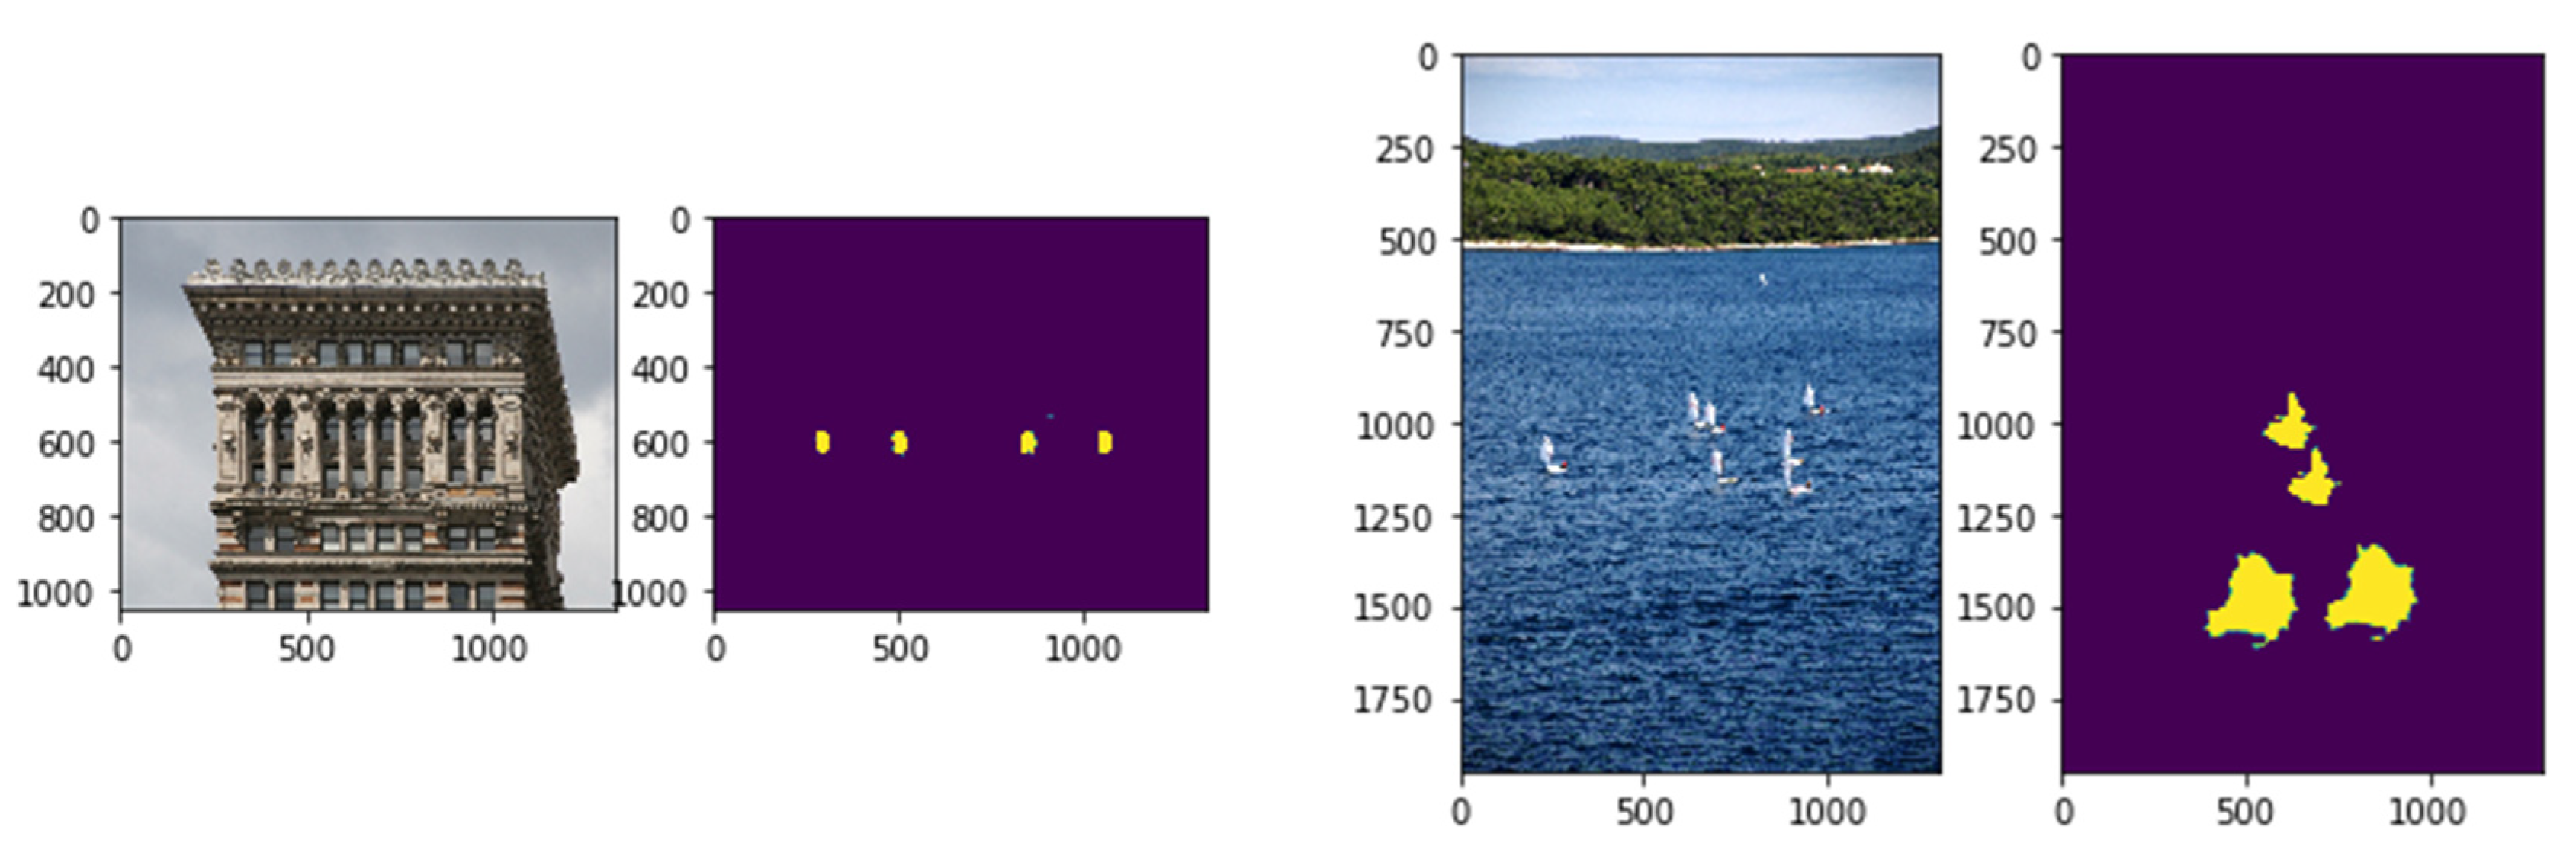
Figure 5.
Some examples of multiple copy–move forgeries detection. The first and third columns represent the forged images. The second and fourth columns represent the detection results of the proposed model.
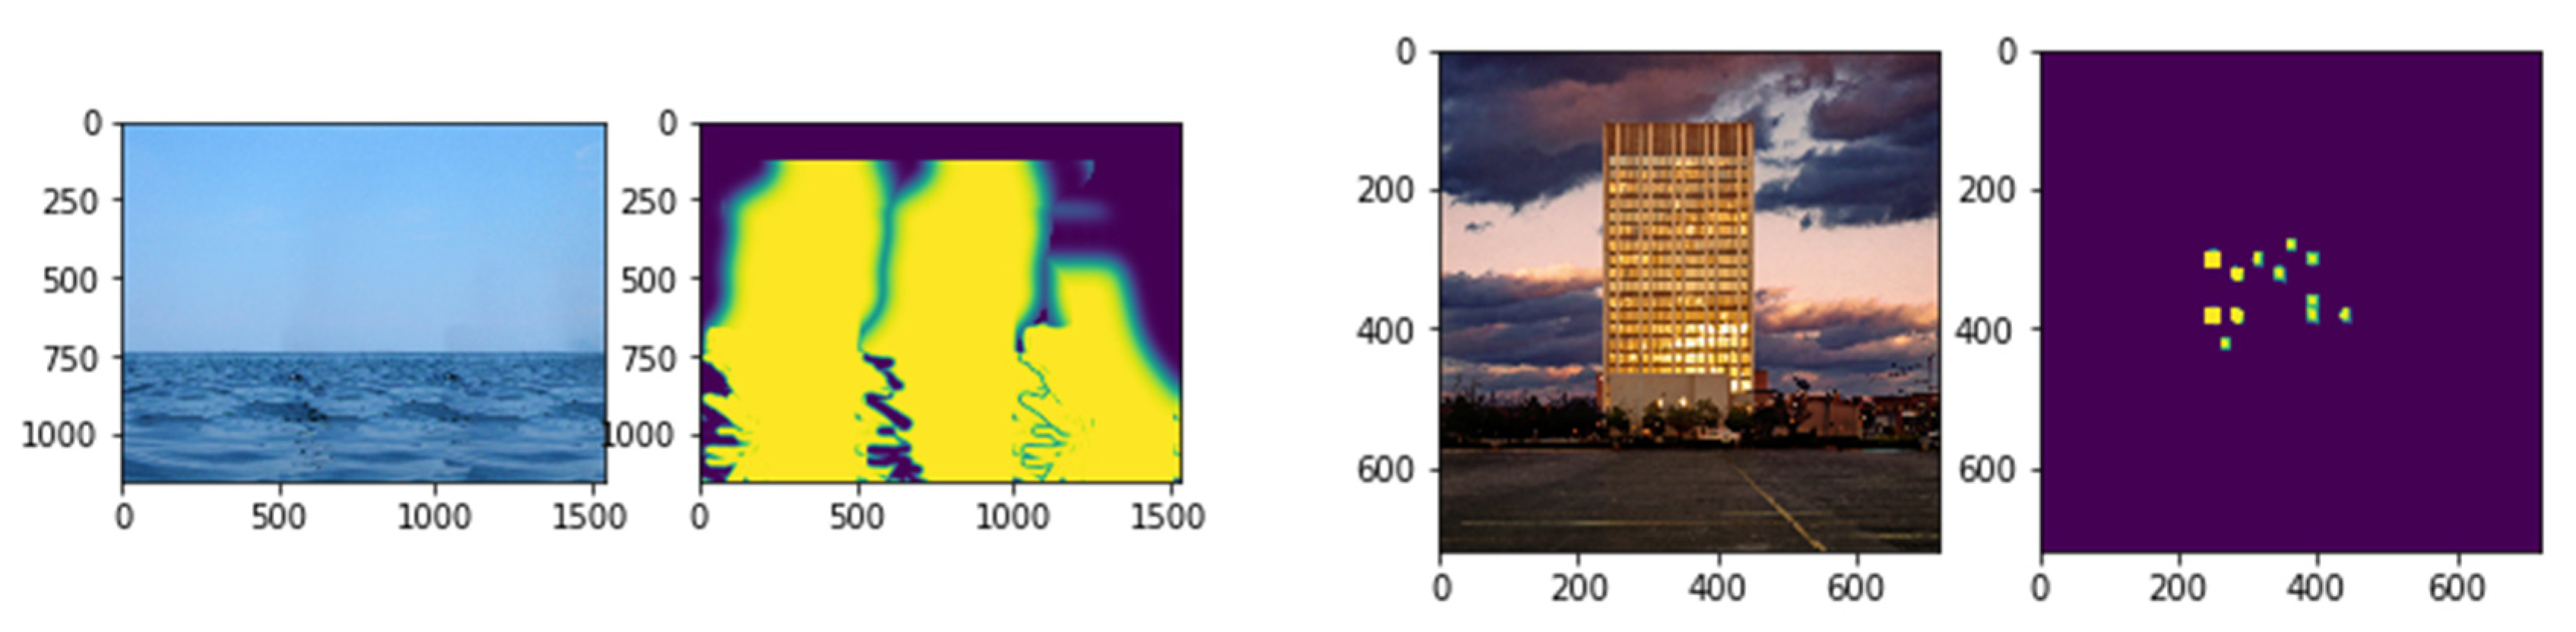
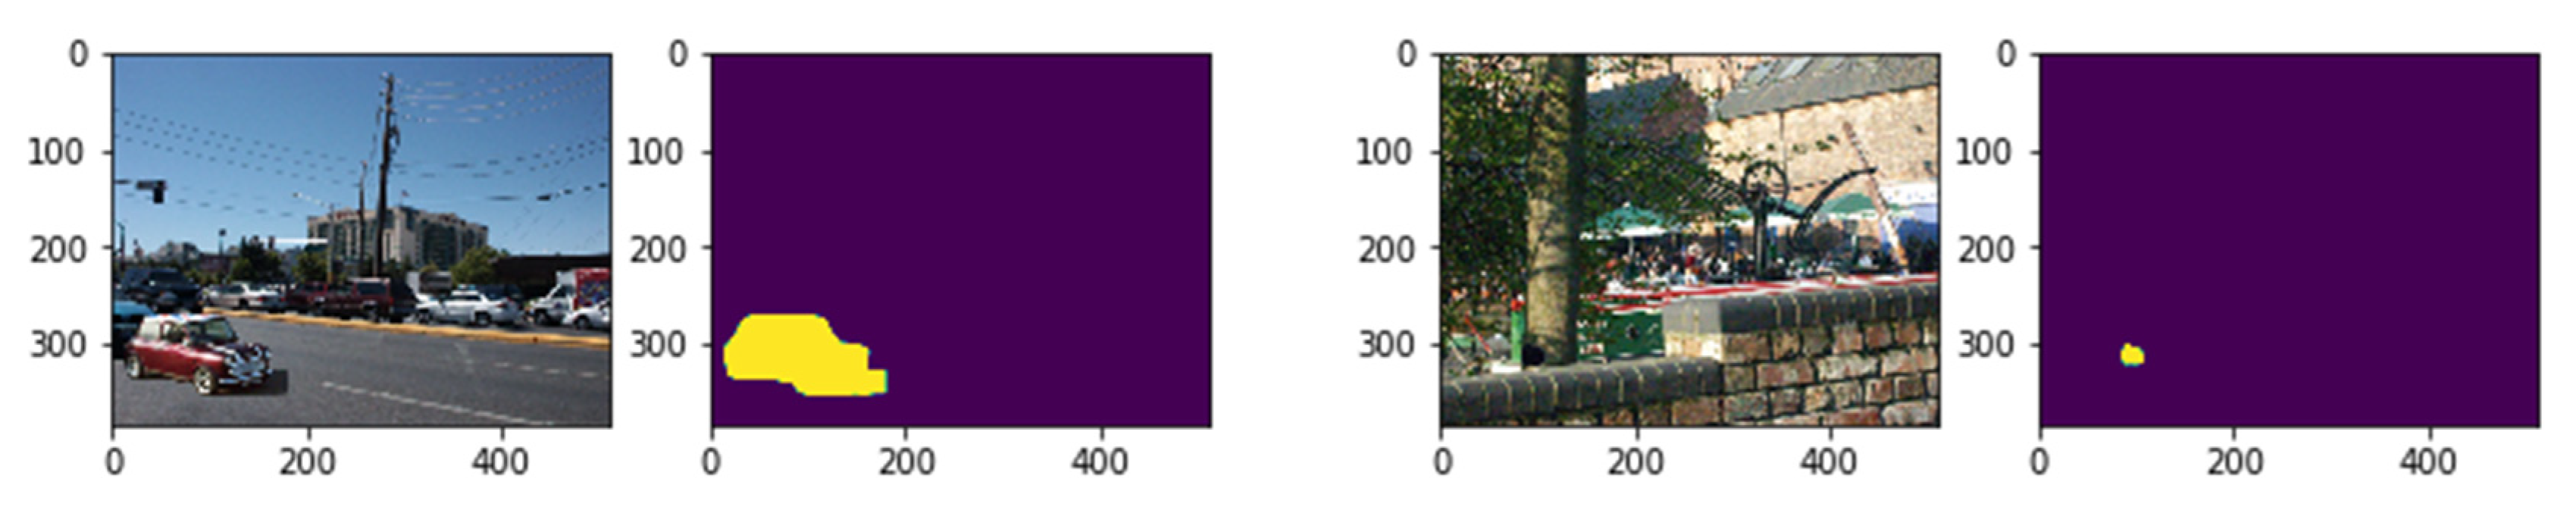
Figure 6.
Some examples of forgery-dDetection. The first and third columns represent the forged images. The second and fourth columns represent the detection results of the proposed model.
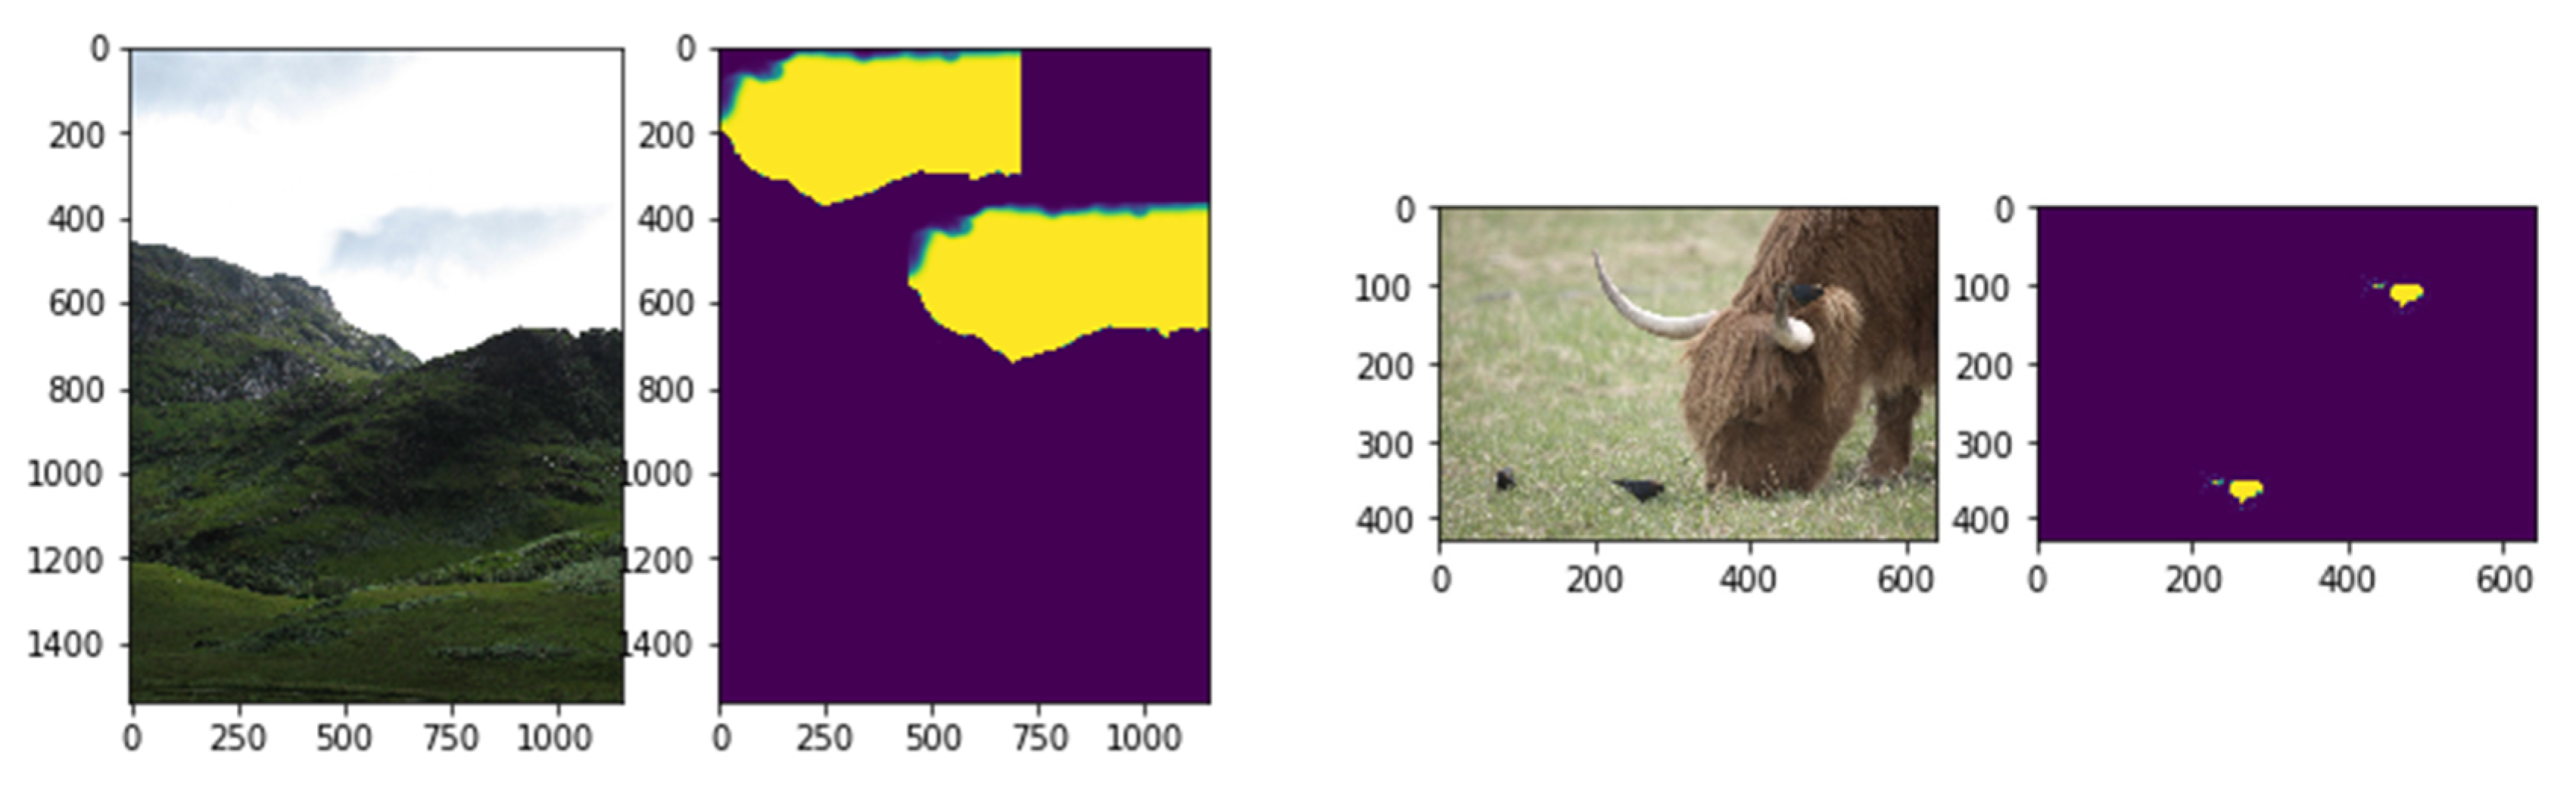
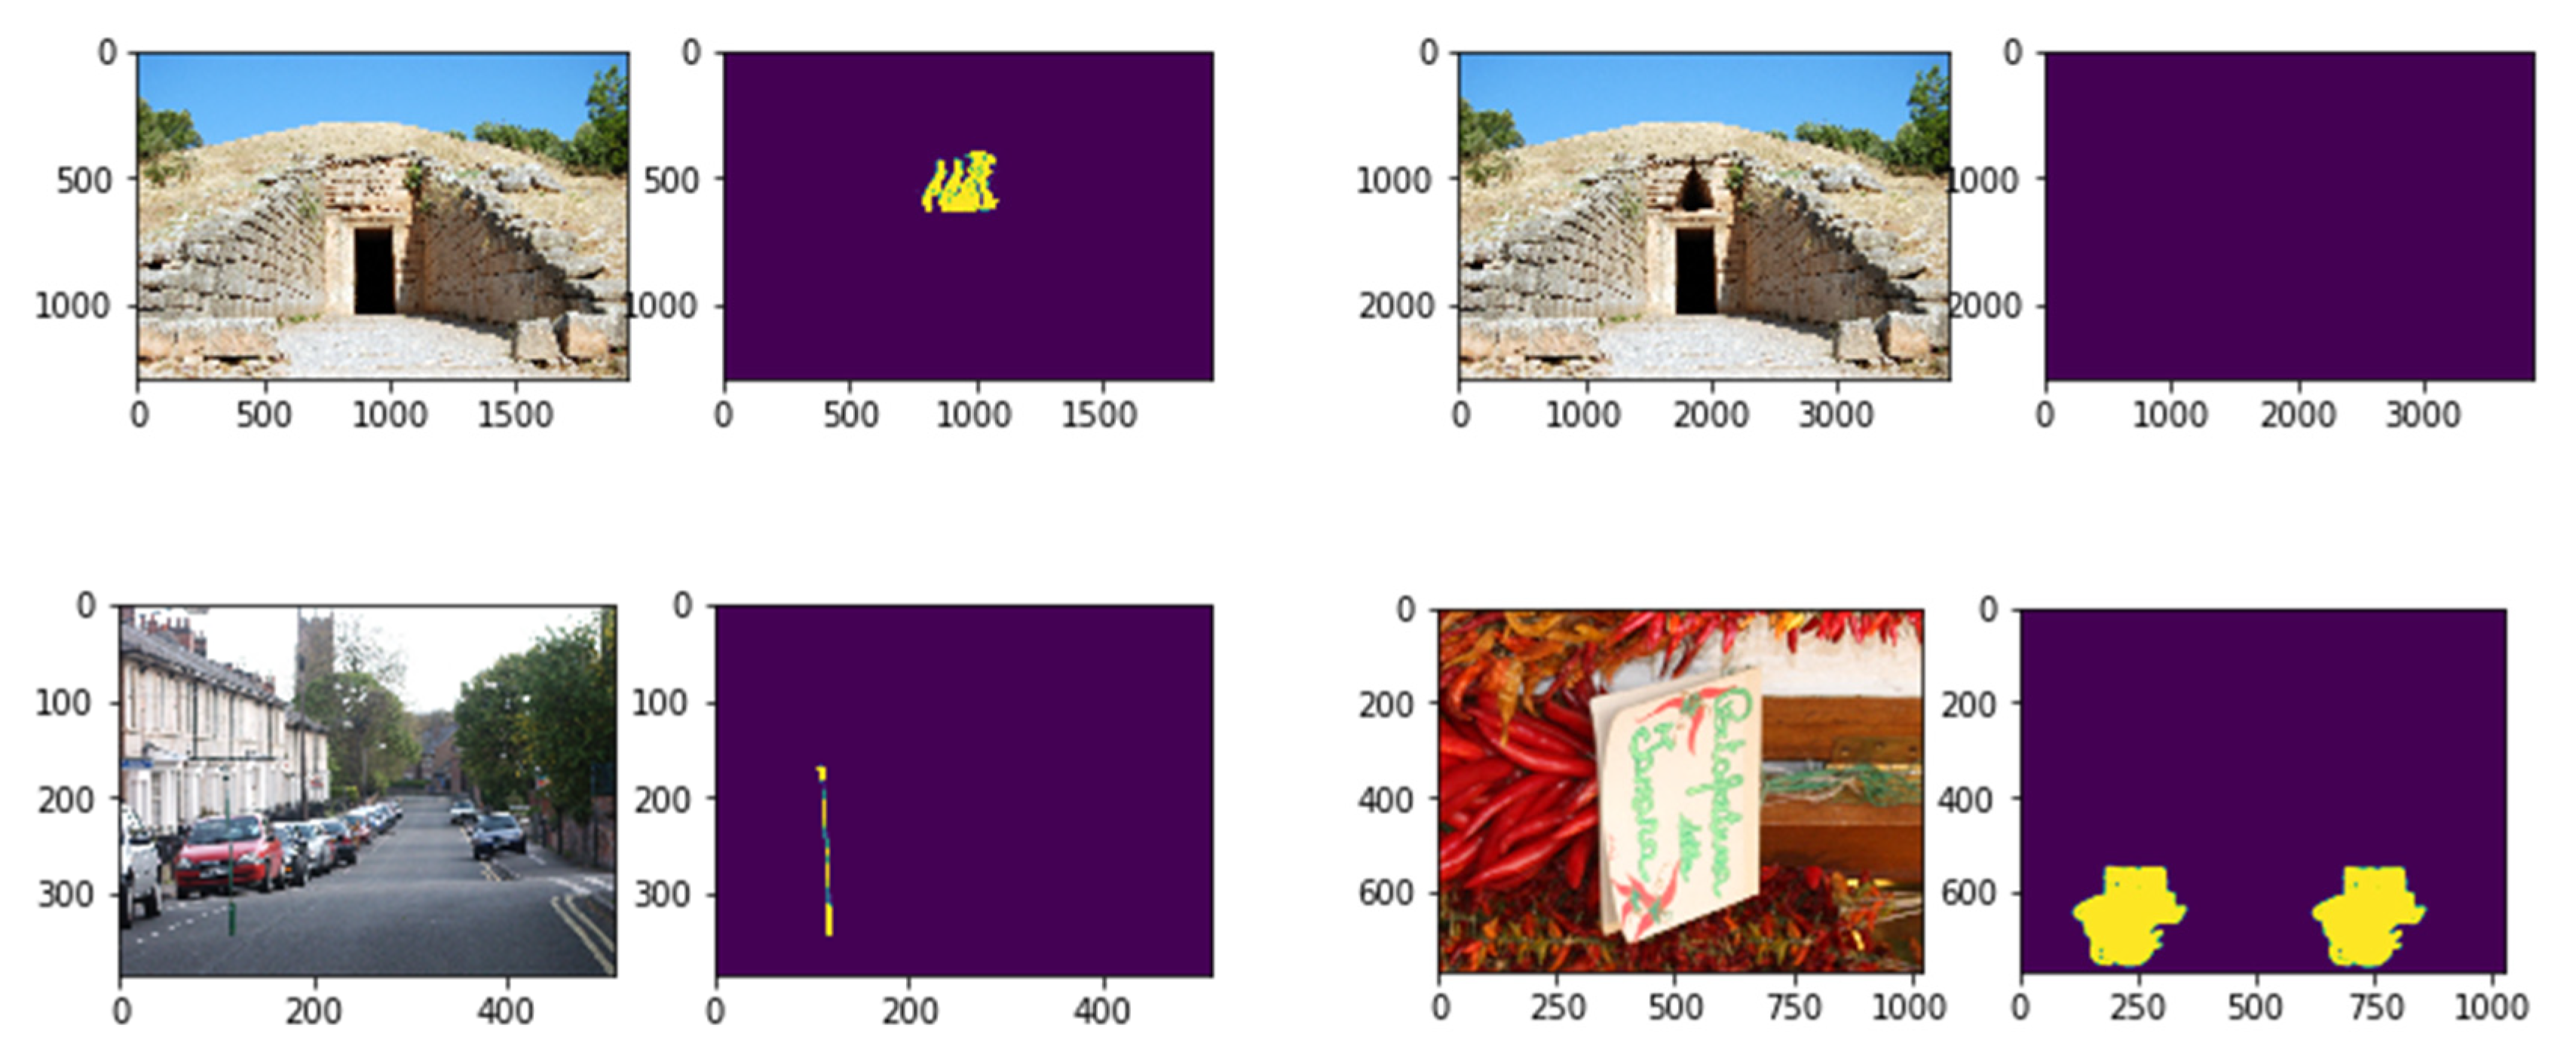
Figure 7.
Some examples of forgery-detection. The first and third columns represent the forged images. The second and fourth columns represent the detection results of the proposed model.
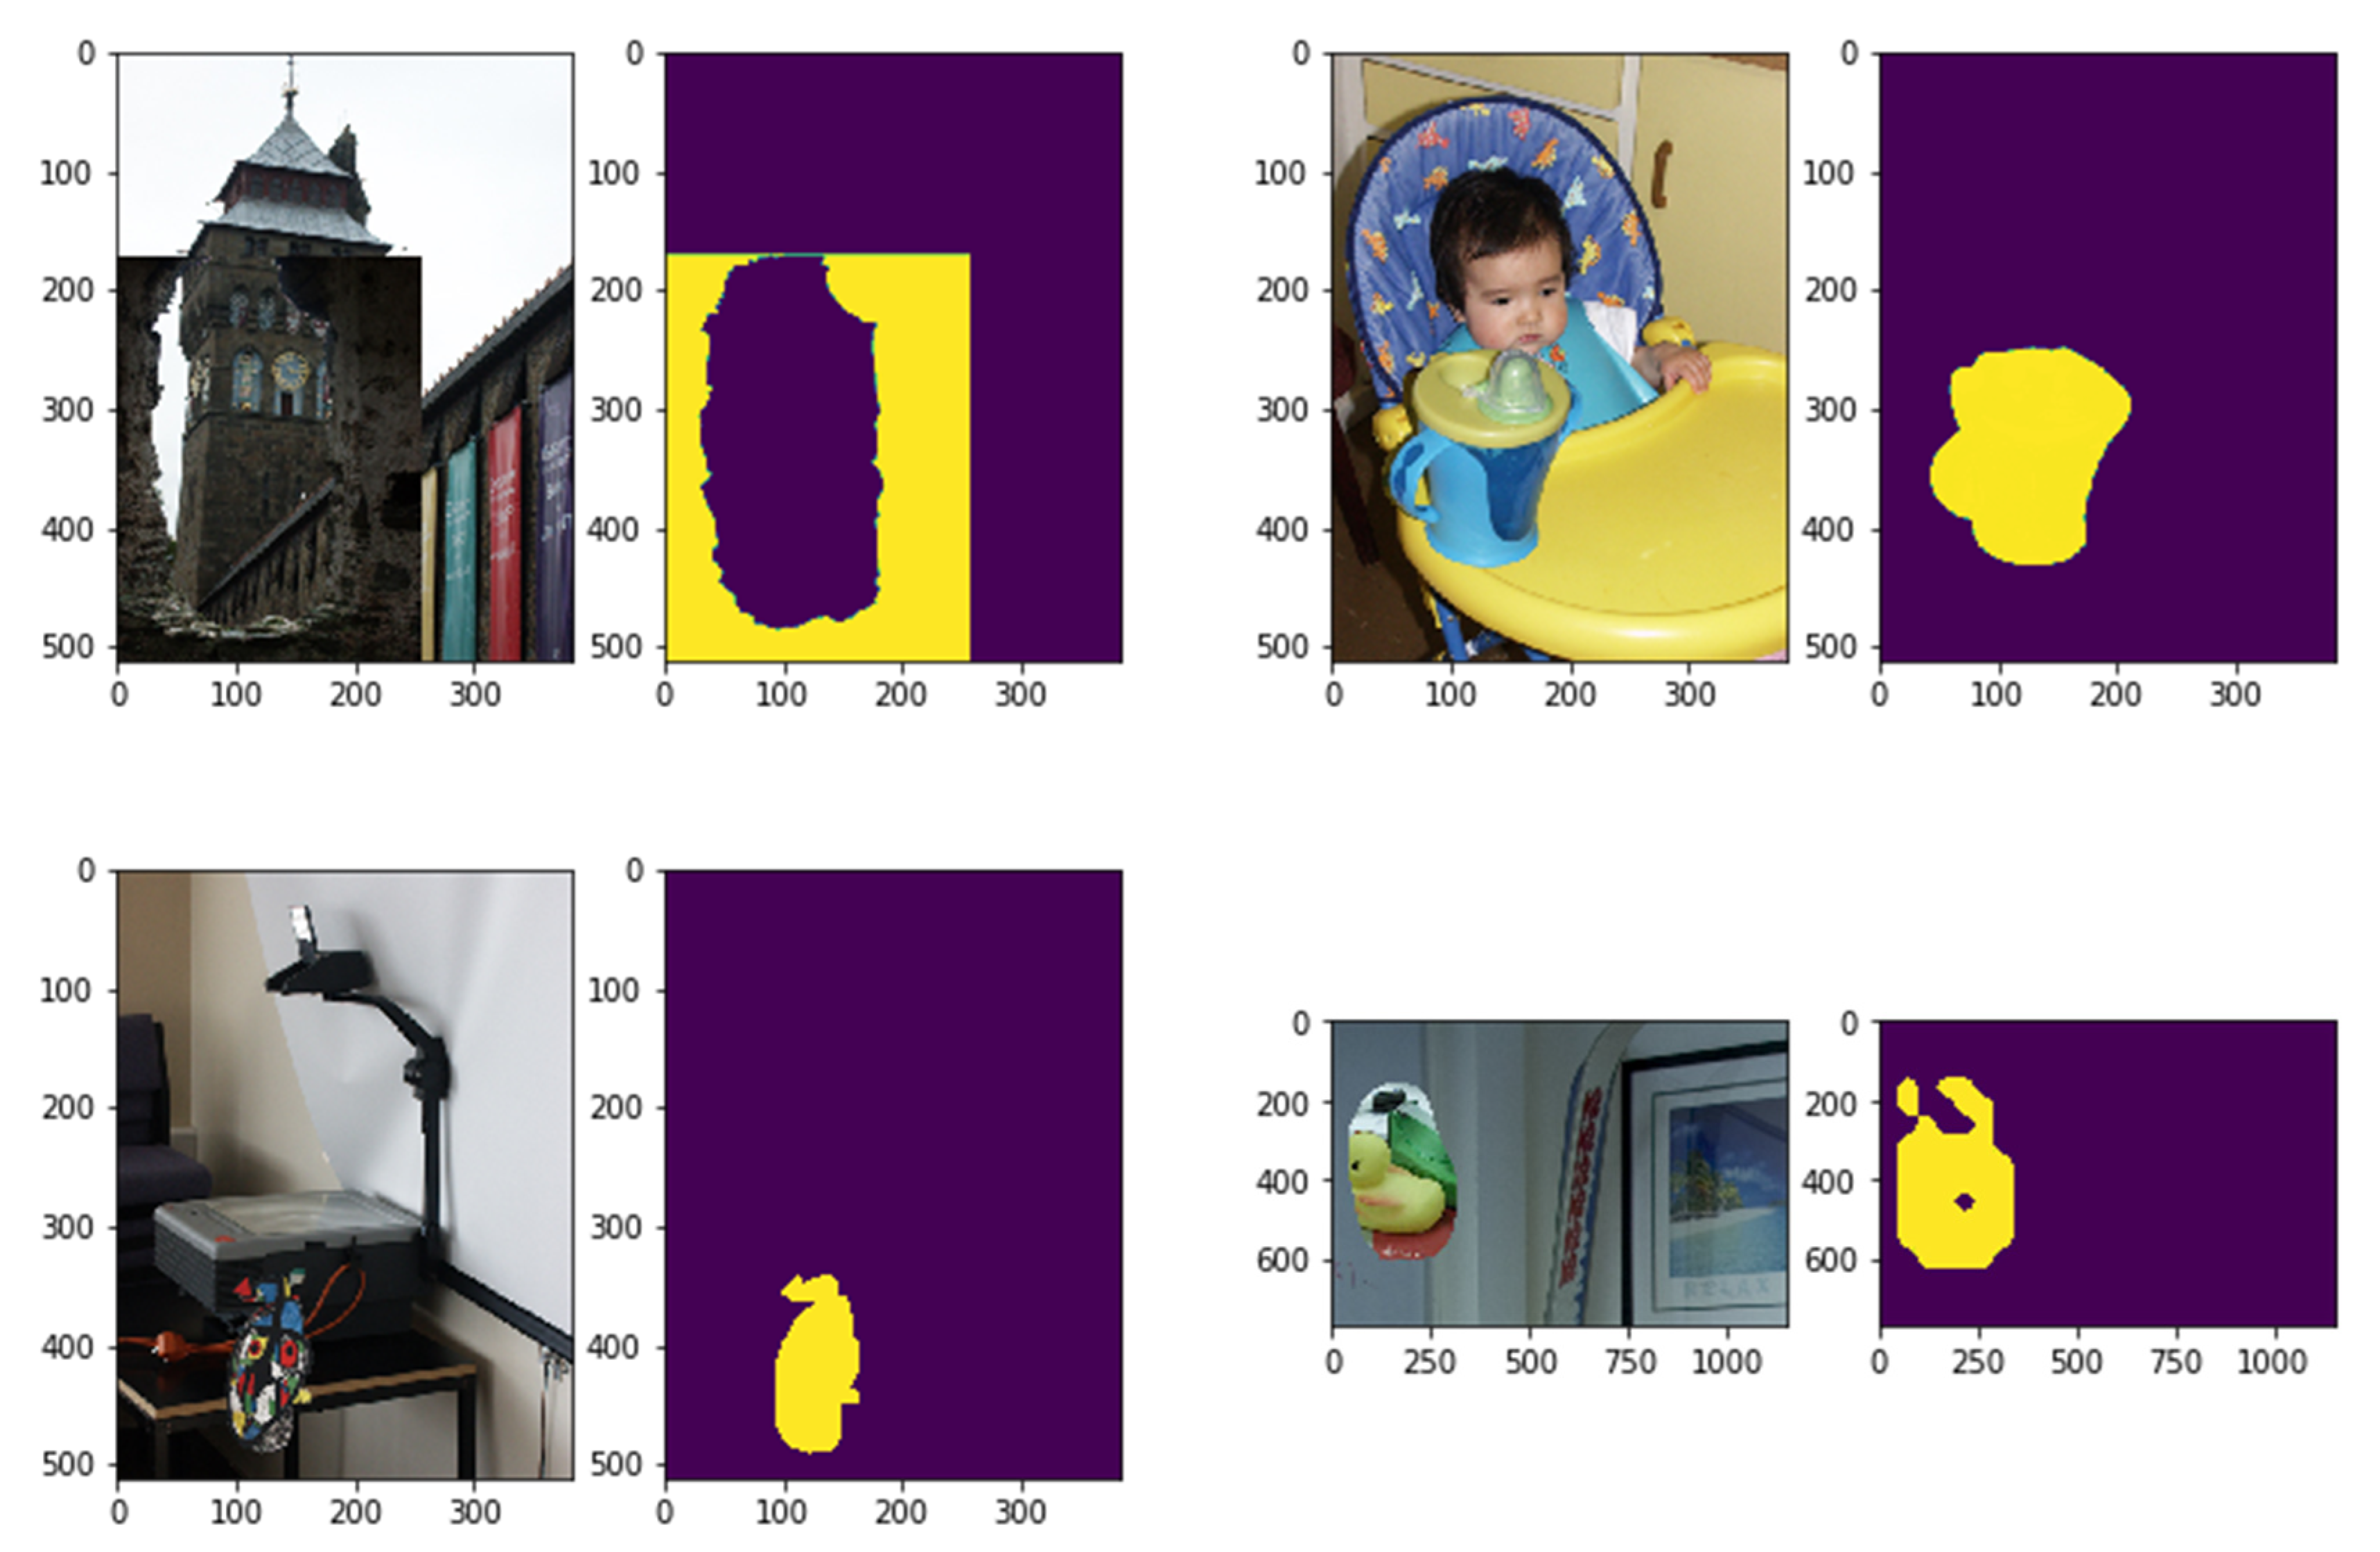
Figure 8.
Different samples of forgery-detection. The first and third columns represent the forged images. The second and fourth columns represent the detection results of the proposed model.
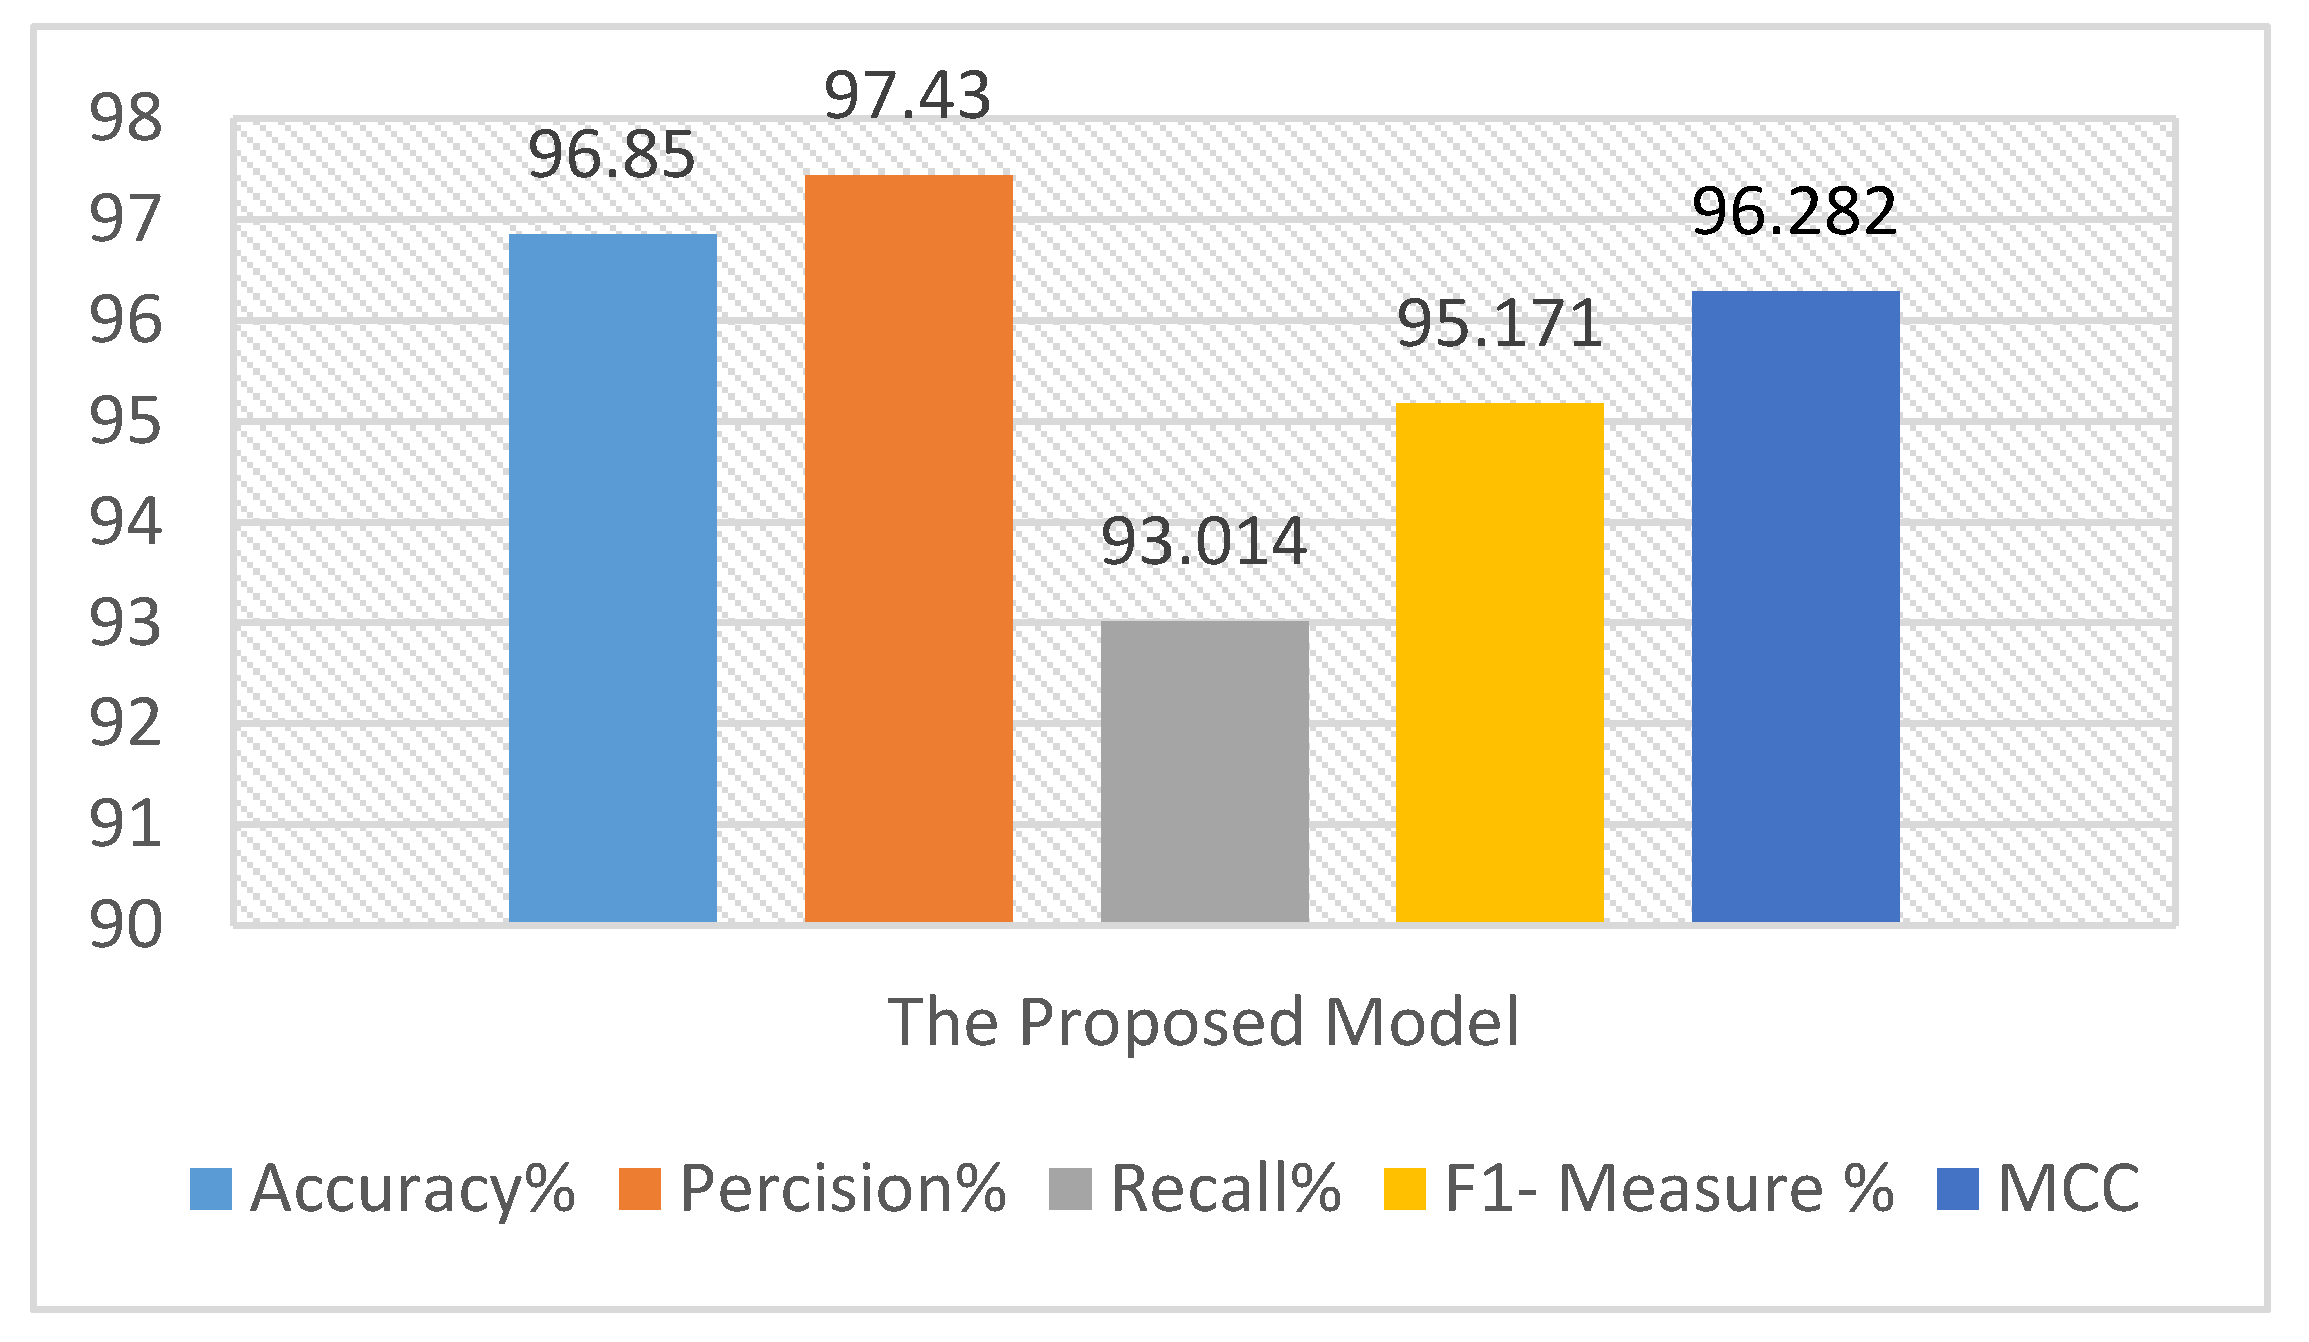
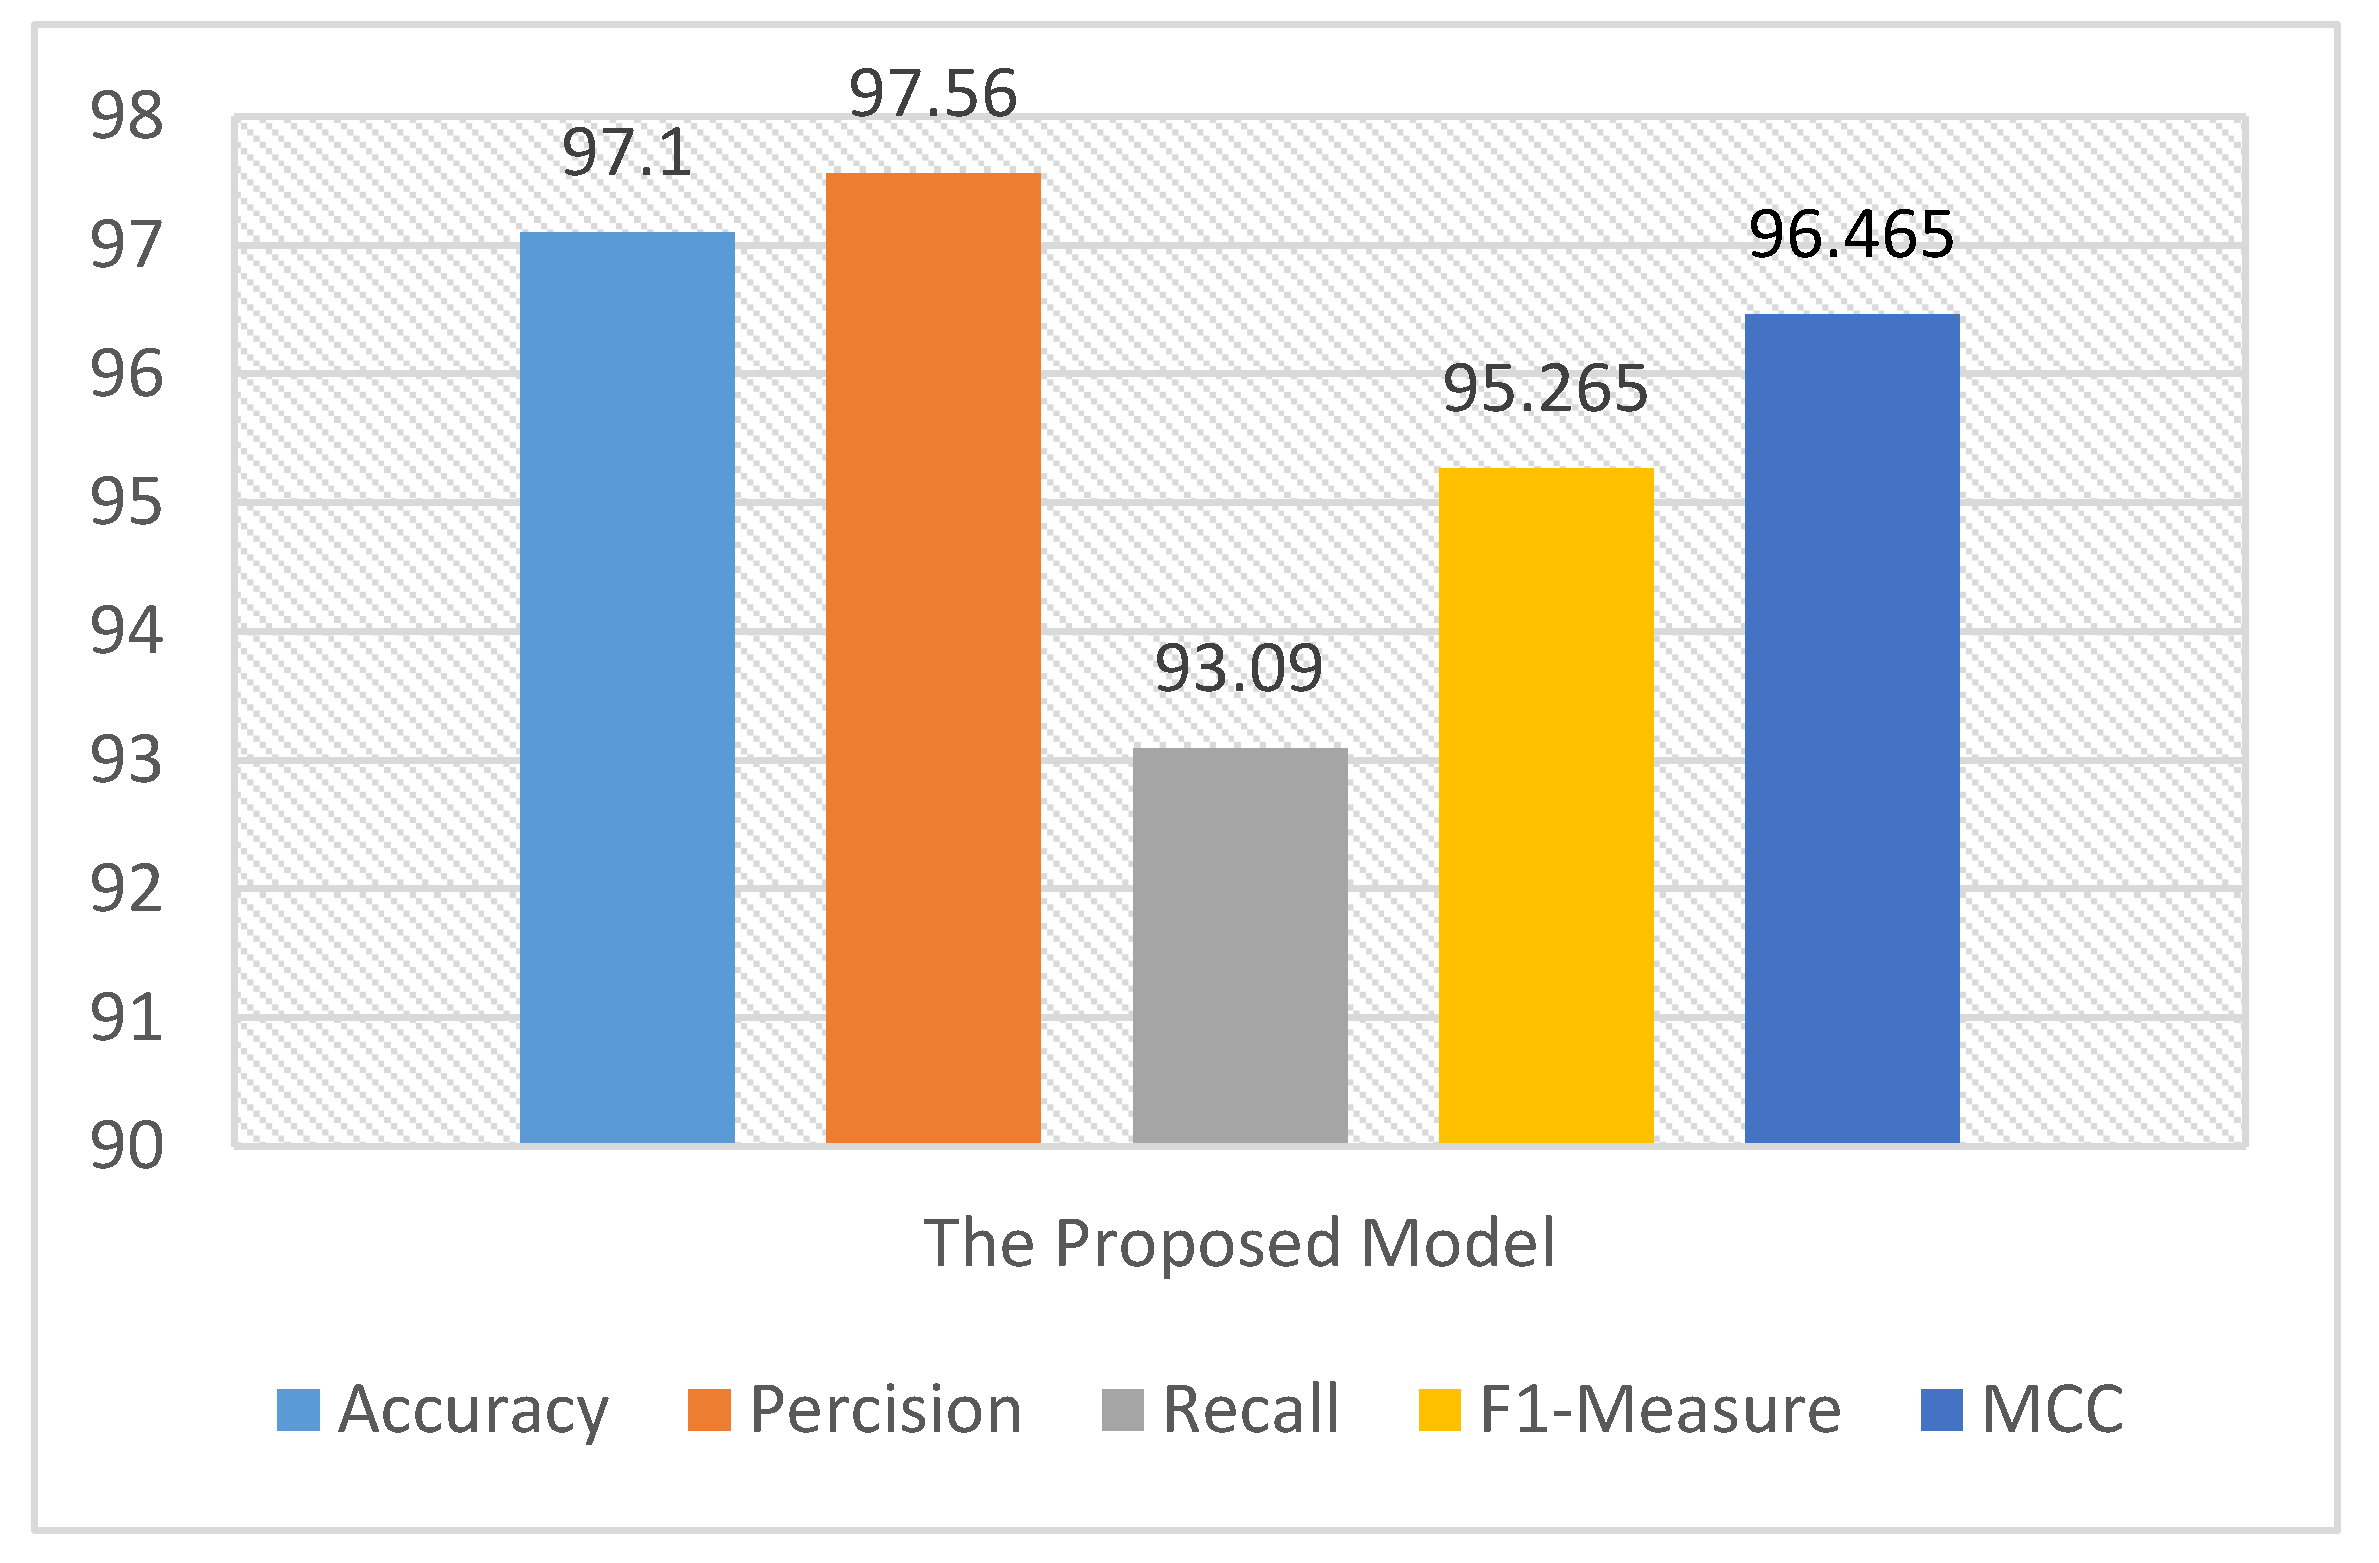
Figure 9.
The 10-fold cross-validation average result on CASIA V1.0 using the proposed model.
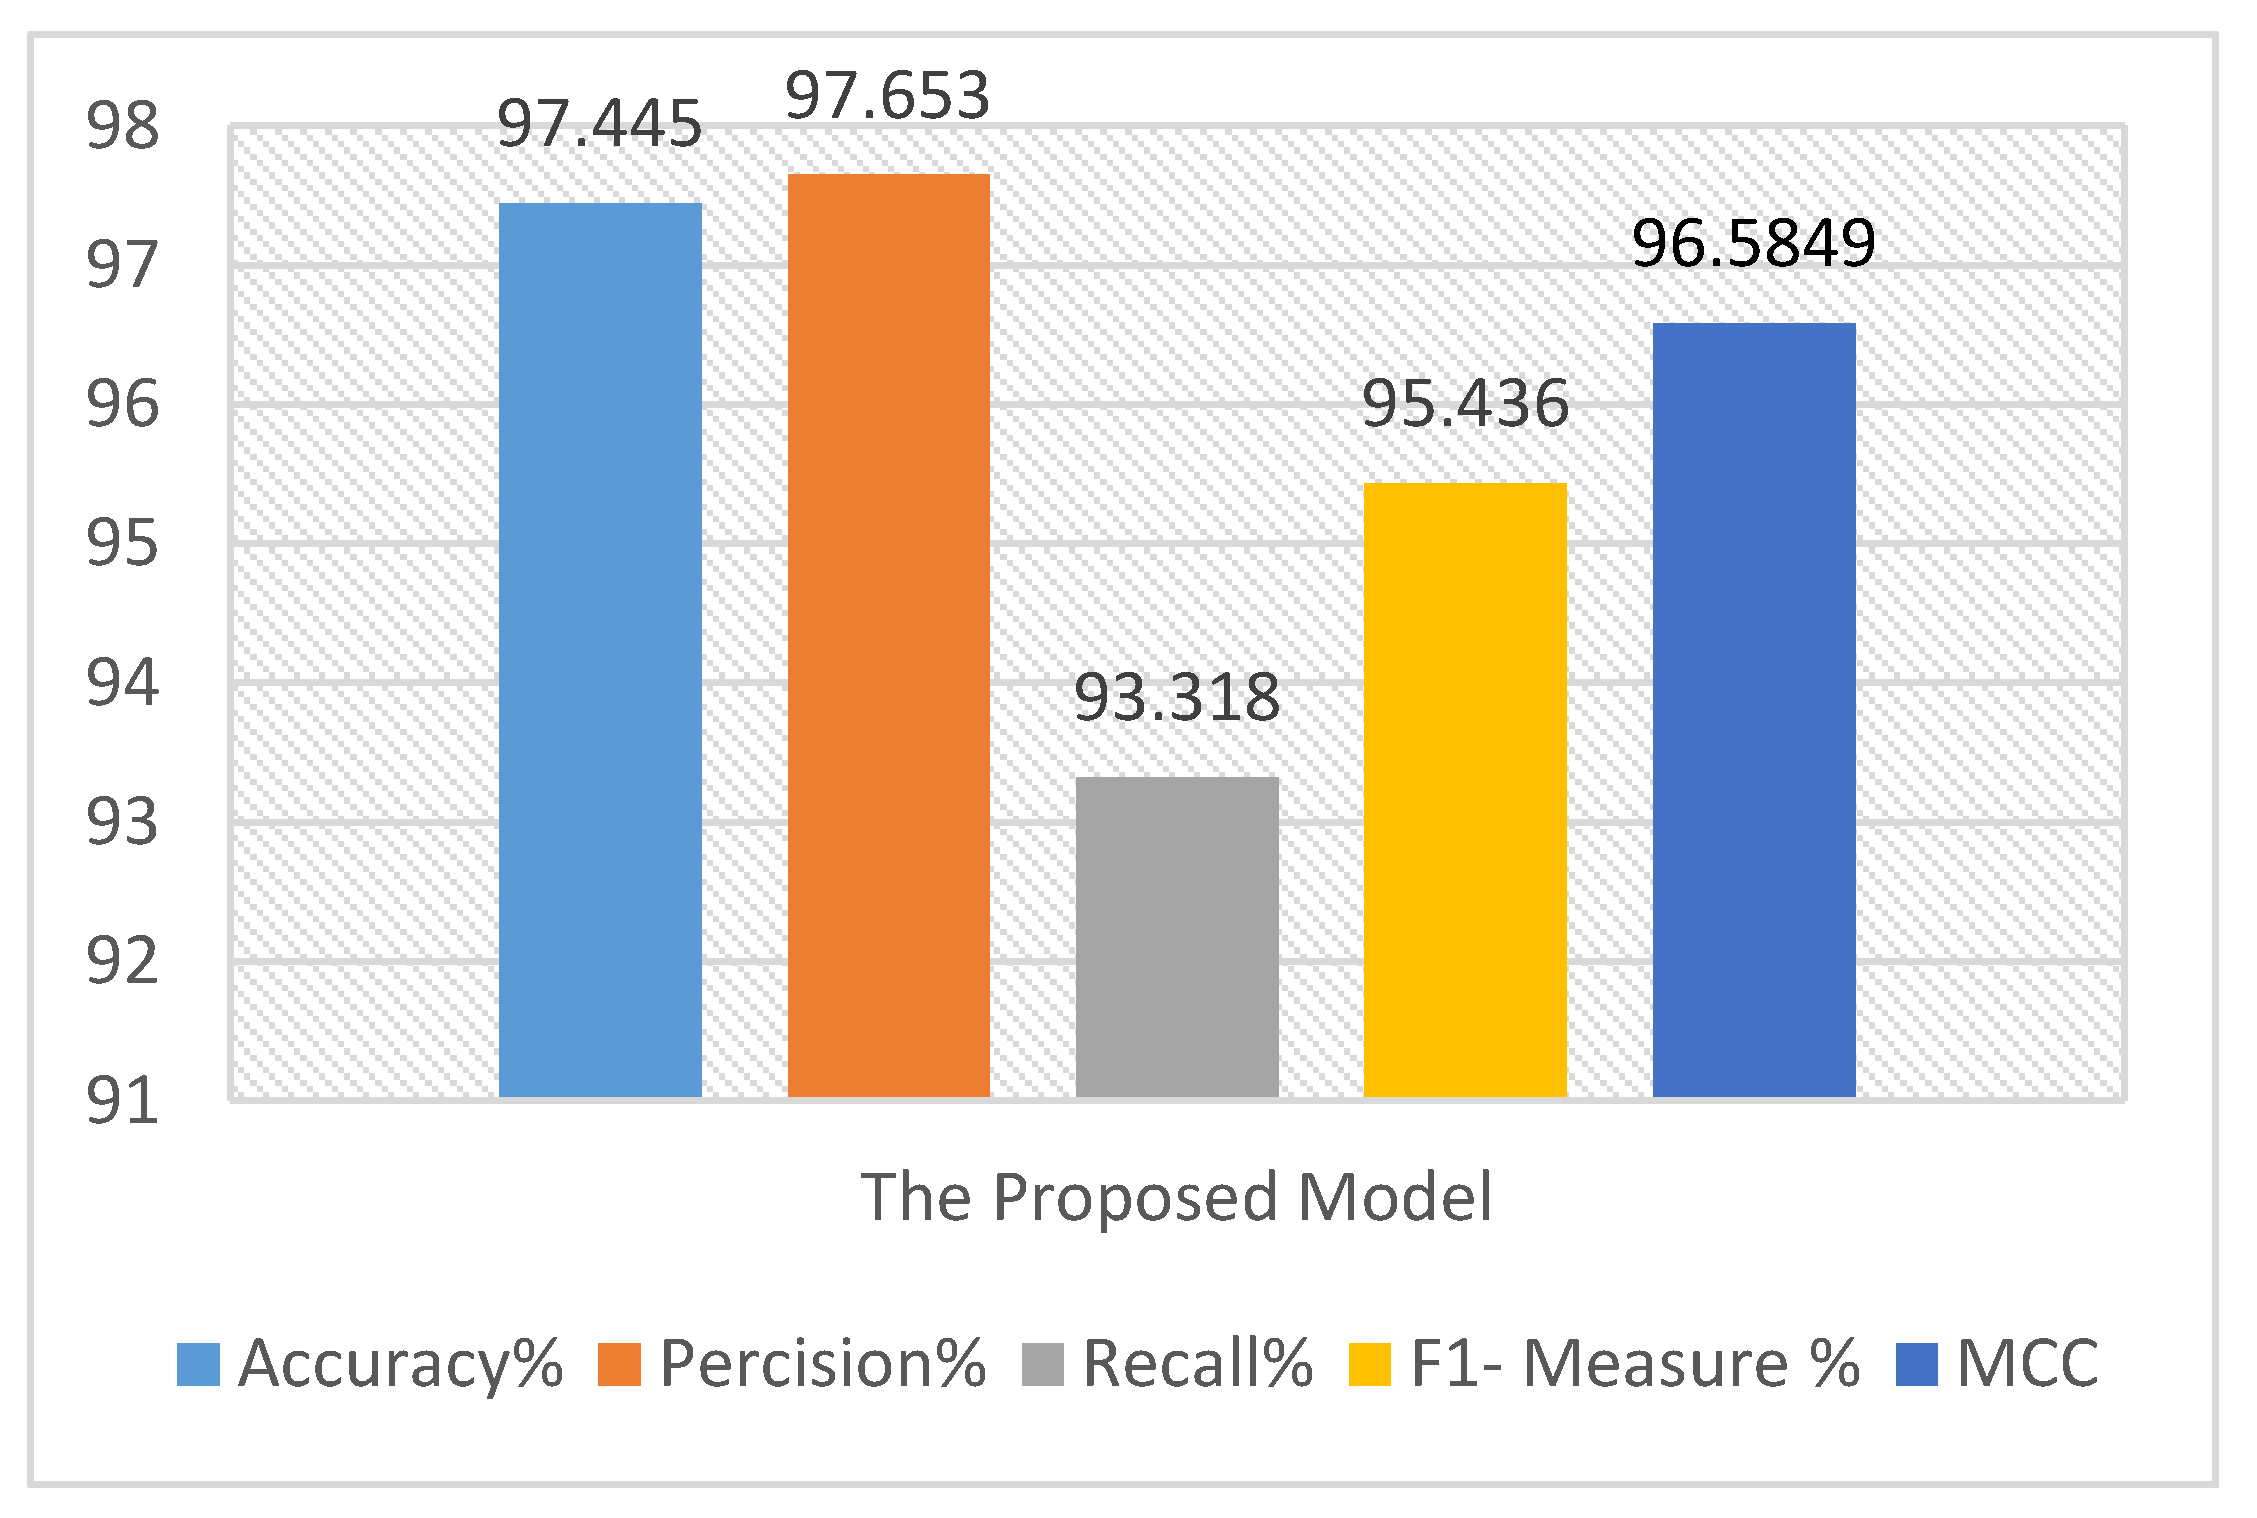
Figure 10.
The 10-fold cross-validation average result on CASIA V2.0 using the proposed model.
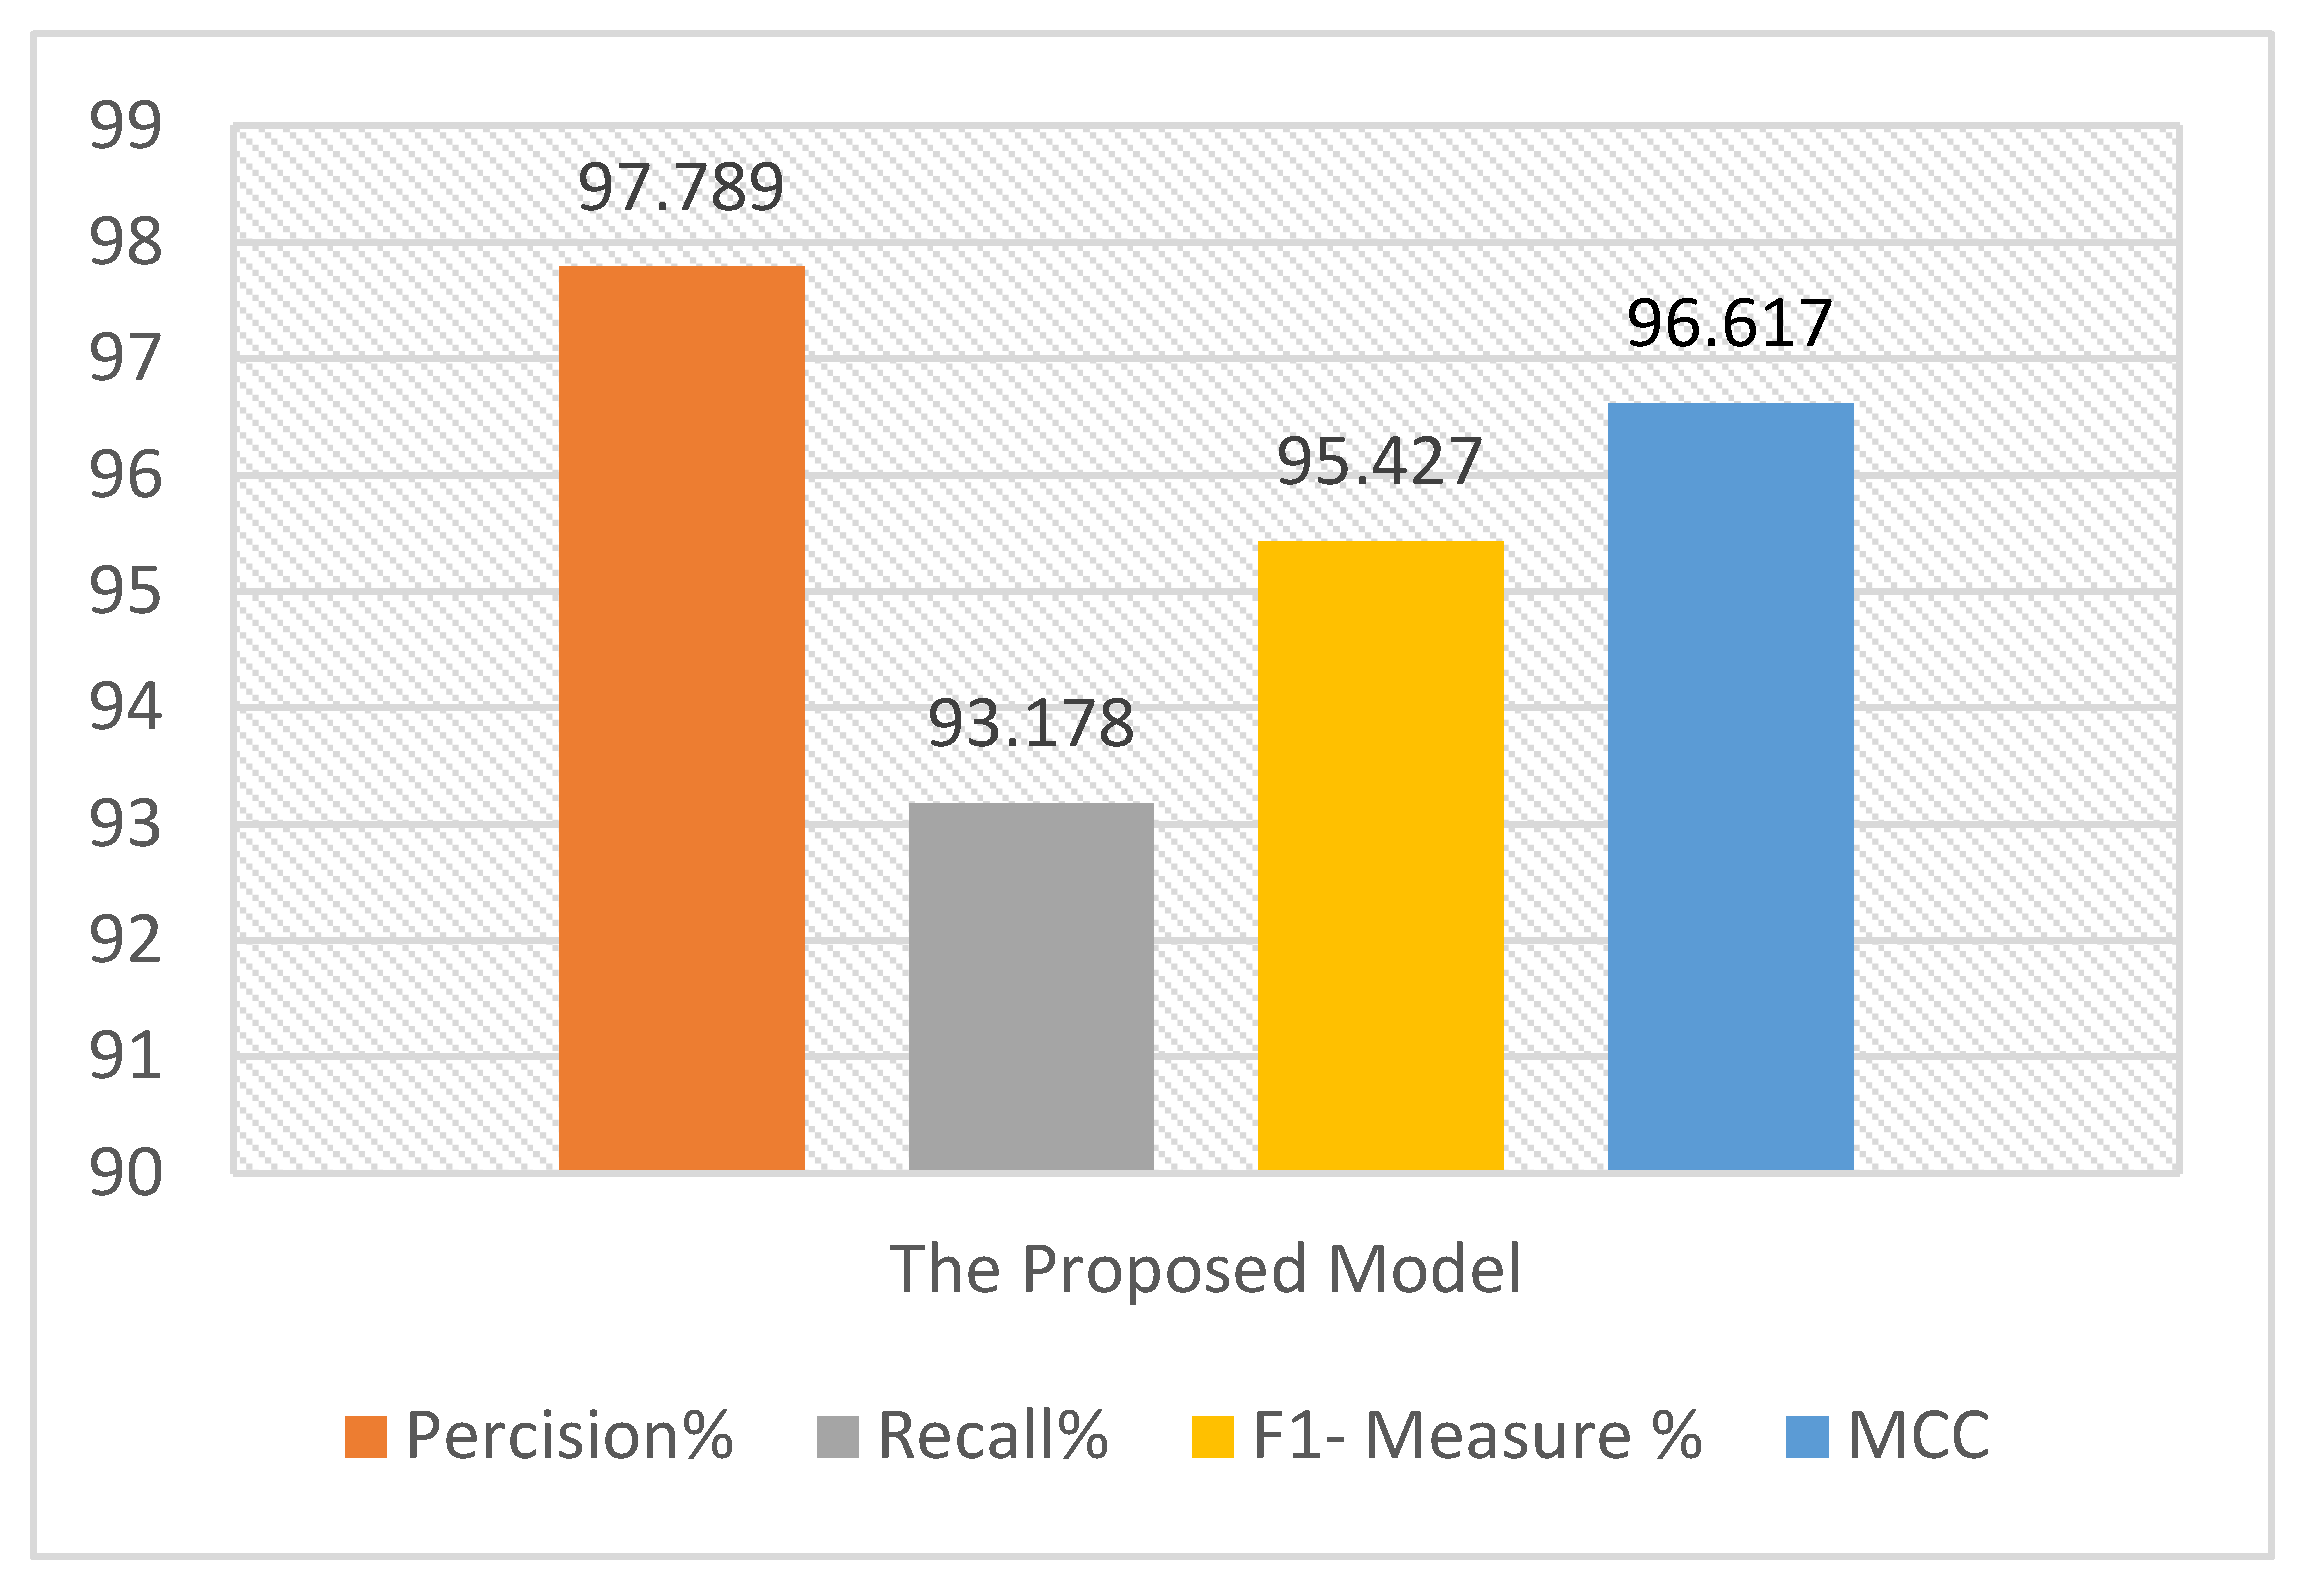
Figure 11.
The 10-fold cross-validation average result on DVMM using the proposed model.
Figure 12.
The 10-fold cross-validation average result on NIST 17 using the proposed model.
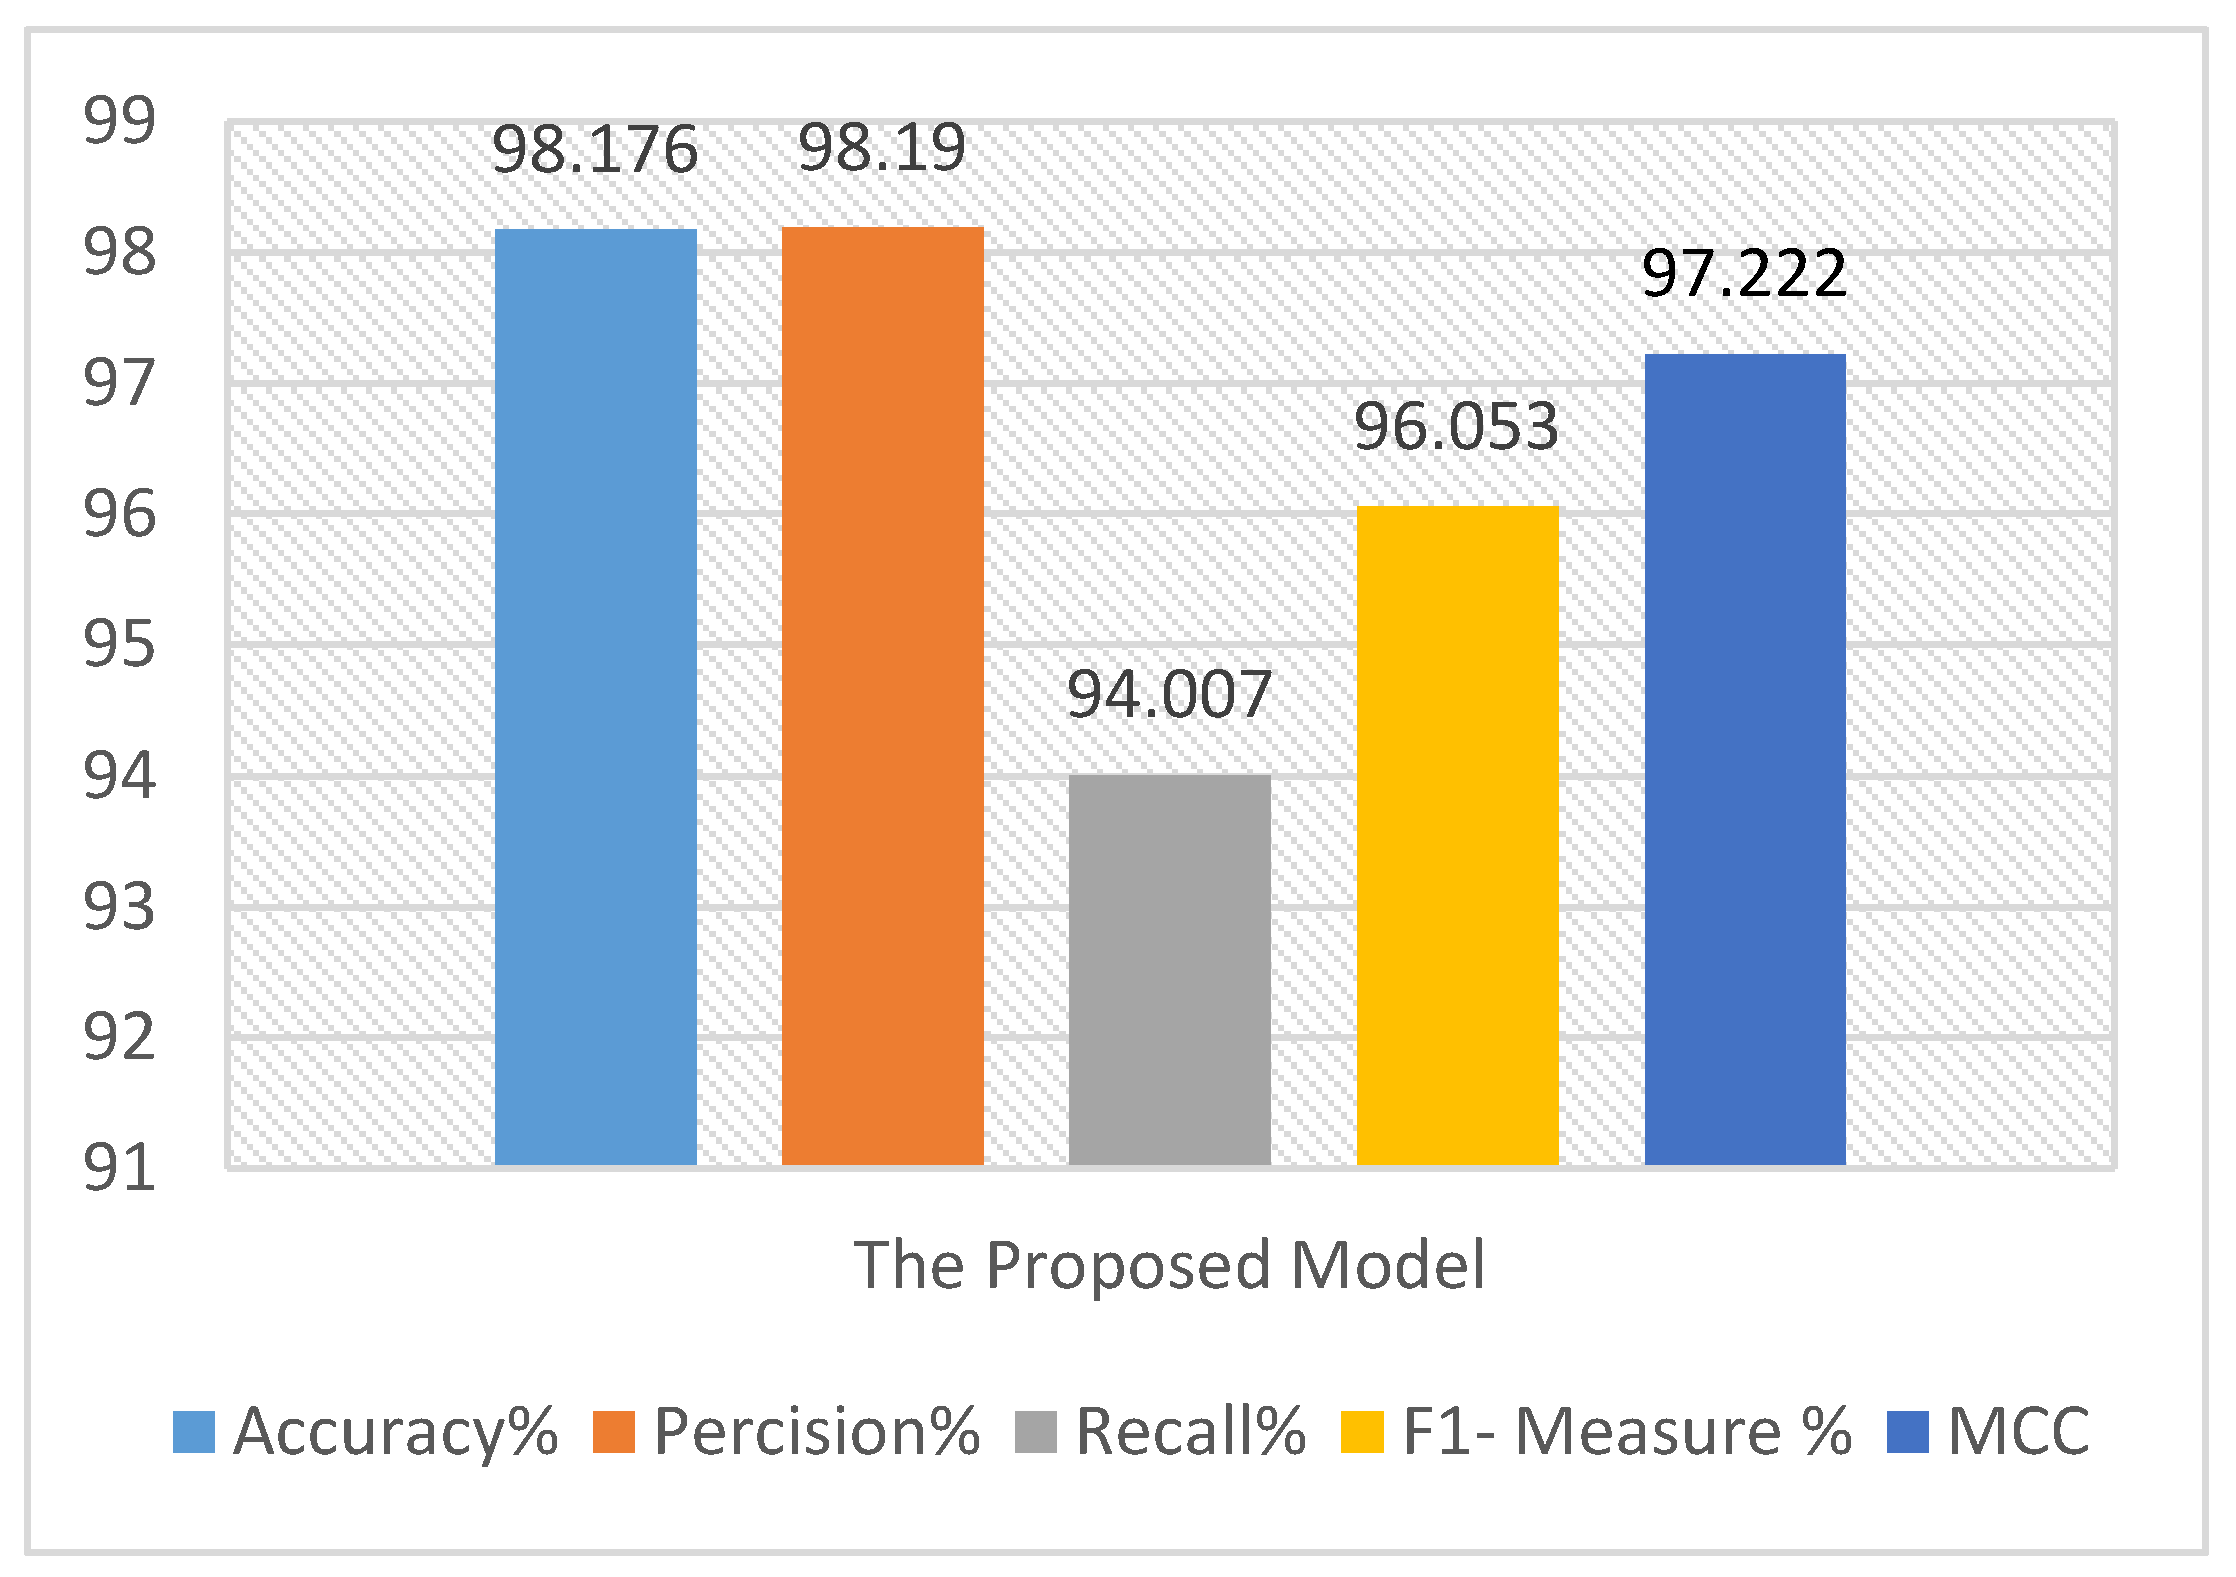
Figure 13.
The 10-fold cross-validation average result applied on the overall datasets using our proposed model.
Table 1.
Difference between local response normalization and batch normalization.
| Normalization Type | Trainable | # of Trainable Parameters | Regularization |
|---|
| LRN | No | 0 | No |
| BN | Yes | 2 | Yes |
Table 2.
Confusion matrix.
| | | Predicted Class | |
|---|
| | | Malicious | Benign |
| Actual Class | Malicious | True Positive (TP) | False Negative (FN) |
| | Benign | False Positive (FP) | True Negative (TN) |
Table 3.
The detailed results of 10-fold cross-validation on CASIA V1.0 using the proposed model.
| | Iteration 1 | Iteration 2 | Iteration 3 | Iteration 4 | Iteration 5 | Iteration 6 | Iteration 7 | Iteration 8 | Iteration 9 | Iteration 10 |
|---|
| #of training images | 1549 |
| # of test images | 172 |
| Accuracy | 96.93 | 96.62 | 96.768 | 96.81 | 97.1 | 97.05 | 96.97 | 96.99 | 96.93 | 96.31 |
| Precision | 97.881 | 97.7 | 97.2 | 96.878 | 97.322 | 97.657 | 96.956 | 97.45 | 97.32 | 97.932 |
| Recall | 92.97 | 92.76 | 93.14 | 92.98 | 93.05 | 93.002 | 92.98 | 92.967 | 93.034 | 93.254 |
| F1- Measure | 95.363 | 95.1672 | 95.128 | 94.89 | 95.14 | 95.273 | 94.925 | 95.157 | 95.13 | 95.537 |
| MCC | 96.465 | 96.268 | 96.23 | 95.93 | 96.275 | 96.385 | 96.027 | 96.302 | 96.321 | 96.619 |
Table 4.
The detailed results of 10-fold cross-validation on CASIA V2.0 using the proposed model.
| | Iteration 1 | Iteration 2 | Iteration 3 | Iteration 4 | Iteration 5 | Iteration 6 | Iteration 7 | Iteration 8 | Iteration 9 | Iteration 10 |
|---|
| #of training images | 11,353 |
| # of test images | 1261 |
| Accuracy | 97.45 | 97.14 | 97.28 | 97.345 | 97.67 | 97.453 | 97.36 | 97.439 | 97.443 | 97.867 |
| Precision | 98.5 | 97.8 | 97.223 | 97.22 | 97.35 | 97.67 | 97.56 | 97.58 | 97.422 | 98.2 |
| Recall | 93.47 | 93.26 | 93.124 | 93.18 | 93.235 | 93.243 | 93.384 | 93.39 | 93.341 | 93.554 |
| F1- Measure | 95.92 | 95.4761 | 95.13 | 95.157 | 95.248 | 95.405 | 95.426 | 95.439 | 95.3385 | 95.8207 |
| MCC | 97.024 | 96.594 | 96.241 | 96.287 | 96.375 | 96.609 | 96.631 | 96.603 | 96.453 | 97.0321 |
Table 5.
The detailed results of 10-fold cross-validation on DVMM using the proposed model.
| | Iteration 1 | Iteration 2 | Iteration 3 | Iteration 4 | Iteration 5 | Iteration 6 | Iteration 7 | Iteration 8 | Iteration 9 | Iteration 10 |
|---|
| #of training images | 1660 |
| # of test images | 185 |
| Accuracy | 97.01 | 96.943 | 96.868 | 96.92 | 97.176 | 97.125 | 96.97 | 97.09 | 97.33 | 97.52 |
| Precision | 97.951 | 97.743 | 97.2656 | 96.908 | 97.622 | 97.887 | 97.056 | 97.6 | 97.52 | 98 |
| Recall | 93.07 | 92.85 | 93.163 | 93.08 | 93.074 | 93.012 | 93.086 | 93.067 | 93.096 | 93.354 |
| F1- Measure | 95.45 | 95.236 | 95.171 | 94.926 | 95.295 | 95.388 | 95.03 | 95.279 | 95.2578 | 95.622 |
| MCC | 96.567 | 96.345 | 96.259 | 96.023 | 96.468 | 96.456 | 96.206 | 96.965 | 96.4695 | 96.895 |
Table 6.
The detailed results of 10-fold cross-validation on the NIST 17 dataset using the proposed model.
| | Iteration 1 | Iteration 2 | Iteration 3 | Iteration 4 | Iteration 5 | Iteration 6 | Iteration 7 | Iteration 8 | Iteration 9 | Iteration 10 |
|---|
| #of training images | 9000 |
| # of test images | 1000 |
| Accuracy | 97.33 | 97.02 | 97.16 | 97.33 | 97.54 | 97.43 | 97.248 | 97.36 | 97.39 | 97.75 |
| Precision | 98.52 | 97.83 | 97.54 | 97.22 | 98.12 | 97.67 | 97.56 | 97.58 | 97.422 | 98.423 |
| Recall | 93.35 | 93.14 | 93.05 | 93.004 | 93.12 | 93.154 | 93.234 | 93.123 | 93.278 | 93.323 |
| F1- Measure | 95.865 | 95.429 | 95.243 | 95.066 | 95.555 | 95.36 | 95.349 | 95.3 | 95.306 | 95.805 |
| MCC | 97.027 | 96.608 | 96.481 | 96.391 | 96.647 | 96.459 | 96.537 | 96.467 | 96.497 | 97.056 |
Table 7.
The detailed results of 10-fold cross-validation on the overall datasets.
| | Iteration 1 | Iteration 2 | Iteration 3 | Iteration 4 | Iteration 5 | Iteration 6 | Iteration 7 | Iteration 8 | Iteration 9 | Iteration 10 |
|---|
| #of training images | 23562 |
| # of test images | 2618 |
| Accuracy | 98.1 | 97.64 | 97.85 | 98.5 | 98.19 | 98.053 | 98.643 | 98.47 | 97.943 | 98.367 |
| Precision | 98.78 | 98.32 | 97.93 | 97.952 | 97.85 | 98.38 | 98.544 | 98.08 | 97.72 | 98.346 |
| Recall | 94.17 | 93.66 | 93.924 | 93.98 | 93.835 | 94.045 | 94.503 | 93.79 | 93.911 | 94.254 |
| F1- Measure | 96.42 | 95.933 | 95.885 | 95.925 | 95.8 | 96.164 | 96.481 | 95.89 | 95.778 | 96.257 |
| MCC | 97.693 | 97.054 | 97.012 | 97.087 | 97.003 | 97.349 | 97.643 | 97.005 | 96.978 | 97.396 |
Table 8.
The overall average performance of the proposed model and other comparable models presented in [
19,
20,
21].
| | Accuracy | Precision | Recall | F1-Score | MCC |
|---|
| Model in [17] | 96.231 | 97.32 | 93.001 | 95.111 | 96.732 |
| Model in [18] | 96.645 | 98.1 | 93.512 | 95.75 | 97.028 |
| Model in [19] | 95.856 | 98.056 | 93.453 | 95.699 | 96.978 |
| Proposed Model | 98.178 | 98.19 | 94.007 | 96.053 | 97.263 |
© 2020 by the authors. Licensee MDPI, Basel, Switzerland. This article is an open access article distributed under the terms and conditions of the Creative Commons Attribution (CC BY) license (http://creativecommons.org/licenses/by/4.0/).


