Article

Multi-Vehicle Simulation in Urban Automated Driving: Technical Implementation and Added Benefit

by
Alexander Feierle
*,†,
Michael Rettenmaier
*,†,
Florian Zeitlmeir
and
Klaus Bengler
Chair of Ergonomics, Technical University of Munich, 85748 Garching, Germany
*
Authors to whom correspondence should be addressed.
These authors contributed equally to this work.
Information 2020, 11(5), 272; https://doi.org/10.3390/info11050272
Submission received: 11 April 2020 / Revised: 11 May 2020 / Accepted: 16 May 2020 / Published: 19 May 2020

Abstract

:
This article investigates the simultaneous interaction between an automated vehicle (AV) and its passenger, and between the same AV and a human driver of another vehicle. For this purpose, we have implemented a multi-vehicle simulation consisting of two driving simulators, one for the AV and one for the manual vehicle. The considered scenario is a road bottleneck with a double-parked vehicle either on one side of the road or on both sides of the road where an AV and a simultaneously oncoming human driver negotiate the right of way. The AV communicates to its passenger via the internal automation human–machine interface (HMI) and it concurrently displays the right of way to the human driver via an external HMI. In addition to the regular encounters, this paper analyzes the effect of an automation failure, where the AV first communicates to yield the right of way and then changes its strategy and passes through the bottleneck first despite oncoming traffic. The research questions the study aims to answer are what methods should be used for the implementation of multi-vehicle simulations with one AV, and if there is an added benefit of this multi-vehicle simulation compared to single-driver simulator studies. The results show an acceptable synchronicity for using traffic lights as basic synchronization and a distance control as the detail synchronization method. The participants had similar passing times in the multi-vehicle simulation compared to a previously conducted single-driver simulation. Moreover, there was a lower crash rate in the multi-vehicle simulation during the automation failure. Concluding the results, the proposed method seems to be an appropriate solution to implement multi-vehicle simulation with one AV. Additionally, multi-vehicle simulation offers a benefit if more than one human affects the interaction within a scenario.

1. Introduction

A current research focus in the context of automated driving is human–machine interface (HMI) design. In urban areas, which are characterized by a high number of objects [1], a high number of vulnerable road users [2], and high information density [3], the automated vehicle (AV) must be able to clearly communicate with the passenger and the surrounding human road user [4]. The only way to investigate the simultaneous communication via the automation HMI (aHMI) and the external HMI (eHMI) [4] is by conducting a multi-vehicle simulation. This requires a human road user, such as a human driver, who perceives the eHMI and a passenger in the AV who perceives information from the aHMI.
A scenario of particular interest is the bottleneck scenario in urban areas [5] where communicating via eHMIs has the potential to enhance traffic efficiency and safety [6]. Partially automated driving systems (ADS) are already state of the art. Nevertheless, the current operation design domain (ODD) in partially automated driving is limited to highways, since these are characterized by a lower complexity compared to urban areas. As the driver must still monitor the ADS and must be able to take over vehicle guidance at any time without a request to intervene [7], it could be assumed that such systems will be realized sooner than systems with a higher level of driving automation in urban areas. Therefore, this study addresses the interaction between a human driver and a partially AV and its passenger in bottleneck scenarios in urban areas.
Compared to investigations with fixed programmed road users, multi-vehicle simulations should generate a more realistic driving behavior [8]. With regard to partially automated driving, there may be an added benefit, especially when the passenger of the AV has to take over vehicle guidance again. For this purpose, a controlled interaction scenario must be achieved, which is a special challenge of multi-vehicle simulation [9]. Therefore, this publication aims at the realization and evaluation of the technical implementation of such a multi-vehicle study. Additionally, a multi-vehicle experiment has been conducted to compare the results with a single-driver simulation to identify added benefits using multi-vehicle simulation.

2. State of Research

2.1. Previous Studies on Multi-Agent Simulation

Multi-agent simulation is a useful tool for analyzing the interaction of various road users in the same environment. It permits the measurement of the parameters of each individual participant as well as the objectification of the behavior within a group of several drivers, e.g., in platoons [10]. Additionally, the multi-agent simulation retains the single-agent simulation’s benefits of being controllable and accurate and enriches the experiments with a more realistic traffic flow environment [11,12]. Thus, the multi-vehicle simulation increases the ability of both driving and traffic simulation [11]. It enables the investigation of social interaction [13] and the analysis of advanced driver assistance systems affecting several drivers [14]. A classification of previous research can be made according to the characteristics of the road users involved.
Lehsing, Benz, and Bengler [15] investigated the interaction between a human driver and a pedestrian in a pedestrian crossing scenario. In half of the encounters a confederate controlled the pedestrian, resulting in a more human-like behavior since he was able to react to the participants’ driving behavior. In the other half of the encounters the pedestrian’s behavior was programmed. The authors state that the approach of physically linking both simulators is a meaningful method in traffic research since it raises the validity of investigations in human–human interaction [15].
In contrast to the driver-pedestrian interaction there were studies researching the interaction between several human drivers, which could be clustered in experiments investigating safety-critical situations and experiments researching the interaction and cooperation between several road users. Hancock and de Ridder [16] used the multi-vehicle simulation to investigate the participants’ avoidance responses at the brink of a collision. The authors emphasize the value of multi-vehicle simulation because it analyzes critical situations in a safe and efficient manner. Moreover, the method provided similar avoidance responses compared to real-world investigations [16]. Yasar, Berbers, and Preuveneers [17] also used the multi-vehicle simulation to investigate safety critical situations at intersections by analyzing the incident rate and the participants’ driving behavior affected by a voice-based command system and the presence of traffic lights. Will [18] found a decrease in the criticality of encounters between a human driver and a motorcyclist due to a system supporting the interaction at intersections.
Aside from conducting multi-vehicle simulations to investigate safety critical situations, the method was also used to analyze the interaction or cooperation of different human drivers. The method was used to realize the presence of multiple participants in a platoon of four vehicles to identify parameters describing the behavior of different drivers within the platoon as well as the behavior of the platoon as a whole [19,20]. Moreover, Heesen, Baumann, Kelsch, Nause, and Friedrich [21] conducted a multi-vehicle study to examine the effect of a cooperative lane change assistant on possible conflicts on motorways. Results of the experiment show that drivers consider the other driver’s possible actions when requesting to cooperate. In addition, the capability to anticipate affects the willingness to cooperate [21]. Sun, Ma, Li, and Niu [11] confirm the positive effect of multi-vehicle simulation on the behavior in lane change maneuvers to be consistent with the data of field observations. Further research including multi-vehicle simulation was applied, e.g., the evaluation of dynamic speed guidance strategies [22] or the analysis of the “rubbernecking” phenomenon, consisting of a driver slowing down due to an accident on the opposite side of the road [23].
Furthermore, multi-vehicle simulations are used to analyze the subjective feeling of human drivers. Rittger, Mühlbacher, Maag, and Kiesel [24] found that the usage of a traffic light assistant could raise the feeling of bothering other road users and it induces anger in participants without an assistant. Additionally, the participants’ knowledge of the presence of another real human in the same simulation influences the participants’ sensation [25] and the willingness to cooperate [21].
The implementation of AVs and the associated investigation of the interaction between AVs and other road users enlarge the application of multi-agent simulation. Bazilinskyy, Kooijman, Dodou, and de Winter [26] analyzed the interaction between an AV communicating via an eHMI, a human driver, and a pedestrian at a T-intersection with a zebra-crossing. The authors concluded that the multi-agent simulation is a promising tool to research interaction in traffic in the future.

2.2. Implementation of Multi-Agent Simulation

One challenge in conducting a multi-agent simulation is to induce the interaction in a controlled manner [9]. In the case that the interaction does not occur in the simulation, there is no added benefit of multi-agent simulation [8]. The following possibilities to realize the participants’ coordination were used to avoid the insufficiently synchronized encounters of several participants.
Schindler and Köster [27] used the implementation of detours, dynamically modified speed adjustments, and the manipulation of the participants’ speedometer to synchronize the participants’ encounter. Another possibility is the dynamic change of the route length [16,27] or to have one interaction partner as a confederate [15]. The confederate knows about the experimental condition and is able to react to the driving behavior of the other participant. Moreover, the instruction of participants could be used to enable a synchronized interaction [24,28]. In the simulation, the implementation of road sections where the participants have to follow programmed traffic and the control of implemented traffic lights are methods to enable coordinated interaction in a multi-agent simulation [27,29].

3. Objectives

One challenge of multi-vehicle simulation is that the participants have to approach the investigated scenario at the same time in order to ensure controlled interaction. Various publications have already taken up this challenge. However, all these studies investigated scenarios without automated road users. Since the present work investigates the interaction between an AV and a human driver at bottlenecks, new opportunities arise to achieve the synchronous arrival of both road users via the ADS and its implemented longitudinal control. This creates new challenges in terms of reproducibility and comprehensibility. Therefore, this publication aims at the technical implementation and evaluation of such a method with an automated road user in a multi-vehicle simulation. Hence, a multi-vehicle simulation was conducted. The results are compared with the results of a single-driver study on eHMI design to identify the relevant use cases where multi-vehicle simulation offers an added benefit. The objectives of this study lead to the following research questions (RQ):
  • RQ1: What methods should be used for multi-vehicle simulations with one automated vehicle to ensure synchronicity?
  • RQ2: What is the added benefit of a multi-vehicle simulation with one automated vehicle compared to single-driver simulations?

4. Technical Implementation

4.1. Basic Synchronization

After analyzing synchronization methods used in research for multi-vehicle simulation studies (see Section 2.2), we decided to synchronize the AV and the human driver via a traffic light control. The basic synchronization with traffic lights enables the compensation of large time differences and has a low space requirement in the simulation environment. Figure 1 shows the basic synchronization we implemented in the simulation. For the manual vehicle, a speed limit of 30 km/h was applied directly after the traffic lights. For the AV, the speed limit of 30 km/h was set at the beginning of the interaction phase. When approaching the bottleneck the traffic light in front of the human driver shows red and the human driver has to wait at the stop line. The AV arrives at the other traffic light with a delay (Δt) due to course design. During the approach the AV passes a trigger point at the course which causes the traffic lights in front of the AV to switch from green to red so that the AV decelerates to a standstill in front of its stop line. Subsequently, both traffic lights switch from red to green. Since both traffic lights have the same distance to the road bottleneck and due to the simultaneous change of the traffic light’s state, the AV and the human driver are basically synchronized when entering the scenario.

4.2. Detail Synchronization

After the basic synchronization has compensated large time differences, both vehicles start from a standstill after the traffic lights have turned green. A distance difference may already occur while waiting in front of the traffic lights if the human driver comes to a standstill with a different distance to the traffic lights than the AV. According to Rettenmaier, Albers, and Bengler [30] the interaction phase was defined in a radius of 50 m around the road bottleneck (see Figure 1). After passing the green traffic light, distance differences (Δd) would occur without detail synchronization, where the AV adapts to the behavior of the human driver. These differences would result due to the different speed profiles. In the case of large distance differences, there would be no interaction because the passing of the bottleneck would be regulated by the earlier arrival of one of the vehicles [31]. In order to achieve a high degree of synchronicity when the interaction phase is reached, the automated longitudinal control of the AV is used to adapt to the behavior of the human driver.
The automated driving system is realized by using simulation state data. The longitudinal control of the automation during free driving without a front vehicle or traffic light consists of a PID control, which receives speed settings as input. An acceleration is generated as output of the PID control, which is transferred to the internal vehicle dynamics using a single-track model of the driving simulation software SILAB. Here, several implementation opportunities to adapt to the behavior of the manual vehicle exist (Figure 2):
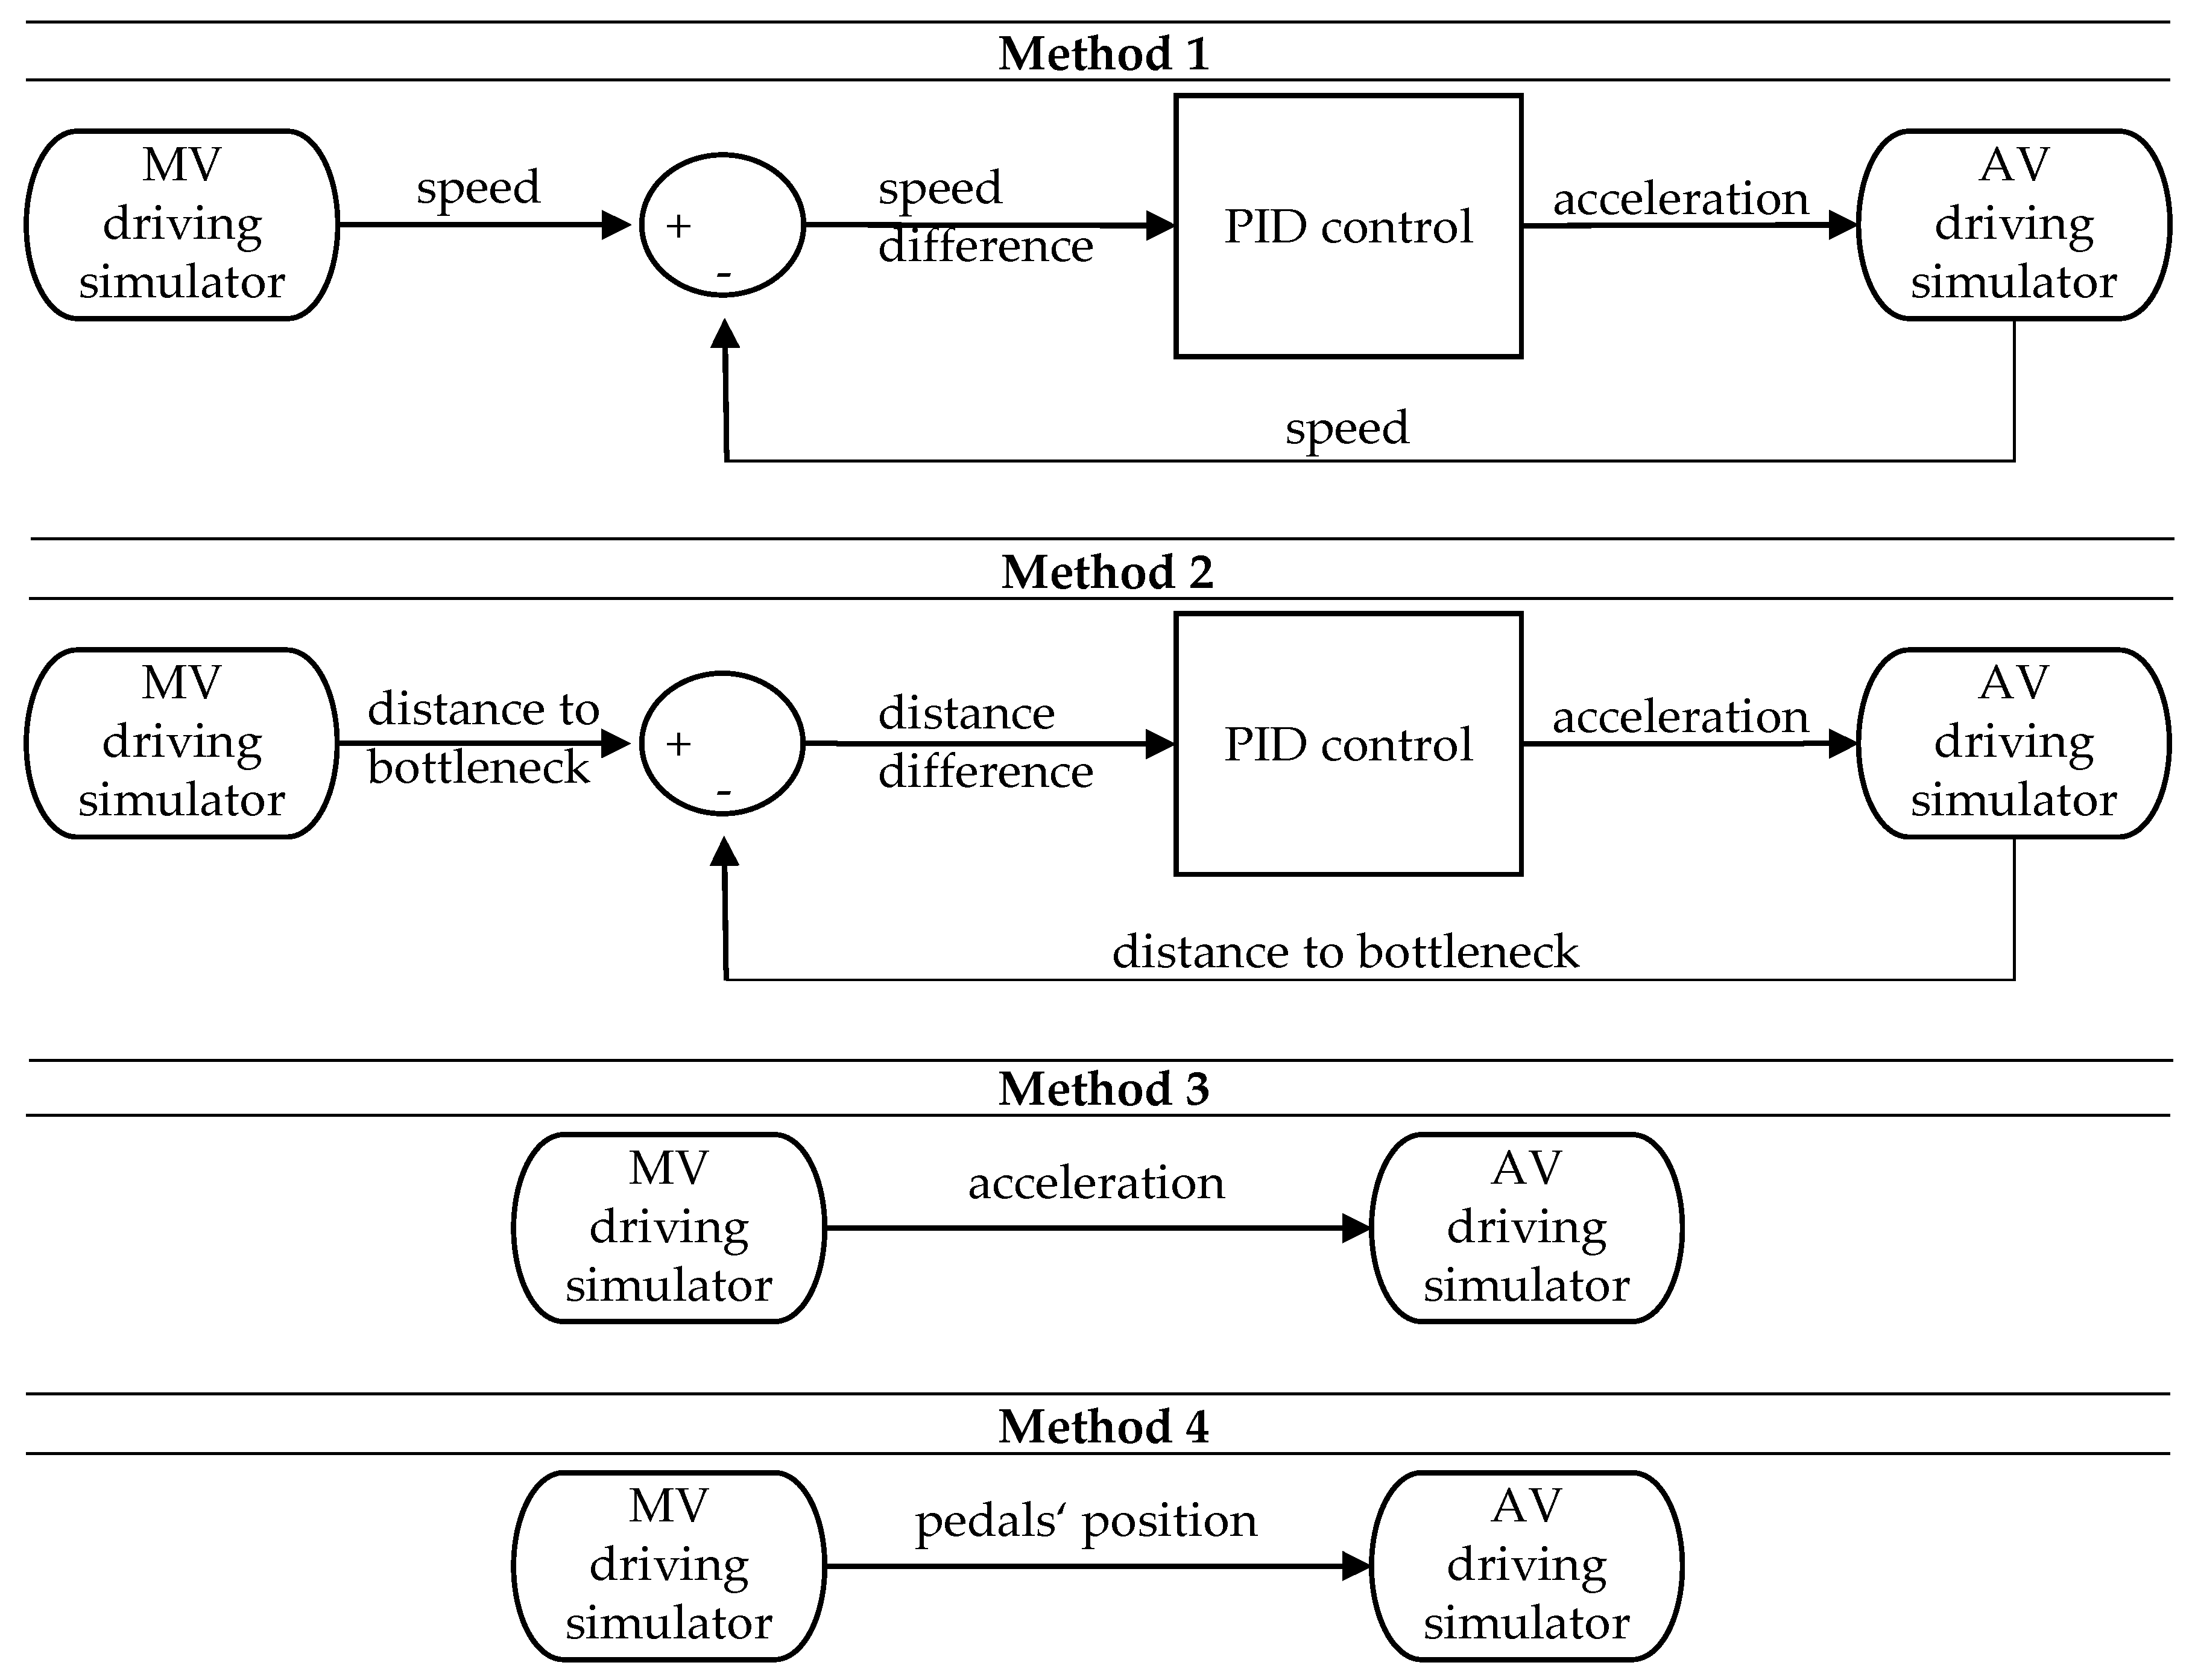
  • Implementation of a PID controller which controls the speed difference of both vehicles and has the acceleration as an output (Method 1)
  • Implementation of a PID controller which controls the distance difference of both vehicles to the road bottleneck and has the acceleration as an output (Method 2)
  • Transmitting the acceleration of the manual vehicle directly to the AV’s internal driving dynamics in SILAB (Method 3)
  • Transmitting the pedals’ positions of the manual vehicle directly to the AV’s internal driving dynamics in SILAB (Method 4)
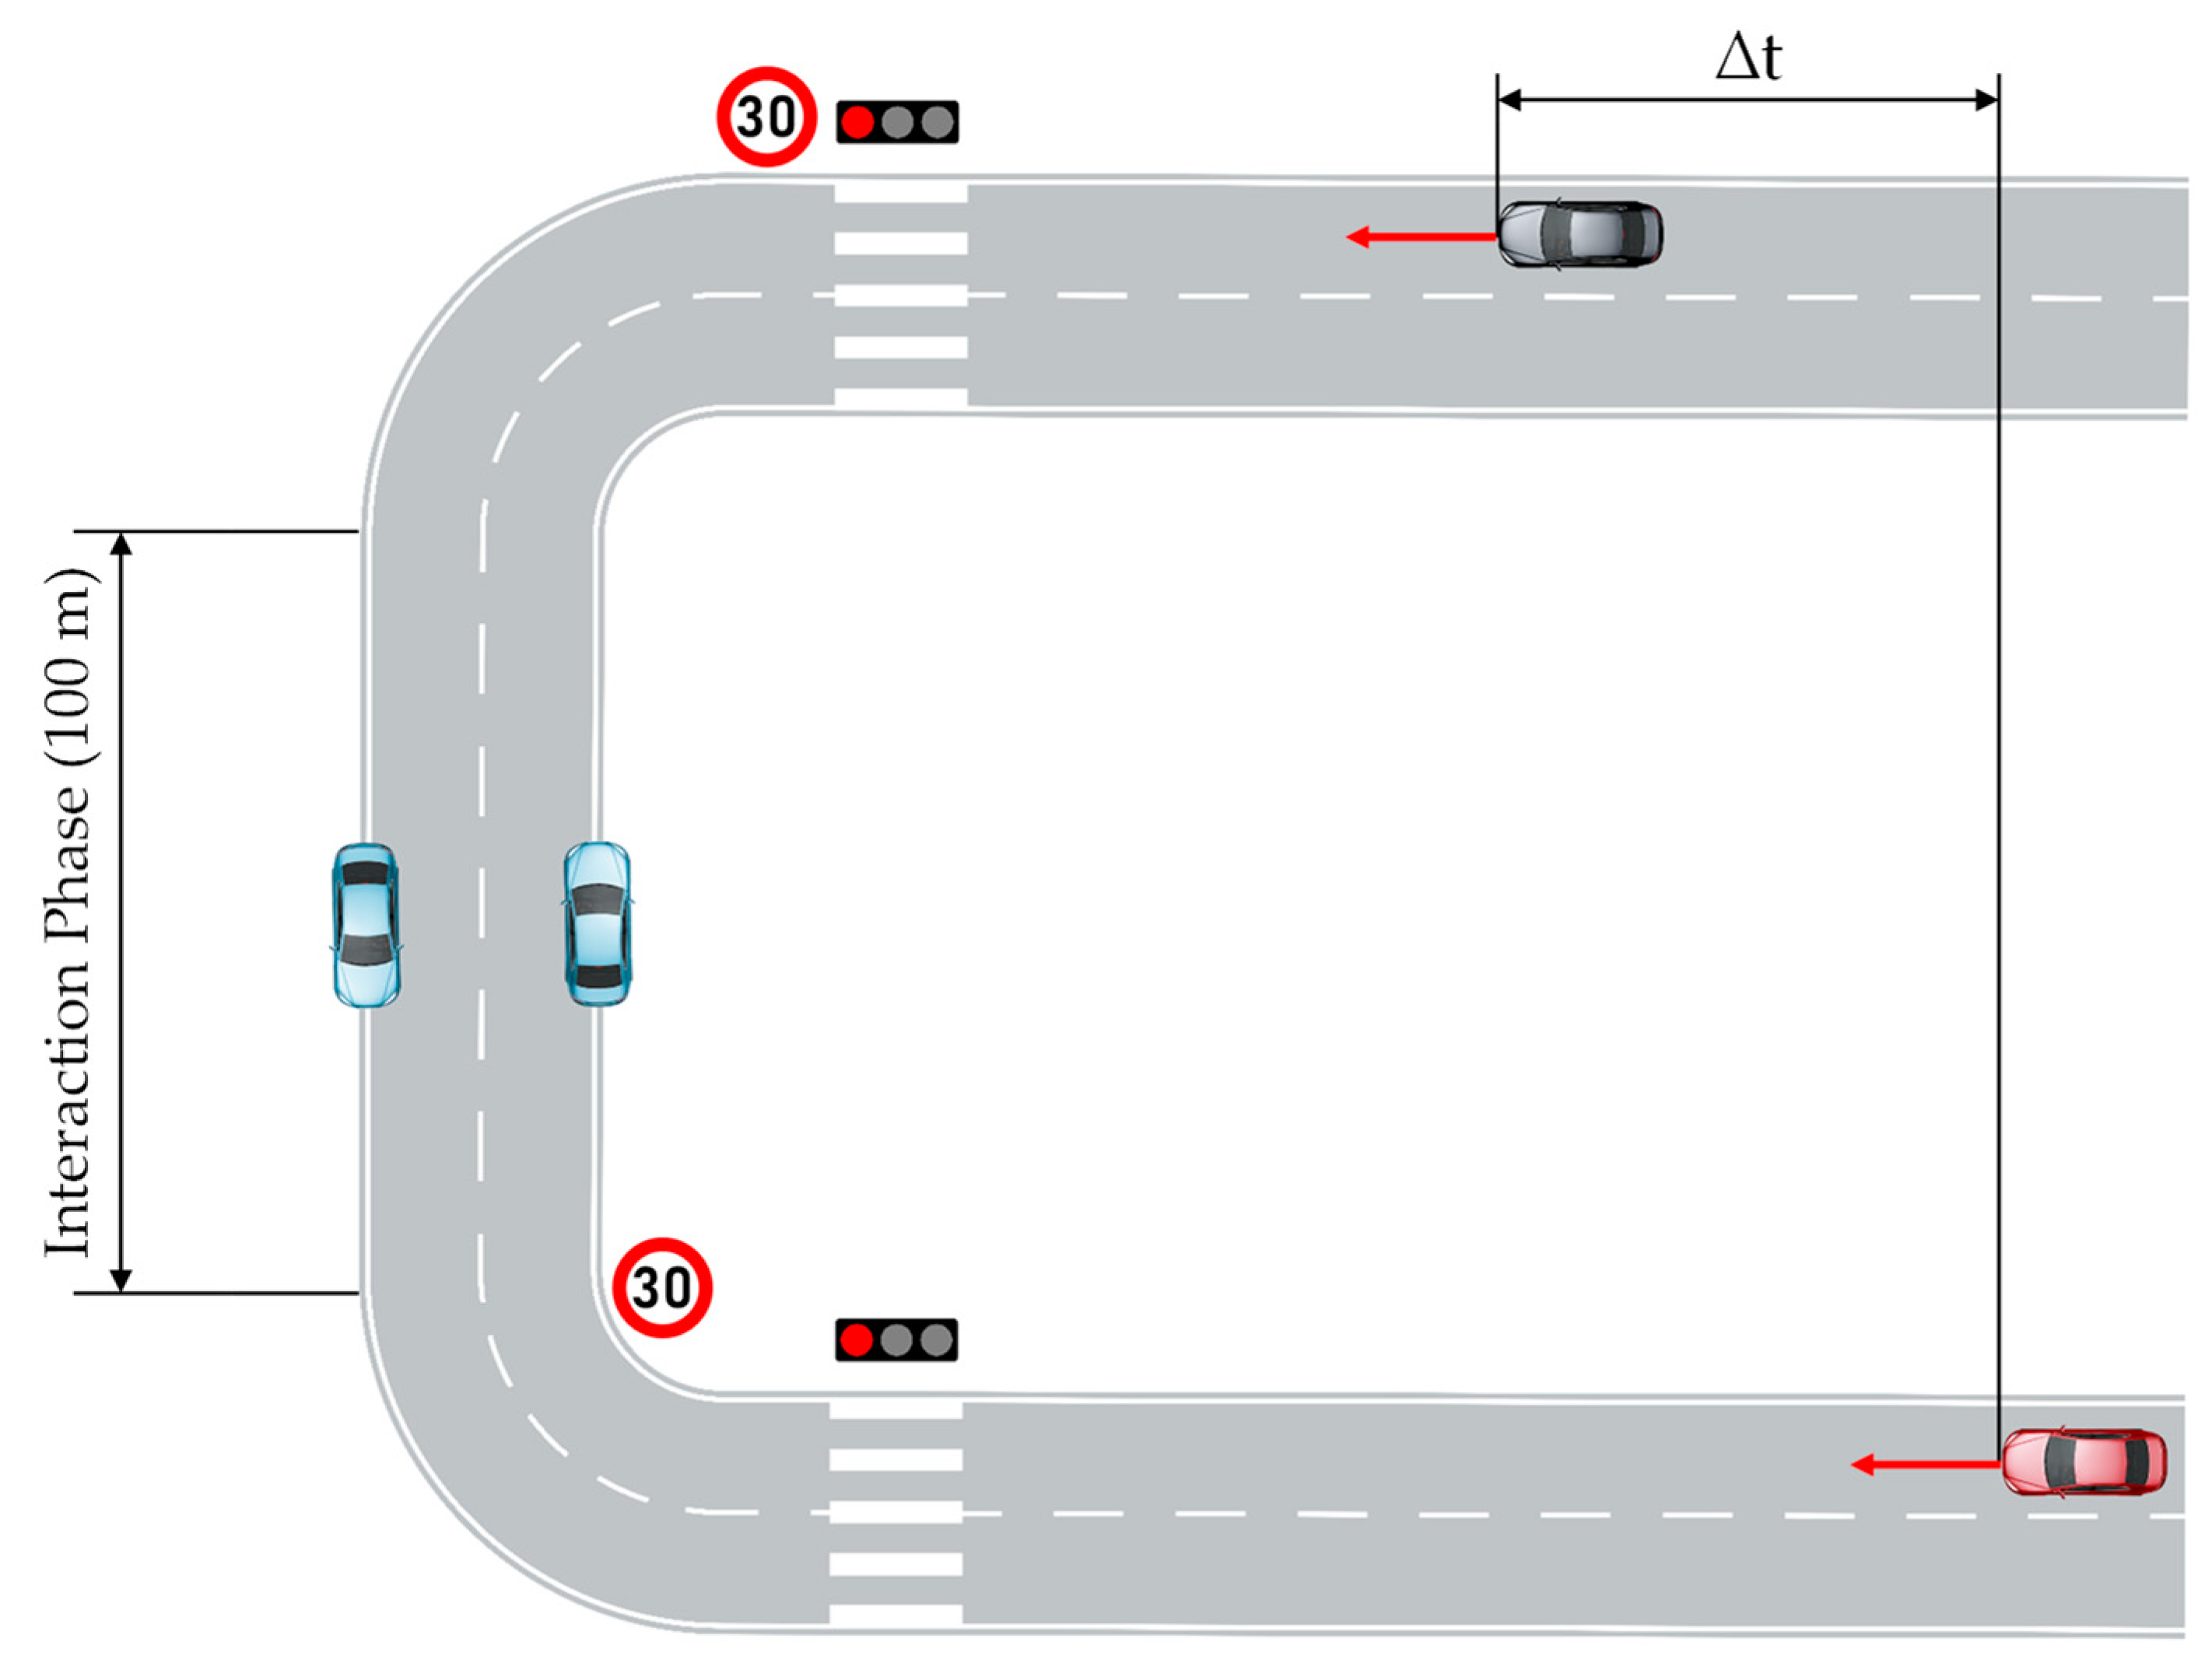
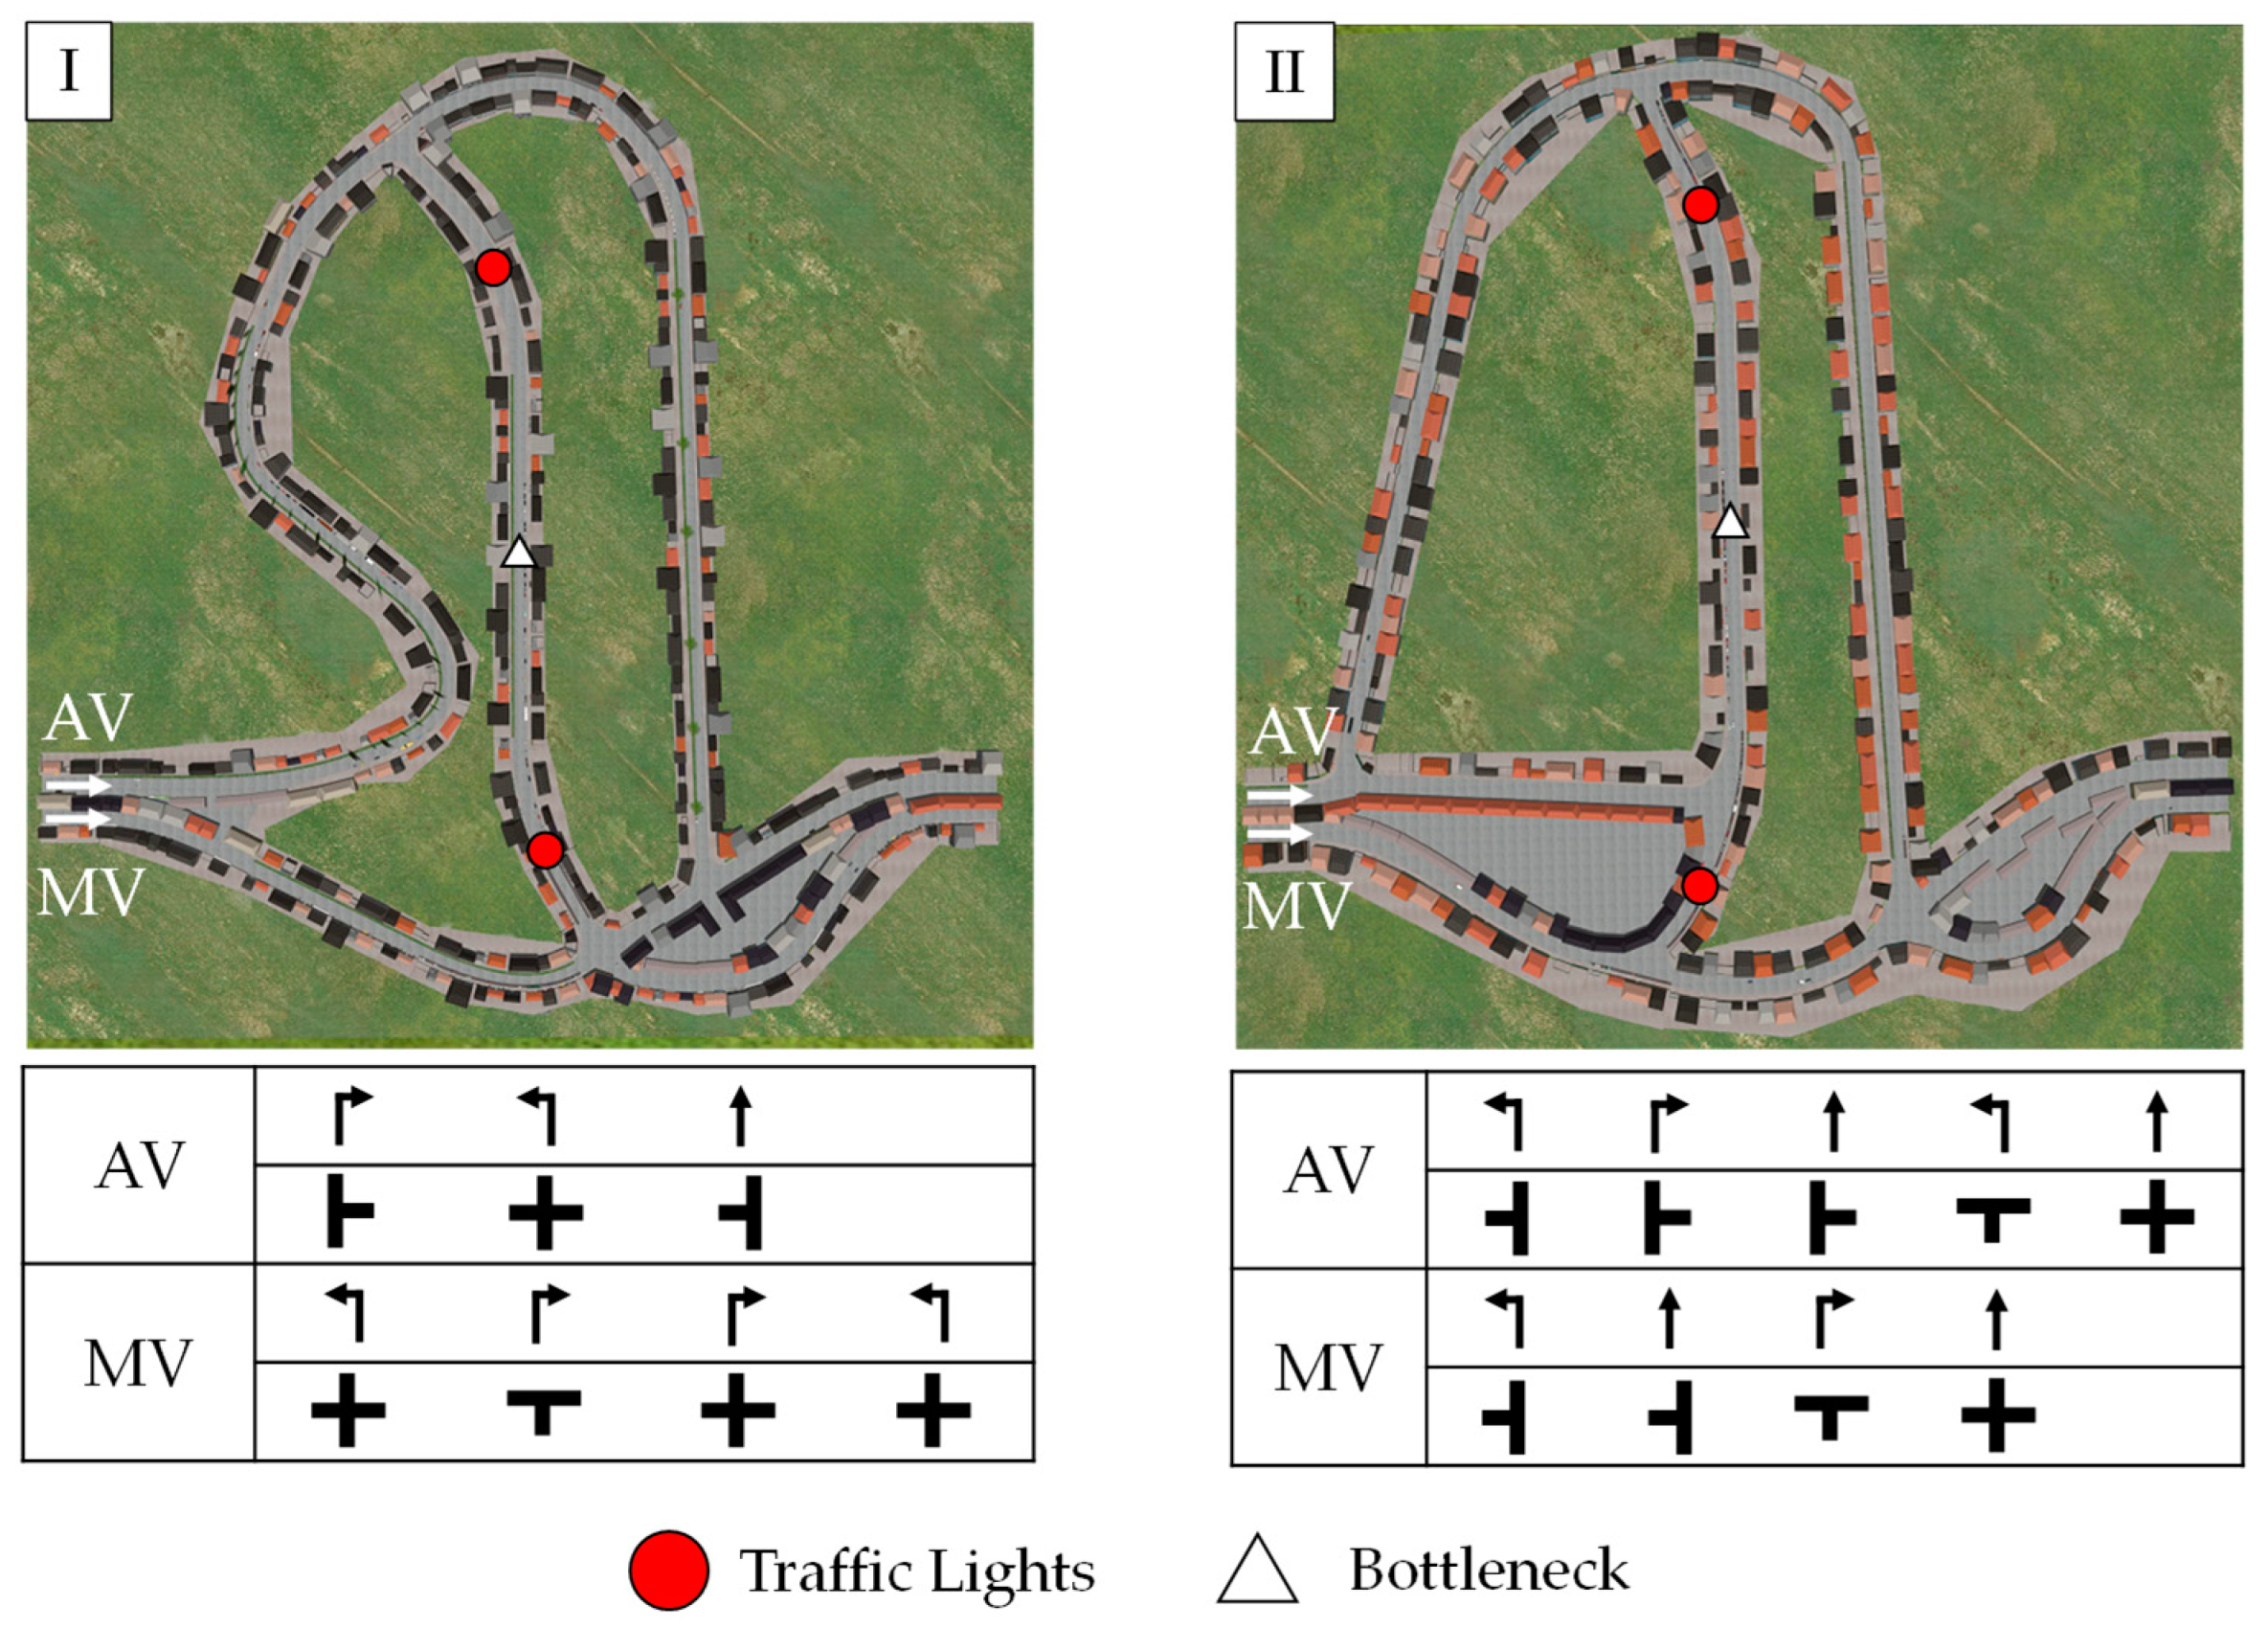
In order to analyze which of these methods is most appropriate, speed profiles for a simulation of the manual vehicle are required. To exclude influences of lateral steering on the longitudinal dynamics, the scenario (Figure 1) was implemented on a straight track instead of a u-shaped one. Subsequently, three different speed profiles were implemented using a cruise control (Figure 3). The different speed profiles are intended to represent different human driver types (offensive, neutral, defensive). Nevertheless, these synthetic profiles cannot represent a human driver exactly, so they are only suitable for a first pre-test.
Negative values for the distance differences of both vehicles to the road bottleneck mean that the manual vehicle reached the interaction phase first. Method 1 using the speed as input resulted in a mean (M) difference of −8.26 m with a standard deviation (SD) of 7.61 m. Using the distance difference as an input in Method 2 led to M = −0.79 m (SD = 1.12 m) difference. Method 3 using the acceleration of the manual vehicle did not lead to any interaction scenarios due to implementation issues. Method 4 using the pedals’ positions as input led to the smallest average difference of M = −0.51 m (SD = 0.63 m). However, since the same pedals in terms of hardware and software were not installed in both simulators, a factor was required to convert the pedal values. This factor was also dependent on the lateral dynamics, so that it was not possible to configure this factor for the u-shaped track and we had to reject this method. Due to the smaller resulting differences for Method 2 compared to Method 1, we used the distance difference as an input for a separate PID controller to do the detail synchronization. In order to enable the PID control of the AV to compensate for the distance difference, the AV’s speed limit of 50 km/h should be maintained until the start of the interaction phase.
For standardized conditions of the interactions, the speed profiles of the AV should be as identical as possible during all encounters within the interaction phase. For this purpose, a further pre-test was carried out in which the detail synchronization was switched off before the interaction phase so that the automated longitudinal guidance could be adjusted to 30 km/h. Again, the three synthetic speed profiles (offensive, neutral, defensive) were used on a straight course, while the distance of the switch-off to the road bottleneck was varied. The longitudinal control needs about 40 m to compensate for a speed difference of 5 km/h to the target speed of 30 km/h. Therefore, the distance of the switch-off was varied in 10 m steps between 80 m and 120 m to the road bottleneck. The start of the interaction phase (distance of 50 m) was used as reference. The mean distance differences with the standard deviation between the AV and implemented manual vehicle to the road bottleneck, respectively, are shown in Table 1.
The earlier the switch-off is performed, the more the mean distance difference, and especially its standard deviation, increases. Thus, an earlier switch-off point leads to a reduction in synchronicity. In contrast, an early switch-off of the detail synchronization leads to a constant speed profile in the interaction phase and thus to a corresponding reproducibility of the AV’s speed profile. At speeds of less than 30 km/h of the AV during detail synchronization, the AV would subsequently accelerate to 30 km/h after switching off the detail synchronization in front of the bottleneck. This could lead to a lack of comprehensibility by the passenger, which in turn could result in passenger intervention. Thus, synchronicity, reproducibility, and comprehensibility must be taken into account when designing the detail synchronization (Figure 4). It is not possible to guarantee the desired interaction scenarios with the human driver by simultaneously fulfilling these three attributes. Therefore, one of the criteria had to be neglected in the design and either a limited synchronicity, a limited reproducibility, or a limited comprehensibility had to be accepted (Figure 4).
For the investigation of the interaction at bottlenecks and possible automation failures, we considered the highest possible synchronicity and reproducibility as most important, so that the vehicles arrive at the bottleneck simultaneously and the AV has the target speed of 30km/h at the beginning of the interaction phase. Low synchronicity or reproducibility could limit the validity of the experimental setting and may lead to many excluded datasets. Therefore, we decided to use a limited comprehensibility. Switching off the detail synchronization 80 m in front of the bottleneck represents the best compromise between synchronicity and reproducibility (Table 1). A final pre-test with two participants and three runs each showed a distance difference of M = −2.6 m (SD = 8.2 m). We considered reaching the 30 km/h before the start of the interaction phase and having a distance difference of less than one vehicle length as a good reproducibility and synchronicity for our approach to use it for our experimental setting.

4.3. Course Design

Figure 5 presents the two course modules (Module I and Module II) we used in our study from the bird’s eye view including the navigation details which supported both participants as they passed through the respective module on the intended route. Each participant drives through an individually designed urban route consisting of different streets and intersections. Since the participants are separated by a row of houses during entry into and exit from the module, they encounter each other only once per module at the road bottleneck. The size of the modules results in an average transit time of five minutes per module. The basic and detail synchronization occurs in the area around the bottleneck. The straight section on which the interaction takes place is 300 m long. Each traffic light of basic synchronization is 250 m apart of the bottleneck. The access to the interaction section consists of a slight bend so that the participants are not able to see each other while waiting at the respective traffic lights. For the manual vehicle, the speed limit at the interaction section was set to 30 km/h directly after the corresponding traffic light. The 30 km/h speed limit of the AV was set 50 m in front of the bottleneck. On the remaining course the speed limit was 50 km/h.

5. Multi-Vehicle Study

5.1. Sample

Twenty-six participants took part in this study resulting in 13 participant pairs. The participants were comprised of 31% women and 69% men. The mean age of the participants was M = 27.50 years with a standard deviation of SD = 8.99 years. They possessed their driver’s license for M = 10.08 years (SD = 8.93 years) and evaluated their previous knowledge of automated driving on a 5-point Likert scale from “very low” to “very high” with a median of 4 (= high). A statistical evaluation showed no differences between automated and manual vehicle groups. The requirement for participation in this experiment was a valid driver’s license.

5.2. Experimental Design

The multi-vehicle study consisted of a 2 (message) × 2 (bottleneck type) repeated measures design. The first factor message (within-subject) represented the AV’s intention. It contained the factor levels AV yields the right of way and AV insists on the right of way. The second factor bottleneck type (within-subject) consisted of the levels bottleneck narrowed on both sides and bottleneck narrowed on one side. Additionally, we implemented an automation failure where the AV first communicated to yield the right of way at a bottleneck narrowed only on the AV’s side. Thirty meters in front of the bottleneck the AV failed to detect the oncoming human driver. Therefore, it stopped communicating by switching off the eHMI and started to pass through the bottleneck despite the oncoming human driver. Each participant pair experienced the Use Cases 1-4 once in a permuted order followed by Use Case 5 with the automation failure at the end of the experimental drive (Table 2).

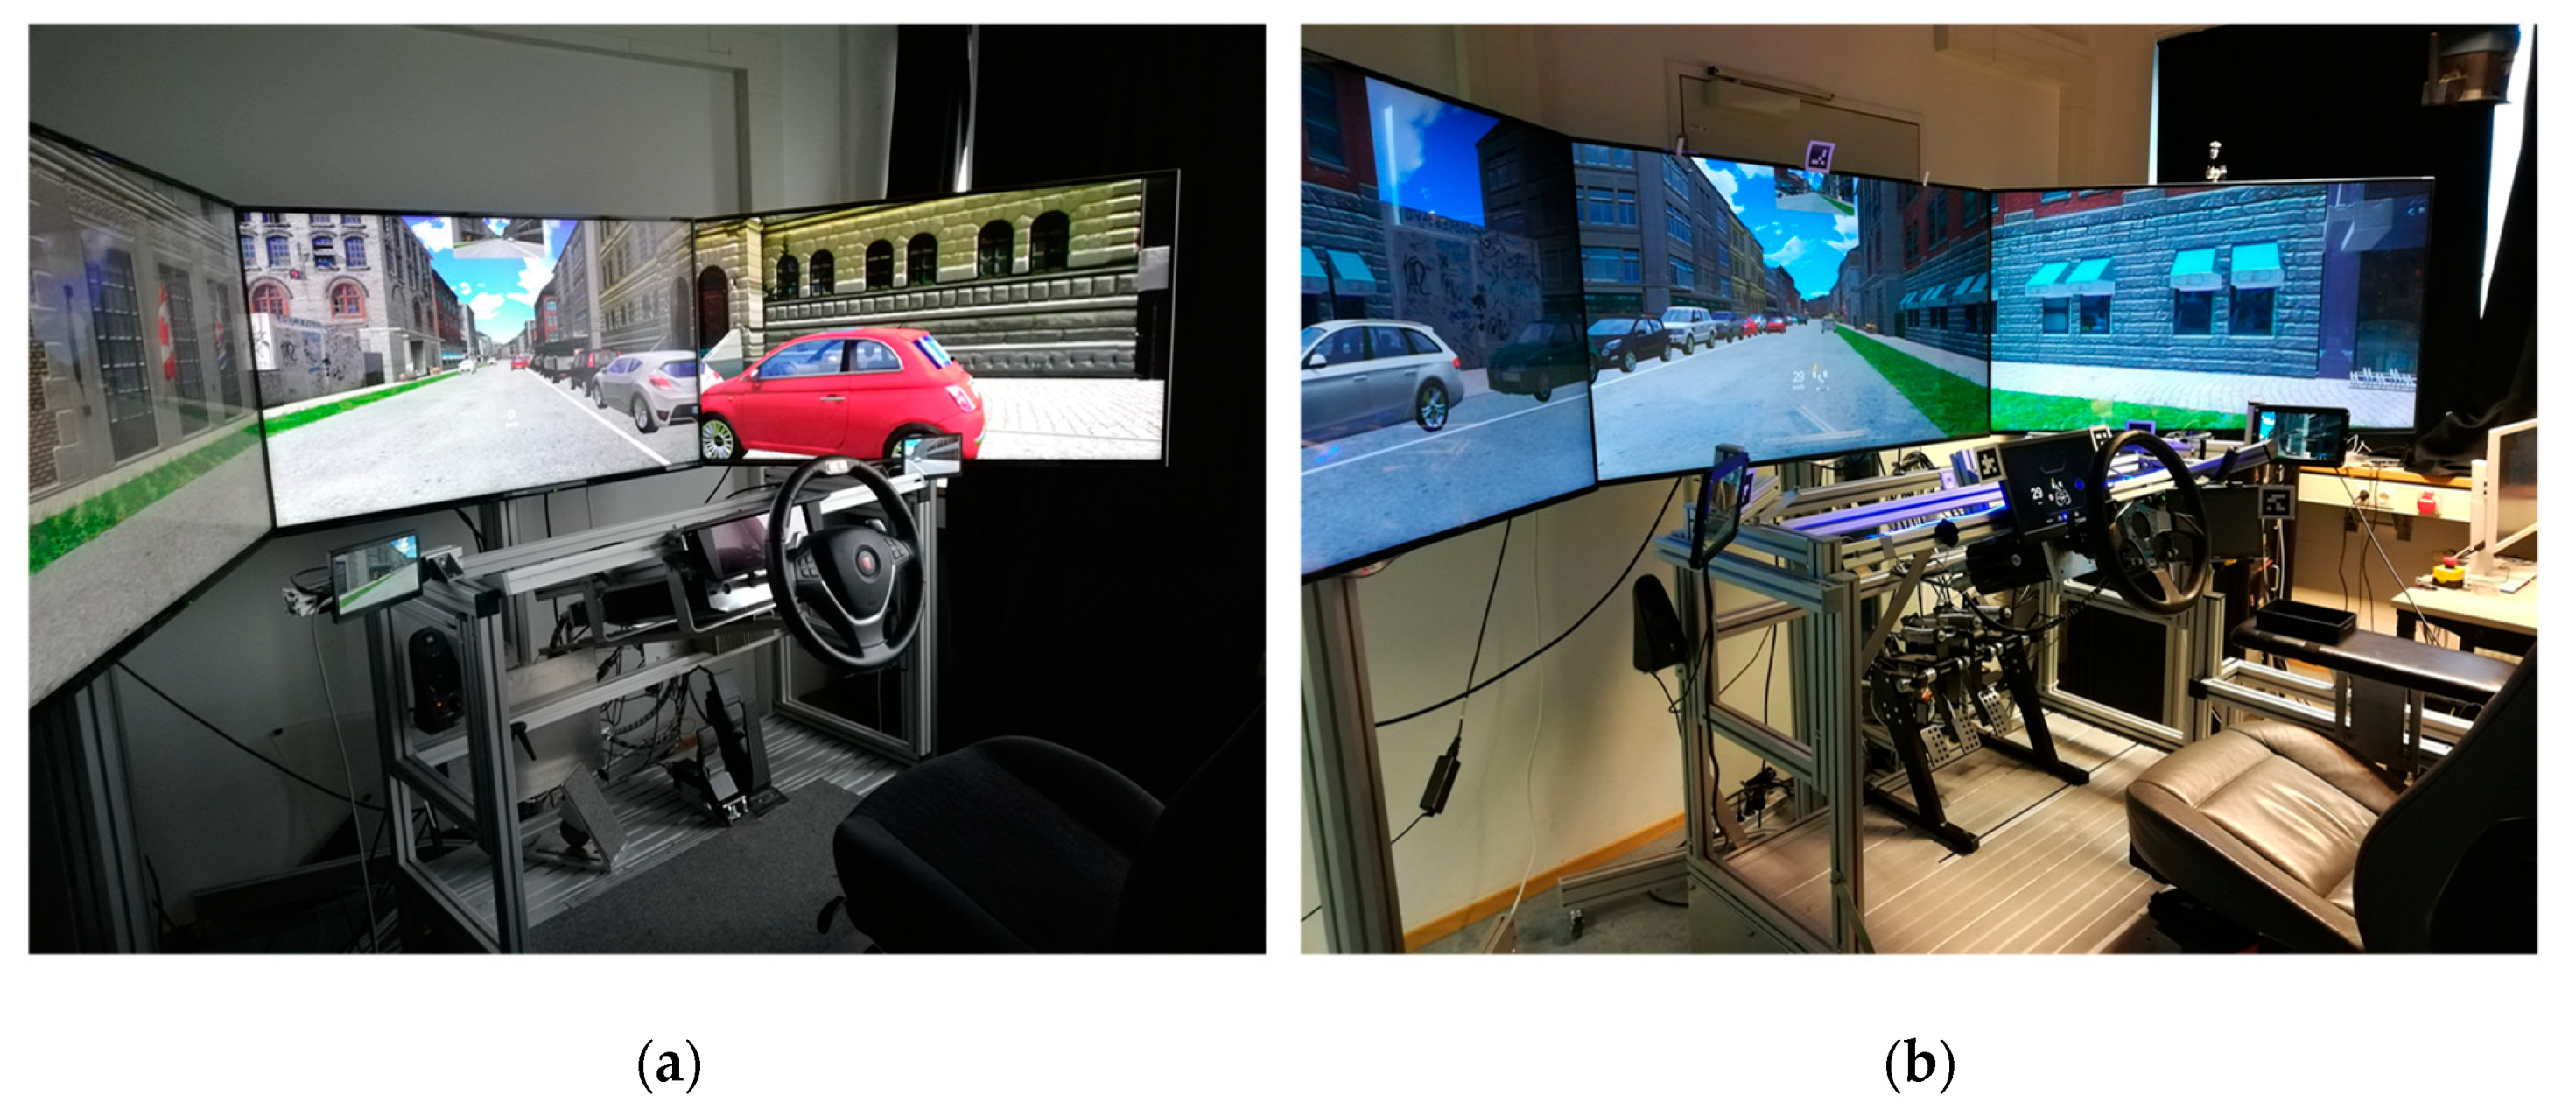
5.3. Driving Simulators

The study took place in the two modular driving simulators at the Chair of Ergonomics of the Technical University of Munich (Figure 6). Both simulators offer a 120° horizontal field of view on three 55-inch screens with Ultra-HD resolution. While the rearview mirror is integrated in the view of the middle screen, two additional displays visualize the side mirrors. An additional display behind the steering wheel serves as a freely programmable instrument cluster (IC). In the AV setup, an LED-strip was positioned where the bottom of the windshield would be. In addition, the AV setup was equipped with a motion platform. Four D-BOX actuators generated pitch and roll movements, which provided participants with improved feedback about the behavior of the AV. Sound systems in both simulators generated engine and environmental sounds. We used the driving simulation software SILAB 6.0 from the Würzburg Institute of Traffic Sciences [32]. A data collection rate of 240 Hz and a refresh rate of 60 Hz was used. The partially automated driving system of the AV had to be activated by a button on the steering wheel. The automated driving system could be deactivated at any time using the same button or by braking, accelerating, or steering. The simulators are located in different rooms and were networked via LAN cable.

5.4. HMI Design

5.4.1. Human–Machine Interface of the Manual Vehicle

We used an instrument cluster (IC) and head-up display (HUD) for the HMI of the manual vehicle. Both HMI elements presented navigation and speed information. No other information, such as from driver assistance systems, was implemented in the manual vehicle’s HMI.

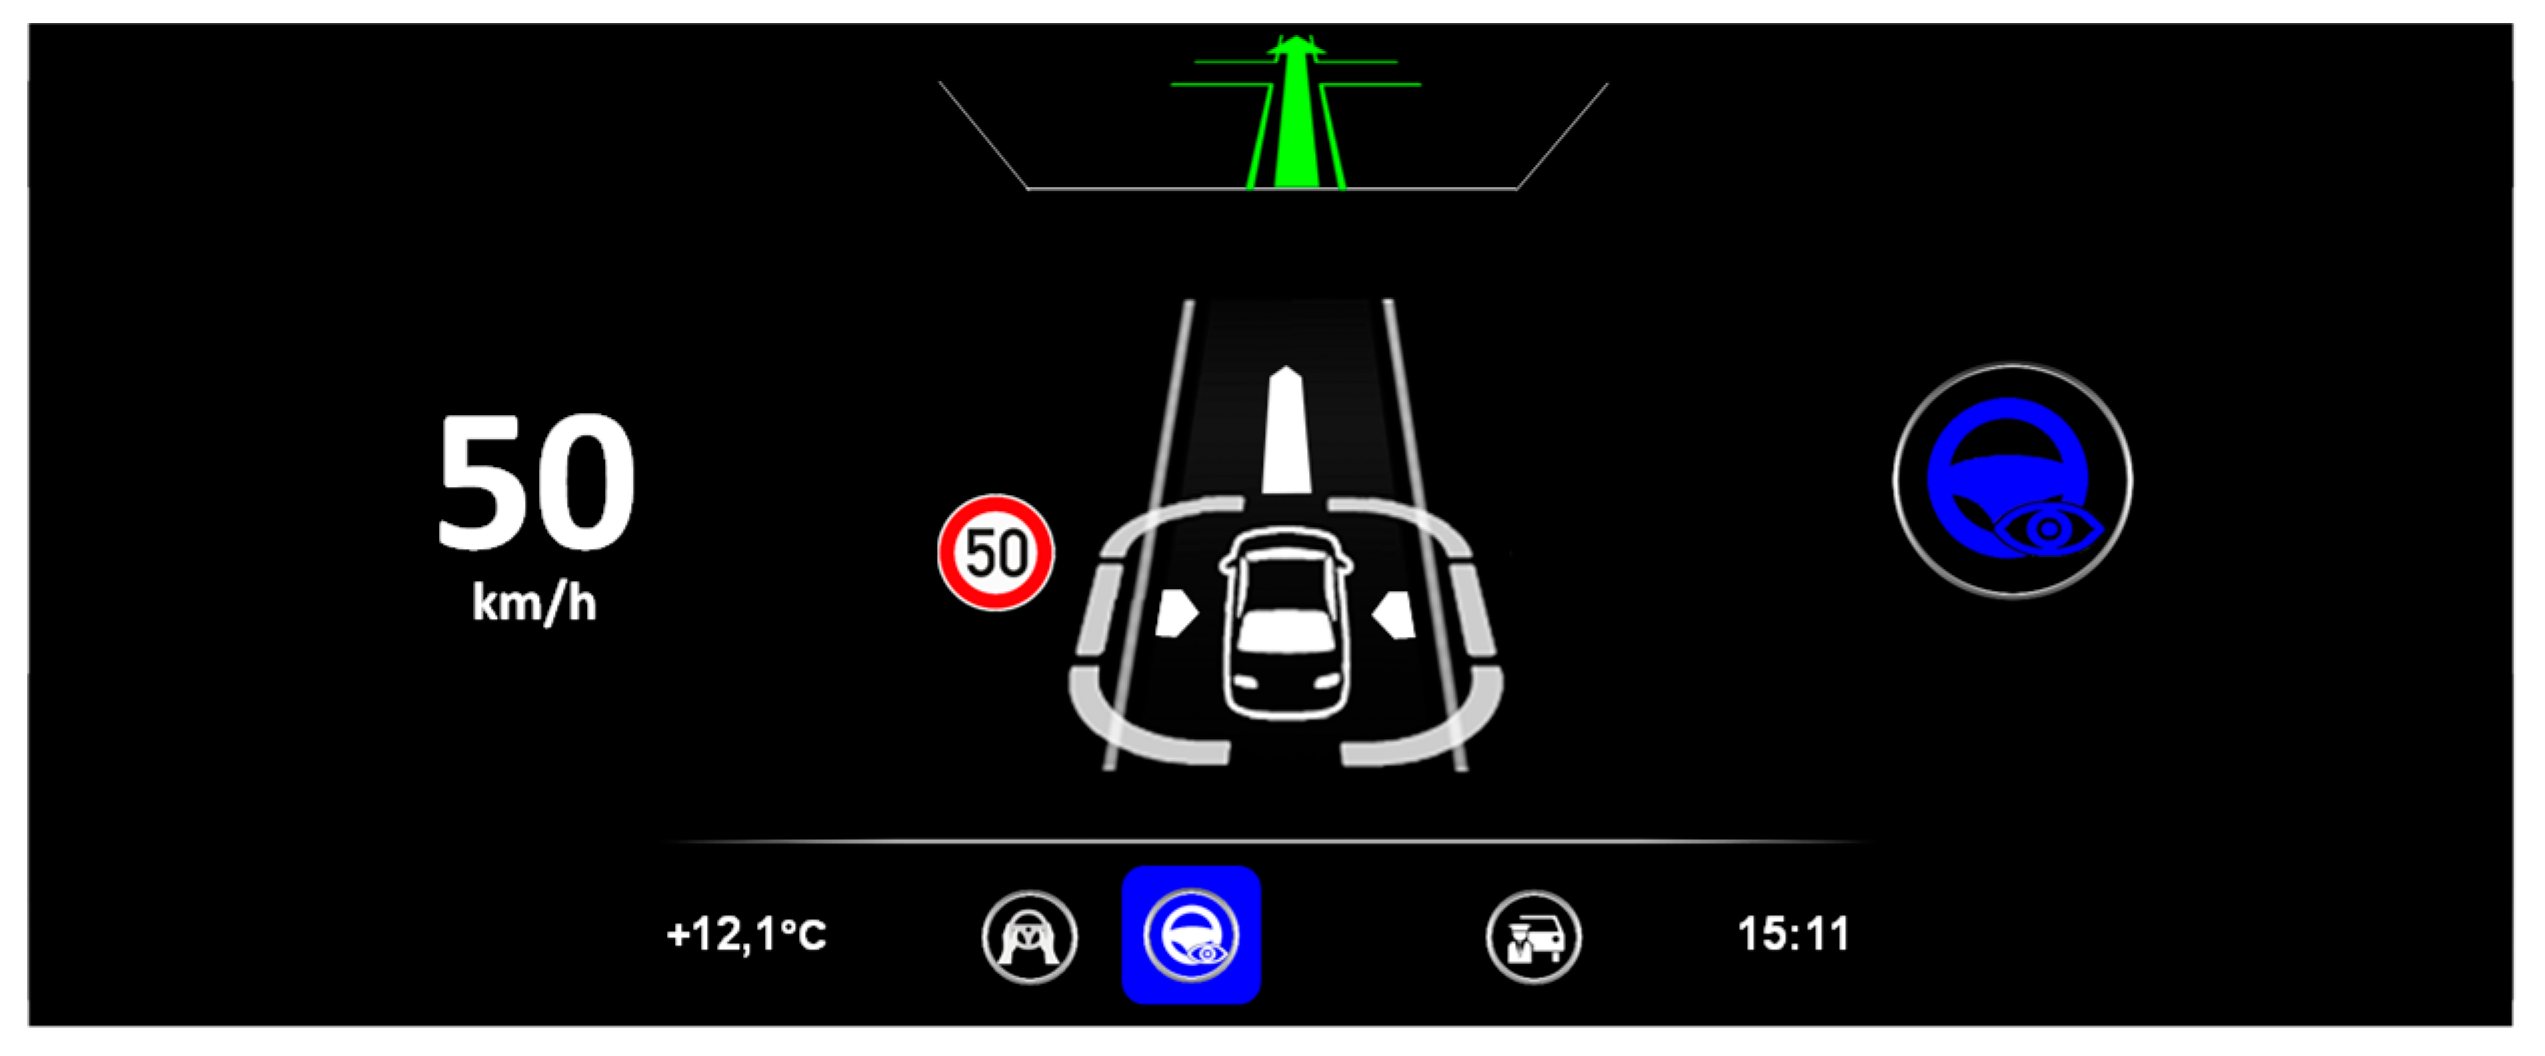
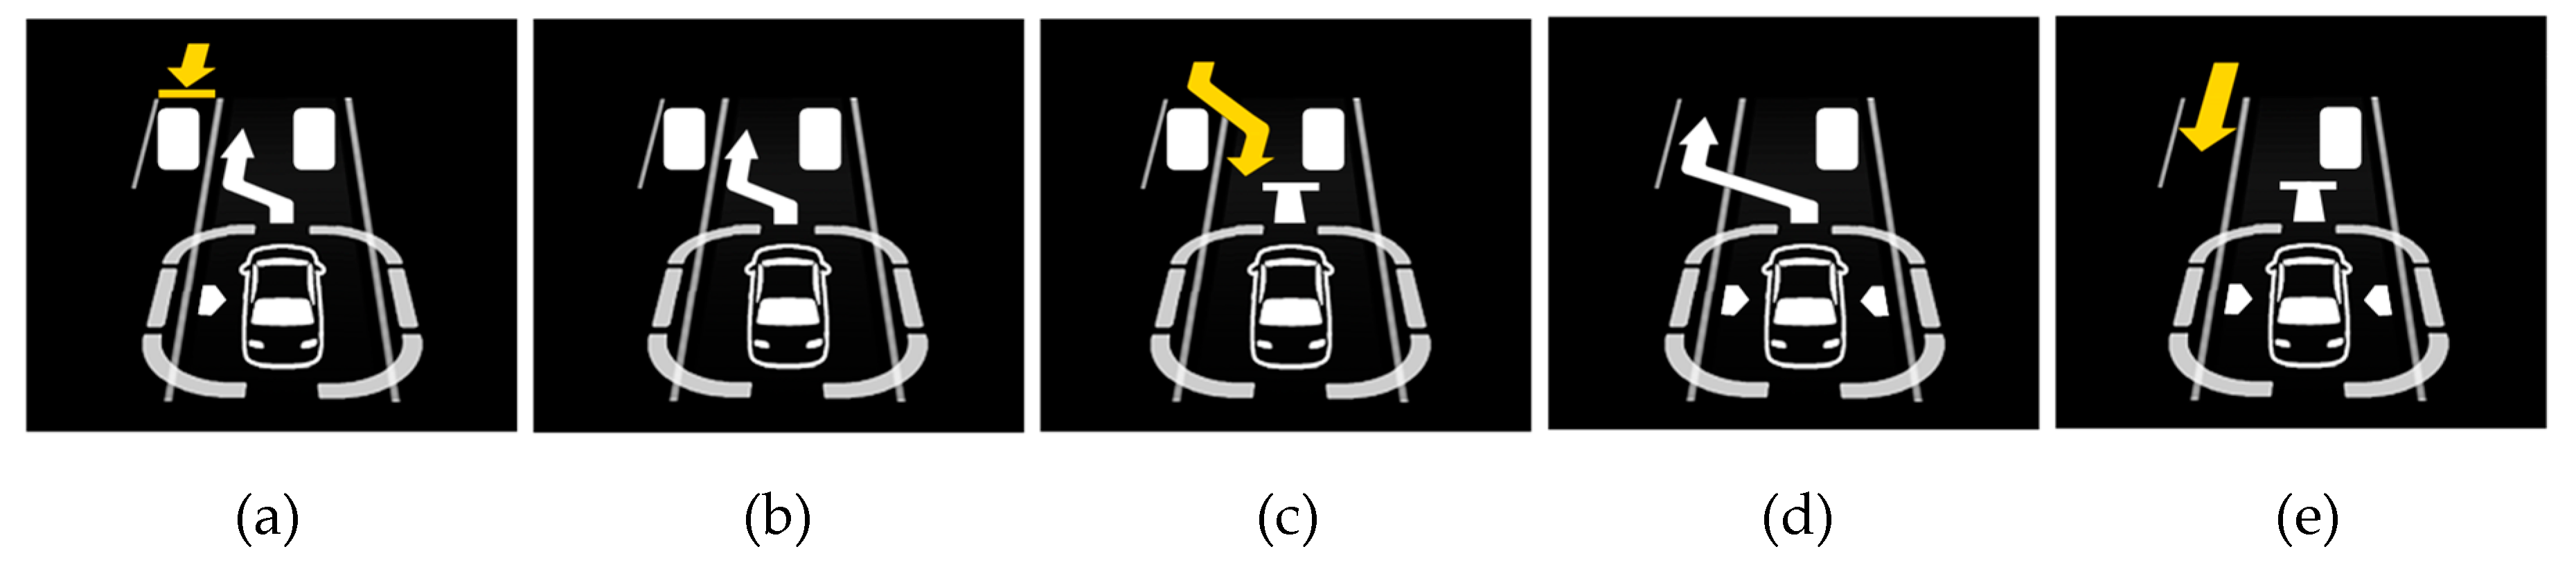
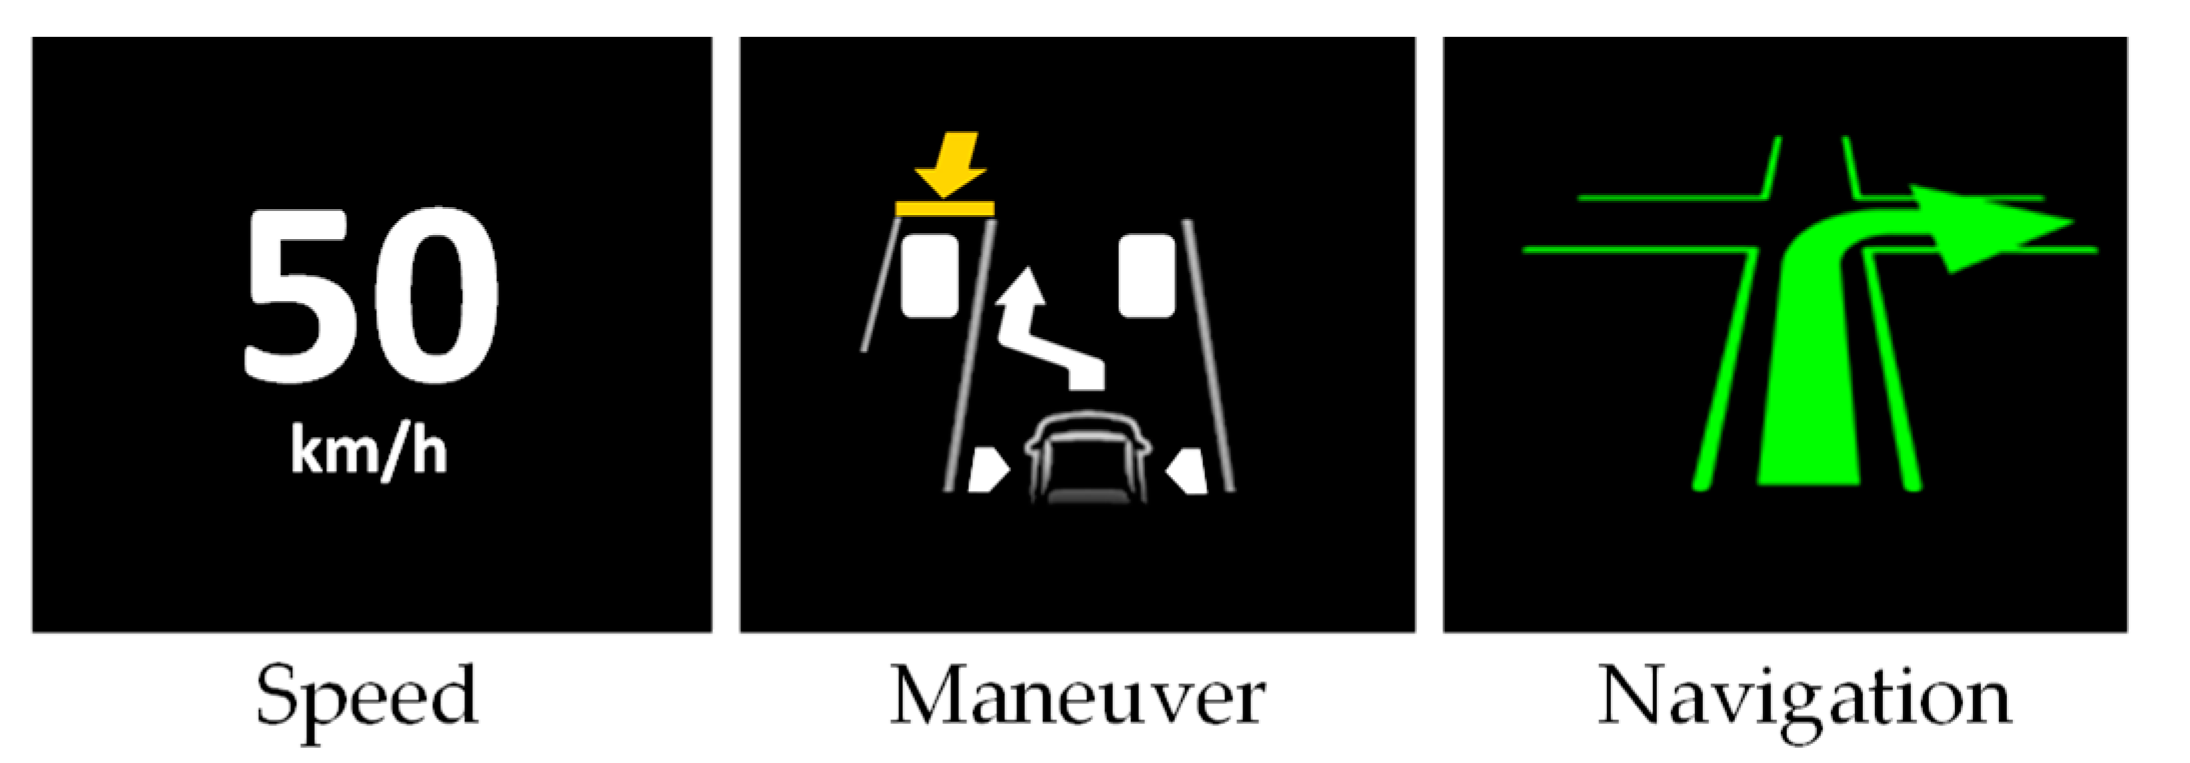
5.4.2. Automation Human–Machine Interface

The aHMI [4] consisted of an instrument cluster (IC), a head-up display (HUD), and an LED strip. The aHMI should provide information about current and planned maneuvers in addition to the system status to the passenger when monitoring a partial automated driving system [33,34,35]. The LED-strip was mounted at the bottom of the windshield since this is an often used position in the context of automated driving [35,36,37,38,39]. When the ADS was available, the LED-strip illuminated white and after activation, the LED-strip illuminated blue [40]. For displaying the current and planned maneuver, the IC and HUD were used. The IC display (Figure 7) has been further modified from the adaptive concept of Feierle, Bücherl, Hecht, and Bengler [41]. The current speed is displayed on the left part of the IC, while the system status is displayed on the right and at the bottom as part of an automation scale. Central to the display is the indication of the planned and current maneuvers of the vehicle as well as the traffic sign recognition. Above this, as an extension of the road, is the navigation display. The visualization of the maneuvers regarding the investigated bottleneck scenarios depending on the oncoming traffic, are shown in Figure 8.
The HUD is based on the concept of Feierle, Beller, and Bengler [42]. The display (Figure 9) is divided into three sections. Speed information is located at the left section, system status, and driving maneuvers are shown in the middle section, and the right section shows the navigation information.

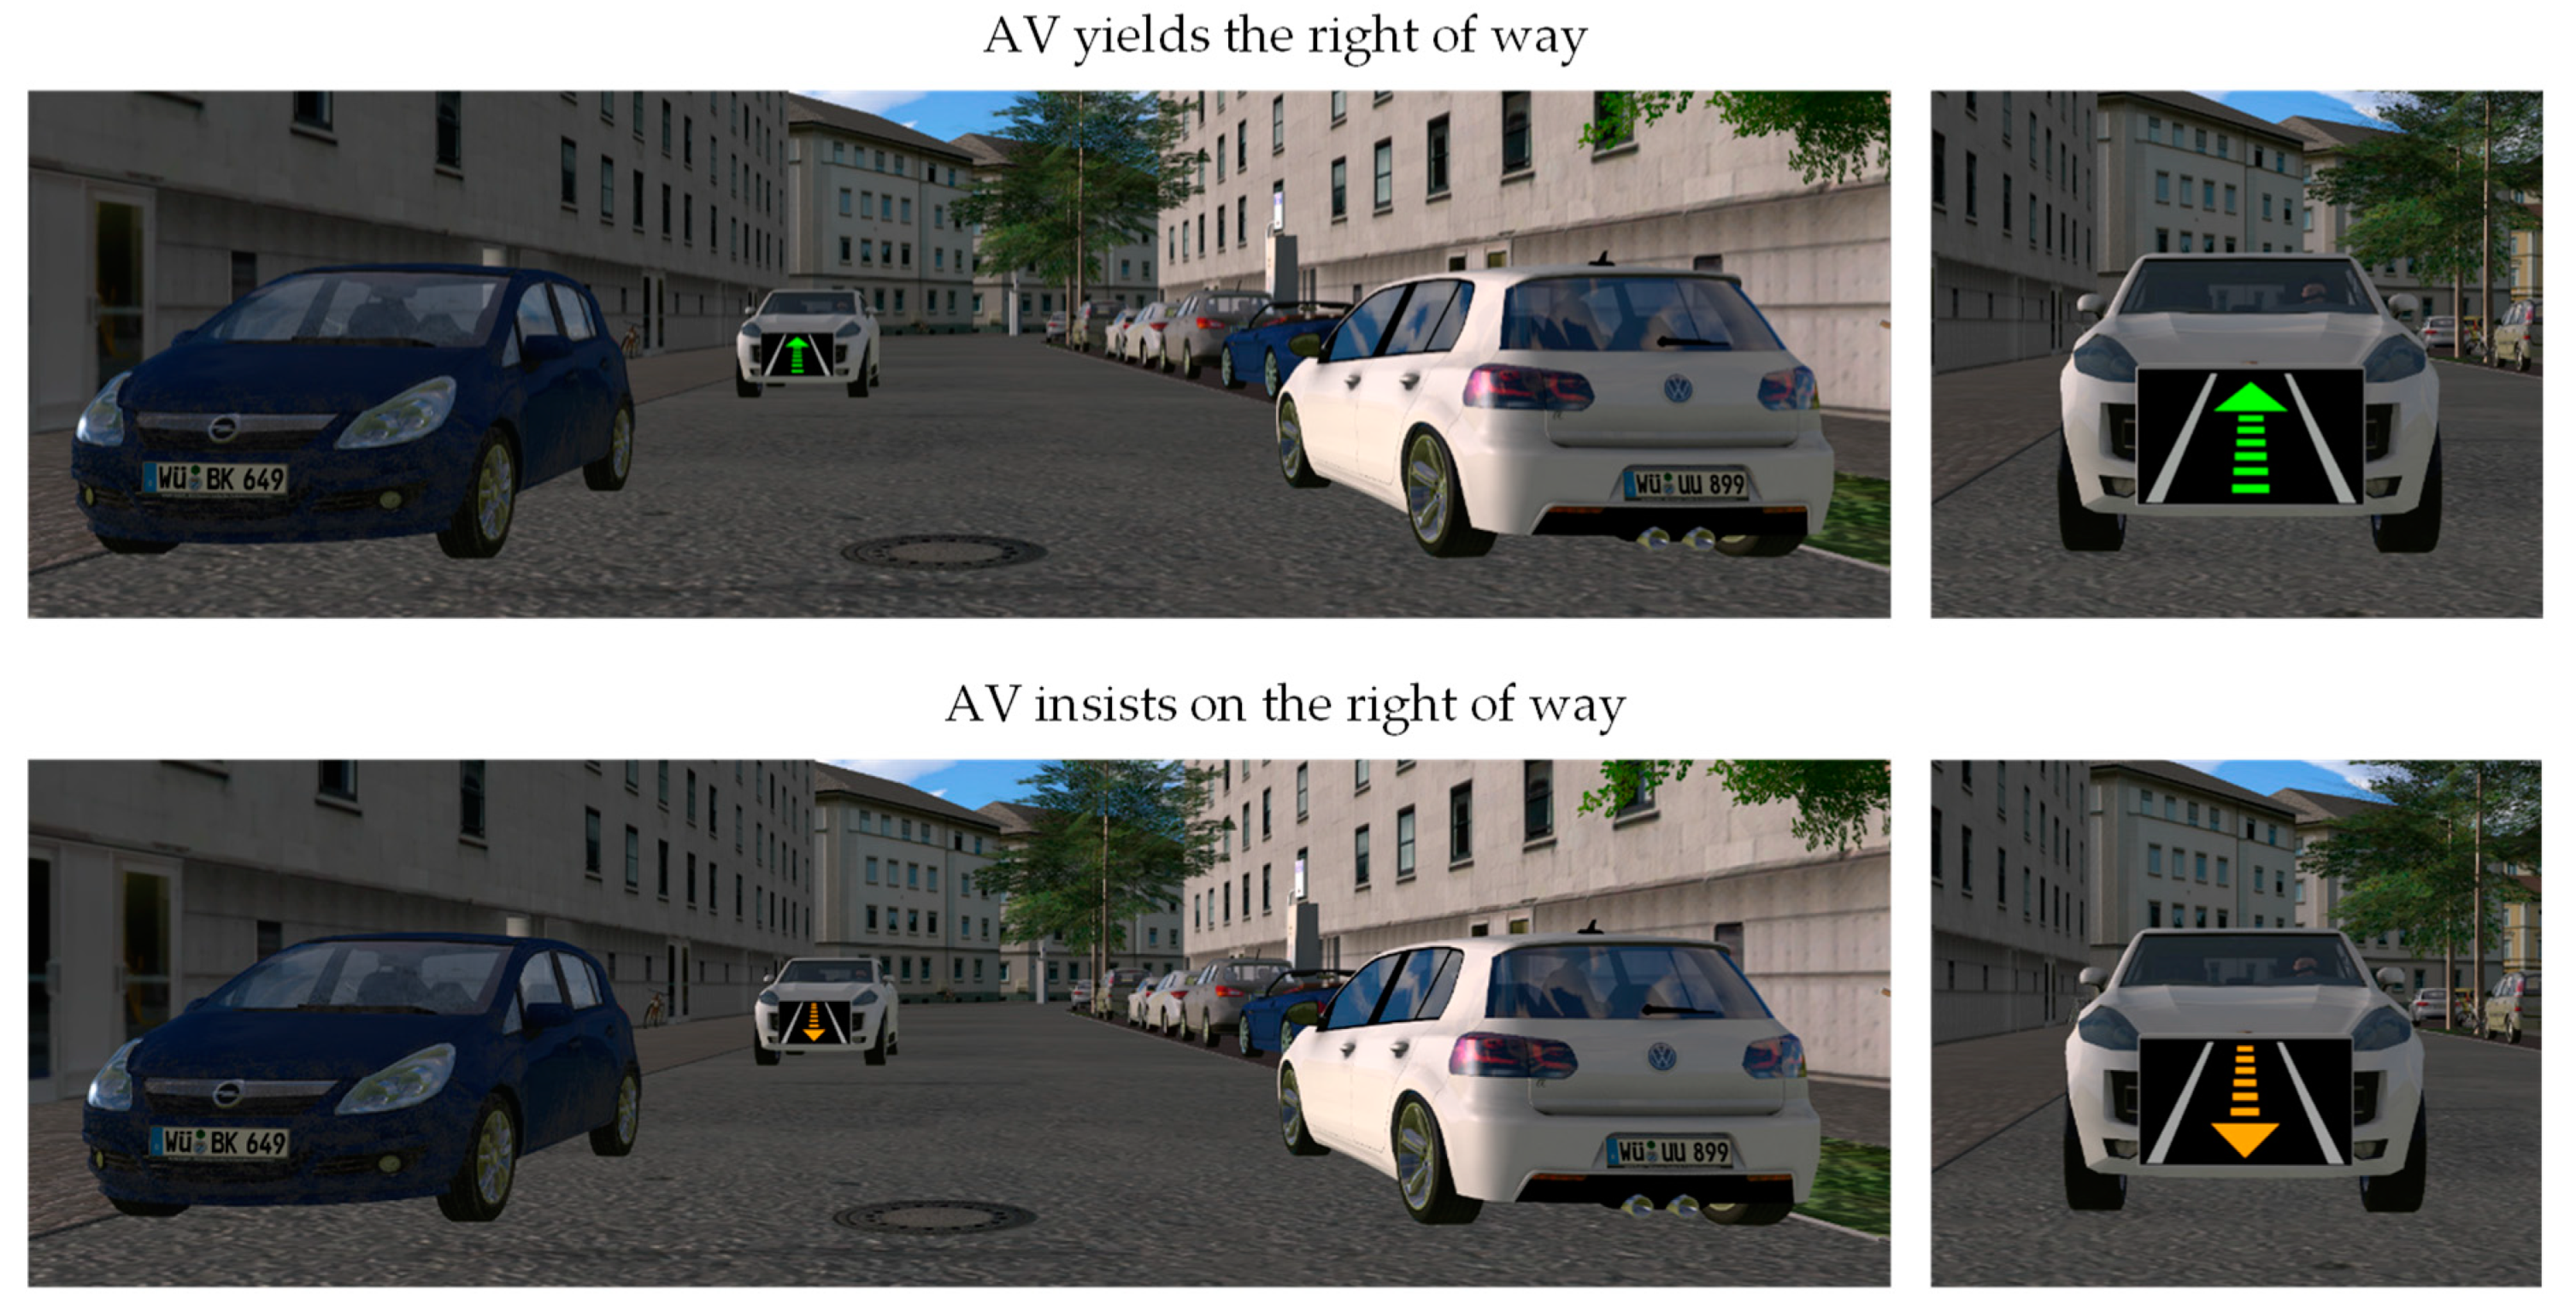
5.4.3. External Human–Machine Interface

The eHMI [4] consisted of a display mounted at the front of the vehicle, since its message is visible for the human driver, especially for long distances like in the road bottleneck scenario [6]. The design of the eHMI (Figure 10) was developed by Rettenmaier et al. [30]. The eHMI uses an arrow to indicate which negotiation partner can pass through the bottleneck first. With the green arrow the AV communicates to yield the right of way to the human driver. The orange arrow indicates that the AV insists on the right of way. Both arrows are animated with a frequency of 1 Hz building up in the direction the bottleneck may be passed through first. Additionally, with the arrows the eHMI design includes the contour of the road represented by two gray lines [30].

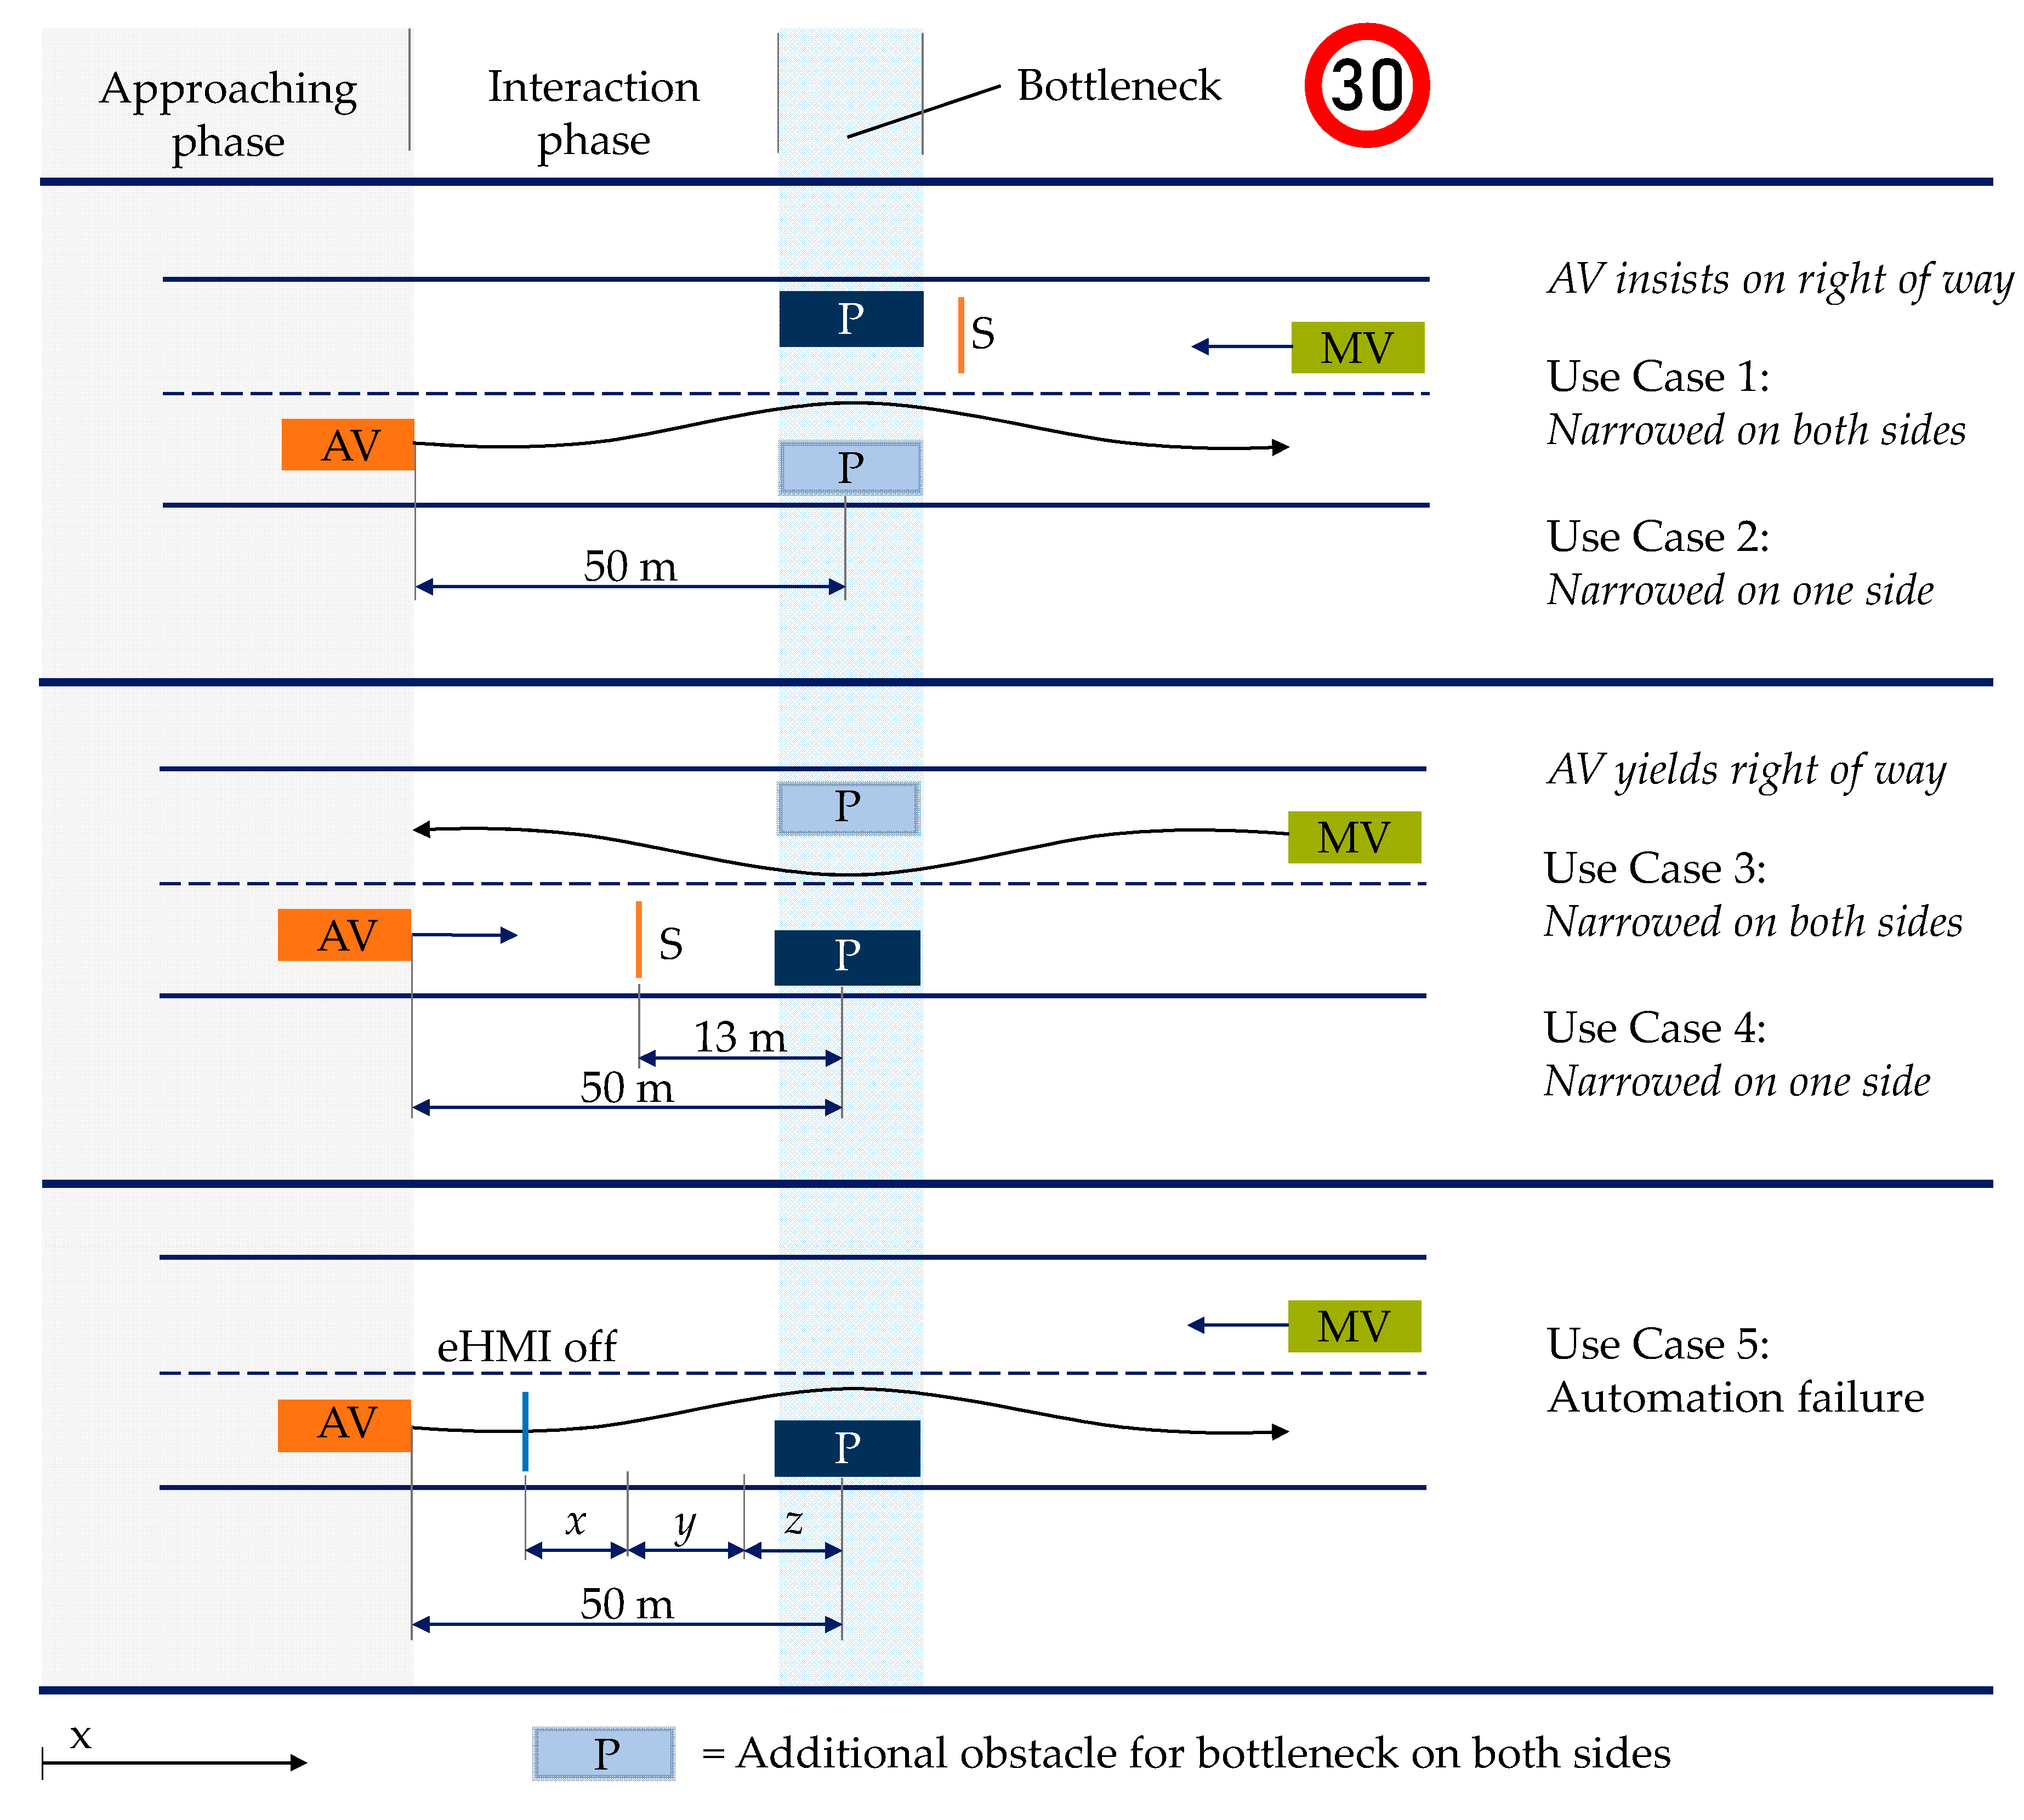
5.5. Experimental Track and Bottleneck Scenarios

The experimental track consisted of a route network in an urban area with several intersections and connecting roads. The scenario examined in the study is the road bottleneck scenario composed of the simultaneous encounter of a human driver and an AV approaching from the opposite direction. The scenario varies the bottleneck type and the right of way. Figure 11 presents the five resulting Use Cases the participants passed through during the experimental drive. The scenario is subdivided into the approaching phase in which both participants approach the bottleneck until the start of the interaction phases starting 50 m in front of the bottleneck. In the interaction phase the AV switches on its eHMI and it starts communicating to yield the right of way or to insist on it. If the AV yielded the right of way it stopped (S) 13 m in front of the obstacle. In Use Case 1 and Use Case 3 the bottleneck was constricted on both sides of the road due to two double-parked vehicles. In Use Case 2 and Use Case 4 there was only one obstacle, either on the human driver’s side of the road or in the AV’s lane. Use Case 5 represents the implemented automation failure when the AV first communicates to yield the right of way at the bottleneck narrowed on one side. Then the AV changes the strategy 30 m in front of the bottleneck and demonstrates insisting on the right of way. The 30 m results from adding the travel distance within a one second reaction time (x = 8.33 m), the braking distance with a deceleration of −2 m/s2 (y = 17.35 m), and the stopping distance to the middle of the bottleneck (z = 4 m). After oncoming traffic is initially detected, the AV changes the communication strategy by switching off the eHMI due to losing the detection of the oncoming human driver during the passage. The speed limit in the interaction phase was set to 30 km/h for both participants.

5.6. Procedure

During the experiment there were two experimenters, one for each participant. Welcoming and introducing the participants was conducted separately by the experimenters to avoid the influence of gender effects, sympathy/antipathy, or social similarity between the participants. After reading the safety instructions and the participant information the participants consented to the experiment. Subsequently, the participants filled in a demographic questionnaire including the age, gender, experience with automated driving, and the possession of their driver’s license. Afterwards the participants received the instruction. The participants acting as the human drivers in the simulation were instructed about manual driving with navigation instructions and were informed that there would be interactions with an AV. Moreover, the human drivers were also made aware of the presence of another human in the AV in the simulation. The AV’s passengers were instructed about partially automated driving, its capacities, and about the obligation of monitoring the driving scene. Additionally, the AV’s passengers also received information about the presence of a human driver in the same simulation, since this awareness could positively affect the willingness to cooperate [21].
Subsequently, both participants completed an introductory drive (duration: 10 min) in the multi-vehicle simulation. The human drivers had the opportunity to familiarize themselves with the simulator’s driving behavior and the navigation information. The AV’s passengers got acquainted with the driving automation including the oversteering of the same. Afterwards, the experimental drive (duration: 25 min) was conducted consisting of passing through the Use Cases 1–4 in a permuted order followed by the experience of the automation failure in Use Case 5. The experiment concluded by both participants filling out a questionnaire and having an oral interview referring to the automation failure they experienced.

5.7. Measures and Analysis

We used the differences in distance and in time to arrival (TTA) of the two simulated vehicles to the bottleneck to assess the synchronicity and the driving profiles resulting from the methodology. Both metrics were calculated once the first of the two vehicles reached the interaction phase. For this purpose, six of the 65 possible encounters had to be discarded due to the intervention of participants in the AV before reaching the interaction phase.
To determine traffic efficiency and safety, we excluded the data of three participant pairs due to technical issues within the interaction phase. The traffic efficiency was operationalized by means of participants’ passing times. This metric was defined as the time that elapsed from the manual driver’s entrance to the interaction phase (50 m in front of the bottleneck) until passing the AV 15 m behind the bottleneck. The crash rate was used to assess the controllability of the automation failure. Additionally, as a further metric the time to collision (TTC) was calculated when the passenger of the AV took over control of the vehicle guidance. Based on the small sample size in multi-vehicle simulation and the large difference in sample size compared to single driver simulations, we refrained from a statistical evaluation and we descriptively analyzed the data.

6. Results

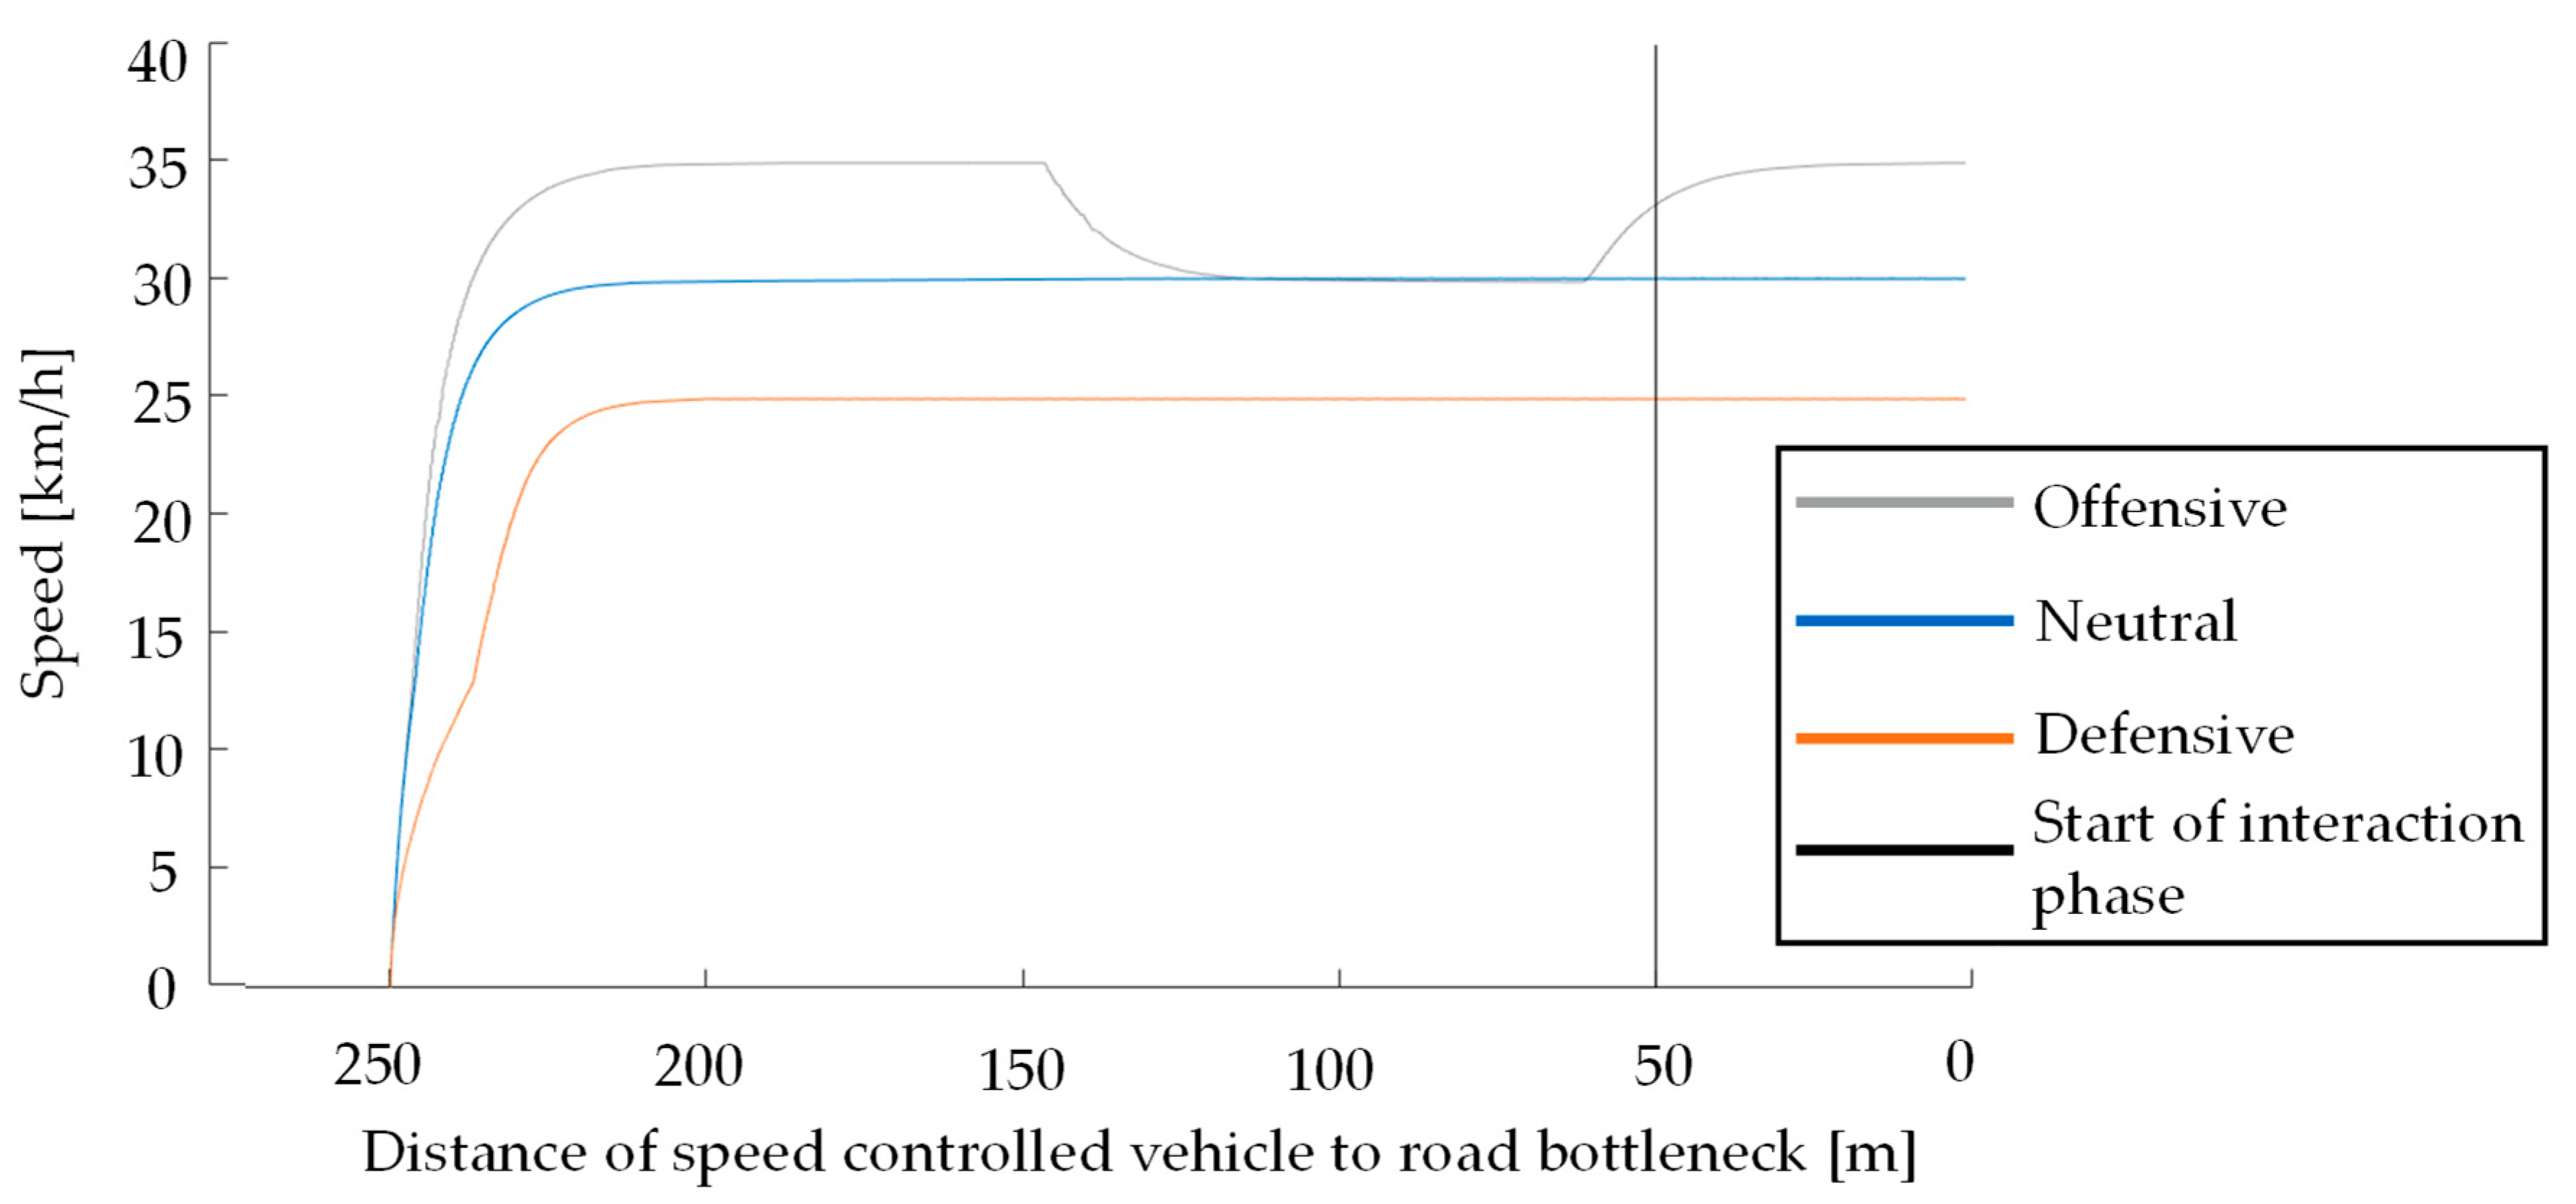
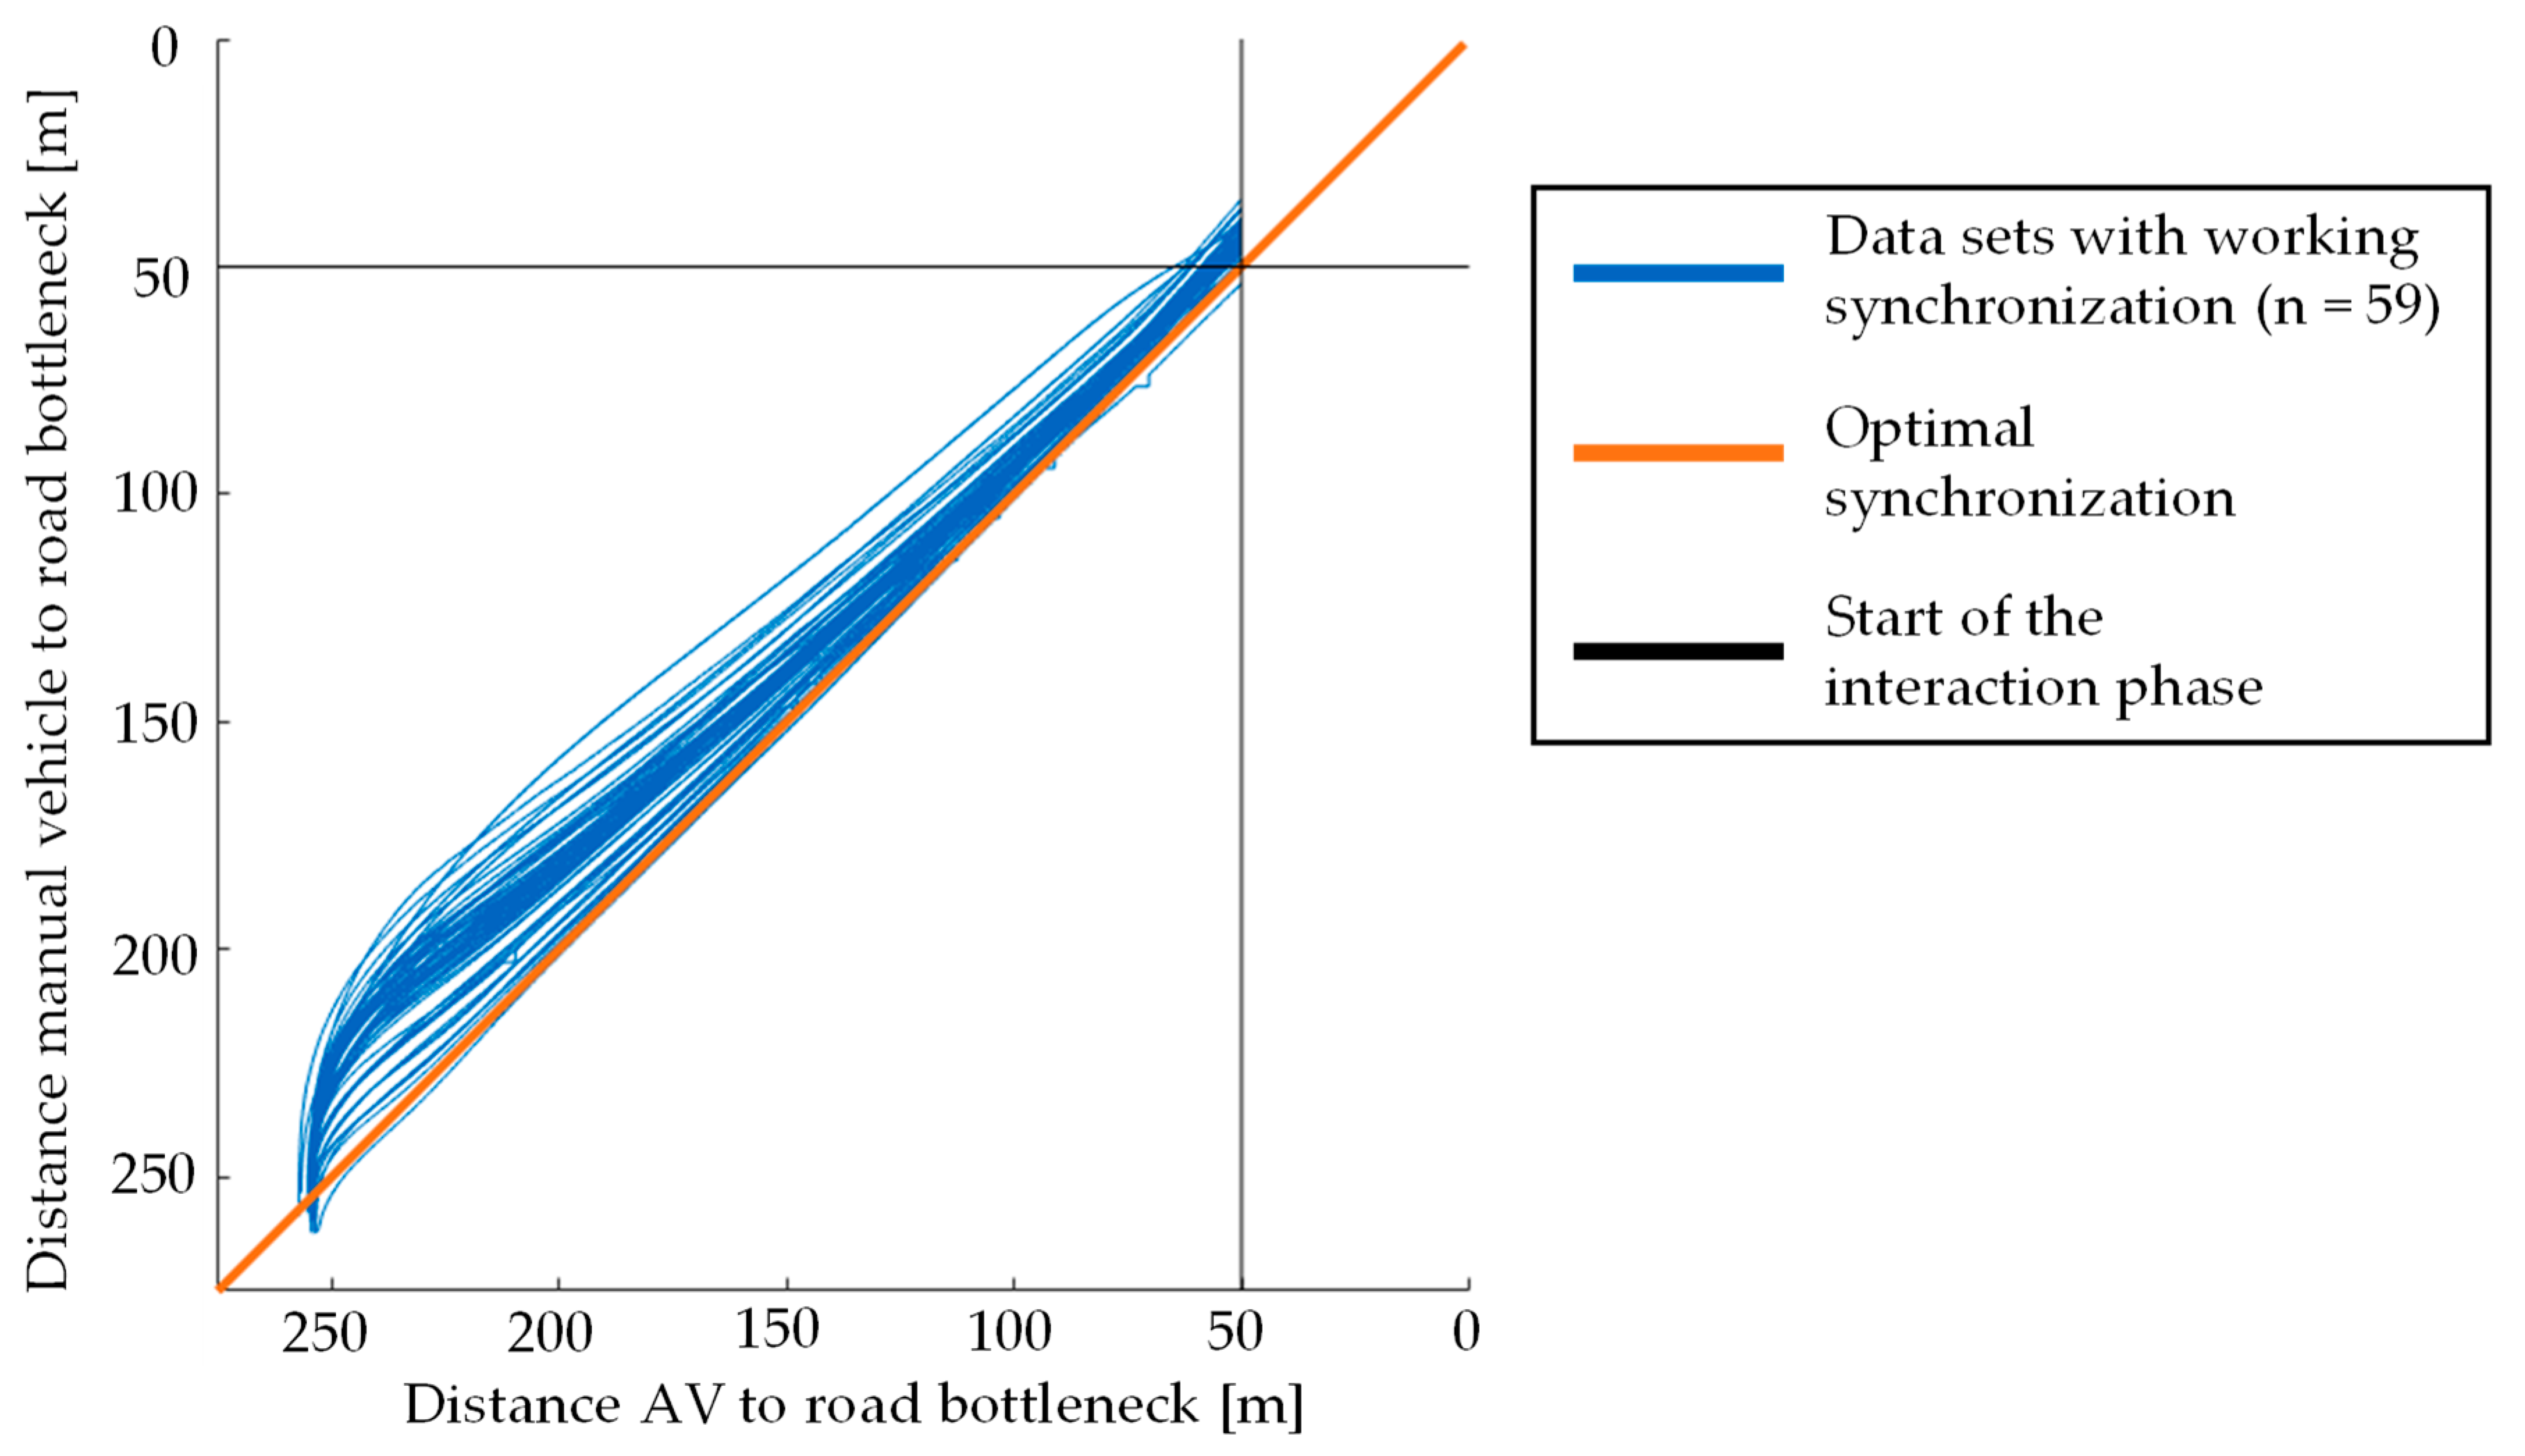
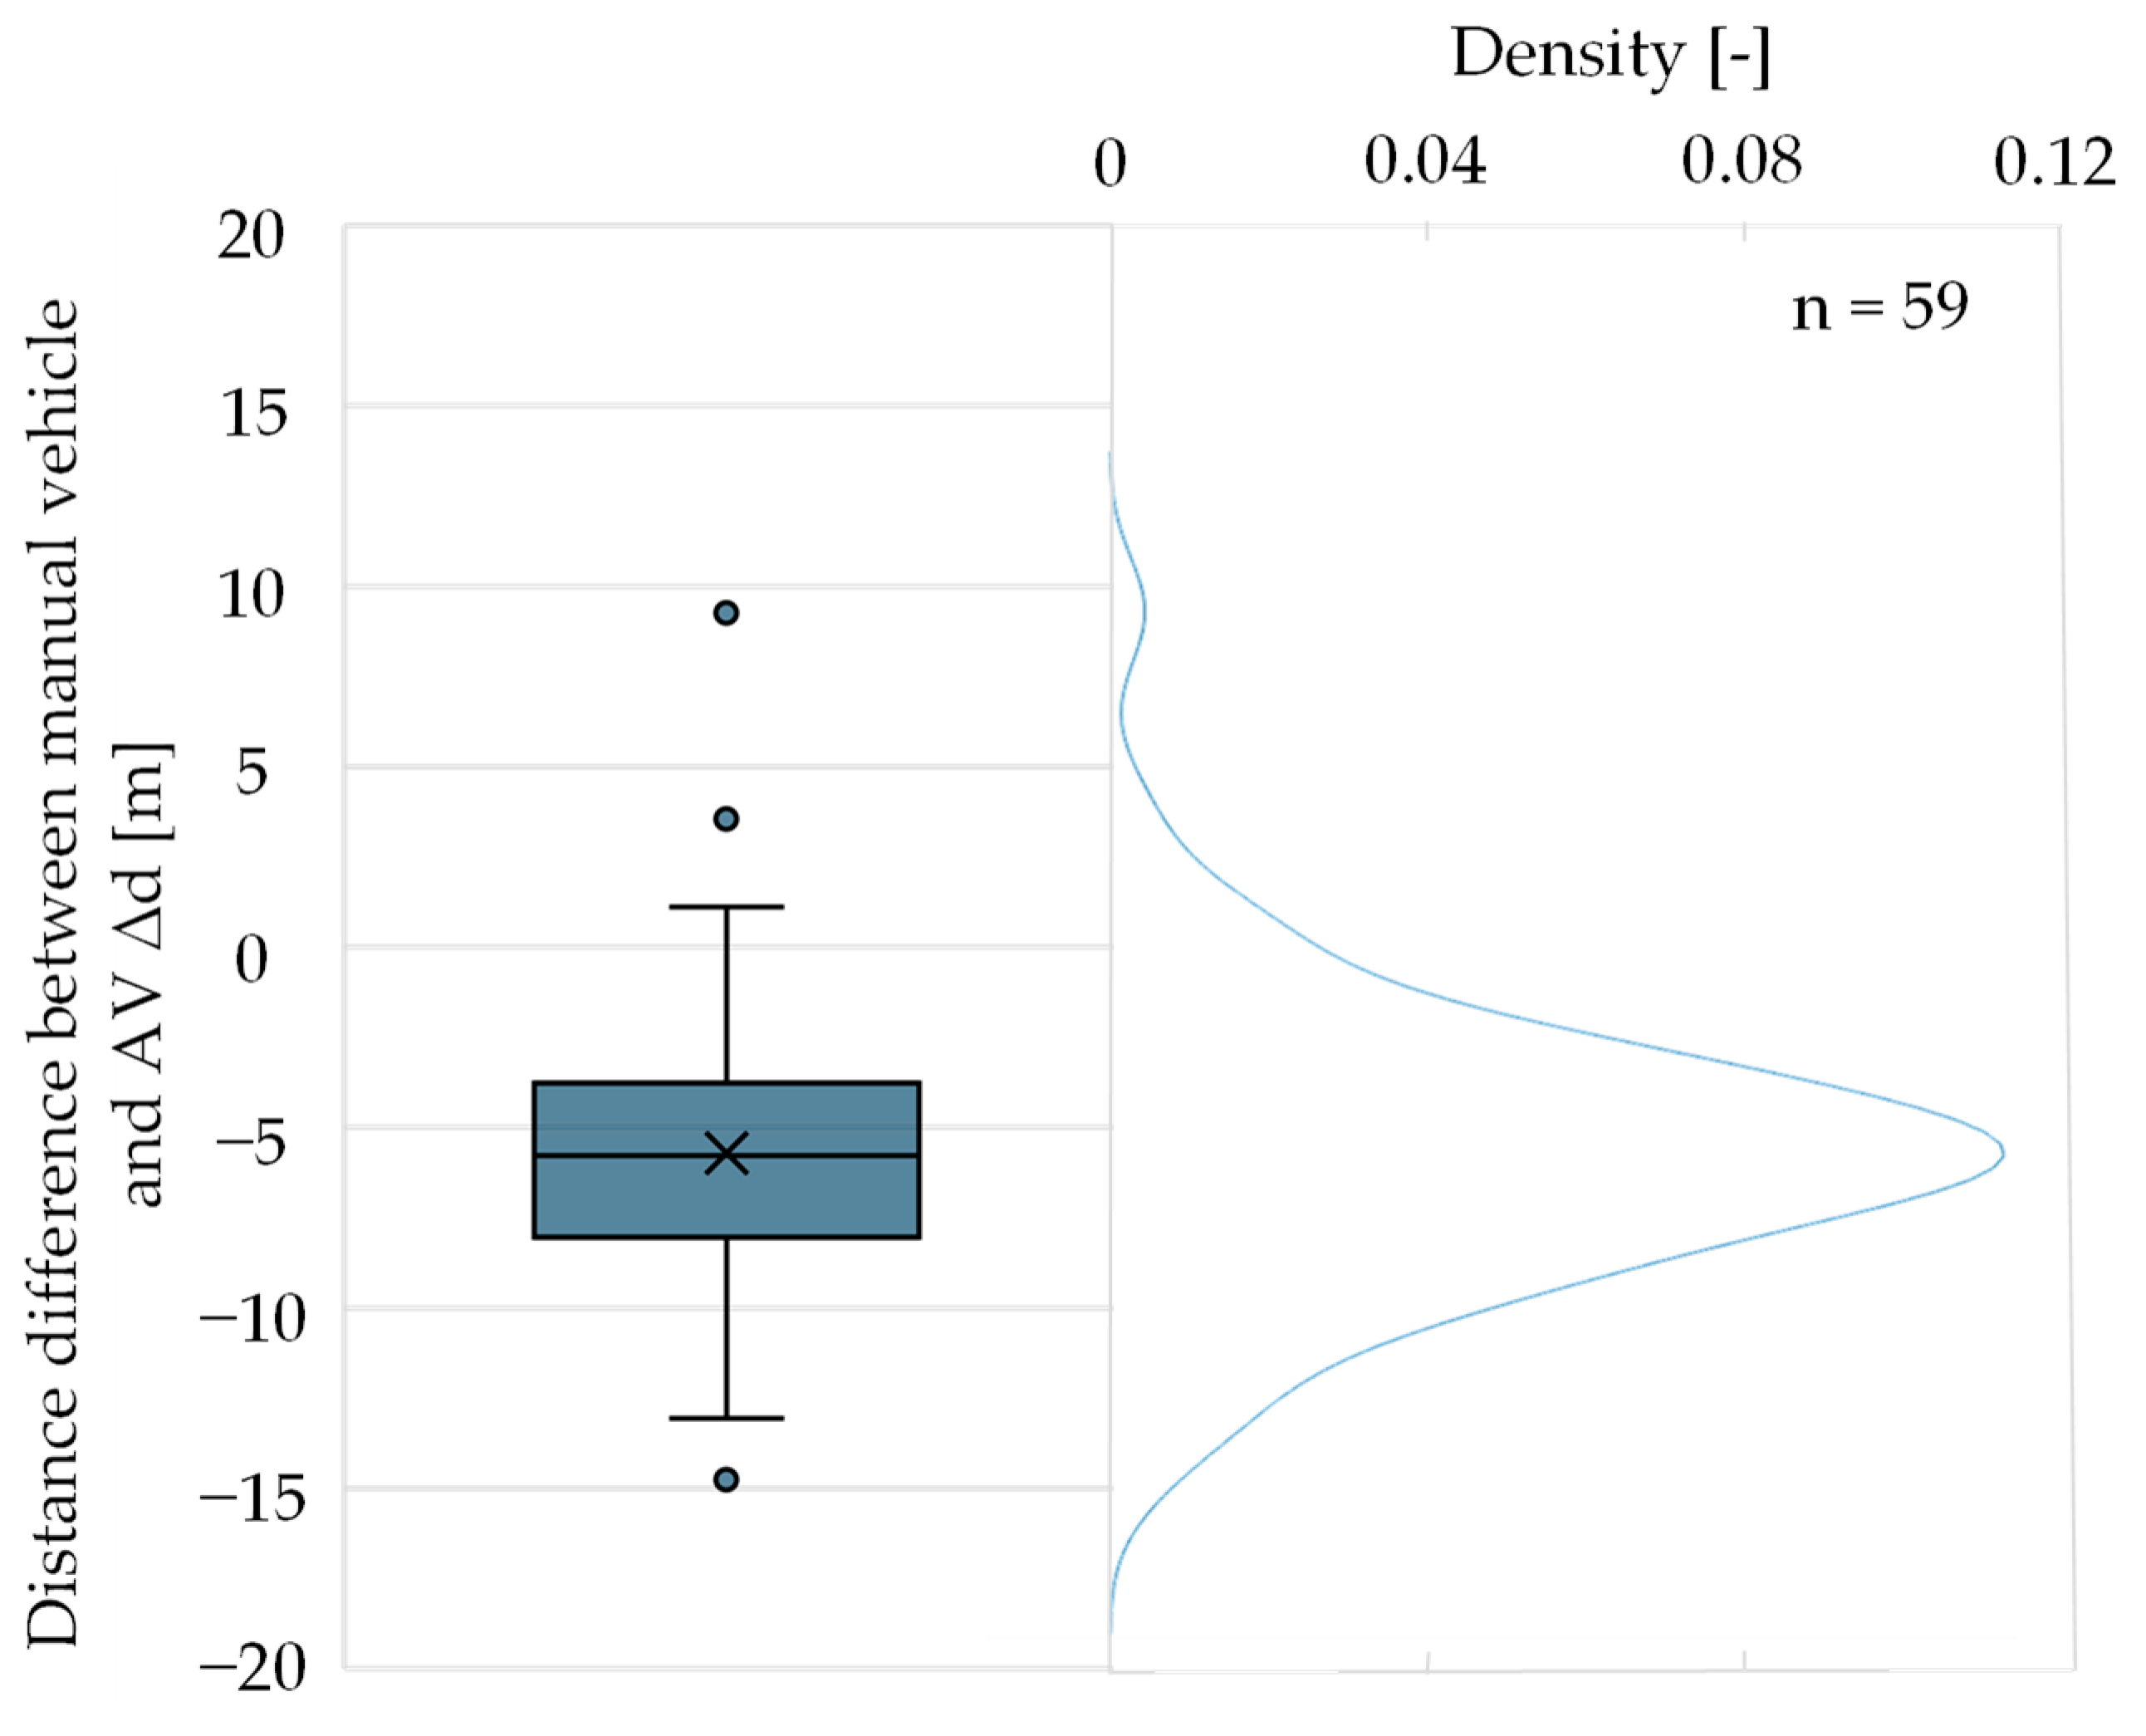
6.1. Technical Implementation

Figure 12 shows the distances of the manual vehicles and AVs to the bottleneck (blue line) as a result of the distance control. The angle bisector (orange line) represents the distances for an ideal synchronization, if the implemented control does not result in any delay. It can be seen that both vehicles start at different distances from the bottleneck after the traffic light turns green. At the beginning the manual vehicles approach the bottleneck faster than the AVs, resulting in a vertical rise in the curves. Therefore, the distance control results in an offset as the initial accelerations of the human drivers cannot be compensated for quickly enough. The maximum deviations occur between 250 m and 200 m. From 200 m to the bottleneck, the control is more successful in compensating for the difference in distance, which brings the curves closer to ideal synchronicity again, whereby in some cases an offset remains until 80 m before the bottleneck. The deviation increases again directly before the interaction phase. This may be due to the switch of the synchronization mode to the longitudinal control independent of the human drivers’ behavior. In most cases, the manual vehicle reaches the interaction phase first since the human drivers show higher speed than 30 km/h in most cases.
The differences in distance (Δd) (Figure 13) result in M = –5.70 m (SD = 4.06 m) which corresponds to a difference in TTA of M = –0.34 s (SD = 1.10 s). A negative difference in distance and TTA mean an earlier arrival of the manual vehicle at the interaction phase.

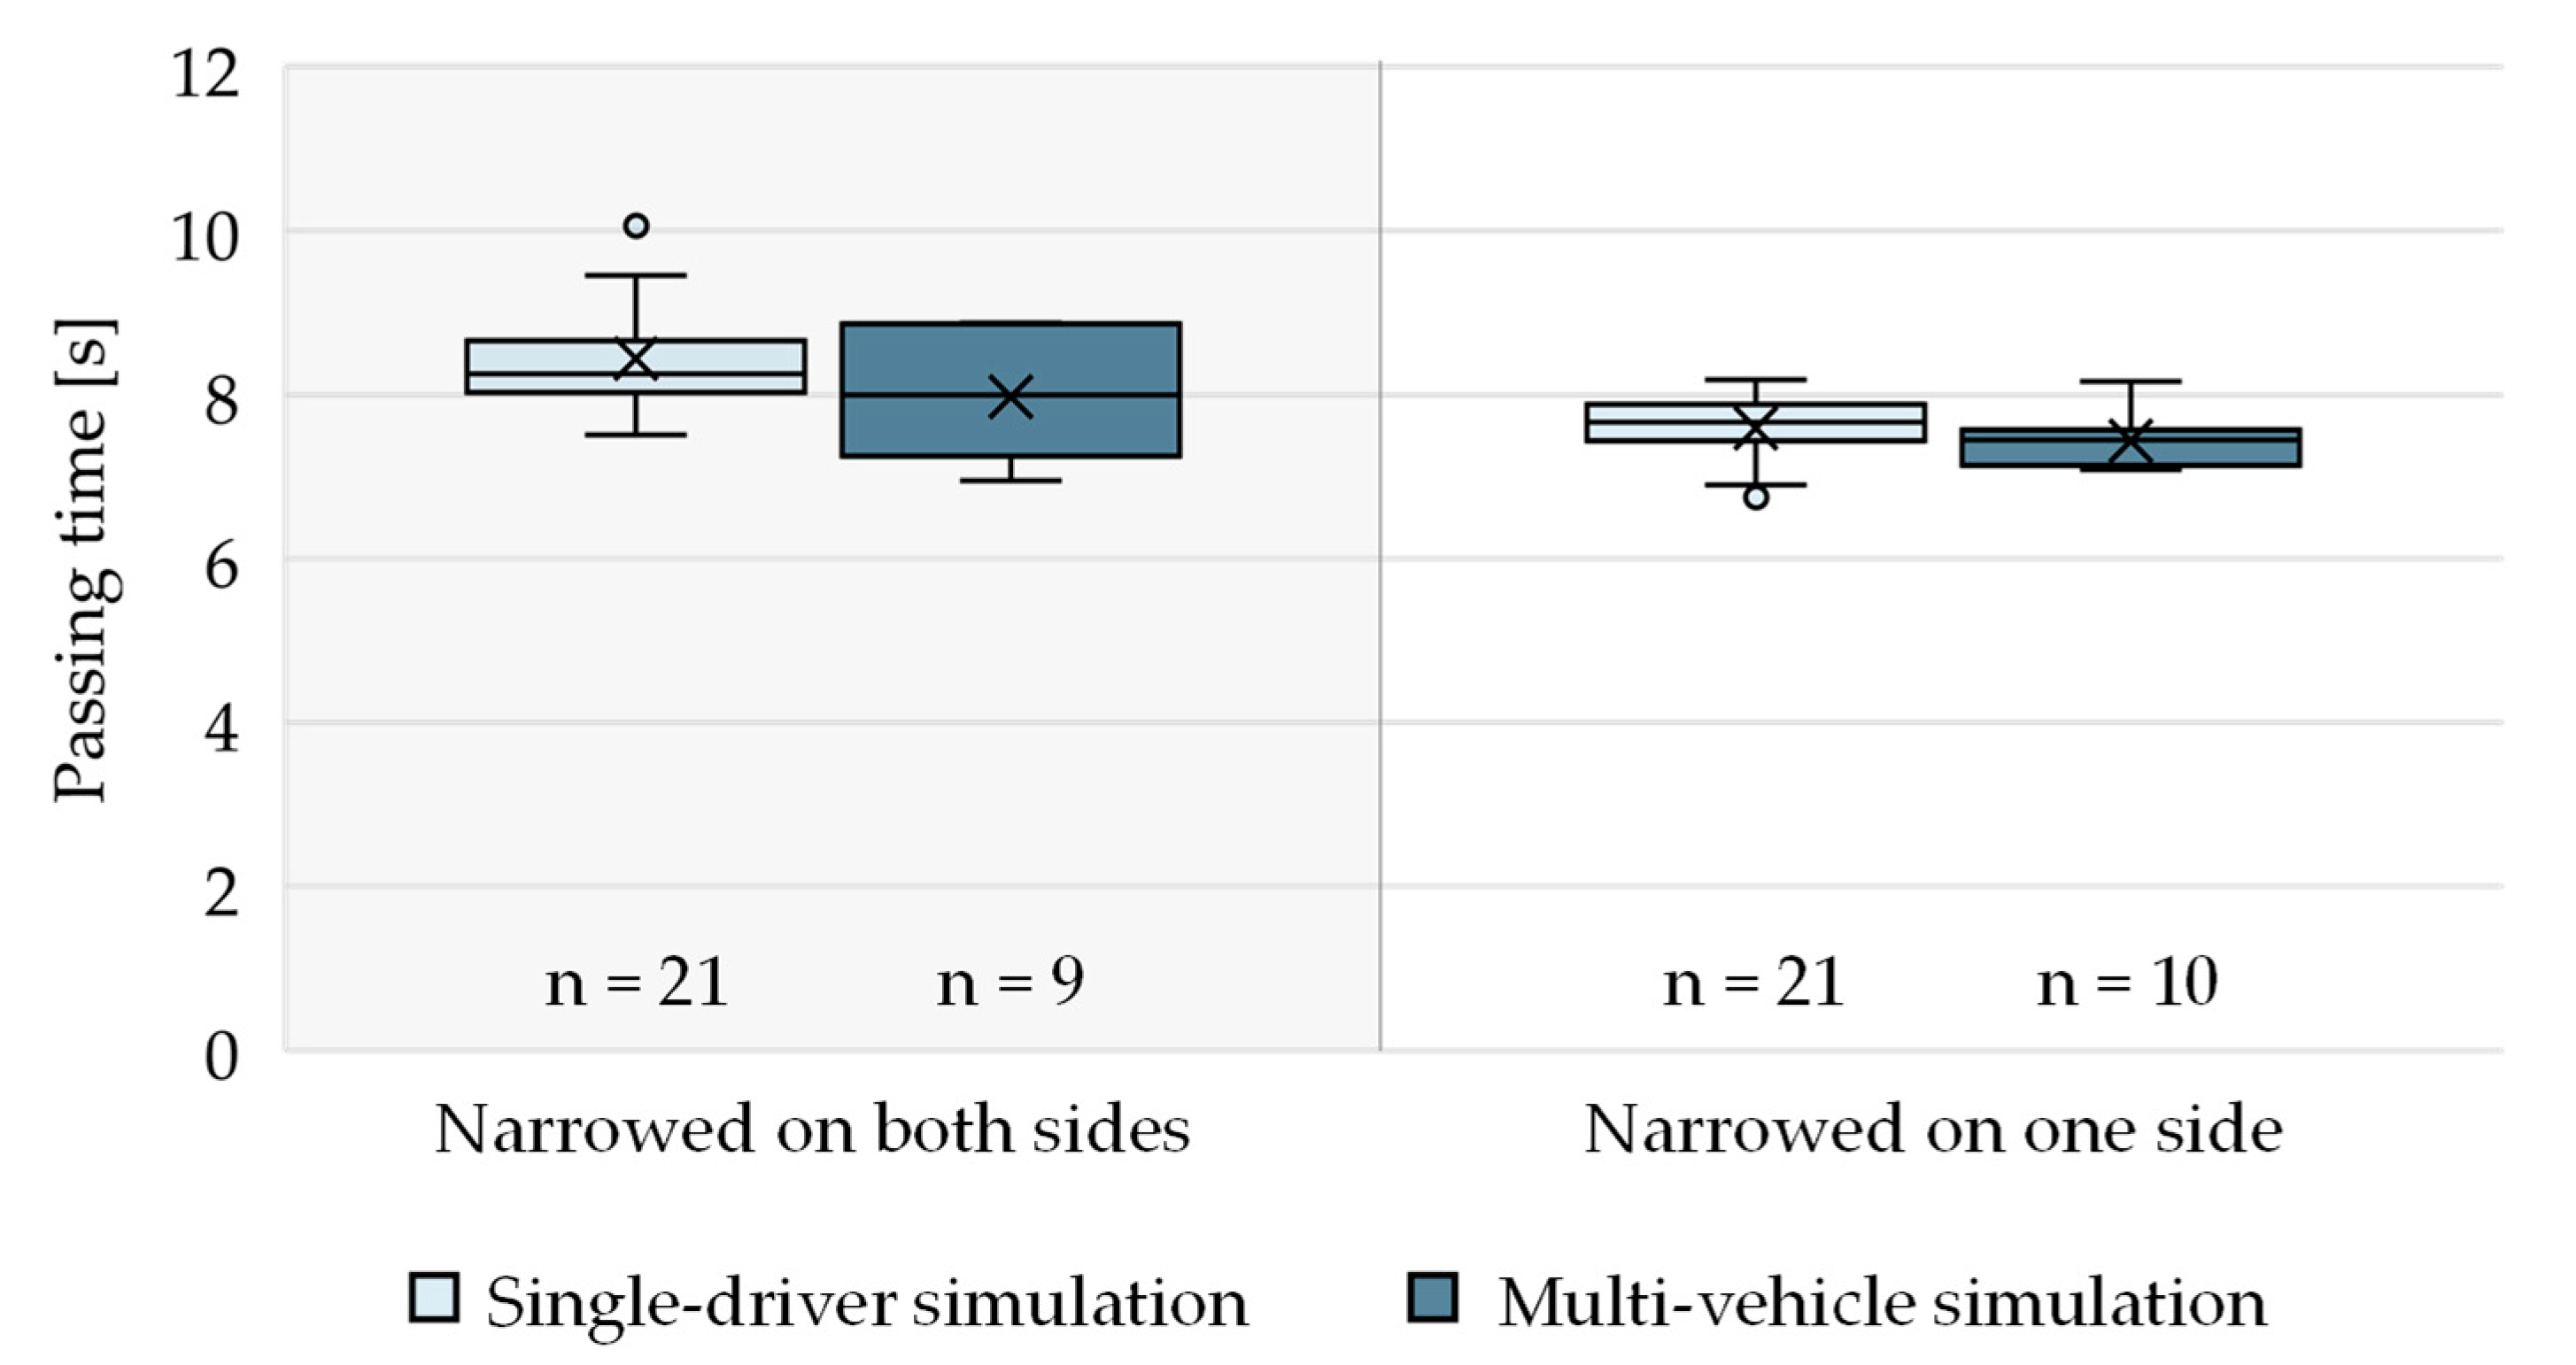
6.2. Multi-Vehicle Study

6.2.1. Human Driving Behavior

Figure 14 shows the participants’ passing time in the case that the AV yielded the right of way divided by the data of the single-driver simulation [30] (21 data sets) and the data of the multi-vehicle simulation (10 data sets). One data set (n = 9) was removed in multi-vehicle simulation due to an intervening participant in the AV. Table 3 contains the descriptive data. At the bottleneck narrowed on one side the passing time is similar in both studies with an average difference of 158 ms. At the bottleneck narrowed on both sides the participants in the single-driver study needed on average 465 ms more than in the multi-vehicle simulation.

6.2.2. Effect of Automation Failure

In the multi-vehicle simulation from ten trials four crashes occurred during the automation failure, where the human driver crashed with the AV and its passenger. These encounters are characterized by a late intervening AV’s passenger (TTC: 0.37 s, 0.65 s, 0.90 s, 0.94 s). The change in the aHMI was not detected by the AV’s passenger in all four cases. Moreover, switching off the AV’s eHMI was only detected by one manual driving participant. The other three participants did not detect that the eHMI was deactivated. In contrast to the 40% crash rate of the multi-vehicle simulation, the single-driver simulation showed a crash rate of 95% [30].
In six trials no crash occurred. These encounters include faster interventions of the AV’s passenger braking to standstill (TTC: 1.31 s, 1.83 s, 2.06 s, 2.32 s, 2.44 s, 2.73 s). The AV’s passengers stated that no oncoming traffic was detected permanently (once), that they had noticed the change in the aHMI (three times), or that they could not give any information about the aHMI during the automation failure (two times). None of the six human drivers that did not crash noticed that the eHMI was switched off. They stated that the eHMI continuously communicated to yield the right of way.

7. Discussion

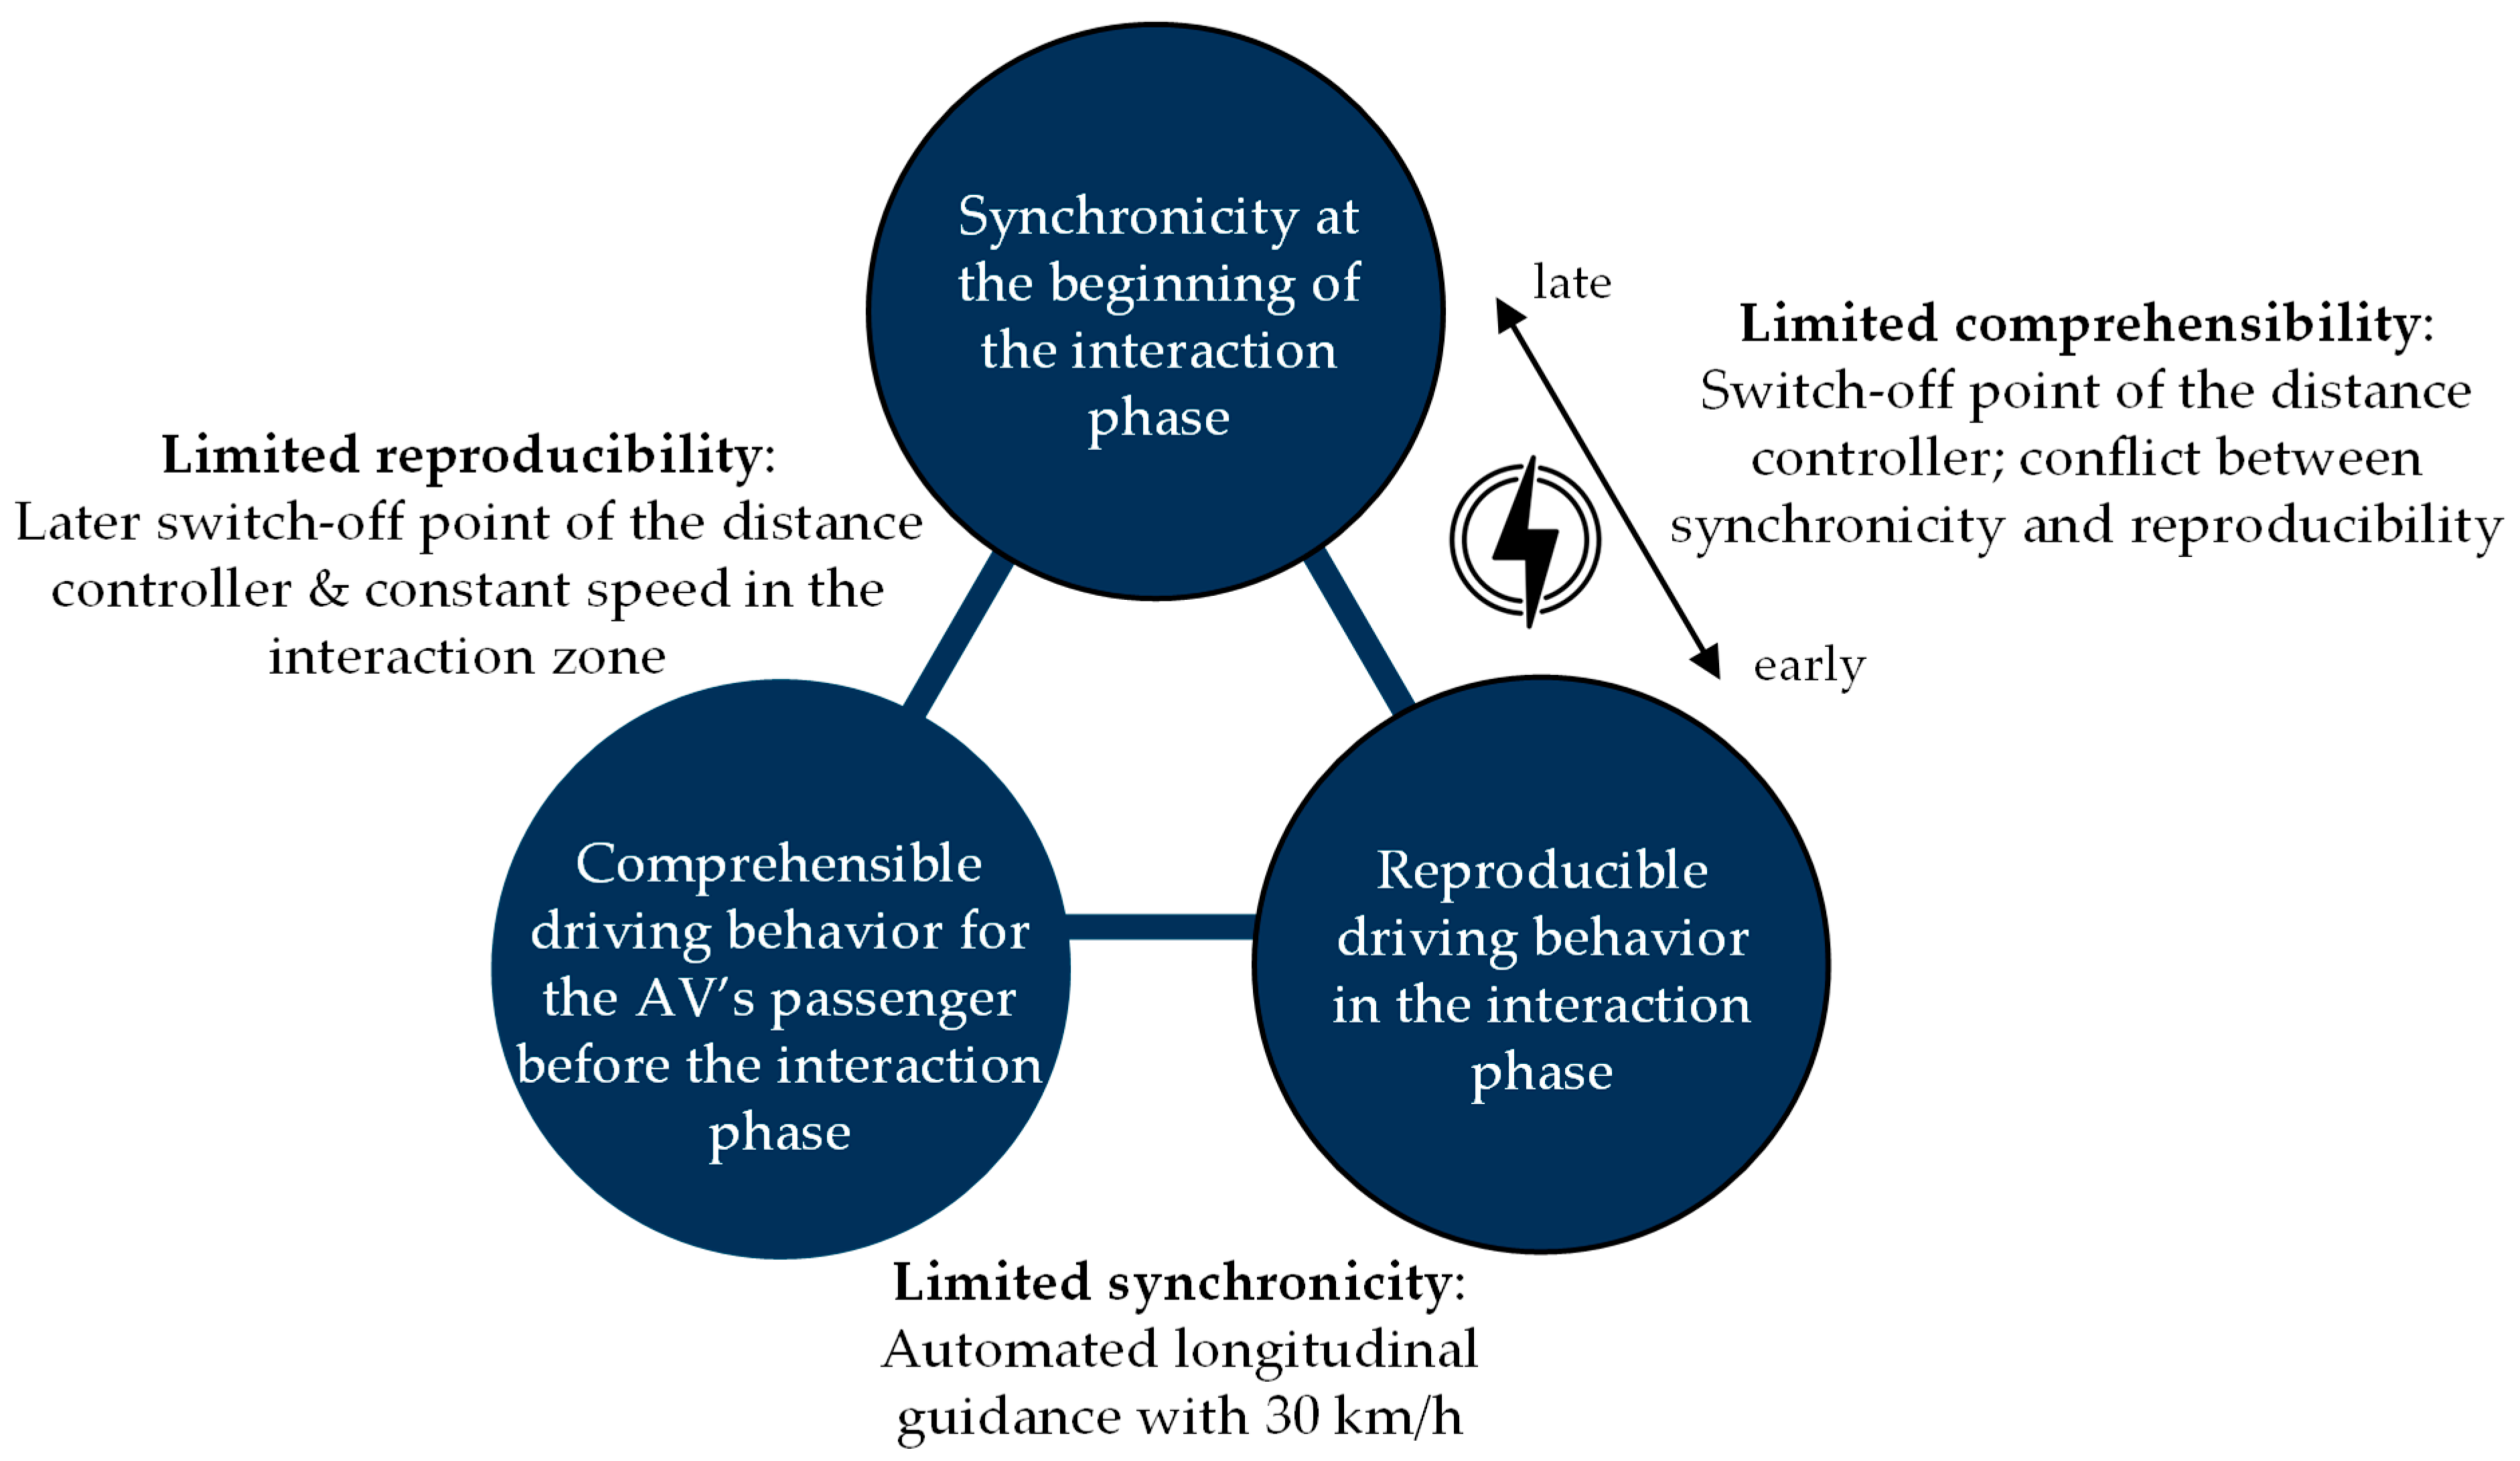
7.1. Technical Implementation

The results of the detail synchronization show that at the beginning the distance of the manual vehicle to the road bottleneck is decreasing faster than the distance of the AV to the bottleneck. According to the driving data, this is due to a slower acceleration of the AV. Thus, the manual vehicle accelerates strongly in the beginning and quickly reaches the maximum permitted speed. This fact can be attributed to the accelerator pedal in the manual driving simulator setup, which has a lower resistance than one of the Sensowheel pedals in the automated driving simulator setup. The resulting distance difference is compensated by the distance control in the detail synchronization with the distance passed. This can only be achieved by increasing the speed of the AV compared to the manual vehicle. Nevertheless, the allowed 50 km/h on the AV side during detail synchronization were rarely reached before the interaction phase. None of the participants reported that the speed was below the maximum speed, so different speed regulations seem to be a good way to compensate for differences in distance. Since the synchronicity increases with distance traveled, extending the distance of the detail synchronization could provide an improvement. A further adjustment of the PID controller could additionally provide improved synchronicity with a lower deviation. In addition, a modification of the control loop, e.g., by a two-cascade control, would be thinkable. However, the inconsistent setpoint changes caused by the driving behavior of the human driver make it difficult to minimize the control deviation with the proposed possible improvements. In particular, switching off the detail synchronization 80 m before the bottleneck leads to an increase in asynchrony directly before the interaction phase. The absolute value of the resulting mean distance difference (M = 5.7 m) only moderately exceeds the AV’s length (4.68 m), which we consider a tolerable deviation. Previous multi-agent studies including two manual road users lacked in inducing the intended interactions in a controlled manner in half of the recorded interactions in Will [18] and between 30% and 43% in Hancock and de Ridder [16]. Compared to these studies, the synchronization of the AV and the manual driver in this paper succeeded in all cases without an intervening AV’s passenger. Therefore, the proposed method appears to be valid to implement a multi-vehicle simulation with one AV.

7.2. Multi-Vehicle Study

7.2.1. Human Driving Behavior

The AV supports the human driver to efficiently pass through the bottleneck scenarios by communicating to yield the right of way. The enhancement in traffic efficiency is reflected in the human drivers’ short passing times. In comparison to the passing times of the single-driver simulation [30], the ones of the multi-vehicle study are similar or even slightly faster. This could be attributable to the fact that the AV arrived at the bottleneck a little later, which is an indication to yield the right of way in real world traffic [31]. However, as there are no clear tendencies, we state that the synchronization of both participants was implemented with sufficient accuracy and that there is no major influence by the variance of synchronization. Thus, the multi-vehicle simulation has, apart from the complex implementation, no disadvantage compared with the single-driver simulation when investigating the interaction of an AV with a manual driving participant.

7.2.2. Effect of Automation Failure

The multi-vehicle simulation resulted in a lower crash rate compared to the single-driver study [30]. However, the automation failure in this paper resulted in four crashes of the AV and the human driver, which means that the implemented scenario was too critical to be resolved by the participants. Only one participant noticed that the AV switched off its eHMI. Switching off the eHMI to communicate that the AV changes its strategy and passes through the bottleneck is insufficient. As already shown in the single-driver simulation [30] the AV has to communicate the changing driving strategy more saliently by displaying at least the message of the AV’s actual status. The increased stimulus would result in faster reaction times by the participants [43] and could lower the crash rate. Additionally, only 30% of the AVs’ passengers noticed the change in the IC or HUD. Here, a salient presentation of the planned maneuver by an augmented reality HUD and the resulting shift of the visual attention to the relevant driving environment could offer added value for future investigations [42].
In summary, participants were used to a perfect working automated system due to the previous encounters. During the automation failure, participants were not attentive enough since it was hardly possible for humans to monitor for unlikely abnormalities [44]. Therefore, we state that the AV’s internal and external communication must be reliable and the AV must not change its strategy.

7.2.3. Is Multi-Vehicle Simulation Beneficial?

If a study deals with the interaction of a perfectly working AV with its passenger or surrounding road users, there is no benefit of multi-vehicle simulation compared to the single-driver simulation because the results show no clear descriptive tendencies. It makes no difference to the human drivers’ driving behavior whether there is a real passenger in the AV or whether the AV is implemented within a single-driver simulation because in both cases the AV is programmed and the passenger has no influence on the AV’s behavior. We state that in scenarios where only one human negotiation partner affects the interaction it is sufficient to use single-driver simulation, thus avoiding the additional effort of the multi-vehicle simulation.
If research deals with the interaction of two human negotiation partners like after the take-over of the AV’s passenger during the automation failure, there is a benefit for multi-vehicle simulation. The results show that the AV’s passenger lowered the crash rate by intervening in the multi-vehicle simulation. The take-over including the timing and the braking behavior of the AV’s passenger is barely possible to implement in the single-driver simulation.

7.3. Limitations

A statistical analysis between the data of the multi-vehicle simulation and the single-driver simulation is not reasonable since the sample size in the present study was too small. Nevertheless, descriptively analyzing the data shows similar results in driving behavior in multi-vehicle and in single-driver simulation. Moreover, the sample was young and an above-average number of male participants attended. It will be useful to conduct future experiments with an age- and gender-balanced sample.
Since the human drivers’ driving behavior differed, the synchronization and thus the arrival at the bottleneck was not completely simultaneous in each trial in the way that the human driver reached the interaction phase first. This fact could have affected the participants’ passing times. The variance in manual driving behavior had the additional effect of the AV sometimes demonstrating incomprehensible driving behavior to compensate for the difference in distance. However, this problem did not disturb any participant.

8. Conclusions and Future Work

Based on the successful synchronization of the AV and manual vehicle in this study, we recommend a traffic light control for basic synchronization and a distance control for detail synchronization for future investigations using multi-vehicle simulation. The multi-vehicle simulation compared to a single-driver simulation revealed an added benefit for the automation failure scenario by realizing a more human-like interaction of two potential reacting and acting participants.
Single-driver studies seem to be appropriate to enable a worst-case consideration without an intervening AV’s passenger, for example, in automation failure scenarios. To investigate more realistic regular interactions between several road users further multi-vehicle simulation studies should be conducted. We suggest conducting a large-scaled study addressing several scenarios (e.g., bottlenecks, intersections, roundabouts) to allow a deeper comparison with single-driver studies and a simultaneous investigation of AV’s internal and external communication. Furthermore, future multi-agent simulation studies should not be limited to motorized road users, but should also address vulnerable road users such as cyclists and pedestrians.

Author Contributions

Conceptualization, A.F., M.R., and F.Z.; methodology, A.F., M.R., and F.Z.; software, A.F., M.R., and F.Z.; validation, A.F., M.R., and F.Z.; formal analysis, A.F., M.R., and F.Z.; investigation, A.F., M.R., and F.Z.; resources, A.F. and M.R.; data curation, A.F., M.R., and F.Z.; writing—original draft preparation, A.F. and M.R.; writing—review and editing, A.F. and M.R.; visualization, A.F. and M.R.; supervision, K.B. All authors have read and agreed to the published version of the manuscript.

Funding

This research was funded by the German Federal Ministry of Economics and Energy within the project @CITY: Automated Cars and Intelligent Traffic in the City, grant number 19A17015B. The authors are solely responsible for the content.

Conflicts of Interest

The authors declare no conflict of interest. The funders had no role in the design of the study; in the collection, analyses, or interpretation of data; in the writing of the manuscript, or in the decision to publish the results.

References

  1. Götze, M. Entwicklung und Evaluation eines integrativen MMI Gesamtkonzeptes zur Handlungsunterstützung für den urbanen Verkehr. Ph.D. Thesis, Technical University of Munich, Munich, Germany, 2018. [Google Scholar]
  2. Lüke, S.; Fochler, O.; Schaller, T.; Regensburger, U. Stauassistenz und-automation. In Handbuch Fahrerassistenzsysteme: Grundlagen, Komponenten und Systeme für aktive Sicherheit und Komfort; Winner, H., Hakuli, S., Lotz, F., Singer, C., Eds.; Springer Fachmedien Wiesbaden: Wiesbaden, Germany, 2015; pp. 995–1007. [Google Scholar] [CrossRef]
  3. Rittger, L.; Götze, M. HMI Strategy—Recommended Action. In UR:BAN Human Factors in Traffic; Bengler, K., Drüke, J., Hoffmann, S., Manstetten, D., Neukum, A., Eds.; Springer Fachmedien Wiesbaden: Wiesbaden, Germany, 2018; pp. 119–150. [Google Scholar] [CrossRef]
  4. Bengler, K.; Rettenmaier, M.; Fritz, N.; Feierle, A. From HMI to HMIs: Towards an HMI Framework for Automated Driving. Information 2020, 11, 61. [Google Scholar] [CrossRef] [Green Version]
  5. Habibovic, A.; Andersson, J.; Malmsten Lundgren, V.; Klingegård, M.; Englund, C.; Larsson, S. External Vehicle Interfaces for Communication with Other Road Users. In Road Vehicle Automation; Springer: Cham, Germany, 2018; pp. 91–102. [Google Scholar] [CrossRef]
  6. Rettenmaier, M.; Pietsch, M.; Schmidtler, J.; Bengler, K. Passing through the Bottleneck—The Potential of External Human-Machine Interfaces. In Proceedings of the IEEE Intelligent Vehicles Symposium (IV), Paris, France, 9–12 June 2019; pp. 1687–1692. [Google Scholar] [CrossRef]
  7. SAE International. Taxonomy and Definitions for Terms Related to Driving Automation Systems for On-Road Motor Vehicles; SAE International: Warrendale, PA, USA, 2018; p. 3016. [Google Scholar]
  8. Mühlbacher, D.; Preuk, K.; Lehsing, C.; Will, S.; Dotzauer, M. Multi-Road User Simulation: Methodological Considerations from Study Planning to Data Analysis. In UR:BAN Human Factors in Traffic: Approaches for Safe, Efficient and Stress-Free Urban Traffic; Bengler, K., Drüke, J., Hoffmann, S., Manstetten, D., Neukum, A., Eds.; Springer Fachmedien Wiesbaden: Wiesbaden, Germany, 2018; pp. 403–418. ISBN 978-3-658-15418-9. [Google Scholar]
  9. Oeltze, K.; Dotzauer, M. Towards A Best Practice for Multi-Driver Simulator Studies. In Proceedings of the Workshop on Practical Experiences in Measuring and Modeling Drivers and Driver-Vehicle Interactions at AutomotiveUI’15, Nottingham, UK, 1–3 September 2015. [Google Scholar]
  10. Oeltze, K.; Schießl, C. Benefits and challenges of multi-driver simulator studies. IET Intell. Transp. Syst. 2015, 9, 618–625. [Google Scholar] [CrossRef]
  11. Sun, J.; Ma, Z.; Li, T.; Niu, D. Development and application of an integrated traffic simulation and multi-driving simulators. Simul. Model. Pract. Theory 2015, 59, 1–17. [Google Scholar] [CrossRef]
  12. Mühlbacher, D.; Rittger, L.; Maag, C. Real vs. Simulated Surrounding Traffic—Does It Matter. In Proceedings of the Driving Simulation Conference 2014, Paris, France, 4–5 September 2014. [Google Scholar]
  13. Mühlbacher, D. The Multi-Driver Simulation: A Tool to Investigate Social Interactions Between Several Drivers. In UR:BAN Human Factors in Traffic: Approaches for Safe, Efficient and Stress-free Urban Traffic; Bengler, K., Drüke, J., Hoffmann, S., Manstetten, D., Neukum, A., Eds.; Springer Fachmedien Wiesbaden: Wiesbaden, Germany, 2018; pp. 379–391. ISBN 978-3-658-15418-9. [Google Scholar]
  14. Maag, C. Emerging Phenomena During Driving Interactions. In Co-Evolution of Intelligent Socio-Technical Systems; Mitleton-Kelly, E., Ed.; Springer: Berlin/Heidelberg, Germany, 2013; pp. 185–218. [Google Scholar] [CrossRef]
  15. Lehsing, C.; Benz, T.; Bengler, K. Insights into Interaction—Effects of Human-Human Interaction in Pedestrian Crossing Situations using a linked Simulator Environment. IFAC-PapersOnLine 2016, 49, 138–143. [Google Scholar] [CrossRef]
  16. Hancock, P.A.; de Ridder, S.N. Behavioural accident avoidance science: Understanding response in collision incipient conditions. Ergonomics 2003, 46, 1111–1135. [Google Scholar] [CrossRef] [PubMed]
  17. Yasar, A.-U.-H.; Berbers, Y.; Preuveneers, D. Computational Analysis of Driving Variations on Distributed Multiuser Driving Simulators. In Proceedings of the Second IASTED Africa Conference on Modelling and Simulation, Gaborone, Botswana, 8–10 September 2008; Science and technology innovation for sustainable development. Ogwu, F.J., Ed.; International Association of Science and Technology for Development: Calgary, AB, Canada, 2008. ISBN 9780889867642. [Google Scholar]
  18. Will, S. A New Approach to Investigate Powered Two Wheelers’ Interactions with Passenger Car Drivers: The Motorcycle—Car Multi-Driver Simulation. In UR:BAN Human Factors in Traffic: Approaches for Safe, Efficient and Stress-free Urban Traffic; Bengler, K., Drüke, J., Hoffmann, S., Manstetten, D., Neukum, A., Eds.; Springer Fachmedien Wiesbaden: Wiesbaden, Germany, 2018; pp. 393–402. ISBN 978-3-658-15418-9. [Google Scholar]
  19. Mühlbacher, D.; Zimmer, J.; Fischer, F.; Krüger, H.-P. The multi-driver simulator—A new concept of driving simulation for the analysis of interactions between several drivers. In Human Centred Automation; de Waard, D., Gérard, L., Onnasch, L., Wiczorek, R., Manzey, D., Eds.; Shaker Publishing: Maastricht, The Netherlands, 2011; pp. 147–158. [Google Scholar]
  20. Mühlbacher, D.; Krüger, H.-P. The effect of car-following on lateral guidance during cognitive load—A study conducted in the multi-driver simulation. In Proceedings of the 2nd International Conference on Driver Distraction and Inattention 2011, Gothenburg, Sweden, 5–7 September 2011. [Google Scholar]
  21. Heesen, M.; Baumann, M.; Kelsch, J.; Nause, D.; Friedrich, M. Investigation of Cooperative Driving Behaviour during Lane Change in a Multi-Driver Simulation Environment. In Proceedings of the HFES Europe Chapter Conference Toulouse, Toulouse, France, 10–12 October 2012. [Google Scholar]
  22. Niu, D.; Sun, J. Eco-driving Versus Green Wave Speed Guidance for Signalized Highway Traffic: A Multi-vehicle Driving Simulator Study. Procedia-Soc. Behav. Sci. 2013, 96, 1079–1090. [Google Scholar] [CrossRef] [Green Version]
  23. Gajananan, K.; Nantes, A.; Miska, M.; Nakasone, A.; Prendinger, H. An Experimental Space for Conducting Controlled Driving Behavior Studies based on a Multiuser Networked 3D Virtual Environment and the Scenario Markup Language. IEEE Trans. Hum. -Mach. Syst. 2013, 43, 345–358. [Google Scholar] [CrossRef]
  24. Rittger, L.; Mühlbacher, D.; Maag, C.; Kiesel, A. Anger and bother experience when driving with a traffic light assistant: A multi-driver simulator study. In Proceedings of the Human Factors and Ergonomics Society Europe Chapter 2014 Annual Conference, Lisbon, Portugal, 8–10 October 2014. [Google Scholar]
  25. Friedrich, M.; Nause, D.; Heesen, M.; Keich, A.; Kelsch, J.; Baumann, M.; Vollrath, M. Validation of the MoSAIC-Driving Simulator—Investigating the impact of a human driver on cooperative driving behavior in an experimental simulation setup. Proc. Hum. Factors Ergon. Soc. Annu. Meet. 2013, 57, 2052–2056. [Google Scholar] [CrossRef]
  26. Bazilinskyy, P.; Kooijman, L.; Dodou, D.; de Winter, J.C.F. Coupled Simulator for Research on the Interaction between Pedestrians and (Automated) Vehicles. 2019. Available online: https://www.researchgate.net/publication/338118077_Coupled_simulator_for_research_on_the_interaction_between_pedestrians_and_automated_vehicles (accessed on 19 May 2020).
  27. Schindler, J.; Köster, F. A Dynamic and Model-Based Approach for Performing Successful Multi-Driver Studies. Proceedings of DSC Europe, Paris, France, 7–9 September 2016. [Google Scholar]
  28. Mühlbacher, D. Die Pulksimulation als Methode zur Untersuchung verkehrspsychologischer Fragestellungen. Ph.D. Thesis, University of Würzburg, Würzburg, Germany, 2013. [Google Scholar]
  29. Will, S. Die—vernetzte—Fahrsimulation zur Untersuchung des Fahr-und Interaktionsverhaltens von Motorradfahrern. 2016. Available online: https://docplayer.org/22386886-Sim-die-vernetzte-fahrsimulation-zur-untersuchung-des-fahr-und-interaktionsverhaltens-von-motorradfahrern.html (accessed on 19 May 2020).
  30. Rettenmaier, M.; Albers, D.; Bengler, K. After you?!—Use of external human-machine interfaces in road bottleneck scenarios. Transp. Res. Part F Traffic Psychol. Behav. 2020, 70, 175–190. [Google Scholar] [CrossRef]
  31. Rettenmaier, M.; Requena Witzig, C.; Bengler, K. Interaction at the Bottleneck—A Traffic Observation. In Human Systems Engineering and Design II; Ahram, T., Karwowski, W., Pickl, S., Taiar, R., Eds.; Springer International Publishing: Cham, Germany, 2020; pp. 243–249. [Google Scholar] [CrossRef]
  32. Würzburg Institute for Traffic Sciences GmbH. Driving Simulation and SILAB. Available online: https://wivw.de/en/silab (accessed on 14 December 2019).
  33. Drüke, J.; Semmler, C.; Bendewald, L. The “HMI tool kit” as a Strategy for the Systematic Derivation of User-Oriented HMI Concepts of Driver Assistance Systems in Urban Areas. In UR:BAN Human Factors in Traffic; Bengler, K., Drüke, J., Hoffmann, S., Manstetten, D., Neukum, A., Eds.; Springer Fachmedien Wiesbaden: Wiesbaden, Germany, 2018; pp. 53–74. [Google Scholar] [CrossRef]
  34. van den Beukel, A.P.; van der Voort, M.C. Design Considerations on User-Interaction for Semi-Automated Driving. In Proceedings of the FISITA 2014 World Automotive Congress, Maastricht, The Netherlands, 2–6 June 2014. [Google Scholar]
  35. Othersen, I. Vom Fahrer zum Denker und Teilzeitlenker: Einflussfaktoren und Gestaltungsmerkmale nutzerorientierter Interaktionskonzepte für die Überwachungsaufgabe des Fahrers im teilautomatisierten Modus. AutoUni-Schr. 2016. [Google Scholar] [CrossRef]
  36. Yang, Y.; Götze, M.; Laqua, A.; Dominioni, G.C.; Kawabe, K.; Bengler, K. A method to improve driver’s situation awareness in automated driving. In Proceedings of the Human Factors and Ergonomics Society Europe Chapter 2017 Annual Conference, Rome, Italy, 28–30 September 2017. [Google Scholar]
  37. Yang, Y.; Karakaya, B.; Dominioni, G.C.; Kawabe, K.; Bengler, K. An HMI Concept to Improve Driver’s Visual Behavior and Situation Awareness in Automated Vehicle. In Proceedings of the 2018 IEEE Intelligent Transportation Systems Conference (ITSC), Maui, HI, USA, 4–7 November 2018; pp. 650–655. [Google Scholar] [CrossRef]
  38. Feldhütter, A.; Härtwig, N.; Kurpiers, C.; Hernandez, J.M.; Bengler, K. Effect on Mode Awareness When Changing from Conditionally to Partially Automated Driving. In Proceedings of the 20th Congress of the International Ergonomics Association (IEA 2018), Florence, Italy, 26–30 August 2018; Volume VI: Transport Ergonomics and Human Factors (TEHF), Aerospace Human Factors and Ergonomics. Bagnara, S., Tartaglia, R., Albolino, S., Alexander, T., Fujita, Y., Eds.; Springer International Publishing: Cham, Germany, 2019; pp. 314–324. [Google Scholar] [CrossRef]
  39. Feierle, A.; Danner, S.; Steininger, S.; Bengler, K. Information Needs and Visual Attention during Urban, Highly Automated Driving—An Investigation of Potential Influencing Factors. Information 2020, 11, 62. [Google Scholar] [CrossRef] [Green Version]
  40. Feierle, A.; Holderied, M.; Bengler, K. Evaluation of Ambient Light Displays for Requests to Intervene and Minimal Risk Maneuvers in Highly Automated Urban Driving. In Proceedings of the 2020 IEEE Intelligent Transportation Systems Conference (ITSC), Rhodes, Greece, 20–23 September 2020. [Google Scholar]
  41. Feierle, A.; Bücherl, F.; Hecht, T.; Bengler, K. Evaluation of Display Concepts for the Instrument Cluster in Urban Automated Driving. In Human Systems Engineering and Design II; Ahram, T., Karwowski, W., Pickl, S., Taiar, R., Eds.; Springer International Publishing: Cham, Germary, 2020; pp. 209–215. [Google Scholar] [CrossRef]
  42. Feierle, A.; Beller, D.; Bengler, K. Head-Up Displays in Urban Partially Automated Driving: Effects of Using Augmented Reality. In Proceedings of the 2019 IEEE Intelligent Transportation Systems Conference (ITSC) 2019, Auckland, New Zealand, 27–30 October 2019; pp. 1877–1882. [Google Scholar] [CrossRef]
  43. Werneke, J.; Vollrath, M. Signal evaluation environment: A new method for the design of peripheral in-vehicle warning signals. Behav. Res. Methods 2011, 43, 537–547. [Google Scholar] [CrossRef] [PubMed] [Green Version]
  44. Bainbridge, L. Ironies of automation. Automatica 1983, 19, 775–779. [Google Scholar] [CrossRef]
Figure 1. Basic synchronization of the AV (red vehicle in the lower part) and human driver (black vehicle in the upper part) via the traffic light control. The route does not correspond to the real course in the simulation and is shown schematically.
Information 11 00272 g001
Figure 2. Block diagrams of the proposed methods to adapt the AV to the behavior of the manual vehicle (MV).
Information 11 00272 g002
Figure 3. Three different implemented speed profiles (offensive, neutral, defensive) using a cruise control to simulate the manual vehicle during the pre-test.
Information 11 00272 g003
Figure 4. Effect of the switch-off point of the distance controller on the attributes synchronicity, reproducibility, and comprehensibility for detail synchronization. The switch-off point results in a trade-off between these attributes in a way that a simultaneous fulfilling of all attributes cannot be guaranteed.
Information 11 00272 g004
Figure 5. Course design consisting of two modules (Module I and Module II) the participants passed through during the experiment. Additionally, the navigation through the modules of the AV and the manual vehicle (MV) is presented.
Information 11 00272 g005
Figure 6. Modular driving simulators. (a) Manual vehicle setup; (b) Automated vehicle setup with blue LED-strip.
Information 11 00272 g006
Figure 7. Visualization of the instrument cluster, modified from Feierle et al. (2020) [41].
Information 11 00272 g007
Figure 8. Visualization of the maneuver in the IC during the bottleneck scenarios: (a) bottleneck narrowed on both sides, AV insists on the right of way; (b) bottleneck narrowed on both sides, no oncoming traffic, AV passes; (c) bottleneck narrowed on both sides, AV yields the right of way; (d) bottleneck narrowed on one side, no upcoming traffic, AV passes; (e) bottleneck narrowed on one side, AV yields the right of way.
Information 11 00272 g008
Figure 9. Head-up display showing speed, maneuver, and navigation information when the AV insists on the right of way in the road bottleneck scenario narrowed on both sides. The black background is transparent in the driving simulation.
Information 11 00272 g009
Figure 10. External HMI used in the study. In the upper part of the picture the AV indicates to yield the right of way to the human driver. In the lower part the AV communicates to insist on the right of way. The illustrated scenario is the road bottleneck narrowed on both sides of the road [30].
Information 11 00272 g010
Figure 11. Different bottleneck scenarios the participants passed through during the experimental drive. The scenarios are located in the interaction phase with a speed limit of 30 km/h. In the interaction phase the AV communicates to the driver of the manual vehicle (MV) via the eHMI either to yield the right of way or to insist on it [30].
Information 11 00272 g011
Figure 12. Distances of the manual vehicles plotted over the distances of the AVs to the bottleneck during the detail synchronization phase. The angle bisector visualizes the distances for an ideal synchronization.
Information 11 00272 g012
Figure 13. Distance differences and its relative frequency of the manual vehicles and AVs when one of them has already reached the interaction phase. Negative values mean that the manual vehicle arrived at the road bottleneck first.
Information 11 00272 g013
Figure 14. Participants average passing time in the case that the AV yields the right of way to the oncoming human driver divided by the bottleneck type. The data of the single-driver simulation are derived from Rettenmaier et al. [30].
Information 11 00272 g014
Table 1. Mean and standard deviation of the distance differences of the AV and the implemented manual vehicle using each speed profile (offensive, neutral, defensive) once (n = 3). The distance to the road bottleneck when the detail synchronization was switched off was varied.
Switch-Off Distance [m]M [m]SD [m]
50−0.791.11
800.214.49
900.765.31
1001.576.11
1102.197.14
1202.658.19
Table 2. Five different Use Cases the participants passed through.
AV Insists on Right of WayAV Yields Right of WayAutomation Failure
Bottleneck narrowed on both sidesUse Case 1 (Module I)Use Case 3 (Module I)-
Bottleneck narrowed on one sideUse Case 2 (Module II)Use Case 4 (Module II)Use Case 5 (Module II)
Table 3. Descriptive data of the participants’ passing time. The data of the single-driver simulation are derived from Rettenmaier et al. [30].
Bottleneck Narrowed on Both SidesBottleneck Narrowed on One Side
Single-driver simulation
M (SD) [ms]
8445 (1405)
(n = 21)
7598 (495)
(n = 21)
Multi-vehicle simulation
M (SD) [ms]
7980 (740)
(n = 9)
7440 (310)
(n = 10)

