Methodological Considerations Concerning Motion Sickness Investigations during Automated Driving

Abstract
1. Introduction and Overview
- (1)
- The first goal is to get valid estimations of the prevalence, symptoms, and symptom evolution, to understand the influencing factors and development over time.
- (2)
- The second main issue is the development of countermeasures for motion sickness that are applicable in the vehicle.
2. The Phenomenon of Motion Sickness
2.1. Symptoms, Prevalence, and Time Course of Motion Sickness
2.2. Motion Sickness Theories
3. Methods for Investigating Motion Sickness in Autonomous Vehicles
3.1. The Study Setting
- High-level simulators incorporate a motion system and full vehicle cabs;
- Mid-level simulators are static simulators with a full vehicle cab;
- Low-level simulators are built around simple components such as game controllers and computer monitors.
3.2. The Participant’s Task
3.3. Sample and Recruitment
3.4. Measurement of Motion Sickness
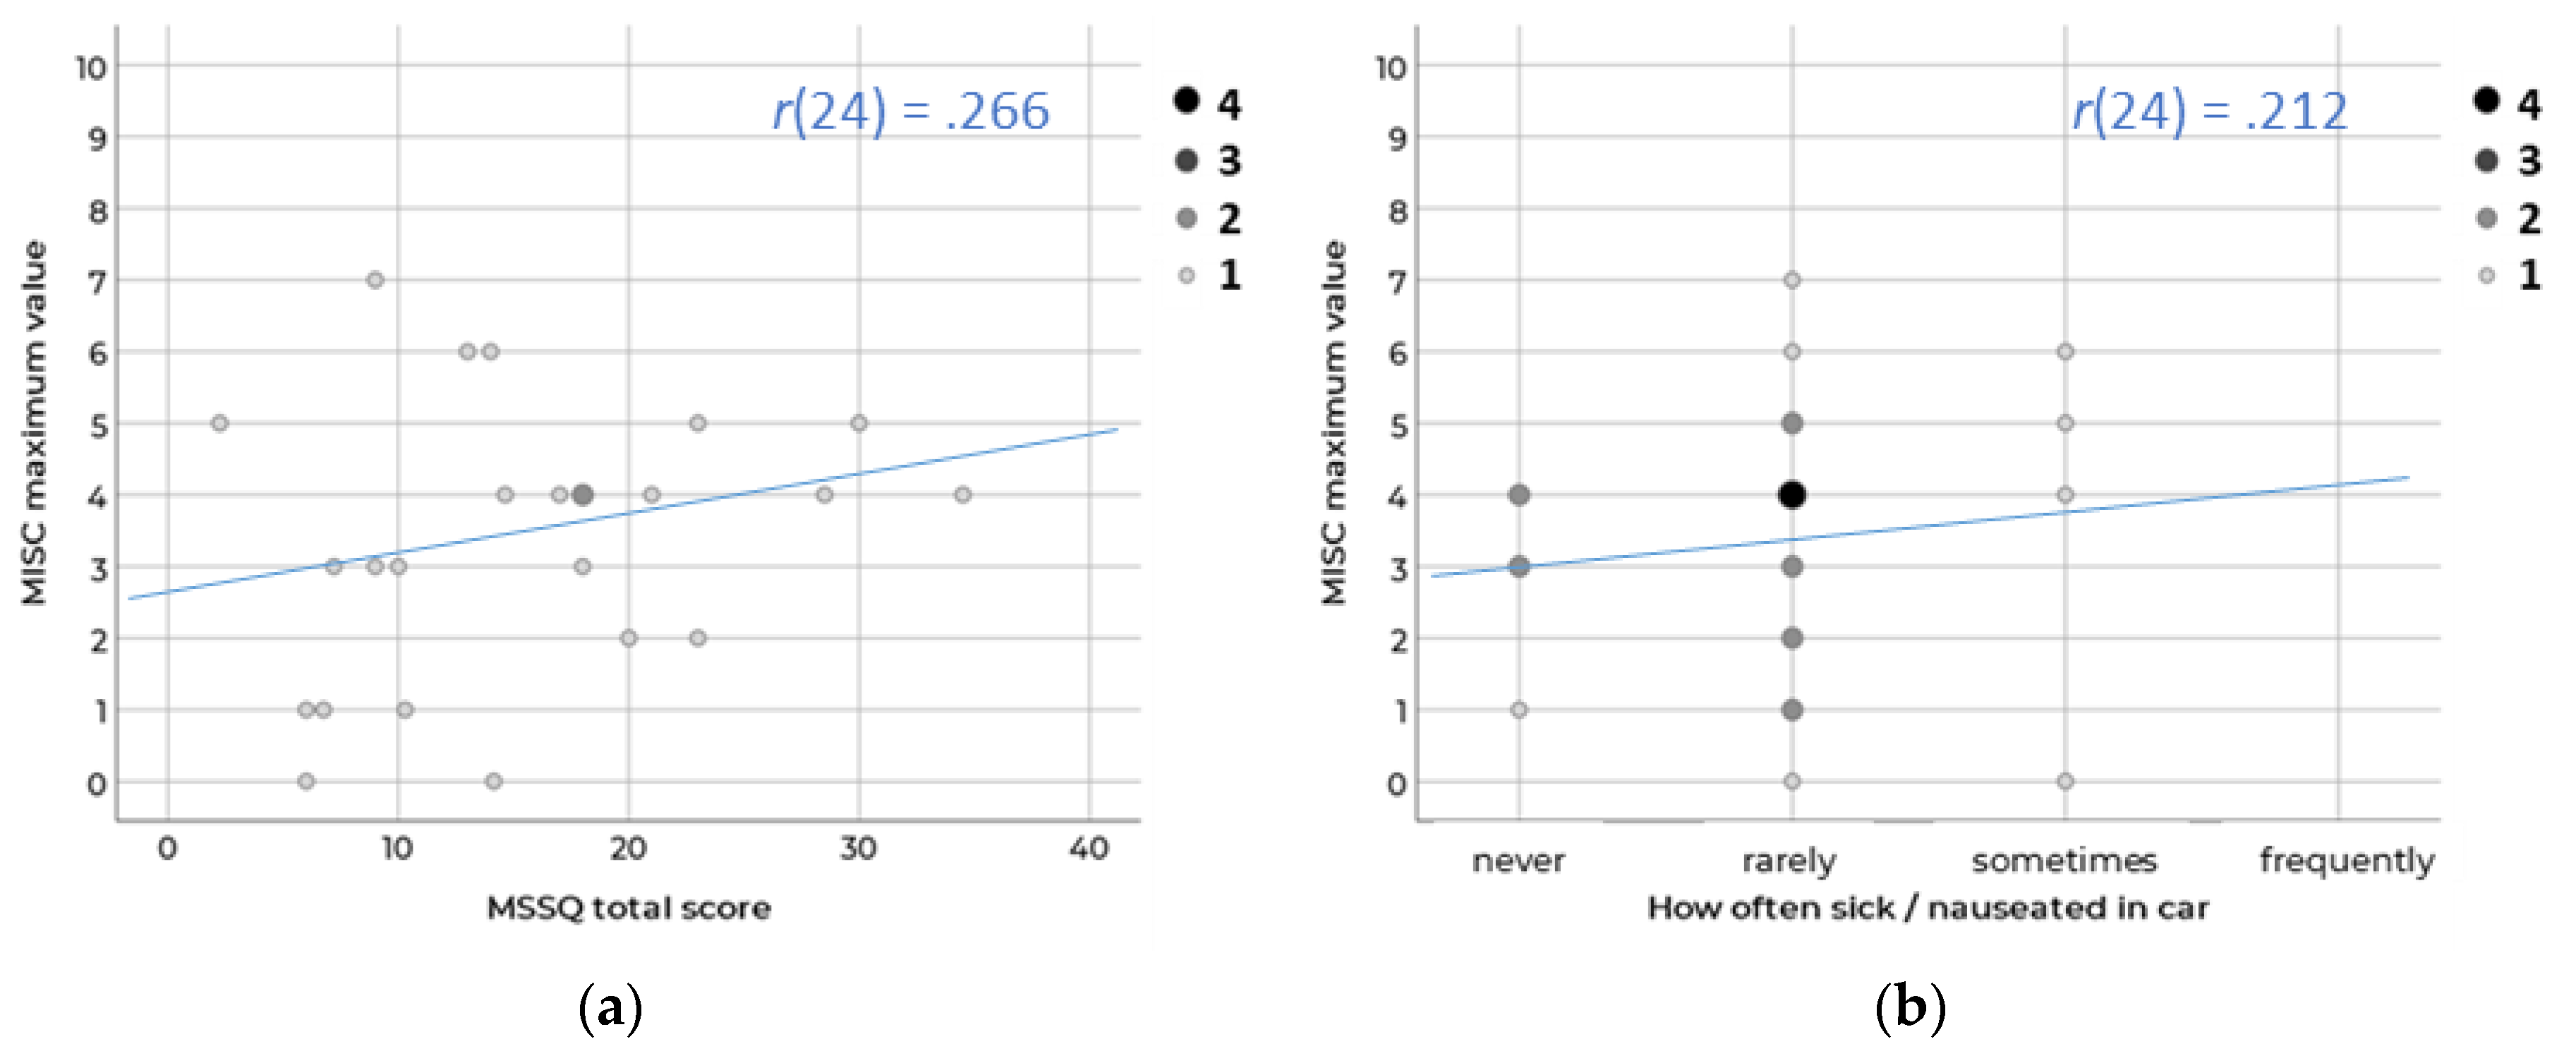
3.4.1. Subjectively Perceived Motion Sickness
3.4.2. Physiological Correlates
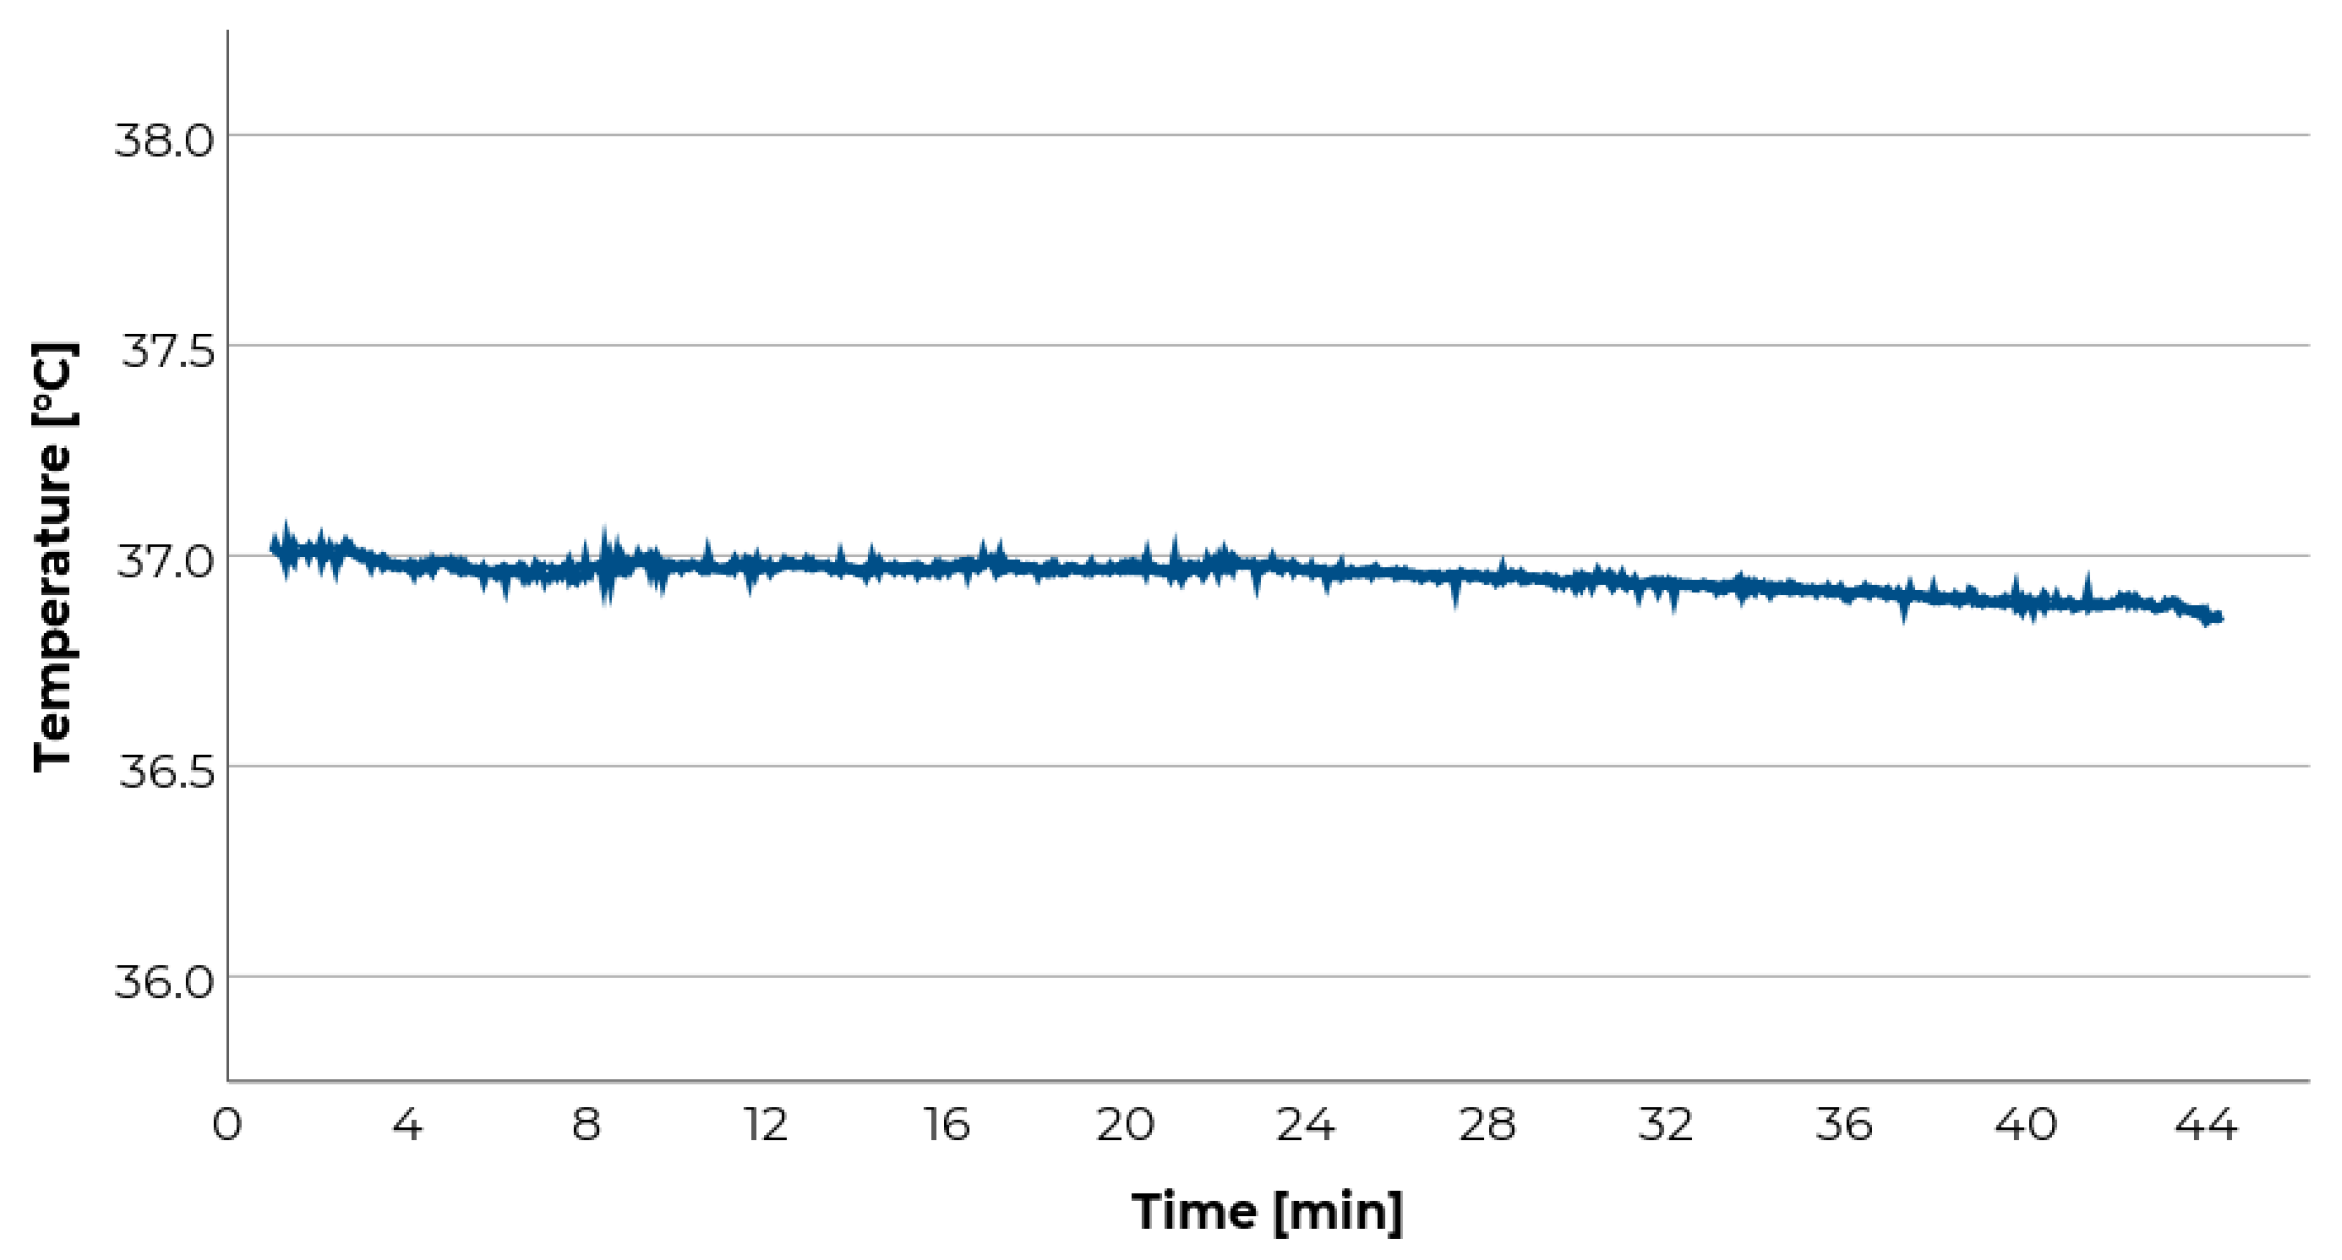
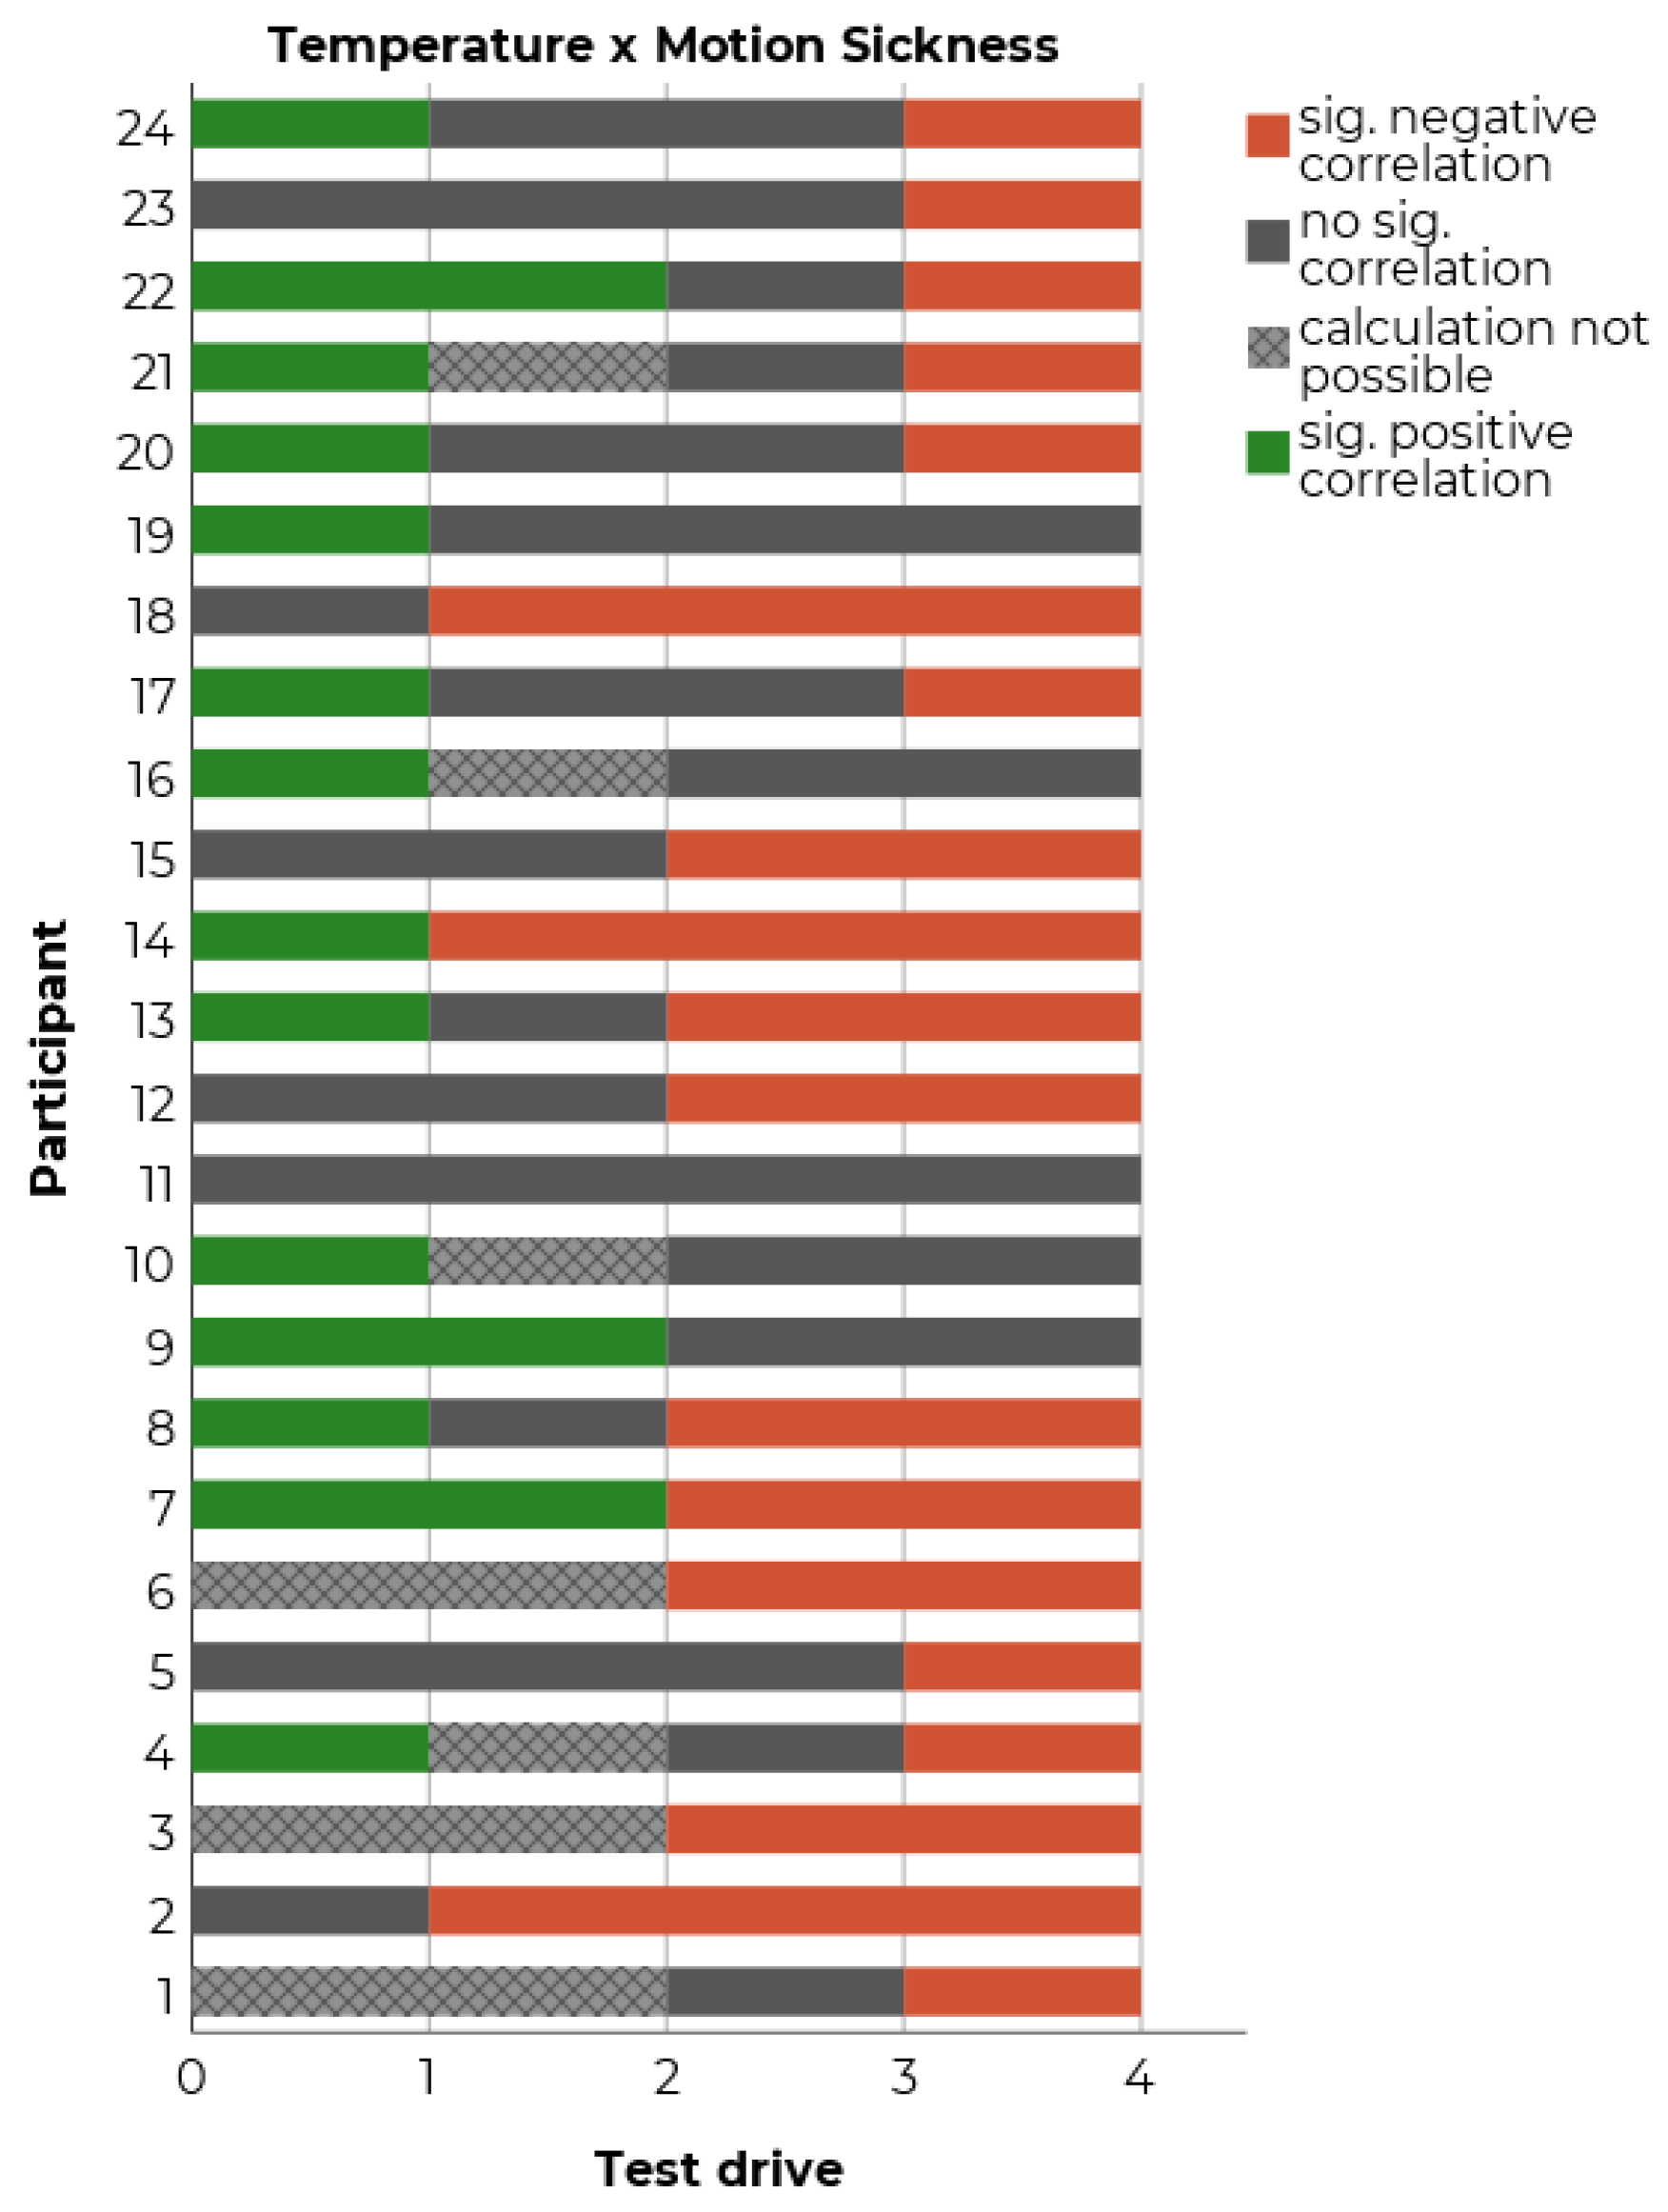
Temperature
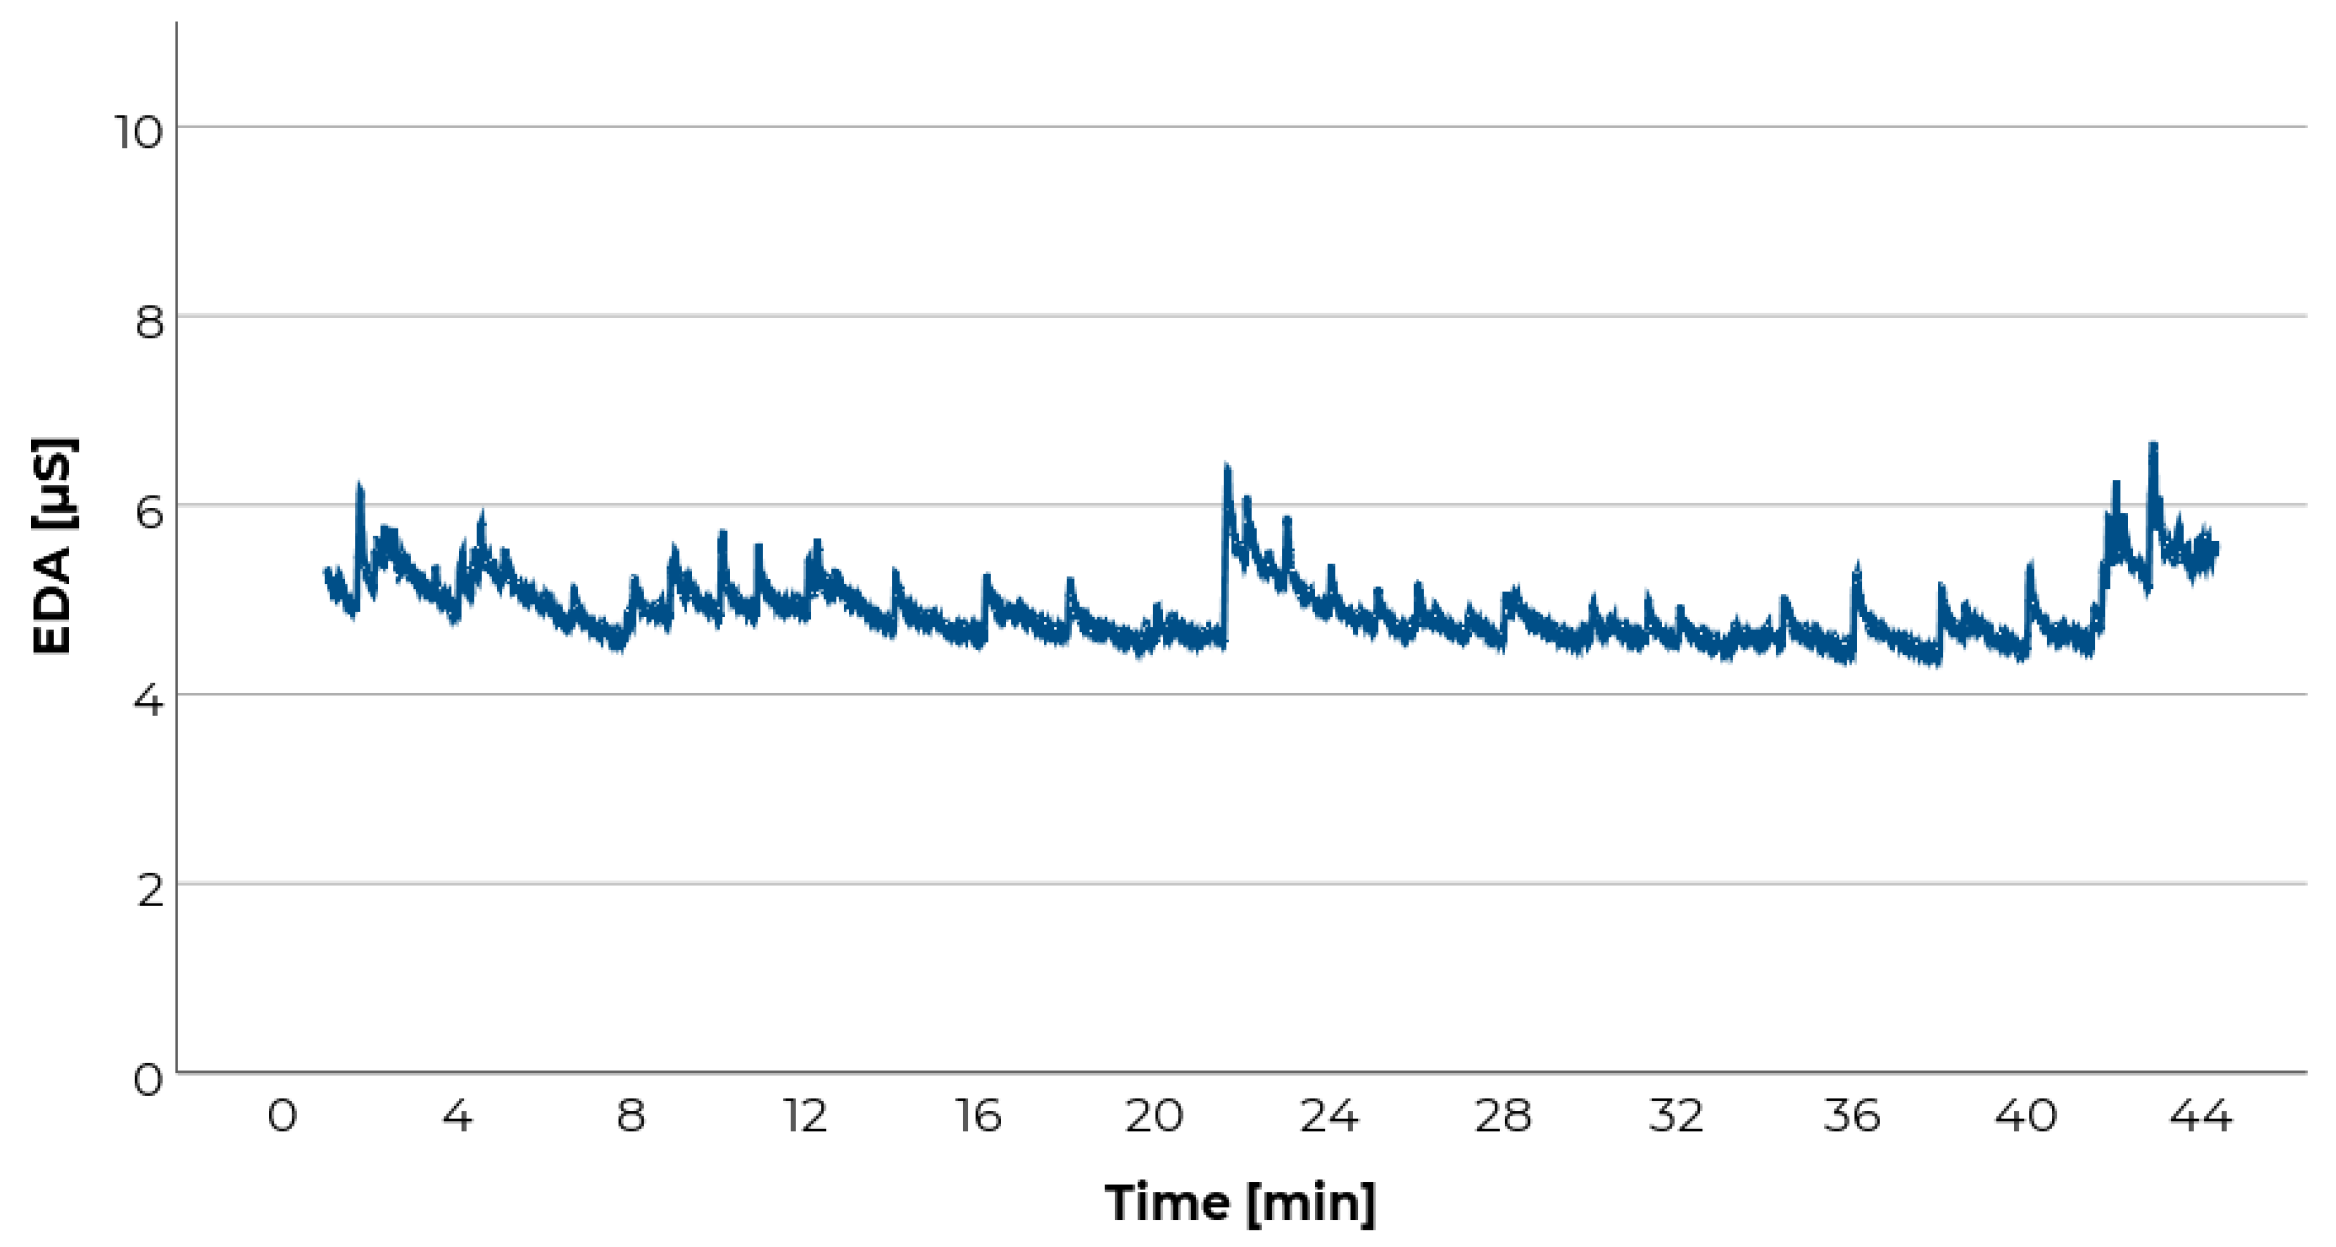
Electrodermal Activity
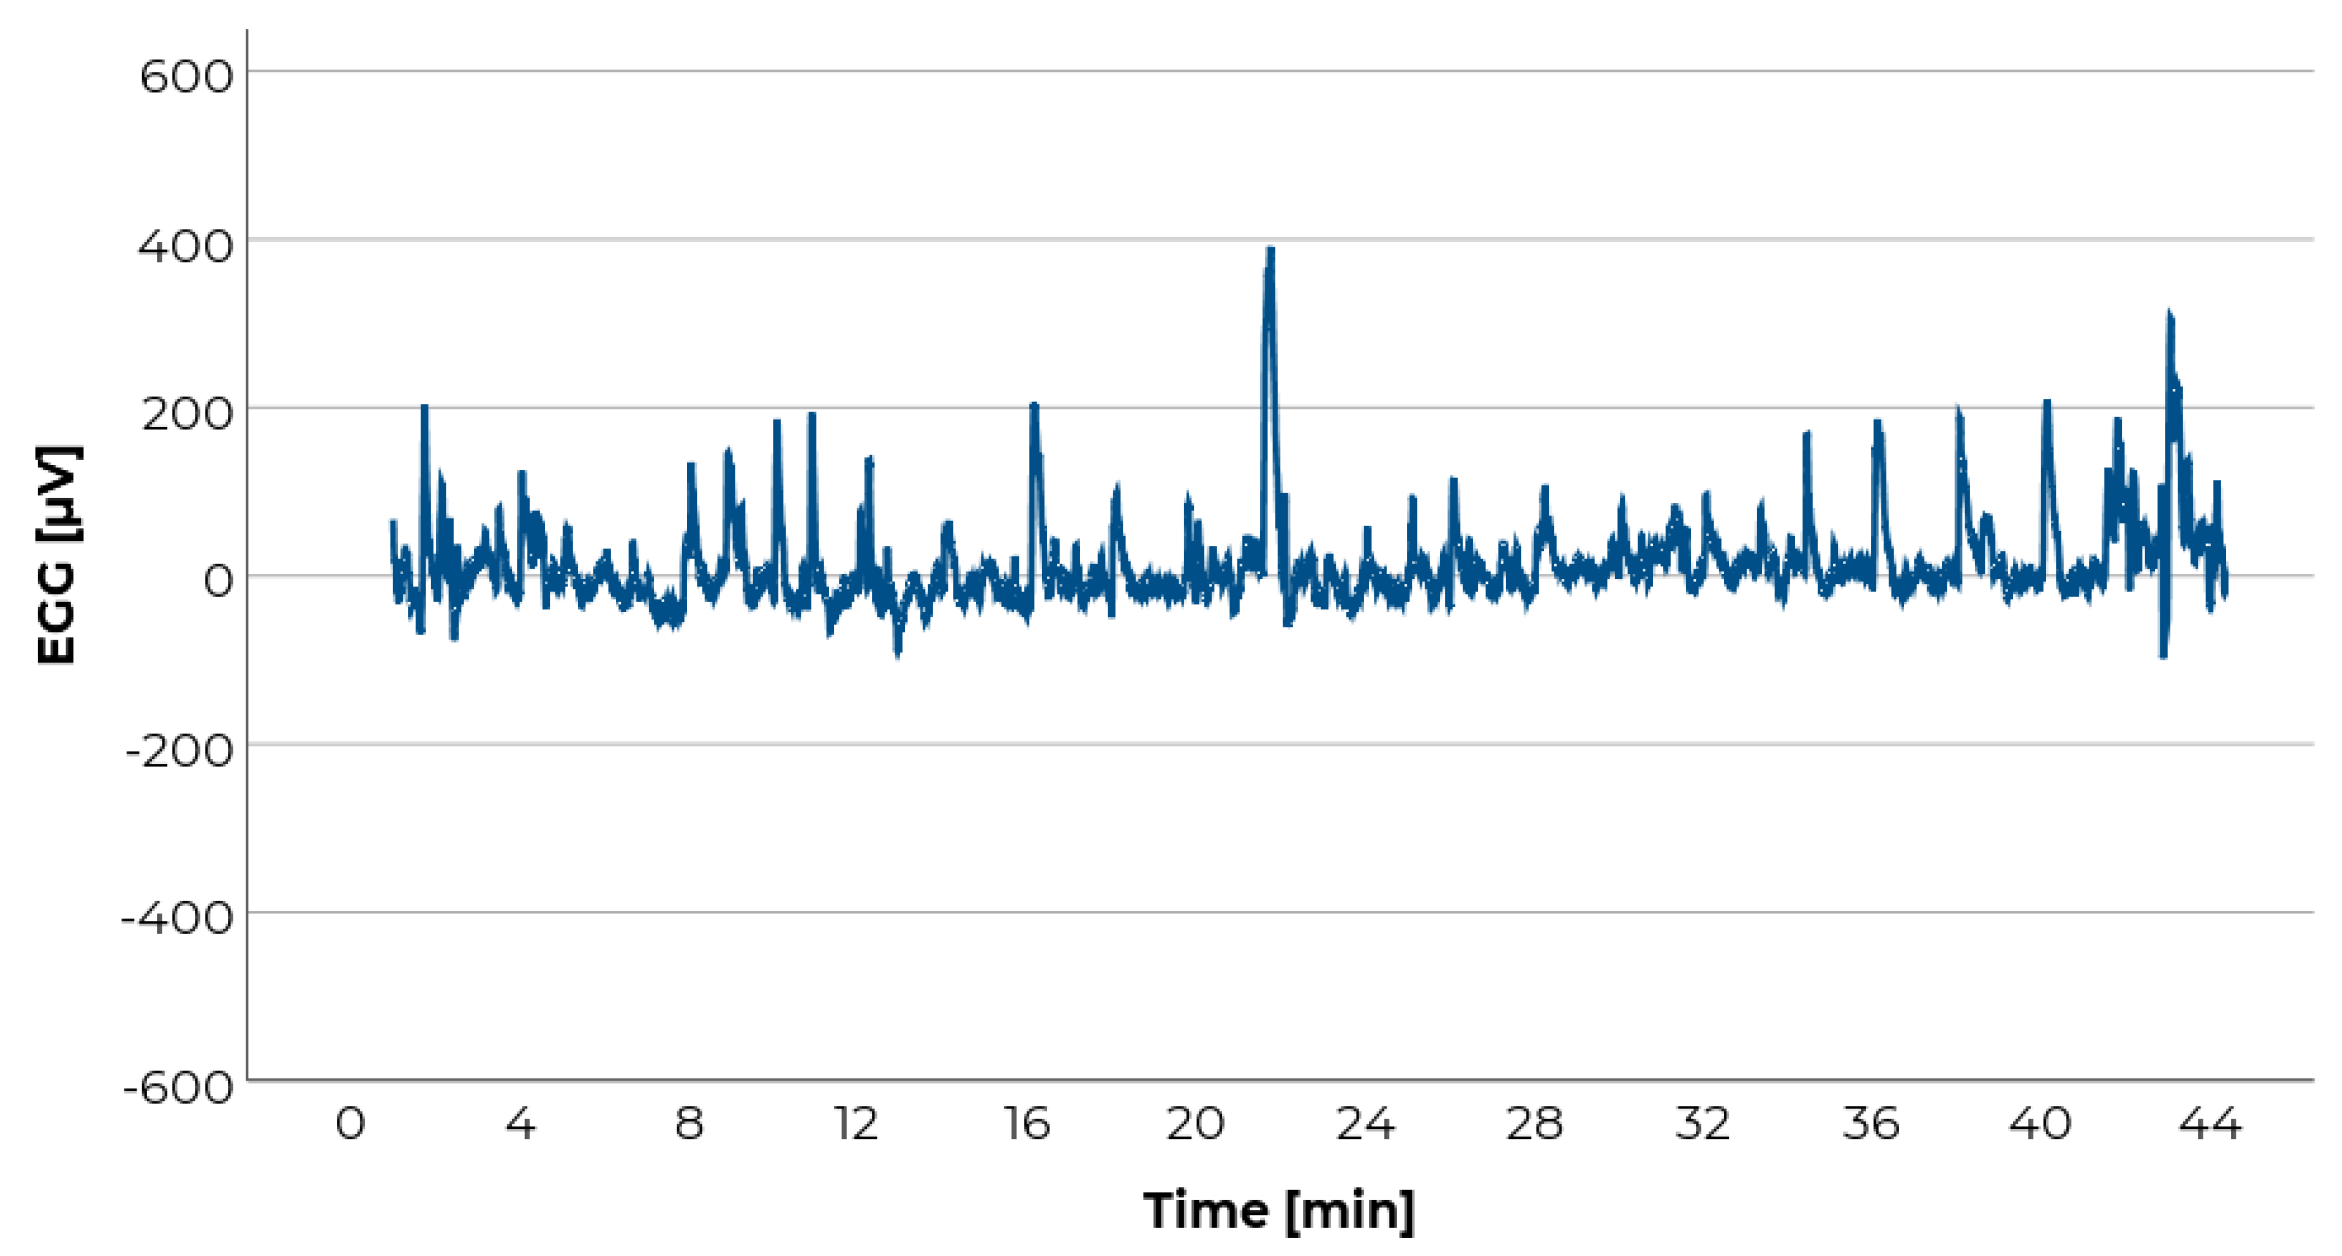
Electrogastrography
3.5. Data Analyses in General
4. Ethics in Motion Sickness Studies
5. Conclusions
Author Contributions
Funding
Acknowledgments
Conflicts of Interest
References
- Tyler, D.B.; Bard, P. Motion sickness. Physiol. Rev. 1949, 29, 311–369. [Google Scholar] [CrossRef] [PubMed]
- Sivak, M.; Schoettle, B. Motion Sickness in Self Driving Vehicles; UMTRI-2015-12; University of Michigan: Ann Arbor, MI, USA, 2015. [Google Scholar]
- Diels, C. Carsickness: Preventive measures. In TRL Published Project Report; TRA: London, UK, 2009. [Google Scholar]
- Dungs, J.; Herrmann, F.; Duwe, D.; Schmidt, A.; Stegmüller, S.; Gaydoul, R.; Peters, P.; Sohl, M. The Value of Time: Nutzerbezogene Service-Potenziale Durch Autonomes Fahren; Fraunhofer-Institut für Arbeitswirtschaft und Organisation IAO, Horváth & Partners: Stuttgart, Germany, 2016. [Google Scholar]
- Yang, Y.; Klinkner, J.N.; Bengler, K. How will the driver sit in an automated vehicle?–The qualitative and quantitative descriptions of non-driving postures (NDPs) when non-driving-related-tasks (NDRTs) are conducted. In Proceedings of the Congress of the International Ergonomics Association, Florence, Italy, 26–30 August 2018; pp. 409–420. [Google Scholar]
- Kato, K.; Kitazaki, S. Improvement of Ease of Viewing Images on an In-vehicle Display and Reduction of Carsickness; 2008-01-0565; SAE: Warrendale, PA, USA, 2008. [Google Scholar]
- Diels, C.; Bos, J.E. Self-driving carsickness. Appl. Ergon. 2016, 53 Pt B, 374–382. [Google Scholar] [CrossRef] [PubMed]
- Wada, T. Motion sickness in automated vehicles. In Proceedings of the 13th International Symposium on Advanced Vehicle Control (AVEC’16), Munich, Germany, 13–16 September 2015; pp. 169–174. [Google Scholar]
- Bos, J.E.; MacKinnon, S.N.; Patterson, A. Motion sickness symptoms in a ship motion simulator: Effects of inside, outside, and no view. Aviat. Space Environ. Med. 2005, 76, 1111–1118. [Google Scholar] [PubMed]
- Kennedy, R.S.; Graybiel, A. The Dial Test: A Standardized Procedure for the Experimental Production of Canal Sickness Symptomatology in a Rotating Environment (NASA-CR-69664); 113 NSAM-930; Naval School of Aviation Medicine: Pensacola, FL, USA, 1965. [Google Scholar]
- Kennedy, R.S.; Lane, N.E.; Berbaum, K.S.; Lilienthal, M.G. Simulator Sickness Questionnaire: An enhanced method for quantifying simulator sickness. Int. J. Aviat. Psychol. 1993, 3, 203–220. [Google Scholar] [CrossRef]
- Golding, J.F. Motion sickness. Handb. Clin. Neurol. 2016, 137, 371–390. [Google Scholar] [CrossRef]
- Graybiel, A.; Wood, C.D.; Miller, E.F.; Cramer, D.B. Diagnostic criteria for grading the severity of acute motion sickness. Aerosp. Med. 1968, 39, 453–455. [Google Scholar]
- Reason, J.T.; Brand, J.J. Motion Sickness; Academic Press: London, UK, 1975. [Google Scholar]
- O’Hanlon, J.F.; McCauley, M.E. Motion sickness incidence as a function of the frequency and acceleration of vertical sinusoidal motion. Aerosp. Med. 1974, 45, 366–369. [Google Scholar]
- Dai, M.; Sofroniou, S.; Kunin, M.; Raphan, T.; Cohen, B. Motion sickness induced by off-vertical axis rotation (OVAR). Exp. Brain Res. 2010, 204, 207–222. [Google Scholar] [CrossRef]
- Donohew, B.E.; Griffin, M.J. Motion sickness: Effect of the frequency of lateral oscillation. Aviat. Space Environ. Med. 2004, 75, 649–656. [Google Scholar]
- Golding, J.F.; Mueller, A.G.; Gresty, M.A. A motion sickness maximum around the 0.2 Hz frequency range of horizontal translational oscillation. Aviat. Space Environ. Med. 2001, 72, 188–192. [Google Scholar]
- Griffin, M.J.; Mills, K.L. Effect of frequency and direction of horizontal oscillation on motion sickness. Aviat. Space Environ. Med. 2002, 73, 537–543. [Google Scholar] [PubMed]
- Howarth, H.V.; Griffin, M.J. Effect of roll oscillation frequency on motion sickness. Aviat. Space Environ. Med. 2003, 74, 326–331. [Google Scholar] [PubMed]
- Lawther, A.; Griffin, M.J. Prediction of the incidence of motion sickness from the magnitude, frequency, and duration of vertical oscillation. J. Acoust. Soc. Am. 1987, 82, 957–966. [Google Scholar] [CrossRef] [PubMed]
- McCauley, M.E.; Royal, J.W.; Wylie, C.D.; O’Hanlon, J.F.; Mackie, R.R. Motion Sickness Incidence: Exploratory Studies of Habituation, Pitch, Roll, and the Refinement of a Mathematical Model; Human Factors Research: Santa Barbara, CA, USA, 1976. [Google Scholar]
- Golding, J.F.; Arun, S.; Wortley, E.; Wotton-Hamrioui, K.; Cousins, S.; Gresty, M.A. Off-vertical axis rotation of the visual field and nauseogenicity. Aviat. Space Environ. Med. 2009, 80, 516–521. [Google Scholar] [CrossRef]
- Donohew, B.E.; Griffin, M.J. Motion sickness with fully roll-compensated lateral oscillation: Effect of oscillation frequency. Aviat. Space Environ. Med. 2009, 80, 94–101. [Google Scholar] [CrossRef]
- Reason, J.T. Motion sickness: Some theoretical and practical considerations. Appl. Ergon. 1978, 9, 163–167. [Google Scholar] [CrossRef]
- Bos, J.E. Motion Perception and Sickness, Eye Movevements and Human Performance. Available online: http://www.jeltebos.info/perception_sickness.htm (accessed on 28 August 2018).
- Cheung, B.; Hofer, K. Lack of gender difference in motion sickness induced by vestibular coriolis cross-coupling. J. Vestib. Res. 2002, 12, 191–200. [Google Scholar]
- Dobie, T.G.; McBride, D.; Dobie, T., Jr.; May, J. The effects of age and sex on susceptibility to motion sickness. Aviat. Space Environ. Med. 2001, 72, 13–20. [Google Scholar]
- Flanagan, M.B.; May, J.G.; Dobie, T.G. Sex differences in tolerance to visually-induced motion sickness. Aviat. Space Environ. Med. 2005, 76, 642–646. [Google Scholar]
- Lentz, J.M.; Collins, W.E. Motion sickness susceptibility and related behavioral characteristics in men and women. Aviat. Space Environ. Med. 1977, 48, 316–322. [Google Scholar]
- Park, A.H.; Hu, S. Gender differences in motion sickness history and susceptibility to optokinetic rotation-induced motion sickness. Aviat. Space Environ. Med. 1999, 70, 1077–1080. [Google Scholar] [PubMed]
- Förstberg, J. Ride Comfort and Motion Sickness in Tilting Trains—Human Responses to Motion Evironments in Train and Simulator Experiments; Royal Institute of Technology: Stockholm, Sweden, 2000. [Google Scholar]
- Golding, J.F.; Kerguelen, M. A comparison of the nauseogenic potential of low-frequency vertical versus horizontal linear oscillation. Aviat. Space Environ. Med. 1992, 63, 491–497. [Google Scholar] [PubMed]
- Griffin, M.J.; Newman, M.M. Visual field effects on motion sickness in cars. Aviat. Space Environ. Med. 2004, 75, 739–748. [Google Scholar]
- Treisman, M. Motion sickness: An evolutionary hypothesis. Science 1977, 197, 493–495. [Google Scholar] [CrossRef] [PubMed]
- Riccio, G.E.; Stoffregen, T.A. An ecological theory of motion sickness und postural instability. Ecol. Psychol. 1991, 3, 195–240. [Google Scholar] [CrossRef]
- Bowins, B. Motion sickness: A negative reinforcement model. Brain Res. Bull. 2010, 81, 7–11. [Google Scholar] [CrossRef]
- Stott, J.R.R. Mechanisms and Treatment of Motion Illness. In Nausea and Vomiting: Mechanisms and Treatment; Davis, C.J., Lake-Bakaar, G.V., Grahame-Smith, D.G., Eds.; Springer: Berlin, Germany, 1986; pp. 110–129. [Google Scholar]
- Reason, J.T. Motion sickness adaptation: A neural mismatch model. J. R. Soc. Med. 1978, 71, 819–829. [Google Scholar] [CrossRef]
- Ramulu, S.H.S. Relationship of Motion Sickness with Mental Demand and Cold Sweating. Master’s Thesis, University of Technology, Eindhoven, The Netherlands, 2019. [Google Scholar]
- Bohrmann, D.; Lehnert, K.; Scholly, U.; Bengler, K. Kinetosis as a Challenge of Future Mobility Concepts and Highly Automated Vehicles. In Proceedings of the 27th Aachen Colloquium Automobile and Engine Technology, Aachen, Germany, 26 November 2018. [Google Scholar]
- Baltodano, S.; Sibi, S.; Martelaro, N.; Gowda, N.; Ju, W. The RRADS platform: A real road autonomous driving simulator. In Proceedings of the 7th International Conference on Automotive User Interfaces and Interactive Vehicular Applications, Nottingham, UK, 1–3 September 2015; pp. 281–288. [Google Scholar]
- Naujoks, F.; Purucker, C.; Wiedemann, K.; Marberger, C. Noncritical State Transitions during Conditionally Automated Driving on German Freeways: Effects of Non–Driving Related Tasks on Takeover Time and Takeover Quality. Hum. Factors 2019, 61, 596–613. [Google Scholar] [CrossRef]
- Kiss, M.; Schmidt, G.; Babbel, E. Das Wizard of Oz Fahrzeug: Rapid Prototyping und Usability Testing von zukünftigen Fahrerassistenzsystemen. In Proceedings of the 3. Tagung Aktive Sicherheit durch Fahrerassistenz, Garching, Germany, 7–8 April 2008. [Google Scholar]
- Bengler, K.; Omozik, K.; Müller, A.I. The Renaissance of Wizard of Oz (WoOz)―Using the WoOz methodology to prototype automated vehicles. In Proceedings of the Human Factors and Ergonomics Society Europe Chapter 2019 Annual Conference; de Waard, D., Toffetti, A., Pietrantoni, L., Franke, T., Petiot, J.-F., Dumas, C., Botzer, A., Onnasch, L., Milleville, L., Mars, F., Eds.; HFES: Nantes, France, 2020. [Google Scholar]
- Kaptein, N.A.; Theeuwes, J.; Van Der Horst, R. Driving simulator validity: Some considerations. Transp. Res. Record 1996, 1550, 30–36. [Google Scholar] [CrossRef]
- Carsten, O.; Jamson, A.H. Driving simulators as research tools in traffic psychology. In Handbook of Traffic Psychology; Porter, B.E., Ed.; Elsevier Academic Press: San Diego, CA, USA, 2011; pp. 87–96. [Google Scholar] [CrossRef]
- Stoner, H.A.; Fisher, D.L.; Mollenhauer, M. Simulator and scenario factors influencing simulator sickness. In Handbook of Driving Simulation for Engineering, Medicine, and Psychology; Fisher, D.L., Rizzo, M., Caird, J., Lee, J.D., Eds.; Taylor & Francis: Boca Raton, FL, USA, 2011; pp. 13.11–13.18. [Google Scholar]
- Blaauw, G.J. Driving experience and task demands in simulator and instrumented car: A validation study. Hum. Factors 1982, 24, 473–486. [Google Scholar] [CrossRef]
- Mullen, N.; Charlton, J.; Devlin, A.; Bedard, M. Simulator validity: Behaviors observed on the simulator and on the road. In Handbook of Driving Simulation for Engineering, Medicine and Psychology; Fisher, D.L., Rizzo, M., Caird, J., Lee, J.D., Eds.; Taylor & Francis: Boca Raton, FL, USA, 2011; pp. 13.11–13.18. [Google Scholar]
- Schmidt, E.; Emmermann, B.; Venrooij, J.; Reinprecht, K. Occurrence of motion sickness during highway and inner-city drives. In Proceedings of the Human Factors and Ergonomics Society Europe Chapter 2018 Annual Conference; de Waard, D., Brookhuis, K., Coelho, D., Fairclough, S., Manzey, D., Naumann, A., Onnasch, L., Röttger, S., Toffetti, A., Wiczorek, R., Eds.; HFES: Berlin, Germany, 2019. [Google Scholar]
- Salter, S.; Diels, C.; Herriotts, P.; Kanarachos, S.; Thake, D. Motion sickness in automated vehicles with forward and rearward facing seating orientations. Appl. Ergon. 2019, 78, 54–61. [Google Scholar] [CrossRef] [PubMed]
- Feenstra, P.J.; Bos, J.E.; van Gent, R.N.H.W. A visual display enhancing comfort by counteracting airsickness. Displays 2011, 32, 194–200. [Google Scholar] [CrossRef]
- Karjanto, J.; Yusof, N.M.; Wang, C.; Terken, J.; Delbressine, F.; Rauterberg, M. The effect of peripheral visual feedforward system in enhancing situation awareness and mitigating motion sickness in fully automated driving. Transp. Res. Part F 2018, 58, 678–692. [Google Scholar] [CrossRef]
- Kuiper, O.X.; Bos, J.E.; Schmidt, E.A.; Diels, C.; Wolter, S. Knowing What’s Coming: Unpredictable Motion Causes More Motion Sickness. Hum. Factors 2019. [Google Scholar] [CrossRef] [PubMed]
- Naujoks, F.; Befelein, D.; Wiedemann, K.; Neukum, A. A review of non-driving-related tasks used in studies on automated driving. In Proceedings of the International Conference on Applied Human Factors and Ergonomics, Los Angeles, CA, USA, 17–21 July 2017; pp. 525–537. [Google Scholar]
- Bohrmann, D. Probandenstudie-Vom Fahrer zum Passagier. ATZextra 2019, 24, 36–39. [Google Scholar] [CrossRef]
- Reason, J.T. Relations between motion sickness susceptibility, the spiral after-effect and loudness estimation. Br. J. Psychol. 1968, 59, 385–393. [Google Scholar] [CrossRef]
- Zhang, L.L.; Wang, J.Q.; Qi, R.R.; Pan, L.L.; Li, M.; Cai, Y.L. Motion Sickness: Current Knowledge and Recent Advance. CNS Neurosci. Ther. 2015, 22, 15–24. [Google Scholar] [CrossRef]
- Mirabile, C.S., Jr.; Glueck, B.C.; Stroebel, C.F.; Pitblado, C. Susceptibility to motion sickness and ego closeness, ego distance as measured by the autokinetic response tendency. Neuropsychobiology 1977, 3, 193–198. [Google Scholar] [CrossRef]
- Paillard, A.C.; Quarck, G.; Paolino, F.; Denise, P.; Paolino, M.; Golding, J.F.; Ghulyan-Bedikian, V. Motion sickness susceptibility in healthy subjects and vestibular patients: Effects of gender, age and trait-anxiety. J. Vestib. Res. Equilib. Orientat. 2013, 23, 203–209. [Google Scholar] [CrossRef]
- Keshavarz, B.; Hecht, H. Validating an efficient method to quantify motion sickness. Hum. Factors 2011, 53, 415–426. [Google Scholar] [CrossRef]
- Cowings, P.S.; Suter, S.; Toscano, W.B.; Kamiya, J.; Naifeh, K. General autonomic components of motion sickness. Psychophysiology 1986, 23, 542–551. [Google Scholar] [CrossRef] [PubMed]
- Hu, S.; Stern, R.M.; Vasey, M.W.; Koch, K.L. Motion sickness and gastric myoelectric activity as a function of speed of rotation of a circular vection drum. Aviat. Space Environ. Med. 1989, 60, 411–414. [Google Scholar] [PubMed]
- Kim, Y.Y.; Kim, H.J.; Kim, E.N.; Ko, H.D.; Kim, H.T. Characteristic changes in the physiological components of cybersickness. Psychophysiology 2005, 42, 616–625. [Google Scholar] [CrossRef] [PubMed]
- LaCount, L.T.; Barbieri, R.; Park, K.; Kim, J.; Brown, E.N.; Kuo, B.; Napadow, V. Static and dynamic autonomic response with increasing nausea perception. Aviat. Space Environ. Med. 2011, 82, 424–433. [Google Scholar]
- Mekjavic, I.B.; Tipton, M.J.; Gennser, M.; Eiken, O. Motion sickness potentiates core cooling during immersion in humans. J. Physiol. 2001, 535, 619–623. [Google Scholar] [CrossRef]
- Benson, A.J. Motion Sickness. In Medical Aspects of Harsh Environments; Pandolf, K., Burr, R., Eds.; Walter Reed Army Medical Center: Washington, DC, USA, 2002; Volume 2, pp. 611–1204. [Google Scholar]
- Nalivaiko, E.; Rudd, J.A.; So, R.H. Motion sickness, nausea and thermoregulation: The “toxic” hypothesis. Temperature 2014, 1, 164–171. [Google Scholar] [CrossRef]
- Meusel, C.R. Exploring Mental Effort and Nausea via Electrodermal Activity within Scenario-Based Tasks. Master’s Thesis, Iowa State University, Ames, IA, USA, 2014. [Google Scholar]
- Stern, R.M.; Koch, K.L.; Leibowitz, H.W.; Lindblad, I.M.; Shupert, C.L.; Stewart, W.R. Tachygastria and motion sickness. Aviat. Space Environ. Med. 1985, 56, 1074–1077. [Google Scholar]
- Stern, R.M.; Koch, K.L.; Stewart, W.R.; Lindblad, I.M. Spectral analysis of tachygastria recorded during motion sickness. Gastroenterology 1987, 92, 92–97. [Google Scholar] [CrossRef]
- Nobel, G.; Eiken, O.; Tribukait, A.; Kölegård, R.; Mekjavic, I.B. Motion sickness increases the risk of accidental hypothermia. Eur. J. Appl. Physiol. 2006, 98, 48–55. [Google Scholar] [CrossRef]
- Nobel, G.; Tribukait, A.; Mekjavic, I.B.; Eiken, O. Effects of motion sickness on thermoregulatory responses in a thermoneutral air environment. Eur. J. Appl. Physiol. 2012, 112, 1717–1723. [Google Scholar] [CrossRef]
- Sund-Levander, M.; Forsberg, C.; Wahren, L.K. Normal oral, rectal, tympanic and axillary body temperature in adult men and women: A systematic literature review. Scand. J. Caring Sci. 2002, 16, 122–128. [Google Scholar] [CrossRef] [PubMed]
- Nobel, G. Effects of Motion Sickness on Human Thermoregulatory Mechanisms; KTH: Stockholm, Sweden, 2010. [Google Scholar]
- Boucsein, W. Electrodermal Activity; Springer Science & Business Media: New York, NY, USA, 2012. [Google Scholar]
- Verhagen, M.A.; Van Schelven, L.J.; Samsom, M.; Smout, A.J. Pitfalls in the analysis of electrogastrographic recordings. Gastroenterology 1999, 117, 453–460. [Google Scholar] [CrossRef] [PubMed]
- Cheung, B.; Vaitkus, P. Perspectives of electrogastrography and motion sickness. Brain Res. Bull. 1998, 47, 421–431. [Google Scholar] [CrossRef]
- Farmer, A.D.; Ban, V.F.; Coen, S.J.; Sanger, G.J.; Barker, G.J.; Gresty, M.A.; Giampietro, V.P.; Williams, S.C.; Webb, D.L.; Hellström, P.M. Visually induced nausea causes characteristic changes in cerebral, autonomic and endocrine function in humans. J. Physiol. 2015, 593, 1183–1196. [Google Scholar] [CrossRef] [PubMed]
- Imai, K.; Kitakoji, H.; Sakita, M. Gastric arrhythmia and nausea of motion sickness induced in healthy Japanese subjects viewing an optokinetic rotating drum. J. Physiol. Sci. 2006, 56, 341–345. [Google Scholar] [CrossRef] [PubMed]
- Yin, J.; Chen, J.D. Electrogastrography: methodology, validation and applications. J. Neurogastroenterol. Motil. 2013, 19, 5. [Google Scholar] [CrossRef]
- Uijtdehaage, S.H.; Stern, R.M.; Koch, K.L. Effects of Scopolamine on Autonomic Profiles Underlying Motion Sickness Susceptibility. Aviat. Space Environ. Med. 1993, 64, 1–8. [Google Scholar]
- American Psychological Association. Ethical Principles of Psychologists and Code of Conduct. Available online: https://www.apa.org/ethics/code/index (accessed on 4 December 2019).
- Charlton, E. Ethical guidelines for pain research in humans. Pain 1995, 63, 277–278. [Google Scholar] [CrossRef]


| FMS | MISC | Symptom-Specific Likert-Scales | MSQ | |
|---|---|---|---|---|
| Duration of application | ++ | ++ | + | - |
| Informational content | - | o | + | ++ |
| Scale | interval | ordinal | interval | ordinal |
| Prevalence and Development of Motion Sickness | Countermeasures for Motion Sickness | |
|---|---|---|
| Setting |
|
|
| Participants’ task |
|
|
| Sample |
|
|
© 2020 by the authors. Licensee MDPI, Basel, Switzerland. This article is an open access article distributed under the terms and conditions of the Creative Commons Attribution (CC BY) license (http://creativecommons.org/licenses/by/4.0/).
Share and Cite
Mühlbacher, D.; Tomzig, M.; Reinmüller, K.; Rittger, L. Methodological Considerations Concerning Motion Sickness Investigations during Automated Driving. Information 2020, 11, 265. https://doi.org/10.3390/info11050265
Mühlbacher D, Tomzig M, Reinmüller K, Rittger L. Methodological Considerations Concerning Motion Sickness Investigations during Automated Driving. Information. 2020; 11(5):265. https://doi.org/10.3390/info11050265
Chicago/Turabian StyleMühlbacher, Dominik, Markus Tomzig, Katharina Reinmüller, and Lena Rittger. 2020. "Methodological Considerations Concerning Motion Sickness Investigations during Automated Driving" Information 11, no. 5: 265. https://doi.org/10.3390/info11050265
APA StyleMühlbacher, D., Tomzig, M., Reinmüller, K., & Rittger, L. (2020). Methodological Considerations Concerning Motion Sickness Investigations during Automated Driving. Information, 11(5), 265. https://doi.org/10.3390/info11050265