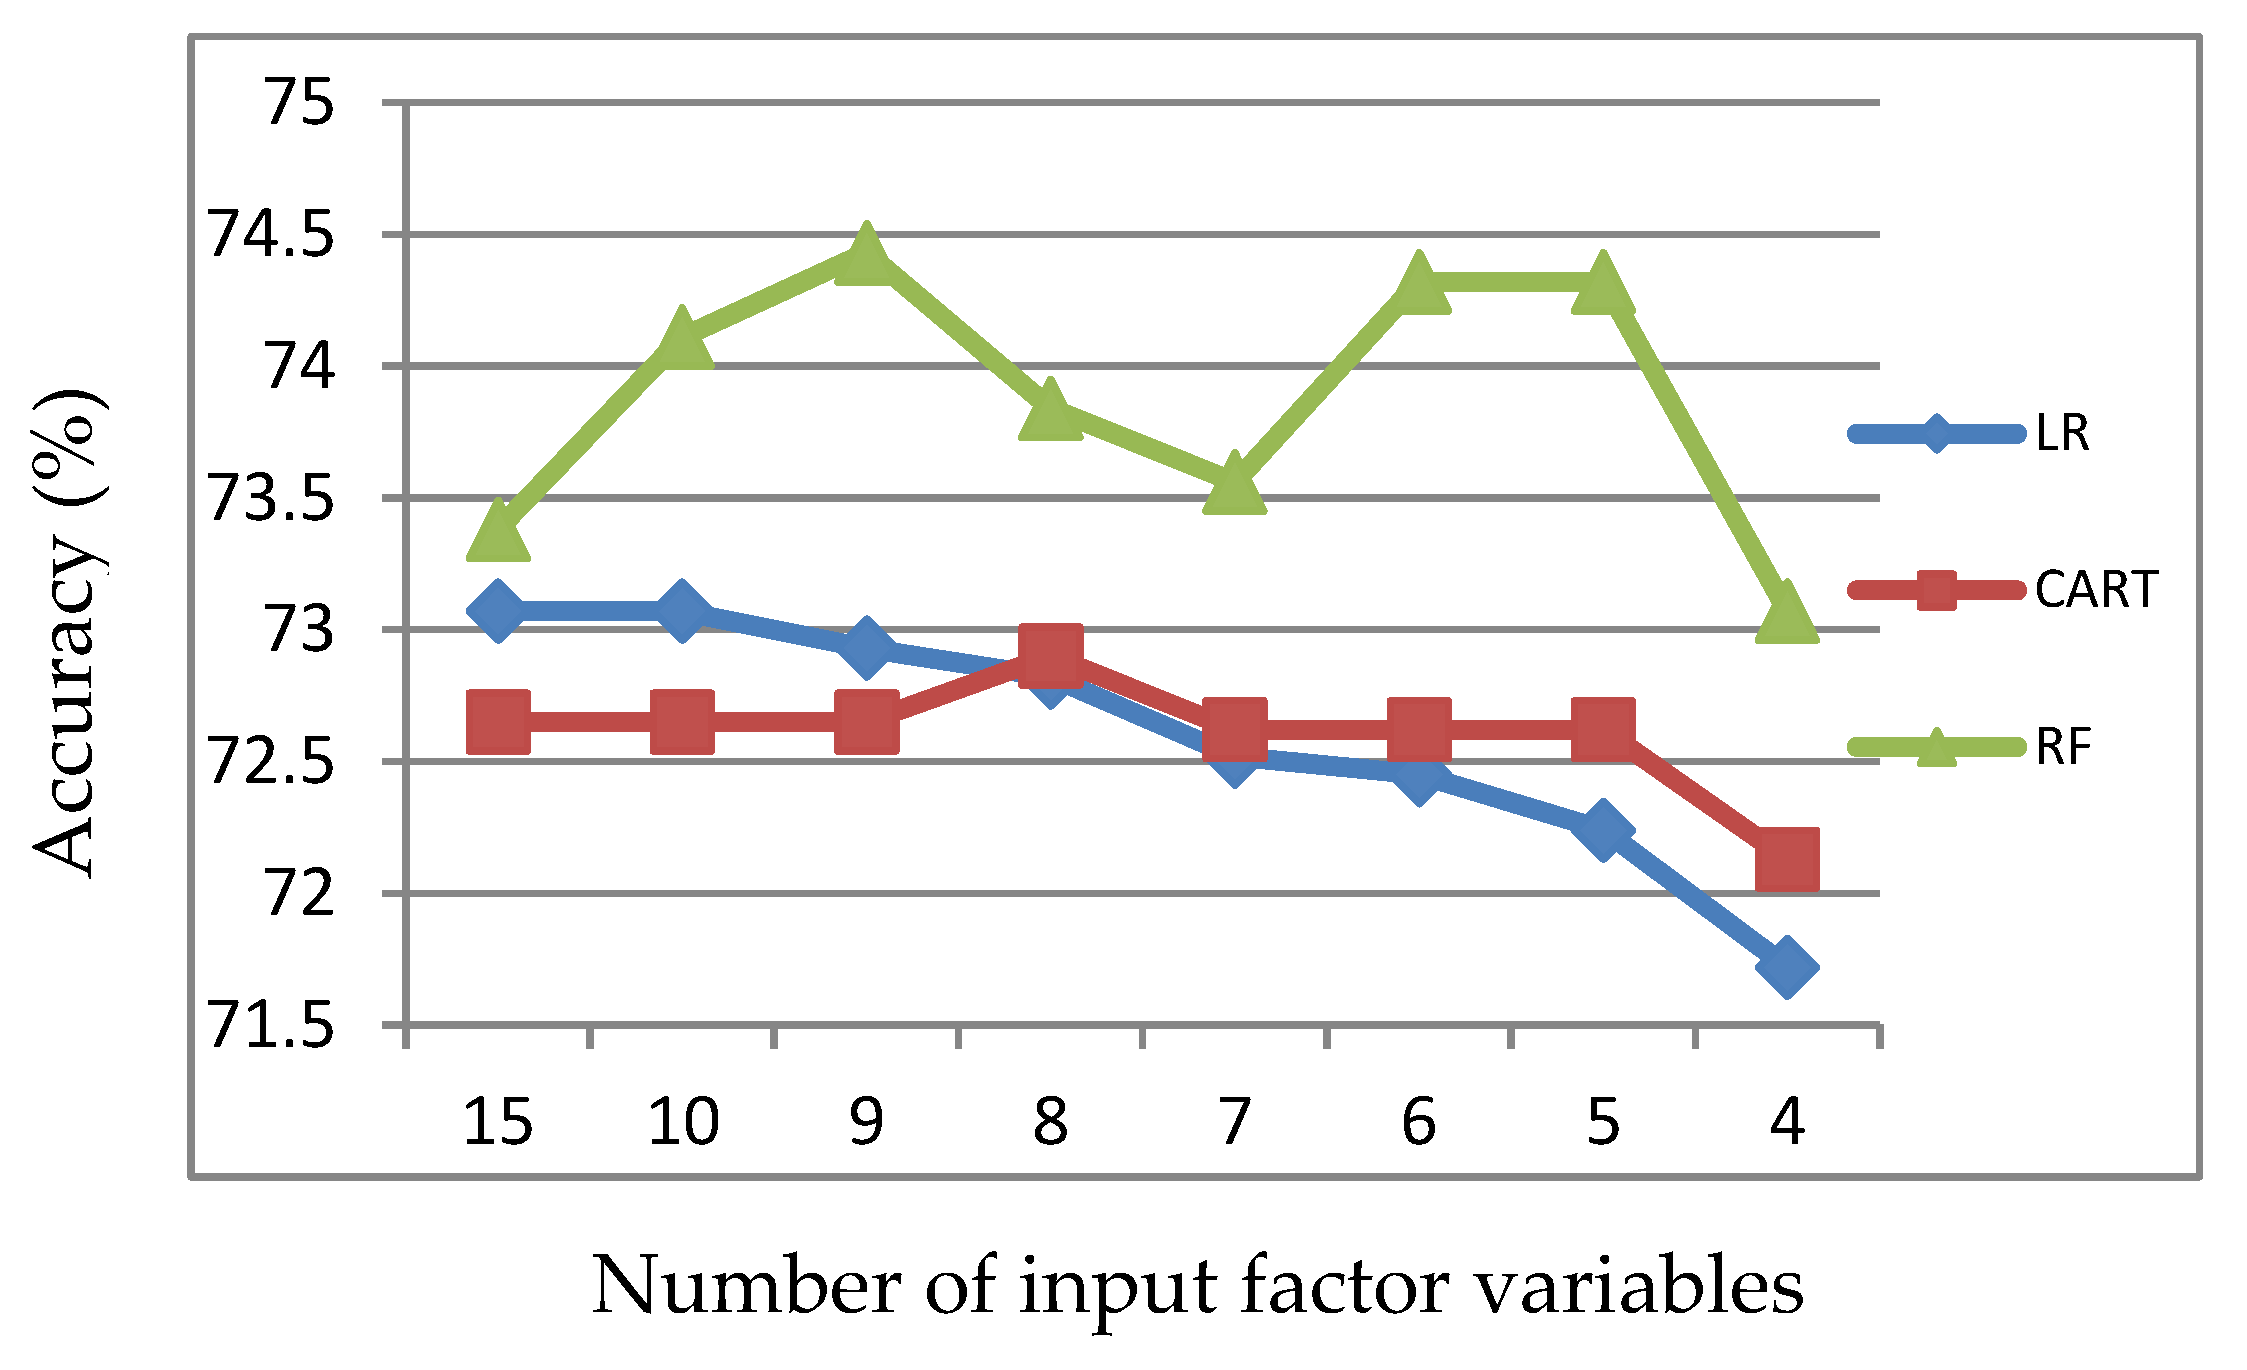
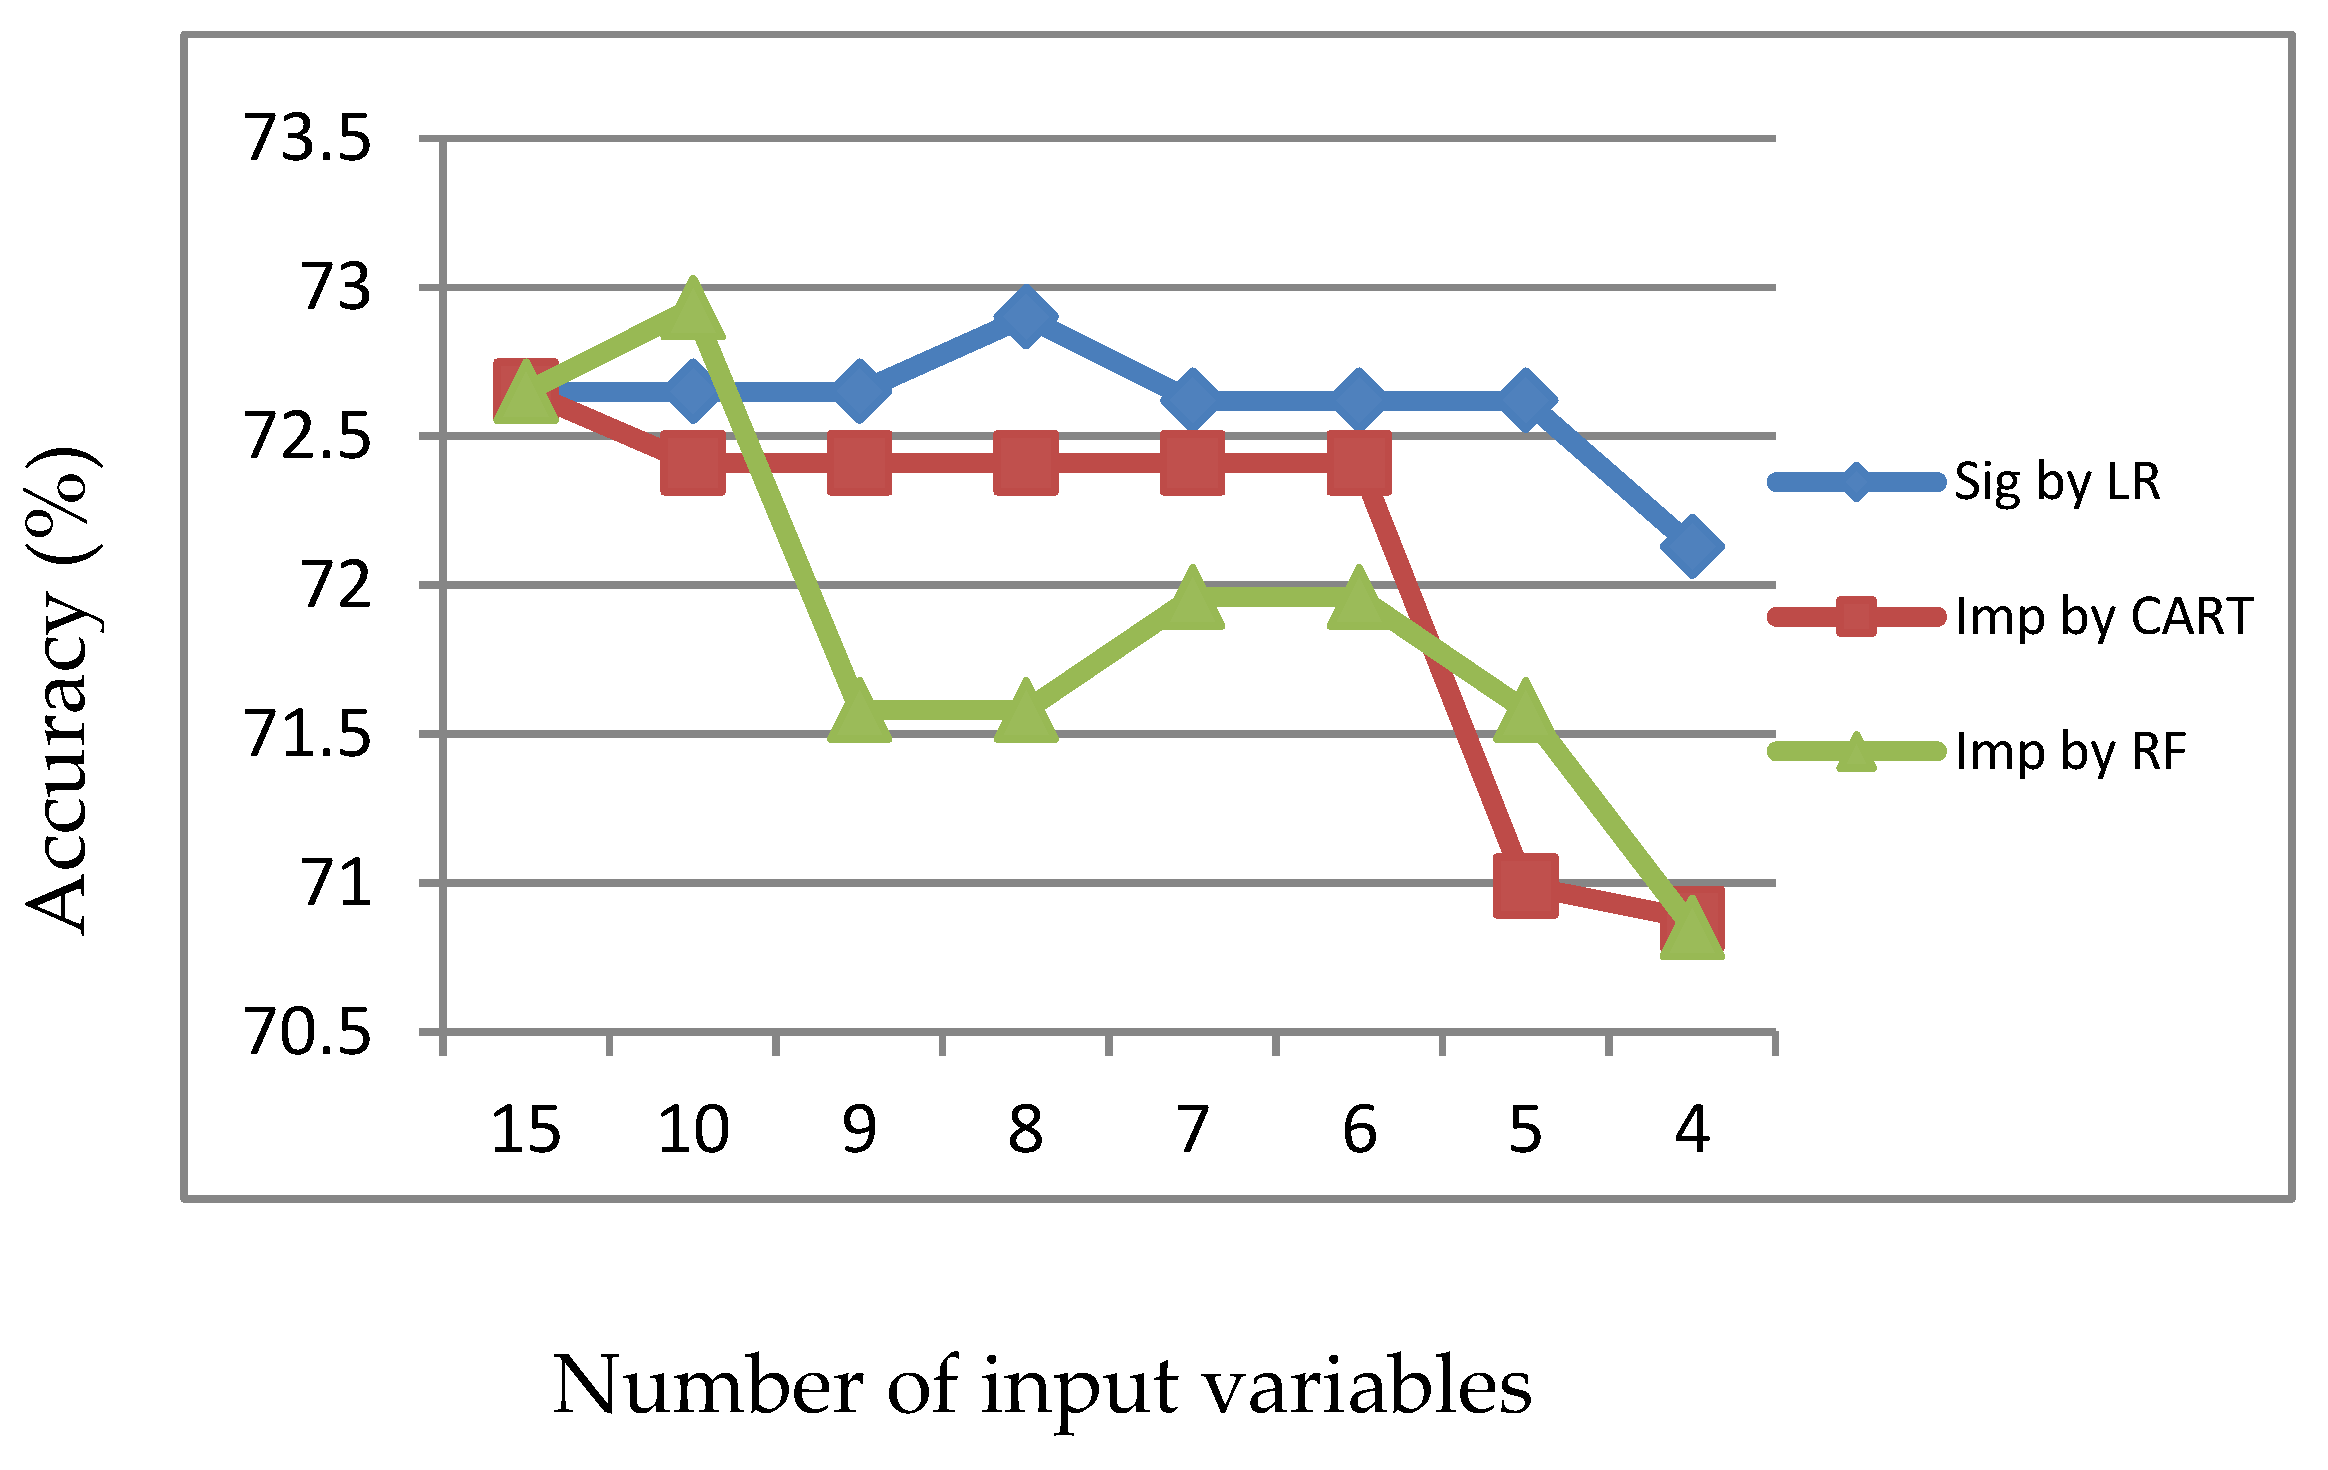
Article

Modeling Road Accident Severity with Comparisons of Logistic Regression, Decision Tree and Random Forest

Department of Transportation and Logistics Management, National Chiao Tung University, Hsinchu City 30010, Taiwan
*
Author to whom correspondence should be addressed.
Information 2020, 11(5), 270; https://doi.org/10.3390/info11050270
Submission received: 18 April 2020 / Revised: 10 May 2020 / Accepted: 14 May 2020 / Published: 18 May 2020
(This article belongs to the Section Information Applications)

Abstract

:
To reduce the damage caused by road accidents, researchers have applied different techniques to explore correlated factors and develop efficient prediction models. The main purpose of this study is to use one statistical and two nonparametric data mining techniques, namely, logistic regression (LR), classification and regression tree (CART), and random forest (RF), to compare their prediction capability, identify the significant variables (identified by LR) and important variables (identified by CART or RF) that are strongly correlated with road accident severity, and distinguish the variables that have significant positive influence on prediction performance. In this study, three prediction performance evaluation measures, accuracy, sensitivity and specificity, are used to find the best integrated method which consists of the most effective prediction model and the input variables that have higher positive influence on accuracy, sensitivity and specificity.

1. Introduction

Since road accidents occur frequently and result in property damage, injury, and even death, all of which impose a high cost on society, researchers have explored the correlated factors and built prediction models by utilizing different research techniques, so as to propose appropriate measures for prevention. The statistical model of logistic regression (LR) has been the most popular technique in accident severity research in the past, because the relationship between accidents and correlated factors can be clearly identified [1]. LR provides information on the parameter estimates and their standard errors, along with some notion of their significance and some interpretation of the model through odds ratios and their confidence intervals [2]. For instance, Kim et al. [3] developed a logistic model to explain the likelihood of motorists being at fault in collisions with cyclists. Al-Ghamdi [4] used logistic regression to estimate the relationship between correlated factors and accident severity. Besliu-Ionescu et al. [5] and Zhu et al. [6] discussed the prediction performance of logistic regression. However, the above-mentioned research lacks the discussion of how significant variables influence the prediction performance.
In recent years, there has been increasing interest in employing the nonparametric classification and regression tree (CART) technique to analyze transportation-related problems, for instance for modeling travel demand [7], driver behavior [8], and traffic accident analysis [9,10,11,12,13,14,15,16,17,18]. Furthermore, CART has been shown to be a powerful tool, especially in dealing with prediction and classification problems [19,20]. CART uses a nonparametric procedure to build a graphical model that provides information on parameter values, such as important variables, but provides no notion of their significance [2]. Harb et al. [21] explored the important factors associated with crash avoidance maneuvers. However, the above-mentioned research seems to lack further discussion of how important variables influence the prediction performance.
Random forest (RF), which is an ensemble of individual trees (600 trees in this study) developed by the CART algorithm, is a powerful ensemble-learning method proposed by Breiman [22]. An aggregate prediction achieves better accuracy than any one of the constituent trees. RF in particularly, and the multiple-predictor approach in general, tend to be the most accurate classification and regression techniques currently at the disposal of data scientists [22,23]. Furthermore, RF is a relatively new technique for exploring the importance ranking of variables [24,25]. Recent works in transportation by Abdel-Aty et al. [26] employed the random forests algorithm to decide the variables of importance. Speiser et al. [27] compared the RF based variable selection methods for classification. However, the above-mentioned research seems to lack further discussion of how important variables influence the prediction performance.
Regarding the relationship between independent variables and dependent variables (severity in this study) in each model, LR can illustrate the significance of each variable, while CART and RF can reveal variable importance rankings. Due to the nature of the CART and RF modeling procedures, significance and p-values cannot be explicitly determined as in the logistic regression models. It can be regarded, however, as an implicit part of the modeling process, where cross-validation for CART models and RF models acts as a surrogate for selecting sets of significant variables in the model. The variable importance rankings can also act as a surrogate for significance [2]. Base on the above statement, comparing influences of significant variables and important variables on the prediction performance is an issue worth studying.
After randomly dividing sample data into training and validation datasets, LR, CART and RF can demonstrate their prediction performance, including accuracy, sensitivity and specificity [28,29,30,31,32], and can identify significant variables (identified by LR) and important ones (identified by CART or RF), respectively. In previous studies, the comparison of prediction capability of LR with CART [29] and CART with RF [30] were conducted. Prediction capability was recognized as the important strength of CART and RF [19,20,22,23], and RF was the most effective prediction method [22,23]. This paper further compares the prediction performance of LR, CART and RF simultaneously, and the influence of significant variables and important variables on accuracy, sensitivity and specificity. It then explores the most suitable integrated method, and selects suitable input variables for classifying road accident severity. Provided that less input variables are used for classifying the severity of road accidents, the cost of data collection may be reduced.

2. Modeling Methods and Data

2.1. Modeling Methods

In this study, accident severity analysis is performed by using IBM Modeler 18.0 software, which can run several models including LR, CART, and RF. In LR, the logit is the natural logarithm of the odds or the likelihood ratio that the dependent variable is 1 (serious accident) as opposed to 0 (minor accident). The probability p of a serious accident is given by
Y = logit = ln ( P 1 P ) = β X
where Y is the dependent variable (accident severity; Y = 1 , if severity is serious; Y = 0 , if severity is minor), β is a vector of parameters to be estimated, and X is a vector of independent variables [33]. The methodology of CART, which is outlined extensively by Breiman et al. [34], and the building of a CART model mainly consist of three steps: (1) tree growing; (2) tree pruning; and (3) selecting an optimal tree from the pruned trees [1]. The random forest algorithm was developed by Breiman [22]. With respect to the algorithm of the RF method, if RF builds N trees (600 trees in this study), then the algorithm of each N iterations consists of four steps: (1) selection of training data using the bootstrap method; (2) growing the tree fully; (3) attribute selection randomly; and (4) overall prediction based on majority vote (classification) from all individually trained trees [35].
In each analysis employing LR, CART and RF, the accident data are randomly divided into two groups, a training data set and validation data set, with a specific ratio (70/30 in this study) [28]. The larger dataset (training dataset) is used for training the three models, while the smaller dataset (validation dataset) is used for model validation.
Based on the p-values of the t-tests, the significance of each variable is one of the outputs estimated by LR. The significance represents the degree of influence of each variable on accident severity. In other words, significant variables (p-value < 0.05 in this study) will influence accident severity in an obvious manner. A measure of variable importance given by CART can be obtained by observing the drop in the error rate when another variable is used instead of the primary split. In general, the more frequently a variable appears as a primary or surrogate split, the higher the importance score assigned [2]. Variable importance scores for RF can be computed by measuring the increase in prediction error if the values of a variable under question are permuted across the out-of-bag observations. This score is computed for each constituent tree, averaged across the entire ensemble, and divided by the standard deviation [36].

2.2. Evaluation of Prediction Performance

The purpose of this study focuses on exploring an integrated method for promoting prediction performance of models and reducing the cost of collecting data by comparing the prediction performance of LR, CART and RF with input of different groups of factor variables. There are three evaluation measures of prediction performance in this study, namely, accuracy, sensitivity and specificity.
Accuracy measures the proportion of actual positives plus actual negatives that are correctly identified in validation subset. Sensitivity measures the proportion of actual positives that are correctly identified. Specificity measures the proportion of actual negatives that are correctly identified. Accuracy pursues the entire collection of classification. Sensitivity quantifies the avoiding of false negatives (positives wrongly classified as negatives), and specificity does the same for false positives (negatives wrongly classified as positives).
In this study, serious accidents are set as positives, and minor accidents are set as negatives. Mathematically, accuracy, sensitivity and specificity of the test can respectively be written as:
A c c u r a c y = T P + T N T P + F P + T N + F N
S e n s i t i v i t y = T P T P + F N
S p e c i f i c i t y = T N T N + F P
where TP (true positive) and TN (true negative) are the numbers of accidents that are correctly classified, and FP (false positive) and FN (false negative) are the numbers of accidents incorrectly classified [28,29,30,31].

2.3. Data

2.3.1. Selecting Target Data

On Taiwan’s highways, each road accident is recorded in detail by the police with digitized information. The recorded information includes accident severity (fatal, injury, and property damage only), and several correlated factors (individual and environmental attributes). For the purpose of exploring the correlated factors and building efficient prediction models, this study selects 18 target data points from each accident drawn from Taiwan’s highway traffic accident investigation reports for the years 2015 to 2019, including severity and 17 correlated factors [33,37]. To ensure that the result of the LR model is not affected by multicollinearity of variables, the data of 17 initial factors are checked for multicollinearity by the Spearman analysis method of SPSS software. It is found that the absolute value of the Spearman correlation coefficient between a couple of variables, “major cause” and “collision type”, and between another couple of variables, “weather condition” and “surface condition”, are both higher than 0.3; thus, the variables in the above two pairs are moderately or strongly correlated respectively. Finally, the “major cause” and “weather condition” are retained for analysis, and “collision type” and “surface condition” are deleted, then the variables of severity and 15 correlated factors are input into the following models for analysis. In addition, the multicollinearity metric is shown in Table 1.

2.3.2. Preprocessing Data

Each variable among the above-mentioned data points is discrete (categorical) except for the variable “driver age”, which is then discretized into reasonable intervals. In the initial road accident records, the categories of road accident severity include fatality, injury and property damage. A road accident may consist of one severity category or multiple severity categories. In this study, if a road accident includes fatality, its severity is classified as fatality initially. If a road accident includes injury but no fatality, its severity is classified as injury initially. If a road accident includes property damage but no fatality or injury, its severity is classified as property damage only initially. To overcome the small number of observations of fatal accidents, which may lead to unreasonable analytical results, both fatality (344 cases) and injury accidents (4392 cases) are grouped into “serious accidents” (4736 cases); accidents with property damage only are categorized as “minor accidents” [37]. Then, to ensure a balance of accident amounts between different classifications of severity, 4736 minor accidents are sampled at random, in order to match the number of serious accidents. Therefore, in this study, the road accident severity is categorized into two classes, including “serious accidents” (fatality and injury) and “minor accidents” (property damage only). Moreover, the classifications of some other variables are similarly appropriately merged.
After discretization, grouping and screening, the 16 variables (target data) are briefly described and preliminary summarized in Table 2.

3. Results

After running several models of LR, CART, and RF by using IBM Modeler 18.0 software, the results of exploring significant variables identified by LR and important variables identified by CART or RF are illustrated in Section 3.1. In this study, 15 original variables and 10 to 4 significant variables identified by LR and 10 to 4 important variables identified by CART or RF (total 22 sets of variables) are input into LR, CART and RF models, respectively, for comparisons. In Section 3.2, accuracy, sensitivity and specificity of each set of variables are summarized for comparing the results of classification by using LR, CART, and RF. Section 3.3 presents the comparisons in terms of accuracy, sensitivity and specificity. Moreover, the odds ratios of LR with the 15 original variables are presented in Section 3.4. The odds ratio reveals the relative correlation of each value of a given variable with the specific road accident severity. The rules generated CART with the 15 original variables are presented in Section 3.5. Rules of CART indicate the relationships between variables and road accident severity.

3.1. Significant and Important Variables

After conducting LR, CART and RF with input of the 15 original factor variables using the whole dataset, ten significant variables are identified by LR and two groups of ten important variables are identified by CART or RF respectively, as listed in Table 3.

3.2. Comprehensive Comparison of Prediction Performance of LR, CART and RF

3.2.1. Accuracy, Sensitivity and Specificity of LR, CART and RF with Input of the 15 Original Variables

By running LR, CART and RF models with input of the 15 original variables, accuracy of validation datasets of those models are obtained. The results indicate that the three models with input of the 15 original variables exhibit reasonably good performance (see Table 4), and the model developed by RF (73.38%) has higher accuracy than LR (73.07%) and CART (72.65%). In addition, the specificity of RF (72.95%) is higher than CART (72.43%) and LR (71.79%), while the sensitivity of LR (74.48%) is higher than RF (73.82%) and CART (72.87%).

3.2.2. Accuracy, Sensitivity and Specificity of LR, CART and RF with Input of Significant Variables Identified by LR

Furthermore, the accuracy of validation datasets of the LR, CART and RF models when the 15 original variables are replaced by 7 groups of significant variables identified by LR and the most significant 4 to 10 are kept is illustrated in Table 5 and Figure 1.
As shown in Table 5 and Figure 1, when the number of input variables decreases from 15 to 10, the accuracy of the LR and CART is unchanged and that of RF increases. Furthermore, when the number of input significant variables decreases from 10 to 5, the accuracy of each RF is higher than that with input of the 15 original variables—the accuracy (74.43%) of RF with input of 9 significant variables identified by LR is the highest accuracy in this study. This means that using only significant variables helps by omitting the noise variables, and retains the accuracy of the LR and CART models, while improving the accuracy of RF. On the other hand, it also reduces the considerable cost of collecting accident data, that is, by collecting data on ten or even only five significant variables. In addition, it is shown that the accuracy of RF is always higher than LR and CART when inputting any group of significant variables.
Concerning sensitivity, it is noted in Table 5 and Figure 2 that the sensitivity of RF with input of only 5 to 10 significant variables identified by LR is higher than that with input of the 15 original variables; the sensitivity (75.6%) of RF with input of 9 significant variables identified by LR is the highest sensitivity in this study. In addition, the sensitivity of LR with input of only 9 or 10 significant variables identified by LR is higher than that with input of the 15 original variables too. Comparing sensitivity of LR, CART and RF, the sensitivity of RF with input of nine, eight or six significant variables identified by LR is higher than LR and CART with input of the same variables, and the sensitivity of LR with input of ten, seven, five or four significant variables identified by LR is higher than that of RF and CART with input of the same variables.
Table 5 and Figure 3 show that the specificity of CART with input of only 4 to 10 significant variables identified by LR is higher than that with input of the 15 original variables, and the specificity of RF is the same. Comparing specificity of LR, CART and RF, the specificity of CART with input of eight, seven or four significant variables is higher than LR and RF with input of the same variables, and the specificity of RF with input of ten, nine, six or five significant variables is higher than LR and CART with input of the same variables.

3.2.3. Accuracy, Sensitivity and Specificity of LR, CART and RF with Input of Important Variables Identified by CART

Next, the accuracy of validation datasets of the LR, CART and RF models when the 15 original variables are replaced by 7 groups of significant variables identified by the CART model and the most significant 4 to 10 are kept is illustrated in Table 6 and Figure 4. Only the accuracy of RF increases slightly, and the accuracy of LR and CART all decreases. Moreover, the accuracy of RF is higher than LR and CART when inputting any group of important variables identified by CART.
Concerning sensitivity, Table 6 and Figure 5 show that the sensitivity of LR, CART and RF with input of only 4 to 10 important variables identified by CART is lower than that with input of the 15 original variables, with the exception of RF with input of eight, seven, six or four important variables identified by CART. Comparing sensitivity of LR, CART and RF, the sensitivity of LR with input of ten, nine or five important variables identified by CART is higher than CART and RF with input of the same variables, and sensitivity of RF with input of eight, seven, six or four important variables identified by CART is higher than LR and CART with input of the same variables.
As for specificity, it is noted in Table 6 and Figure 6 that the specificity of CART with input of only 6 to 10 important variables identified by CART is 75.5%, which is higher than that with input of the 15 original variables, and is the highest specificity in this study. Comparing specificity of LR, CART and RF, the specificity of CART with input of ten, nine, eight, seven or six important variables identified by CART is higher than LR and RF with input of the same variables, and the specificity of RF with input of five or four important variables identified by CART is higher than LR and CART with input of the same variables.

3.2.4. Accuracy, Sensitivity and Specificity of LR, CART and RF with Input of Important Variables Identified by RF

Finally, the accuracy of validation datasets of the LR, CART and RF models when the 15 original variables are replaced by 7 groups of important variables identified by the RF model and the most important 4 to 10 are kept is illustrated in Table 7 and Figure 7. It can be seen that the accuracy of the LR, CART and RF models mostly decrease. Even so, the model developed by RF still is the best one, with higher accuracy than LR and CART when inputting most groups of important variables.
Concerning sensitivity, it is noted in Table 7 and Figure 8 that the sensitivity of LR, CART and RF with input of only 4 to 10 important variables identified by RF is lower than that with input of the 15 original variables, with the exception of LR and CART with input of 10 important variables, and RF with input of 9 or 6 important variables. Comparing sensitivity of LR, CART and RF, the sensitivity of LR with input of ten, eight or four important variables identified by RF is higher than CART and RF with input of the same variables, and the sensitivity of RF with input of nine, seven, six or five important variables identified by RF is higher than LR and CART with input of the same variables.
As to specificity, it is noted in Table 7 and Figure 9 that the specificity of LR, CART and RF with input of 10 important variables identified by RF all is higher than that with input of the 15 original variables. However, the specificity of LR, CART and RF with input of 4 to 9 important variables identified by RF all is lower than that with input of the 15 original variables. Comparing specificity of LR, CART and RF, the specificity of CART with input of seven, six or five important variables identified by RF is higher than LR and RF with input of the same variables, and the specificity of RF with input of ten, nine, eight or four important variables identified by RF is higher than LR and CART with input of the same variables.

3.3. Comparing the Influences of Significant and Important Variables on Accuracy, Sensitivity and Specificity

3.3.1. Accuracy of LR, CART and RF with Input of Significant or Important Variables

In Table 4 it is seen that the accuracy (73.38%) of RF is higher than that of LR and CART when inputting the 15 original variables. For another analytical point of view, accuracy of different LR, CART and RF models is shown in Figure 10, Figure 11 and Figure 12, corresponding to input of different groups of significant variables identified by LR or important variables identified by CART or RF. The accuracy of RF increases as we reduce the number of significant input variables identified by LR from 10 to 5, and each of these is higher than that with input of the 15 original variables. In particular, the accuracy (74.43%) of RF with input of nine significant variables identified by LR is the highest accuracy in this study. In addition, the accuracy of RF increases as the number of input important variables identified by CART decreases from 10 to 6, and all figures are higher than the accuracy of RF with input of the 15 original variables too.
This means that the RF model is the most efficient prediction model for accuracy, and inputting most significant variables identified by LR or important variables identified by CART will clearly promote the accuracy of RF.

3.3.2. Sensitivity of LR, CART and RF with Input of Significant or Important Variables

In Table 4 it is seen that the sensitivity (74.48%) of LR is higher than CART and RF when inputting the 15 original variables. For another analytical point of view, sensitivity of different LR, CART and RF models is shown in Figure 13, Figure 14 and Figure 15, corresponding to input of different groups of significant variables identified by LR or important variables identified by CART or RF respectively. It is seen that the sensitivity (75.6%) of RF with input of nine significant variables identified by LR is the highest sensitivity in this study, and the sensitivity (74.54%) of RF model with input of eight, seven or six important variables identified by CART is slightly higher than the highest sensitivity (74.48%) when inputting the 15 original variables. In addition, it is seen that the sensitivity of LR model with input of ten or nine significant variables identified by LR is slightly higher than 74.48% too.
This means that RF and LR models are efficient prediction models for sensitivity, and sensitivity can be promoted when RF is input some significant variables identified by LR or important variables identified by CART, and when LR is input some significant variables identified by LR.

3.3.3. Specificity of LR, CART and RF with Input of Significant or Important Variables

In Table 4 it is seen that the specificity (72.95%) of RF is higher than LR and CART when inputting the 15 original variables. For another analytical point of view, specificity of different LR, CART and RF models is shown in Figure 16, Figure 17 and Figure 18, corresponding to input of different groups of significant variables identified by LR or important variables identified by CART or RF, respectively. It is seen that the specificity (75.5%) of CART with input of 6 to 10 important variables identified by CART is the highest specificity in this study, and the specificity of CART with input of four to eight significant variables identified by LR is higher than the highest specificity (72.95%) when inputting the 15 original variables. In addition, it is seen that the specificity of RF with input of four to ten significant variables identified by LR, six to ten important variables identified by CART or ten important variables identified by RF are all higher than 72.95%.
This means that CART and RF models are efficient prediction models for specificity. In other words, if CART is input with either some important variables identified by CART or significant variables identified by LR, and RF is input with either some significant variables identified by LR or important variables identified by CART or RF, then their specificity will be promoted.

3.4. Odds Ratio of Variables Estimated by LR

Beside significances, the output estimated by LR contains odds ratios of variables. An odds ratio reveals the relative correlation of each value of a given variable with specific severity. For instance, the odds ratios of the values of variables “major cause” and “action” are listed in Table 8. It is seen that the odds ratio of “reverse driving” (5.931) is much higher than 1, which means that there is a strong correlation between “reverse driving” (driving in the direction opposite to the flow of traffic) and “serious accidents”. On the other hand, the odds ratio of “failure to keep a safe distance” (0.157) is less than 1, which means that there is strong correlation between “failure to keep a safe distance” and “minor accidents”. Another example is the variable “action”, where the odds ratio of “overtaking” (4.810) is higher than 1, meaning that there is a strong correlation between “overtaking” and “serious accidents”. On the other hand, the odds ratio of “abrupt deceleration” (0.991) is less than 1, it means that there is a correlation between “abrupt deceleration” and “minor accidents”.

3.5. Rules Generated by CART

Analyzing the results (with a graphic tree displayed) of the classification trees discovery, the results of the CART model can be converted into rules [38]. Each terminal node of the tree represents a rule, with all the splits of the parent nodes being the antecedents and the class of the terminal node being the consequents. For each terminal node, the rules can be filtered by support, confidence, and lift, where support is the percentage of the entire data set covered by the rule, confidence is the proportion of the number of examples which fit the right side (consequent) among those that fit the left side (antecedent), and lift is a measure of the statistical dependence of the rule.
In each actual road accident case, there are several variables occurring together. In other words, there are many patterns of variables occurring together in traffic accidents. The pattern of variables occurring together in traffic accidents is the antecedent of the rule, and the corresponding severity is the consequent of the rule. The lift of a rule can reveal the tendency of this pattern of variables occurring together to result in the corresponding severity. There were four rules with high lift (i.e., a value higher than 1), which are displayed in Table 9.

4. Discussion

Summarizing the empirical results on prediction performance, the four main findings are as follows. First, regarding accuracy, RF is the most efficient tool for predicting severity among the above-mentioned three models, and the integrated method in which RF models are input only some significant variables identified by LR or important variables identified by CART improves the accuracy; the accuracy (74.43%) of RF with input of nine significant variables identified by LR is the highest accuracy in this study. Second, regarding sensitivity, RF and LR achieve better performance for predicting severity, and in the integrated method in which RF models are input, only some significant variables are identified by LR and important variables are identified by CART. When the LR models are input, only some significant variables identified by LR have better sensitivity; the sensitivity (75.6%) of RF with input of nine significant variables identified by LR is the highest sensitivity in this study. Third, regarding specificity, CART and RF achieve better performance for predicting specificity, and in the integrated method in which CART models are input, only some significant variables are identified by LR and important variables are identified by CART. When the RF models are input, only significant variables identified by LR or important variables identified by CART or RF have greater specificity; the specificity (75.5%) of CART with input of six to ten important variables identified by CART is the highest specificity in this study. Fourth, in general, in the integrated method in which RF models are input, only some significant variables identified by LR and important variables identified by CART can simultaneously satisfy the dual purposes of promoting prediction performance (including accuracy, sensitivity and specificity) and reduce the considerable cost of collecting data in accident research.
Based on the above summary, if the primary concern is overall prediction performance, the integrated method in which RF models are input with only some significant variables identified by LR or important variables identified by CART should be selected to pursue higher accuracy. In addition, if the focus is on serious accident prediction performance, the integrated method in which RF models are input with only some significant variables identified by LR or important variables identified by CART, or LR models are input with only some significant variables identified by LR should be selected to pursue higher sensitivity. Furthermore, if the goal is minor accident prediction performance, the integrated method in which CART models should be input with only some significant variables identified by LR or important variables identified by CART, or RF models should be input with only some significant variables identified by LR or important variables identified by CART, or alternatively, RF should be selected to pursue higher specificity. In general, no matter whether the goal is prediction performance in its entirety, or just serious or minor accidents, the integrated method in which RF models are input with only some significant variables identified by LR or important variables identified by CART can simultaneously satisfy the dual purposes of promoting prediction performance and reducing the considerable cost of collecting data. There are 15 original variables for modeling road accident severity in this study. By using LR, CART and RF, significant variables or important variables are identified, and various numbers of significant variables or important variables are taken as input variables to compare the classification performance of road accident severity. In addition, the management organization should focus more on the management of issues related to significant variables or important variables.

5. Conclusions

In this paper, the empirical results demonstrate that the accuracy and specificity of RF are higher than those of LR and CART when the 15 original variables are input, and inputting only some special significant variables identified by LR or important variables identified by CART into RF can promote accuracy, sensitivity and specificity. Therefore, it can be said that RF is the most effective prediction model among the three models, which is consistent with the results of previous studies.
On the other hand, the frequent discussion of significant variables identified by LR [4] and important variables identified by CART [2] or RF [24] in previous studies was focused on the strength of their relationship with the accident. The influences of significant variables and important variables on prediction performance of LR, CART and RF models are evaluated in this study. The results presented in Section 3 reveal that when the 15 original variables are replaced by some specific significant variables identified by LR or important variables identified by CART in RF, LR or CART models, the accuracy, sensitivity or specificity can be improved more significantly than when they are replaced by some important variables identified by RF. Therefore, it can be said that significant variables identified by LR and important variables identified by CART can help in generating better prediction performance of RF, LR and CART models more efficiently than important variables identified by RF.
Based on the above two summaries, the combining of the most effective prediction model (RF) and significant variables identified by LR or important variables identified by CART should achieve better prediction performance. The above conclusion is confirmed by two results as follows: First, the accuracy, sensitivity and specificity of RF with input of only significant variables identified by LR or important variables identified by CART can all be promoted. Second, the accuracy (74.43%) and sensitivity (75.6%) of RF are both at their highest in this study with input of 9 significant variables identified by LR. In other words, the integrated method in which RF models are input with only significant variables identified by LR or important variables identified by CART can simultaneously satisfy the dual purposes of promoting prediction performance and reduce the considerable cost of collecting data.
Beside the significant variables mentioned above, LR can generate the odds ratio of variables, which reveals the correlation between each value of a given variable with specific severity, and provides information to road authorities about preventing accidents [33]. For instance, observing the results, “reverse driving” strongly tends to be linked to “serious accidents”, and “failure to keep a safe distance” has a strong correlation with “minor accidents”. It is worth considering corresponding measures to prevent serious accidents and minor accidents, so as to offer proposals to road authorities. In addition, beside the important variables mentioned above, CART can generate rules [38] which can help in preventing accidents. For instance, in this study, when the “vehicle type” is “bus” or “heavy truck or tractor-trailer”, the “major cause” is “improper lane change” or “failure to keep a safe distance”, and the “location” is “ramp”, and consequently, the severity strongly tends to be “minor accident”. In other words, road authorities can adopt effective measures for buses, heavy trucks or tractor-trailers in order to reduce their improper lane changes and failure to keep a safe distance on ramps, such that property damage accidents can be reduced.
In this study, significant variables or important variables are identified using LR, CART and RF, and various numbers of significant variables or important variables are taken as input variables to compare the classification performance of road accident severity. Exploring the impact of category of variables on the classification performance is an issue worth studying, and it is suggested as the future area of investigation.

Author Contributions

Writing—Original draft, M.-M.C.; Writing—Review and editing, M.-C.C. All authors have read and agreed to the published version of the manuscript.

Funding

This research received no external funding.

Conflicts of Interest

The authors declare no conflict of interest.

Abbreviations

LRlogistic regression
CARTclassification and regression tree
RFrandom forest
GENdriver gender
AGEdriver age
ALCalcohol use
LIClicense
VEHvehicle type
DRIdriver occupation
JOUJourney purpose
ACTAction
MAJMajor cause
WEAWeather condition
LIGLight condition
OBSObstacle
CRACrash position
LOCLocation
SPESpeed limit
Sig by LRSignificant variables identified by LR
Imp byCART Important variables identified by CART
Imp byRF Important variables identified by RF
S%support%
C%confident%
Llift
MINminor accident
SERserious accident
BSbus
HTheavy truck or tractor-trailer
ILCimproper lane change
FKSfailure to keep a safe distance
RPramp
PCpassenger car
LTlight truck
60–4060–40 km/h
SPspeeding
DDAdriving disability
FPFfailure to pay attention to the front
BRFbrake failure or tire puncture
RDreverse driving
ORothers
DRDdrunken driving
UNKunknown
NDRnon-drunken driving
110110 km/h
100100 km/h
90–7090–70 km/h

References

  1. Chang, L.-Y.; Chen, W.-C. Data mining of tree-based models to analyze freeway accident frequency. J. Saf. Res. 2005, 36, 365–375. [Google Scholar] [CrossRef] [PubMed]
  2. Kuhnert, P.M.; Do, K.; McClure, R. Combining non-parametric models with logistic regression: An application to motor vehicle injury data. Comput. Stat. Data Anal. 2000, 34, 371–386. [Google Scholar] [CrossRef]
  3. Kim, K.; Lawrence, N.; Richardson, J.; Li, L. Modeling fault among bicyclists and drivers involved in collisions in Hawaii 1986–1991. Transp. Res. Rec. 1996, 1538, 75–80. [Google Scholar] [CrossRef]
  4. Al-Ghamdi, A.S. Using logistic regression to estimate the influence of accident factors on accident severity. Accid. Anal. Prev. 2002, 34, 729–741. [Google Scholar] [CrossRef]
  5. Besliu-Ionescu, D.; Talpeanu, D.-C.; Mierla, M.; Maris Muntean, G. On the prediction of geoeffectiveness of CMEs during the ascending phase of SC24 using a logistic regression method. J. Atmos. Sol. Terr. Phys. 2019, 193, 105036. [Google Scholar] [CrossRef]
  6. Zhu, C.; Idemudia, C.U.; Feng, W. Improved logistic regression model for diabetes prediction by integrating PCA and K-means techniques. Inform. Med. Unlocked 2019, 17, 100179. [Google Scholar] [CrossRef]
  7. Washington, S.; Wolf, J. Hierarchical tree-based versus ordinary least squares linear regression models: Theory and example applied to trip generation. Transp. Res. Rec. 2007, 1581, 82–88. [Google Scholar] [CrossRef]
  8. Golias, I.; Karlaftis, M.G. An international comparative study of self-reported driver behavior. Transp. Res. Part F Traffic Psychol. Behav. 2001, 4, 243–256. [Google Scholar] [CrossRef]
  9. Stewart, J.R. Application of classification and regression tree methods in roadway safety studies. Transp. Res. Rec. 1996, 1542, 1–5. [Google Scholar] [CrossRef]
  10. Sohn, S.Y.; Shin, H. Pattern recognition for road traffic accident severity in Korea. Ergonomics 2001, 44, 107–117. [Google Scholar] [CrossRef]
  11. Karlaftis, M.G.; Golias, I. Effect of road geometry and traffic volumes on rural roadway accident rates. Accid. Anal. Prev. 2002, 34, 357–365. [Google Scholar] [CrossRef]
  12. Sohn, S.Y.; Lee, S.H. Data fusion, ensemble and clustering to improve the classification accuracy for the severity of road traffic accidents in Korea. Saf. Sci. 2003, 41, 1–14. [Google Scholar] [CrossRef]
  13. Abdel-Aty, M.; Keller, J.; Brady, P.A. Analysis of types of crashes at signalized intersections by using complete crash data and tree-based regression. Transp. Res. Rec. 2005, 1908, 37–45. [Google Scholar] [CrossRef]
  14. Chang, L.-Y.; Wang, H.-W. Analysis of traffic injury severity: An application of non-parametric classification tree techniques. Accid. Anal. Prev. 2006, 38, 1019–1027. [Google Scholar] [CrossRef]
  15. Yan, X.; Radwan, E. Analyses of rear-end crashes based on classification tree models. Traffic Inj. Prev. 2006, 7, 276–282. [Google Scholar] [CrossRef]
  16. Qin, X.; Han, J. Variable selection issues in tree-based regression models. Transp. Res. Rec. 2008, 2061, 30–38. [Google Scholar] [CrossRef] [Green Version]
  17. Elmitiny, N.; Yan, X.; Radwan, E.; Russo, C.; Nashar, D. Classification analysis of driver’s stop/go and red-light running violation. Accid. Anal. Prev. 2010, 42, 101–111. [Google Scholar] [CrossRef]
  18. Pande, A.; Abdel-Aty, M.; Das, A. A classification tree based modeling approach for segment related crashes on multilane highways. J. Saf. Res. 2010, 41, 391–397. [Google Scholar] [CrossRef] [Green Version]
  19. Akhoondzadeh, M. Decision Tree, Bagging and Random Forest methods detect TEC seismo-ionospheric anomalies around the time of the Chile, (Mw = 8.8) earthquake of 27 February 2010. Adv. Space Res. 2016, 57, 2464–2469. [Google Scholar] [CrossRef]
  20. Chang, L.-Y.; Chien, J.-T. Analysis of driver injury severity in truck-involved accidents using a non-parametric classification tree model. Saf. Sci. 2013, 51, 17–22. [Google Scholar] [CrossRef]
  21. Harb, R.; Yan, X.; Radwan, E.; Su, X. Exploring precrash maneuvers using classification trees and random forests. Accid. Anal. Prev. 2009, 41, 98–107. [Google Scholar] [CrossRef] [PubMed]
  22. Breiman, L. Random forests. Mach. Learn. 2001, 45, 5–32. [Google Scholar] [CrossRef] [Green Version]
  23. Kane, M.; Price, N.; Scotch, M.; Rabinowitz, P. Comparison of ARIMA and random forest time series models for prediction of avian influenza H5N1 outbreaks. BMC Bioinform. 2014, 15, 276. [Google Scholar] [CrossRef]
  24. Das, A.; Abdel-Aty, M.; Pande, A. Using conditional inference forests to identify the factors affecting crash severity on arterial corridors. J. Saf. Res. 2009, 40, 317–327. [Google Scholar] [CrossRef] [Green Version]
  25. Siddiqui, C.; Abdel-Aty, M.; Huang, H. Aggregate nonparametric safety analysis of traffic zones. Accid. Anal. Prev. 2012, 45, 317–325. [Google Scholar] [CrossRef]
  26. Abdel-Aty, M.; Pande, A.; Das, A.; Knibbe, W.J. Analysis of infrastructure based ITS data for assessing safety on freeways in Netherlands. J. Transp. Res. Board 2008, 2083, 153–161. [Google Scholar] [CrossRef] [Green Version]
  27. Speiser, J.L.; Miller, M.E.; Tooze, J.; Ip, E. A comparison of random forest variable selection methods for classification prediction modeling. Expert Syst. Appl. 2019, 134, 93–101. [Google Scholar] [CrossRef]
  28. Chen, W.; Xie, X.; Wang, J.; Pradhan, B.; Hong, H.; Bui, D.T.; Duan, Z.; Ma, J. A comparative study of logistic model tree, random forest, and classification and regression tree models for spatial prediction of landslide susceptibility. Catena 2017, 151, 147–160. [Google Scholar] [CrossRef] [Green Version]
  29. Rezapour, M.; Mehrara Molan, A.; Ksaibati, K. Analyzing injury severity of motorcycle at-fault crashes using machine learning techniques, decision tree and logistic regression models. Int. J. Transp. Sci. Technol. 2020, in press. [Google Scholar] [CrossRef]
  30. Zhoua, X.; Lu, P.; Zheng, Z.; Tolliver, D.; Keramati, A. Accident Prediction Accuracy Assessment for Highway-Rail Grade Crossings Using Random Forest Algorithm Compared with Decision Tree. Reliab. Eng. Syst. Saf. 2020, 200, 106931. [Google Scholar] [CrossRef]
  31. Chauhan, S.; Pradhan, S.; Mohanty, R.; Saini, A.; Devi, K.; Sahu, M.C. Evaluation of sensitivity and specificity of bone marrow trephine biopsy tests in an Indian teaching hospital. Alex. J. Med. 2018, 54, 161–166. [Google Scholar] [CrossRef]
  32. Morita, T.; Hamada, S.; Masumura, K.; Wakata, A.; Maniwa, J.; Takasawa, H.; Yasunaga, K.; Hashizume, T.; Honma, M. Evaluation of the sensitivity and specificity of in vivo erythrocyte micronucleus and transgenic rodent gene mutation tests to detect rodent carcinogens. Mutat. Res. 2016, 802, 1–29. [Google Scholar] [CrossRef] [PubMed]
  33. Tay, R.; Rifaat, S.M.; Chin, H.C. A logistic model of the effects of roadway, environmental, vehicle, crash and driver characteristics on hit-and-run crashes. Accid. Anal. Prev. 2008, 40, 1330–1336. [Google Scholar] [CrossRef] [PubMed]
  34. Breiman, L.; Friedman, J.H.; Olshen, R.A.; Stone, C.J. Classification and Regression Trees; Wadsworth International Group: Belmont, CA, USA, 1984; ISBN 978-0412048418. [Google Scholar]
  35. Sekhar, C.R.; Madhu, E. Mode Choice analysis using random forest decision trees. Transp. Res. Procedia 2016, 17, 644–652. [Google Scholar] [CrossRef]
  36. Shaikhina, T.; Lowe, D.; Daga, S.; Briggs, D.; Higgins, R.; Khovanova, N. Decision tree and random forest models for outcome prediction in antibody incompatible kidney transplantation. Biomed. Signal Process. Control 2019, 52, 456–462. [Google Scholar] [CrossRef]
  37. Chiou, Y.C.; Lan, L.W.; Chen, W.P. A two-stage mining framework to explore key risk conditions on one-vehicle crash severity. Accid. Anal. Prev. 2013, 43, 1451–1463. [Google Scholar] [CrossRef]
  38. Montella, A.; Aria, M.; D’Ambrosio, A.; Mauriello, F. Analysis of powered two-wheeler crashes in Italy by classification trees and rules discovery. Accid. Anal. Prev. 2012, 49, 58–72. [Google Scholar] [CrossRef]
Figure 1. Accuracy of LR, CART and RF with input of significant variables identified by LR.
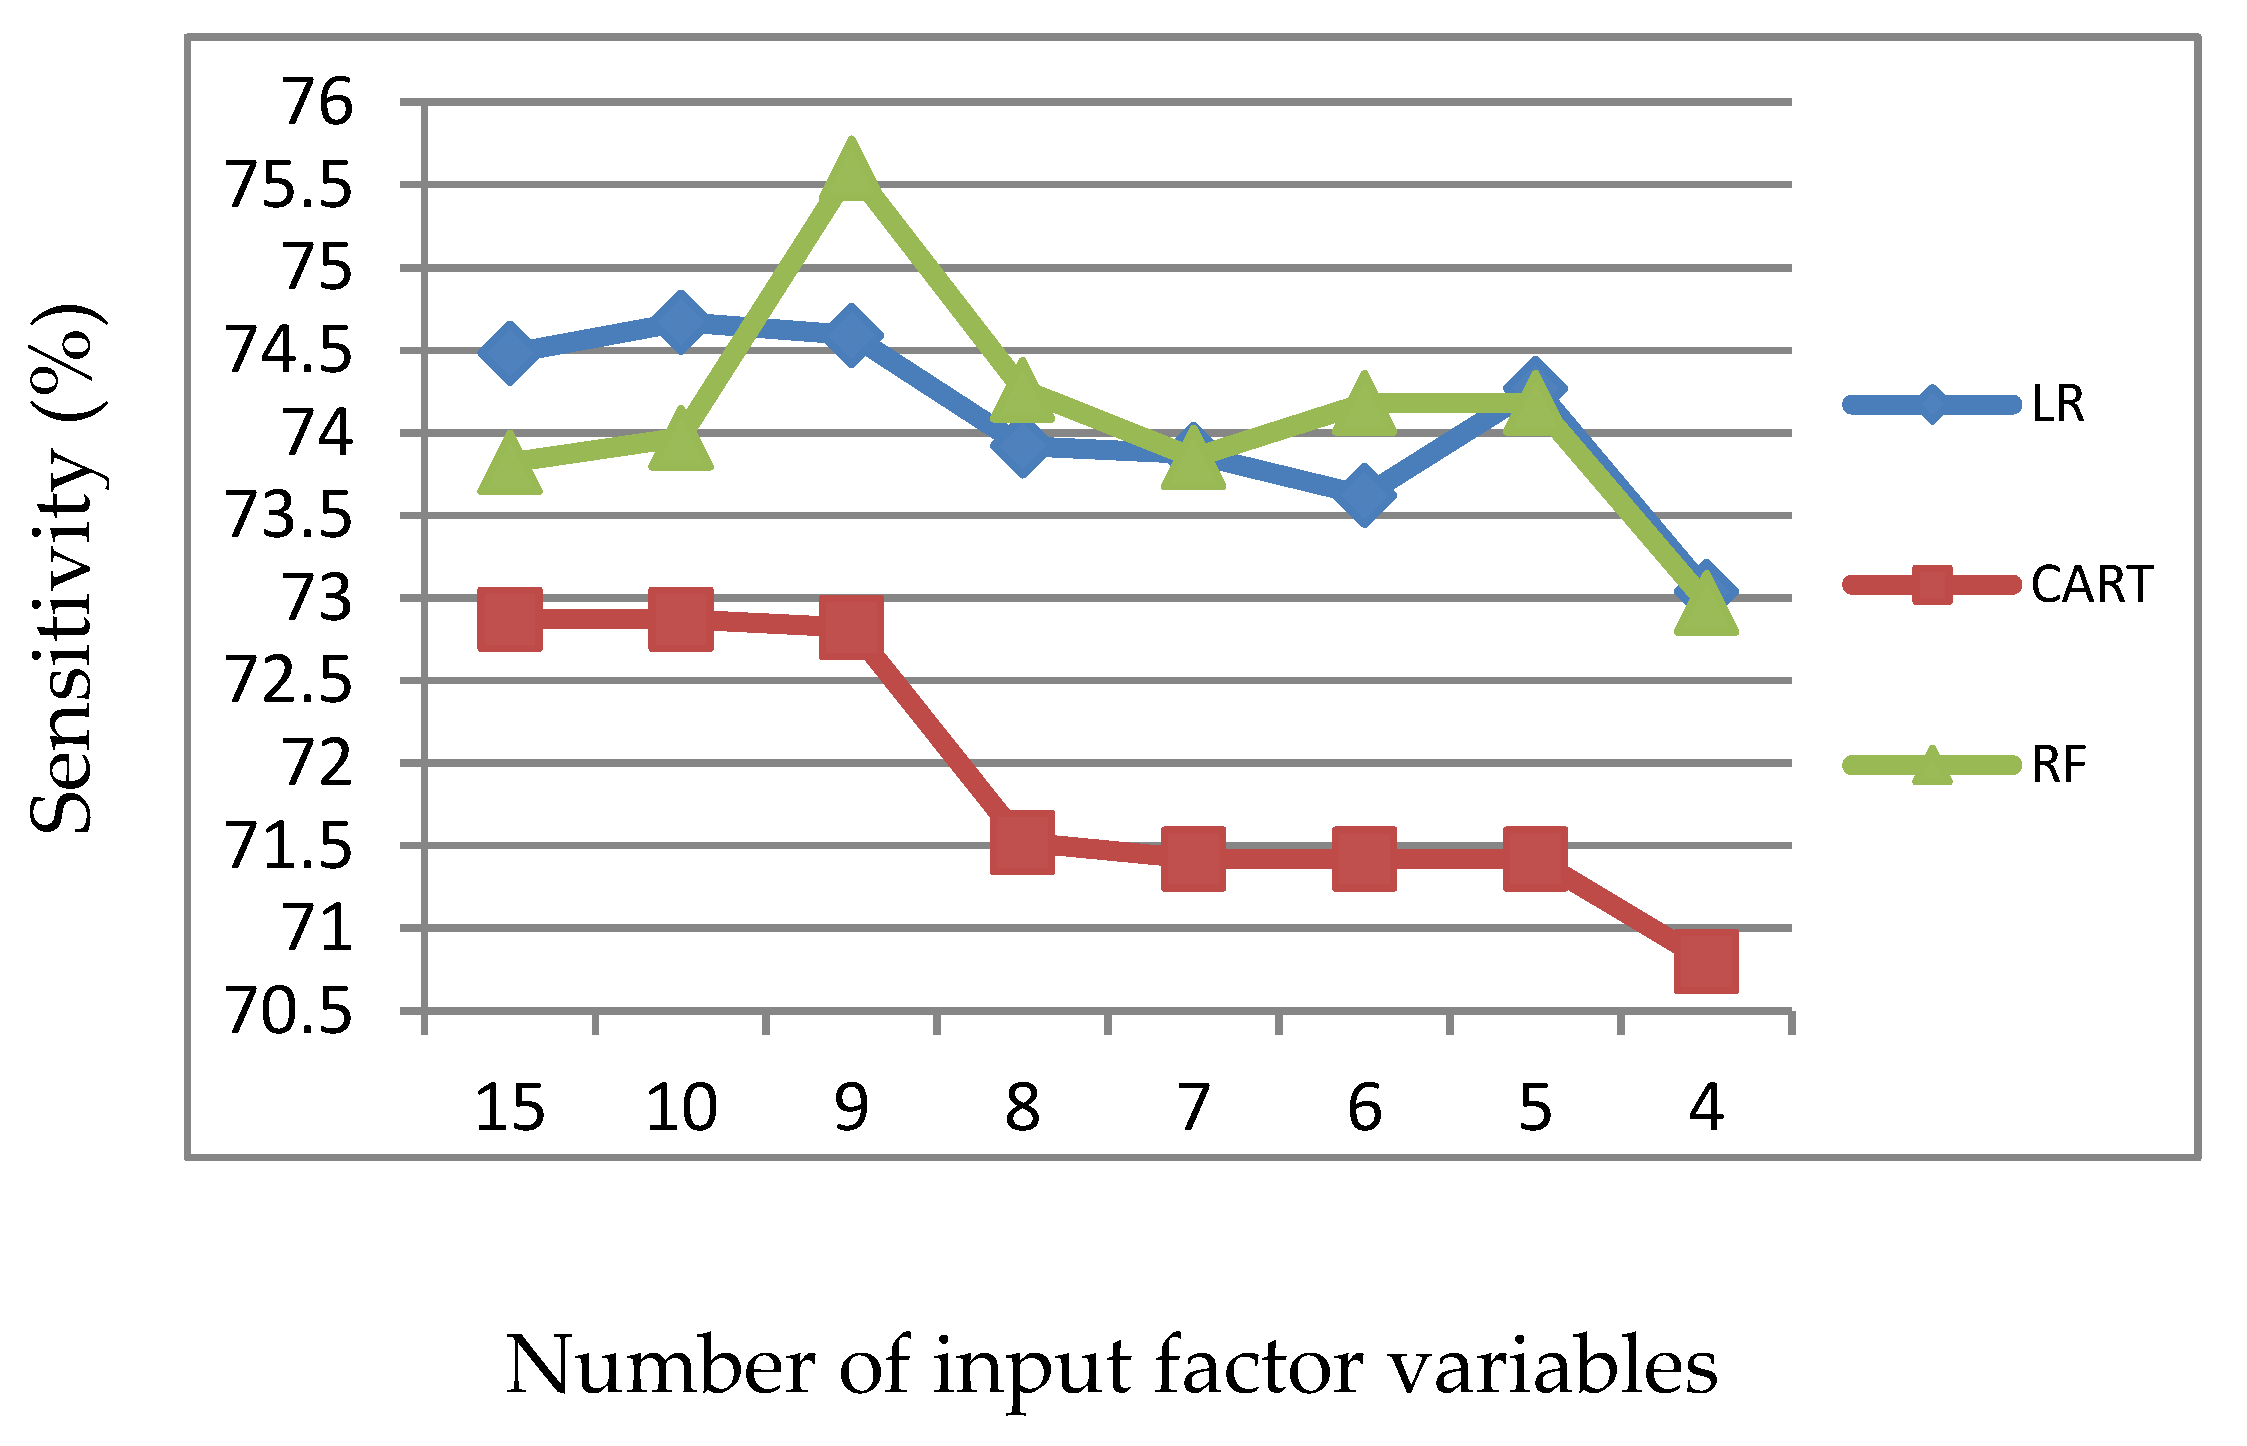
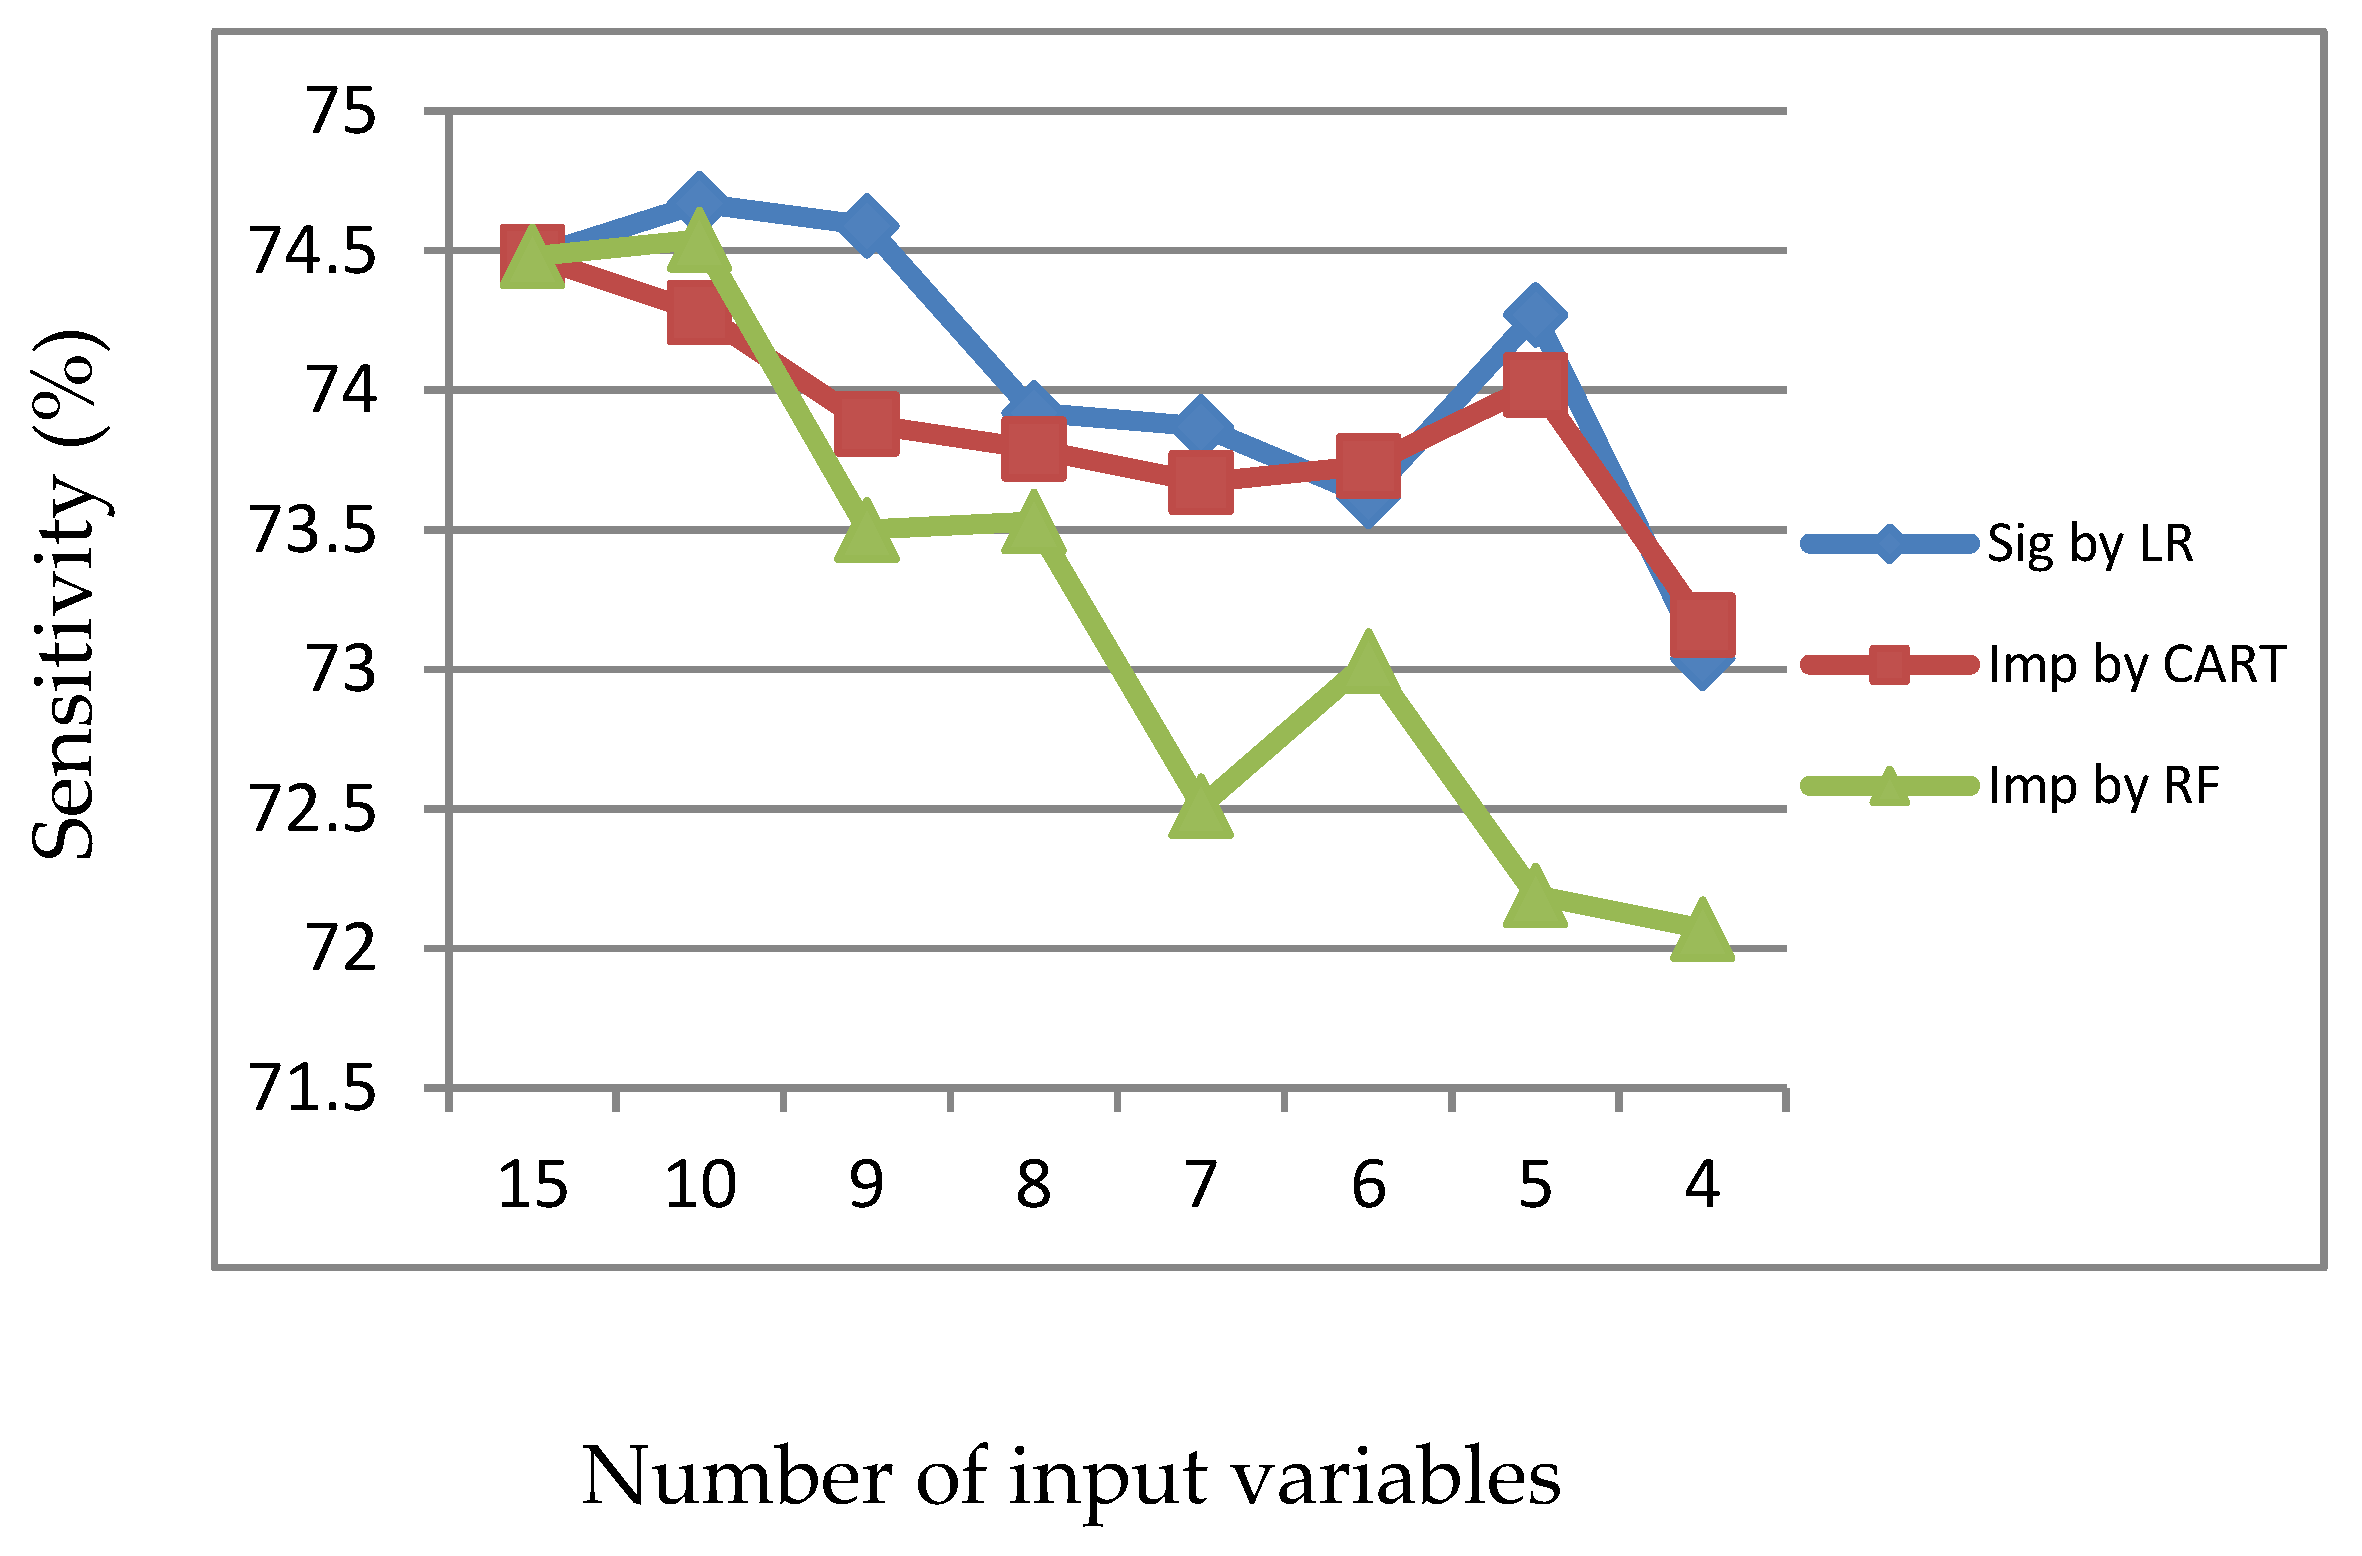
Information 11 00270 g001
Figure 2. Sensitivity of LR, CART and RF with input of significant variables identified by LR.
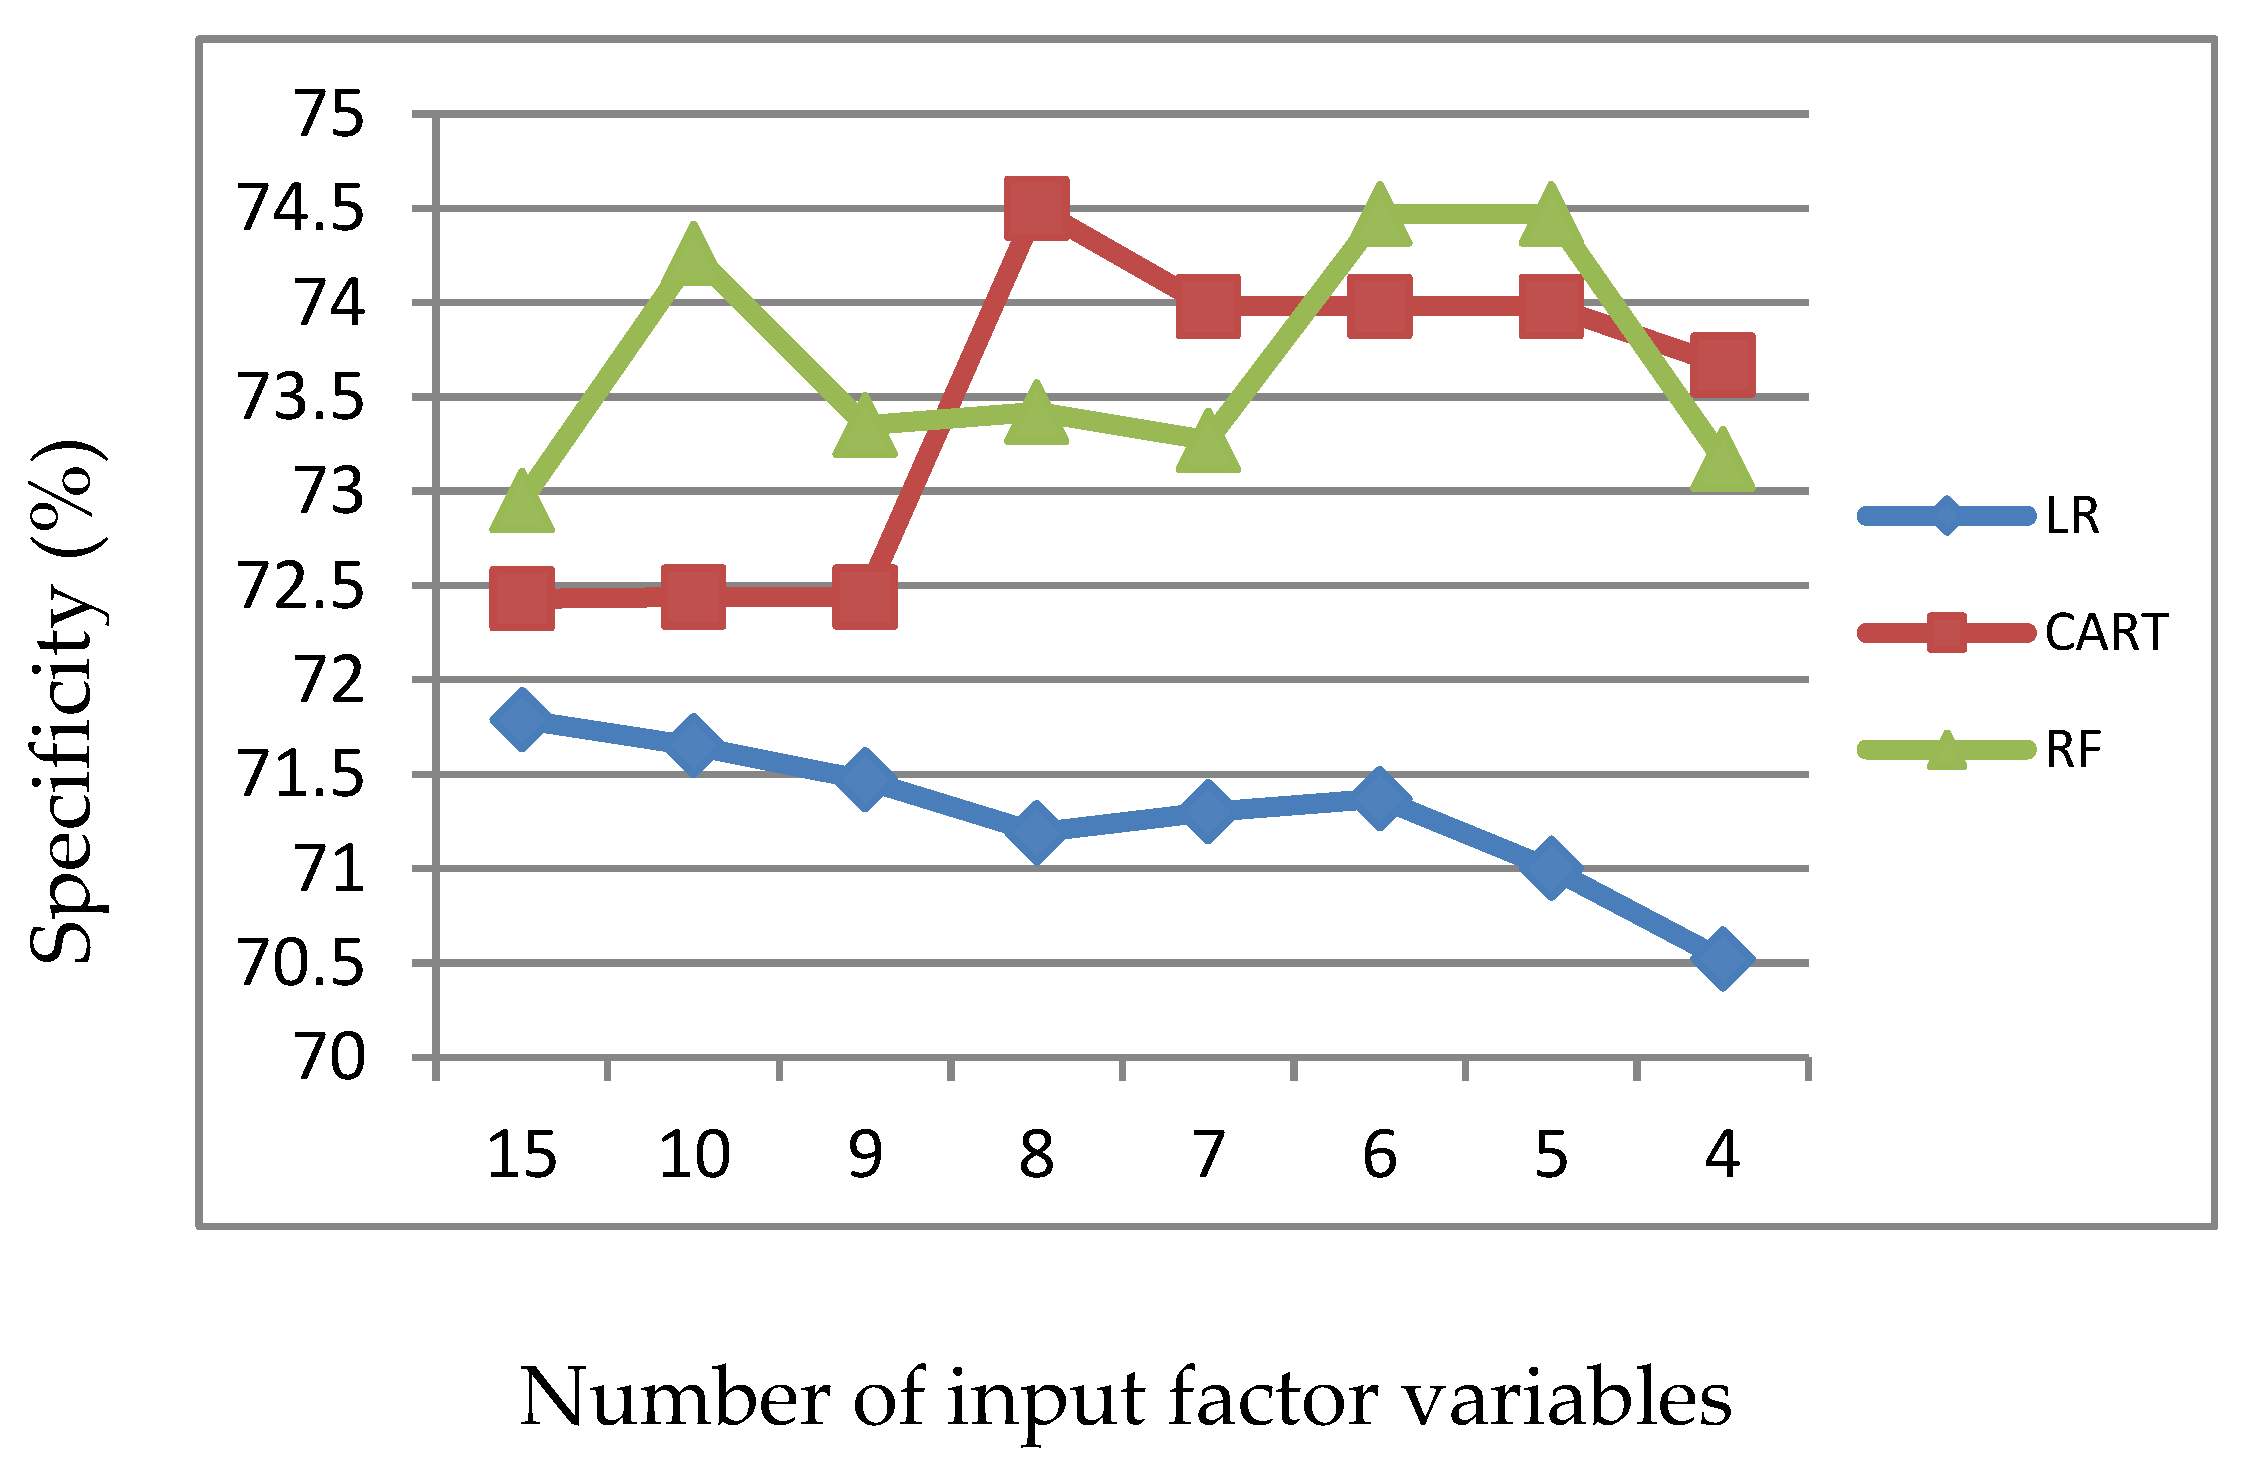
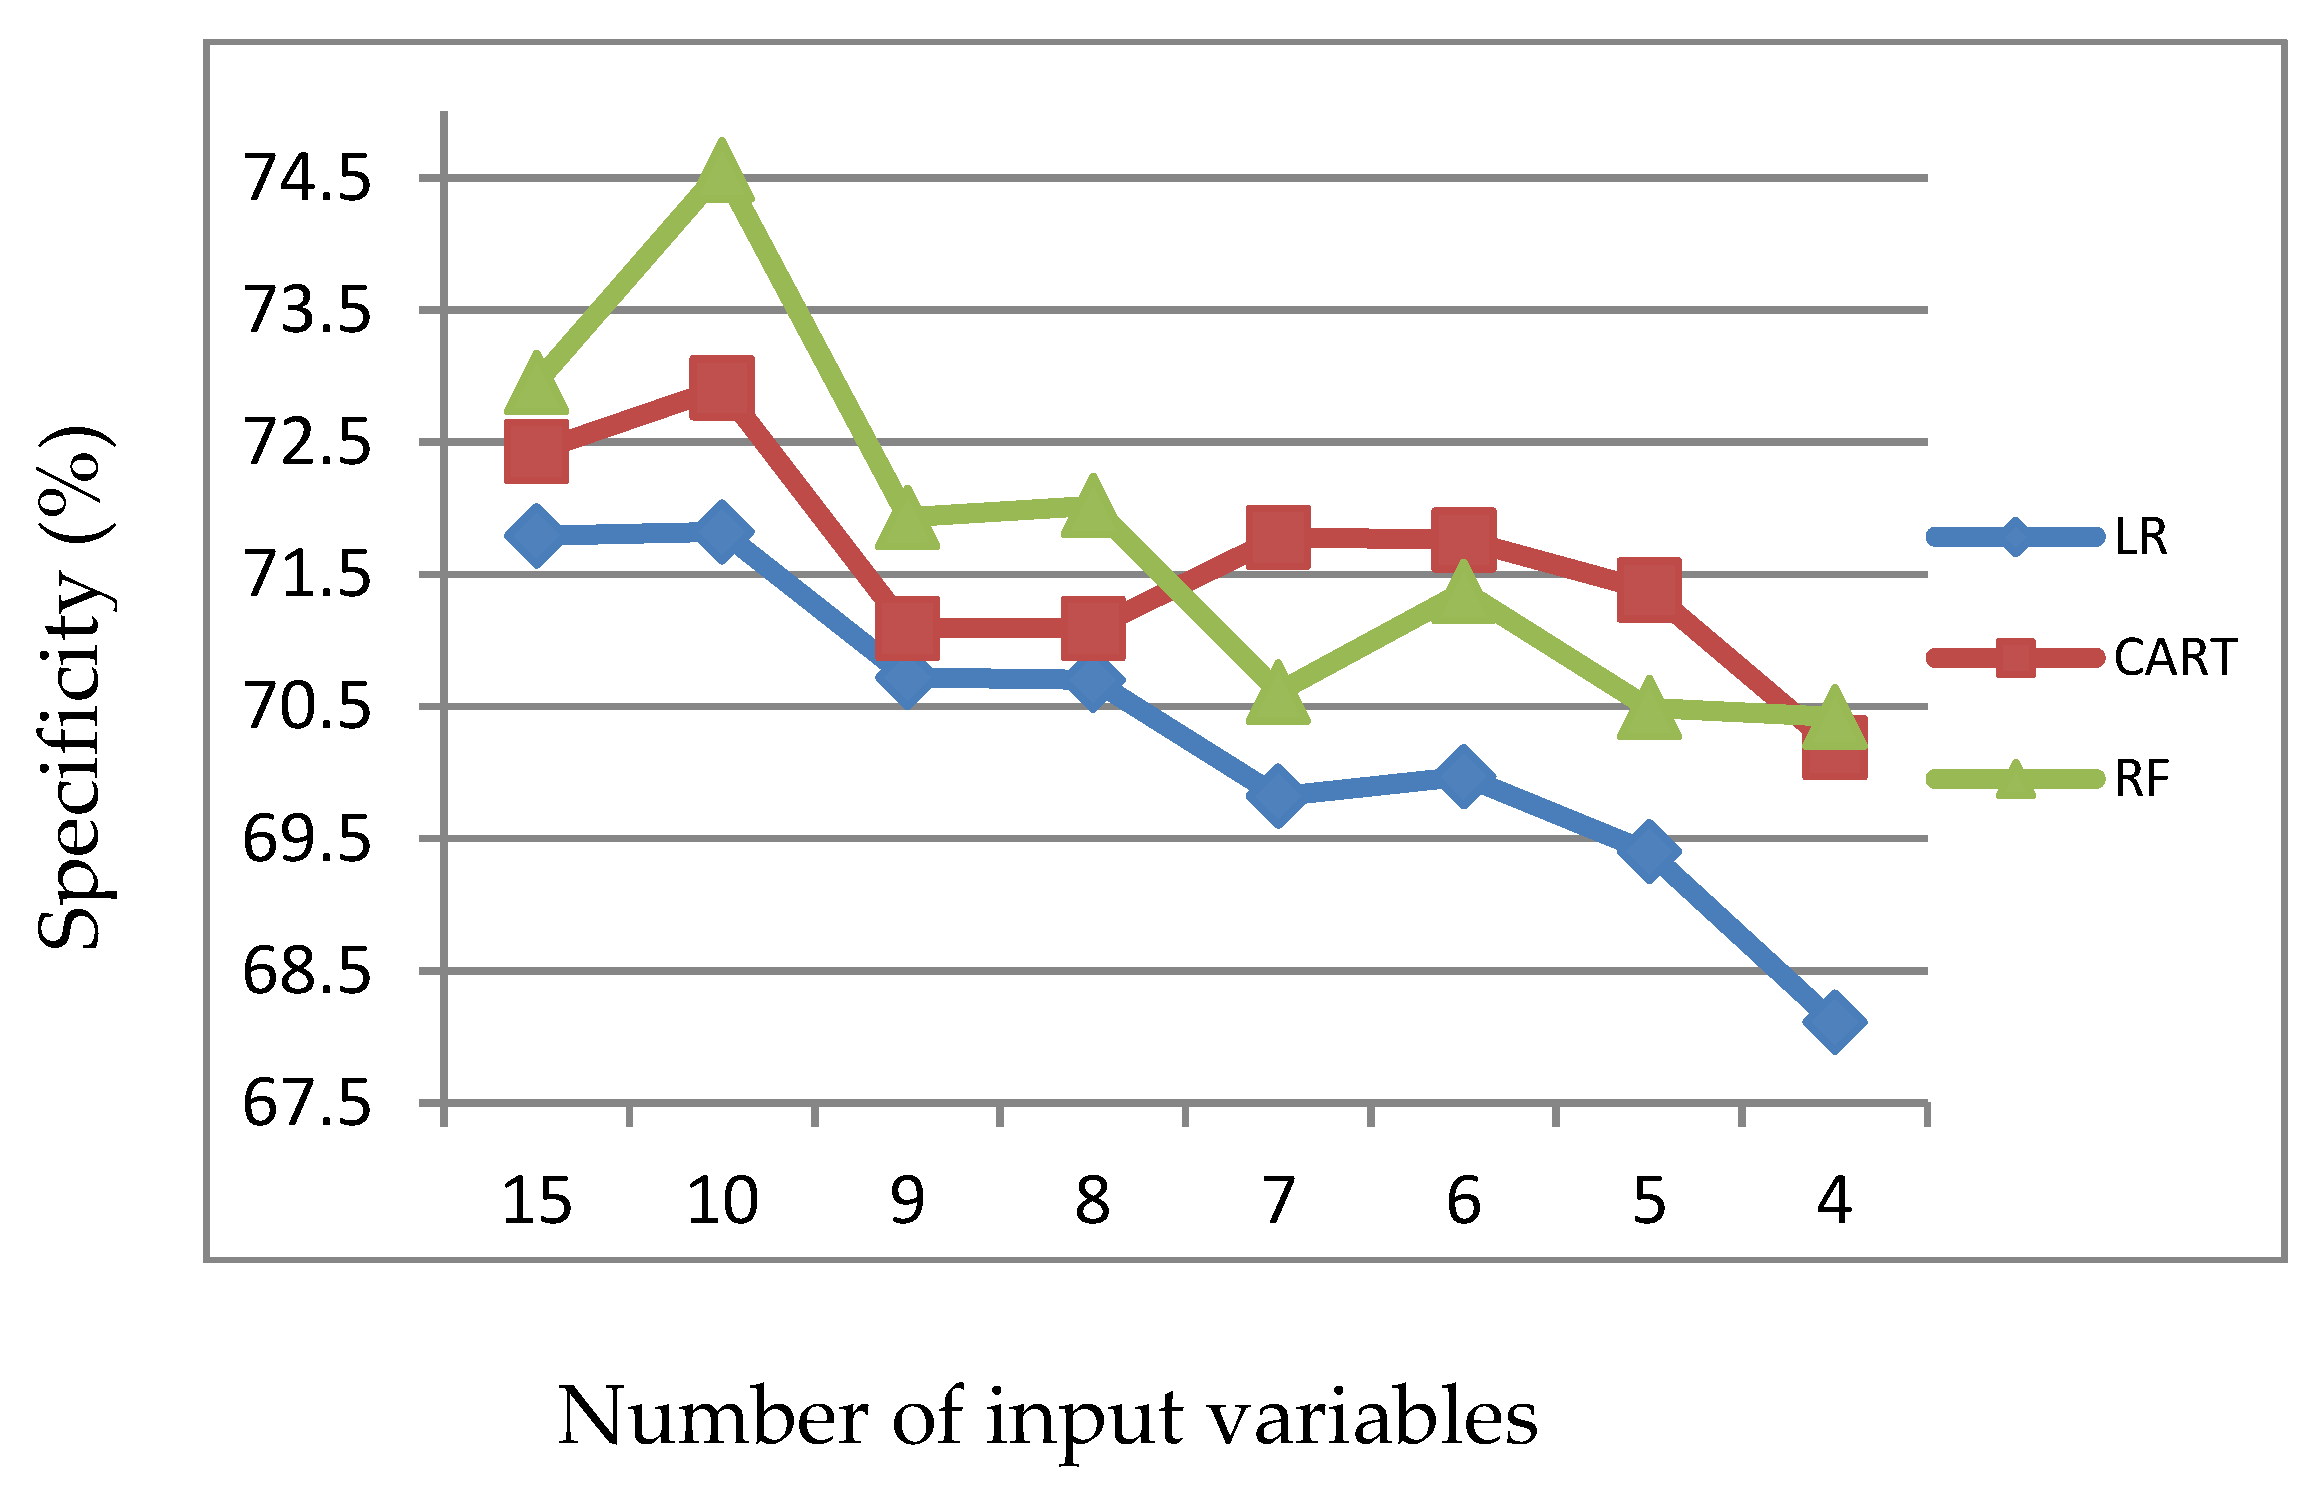
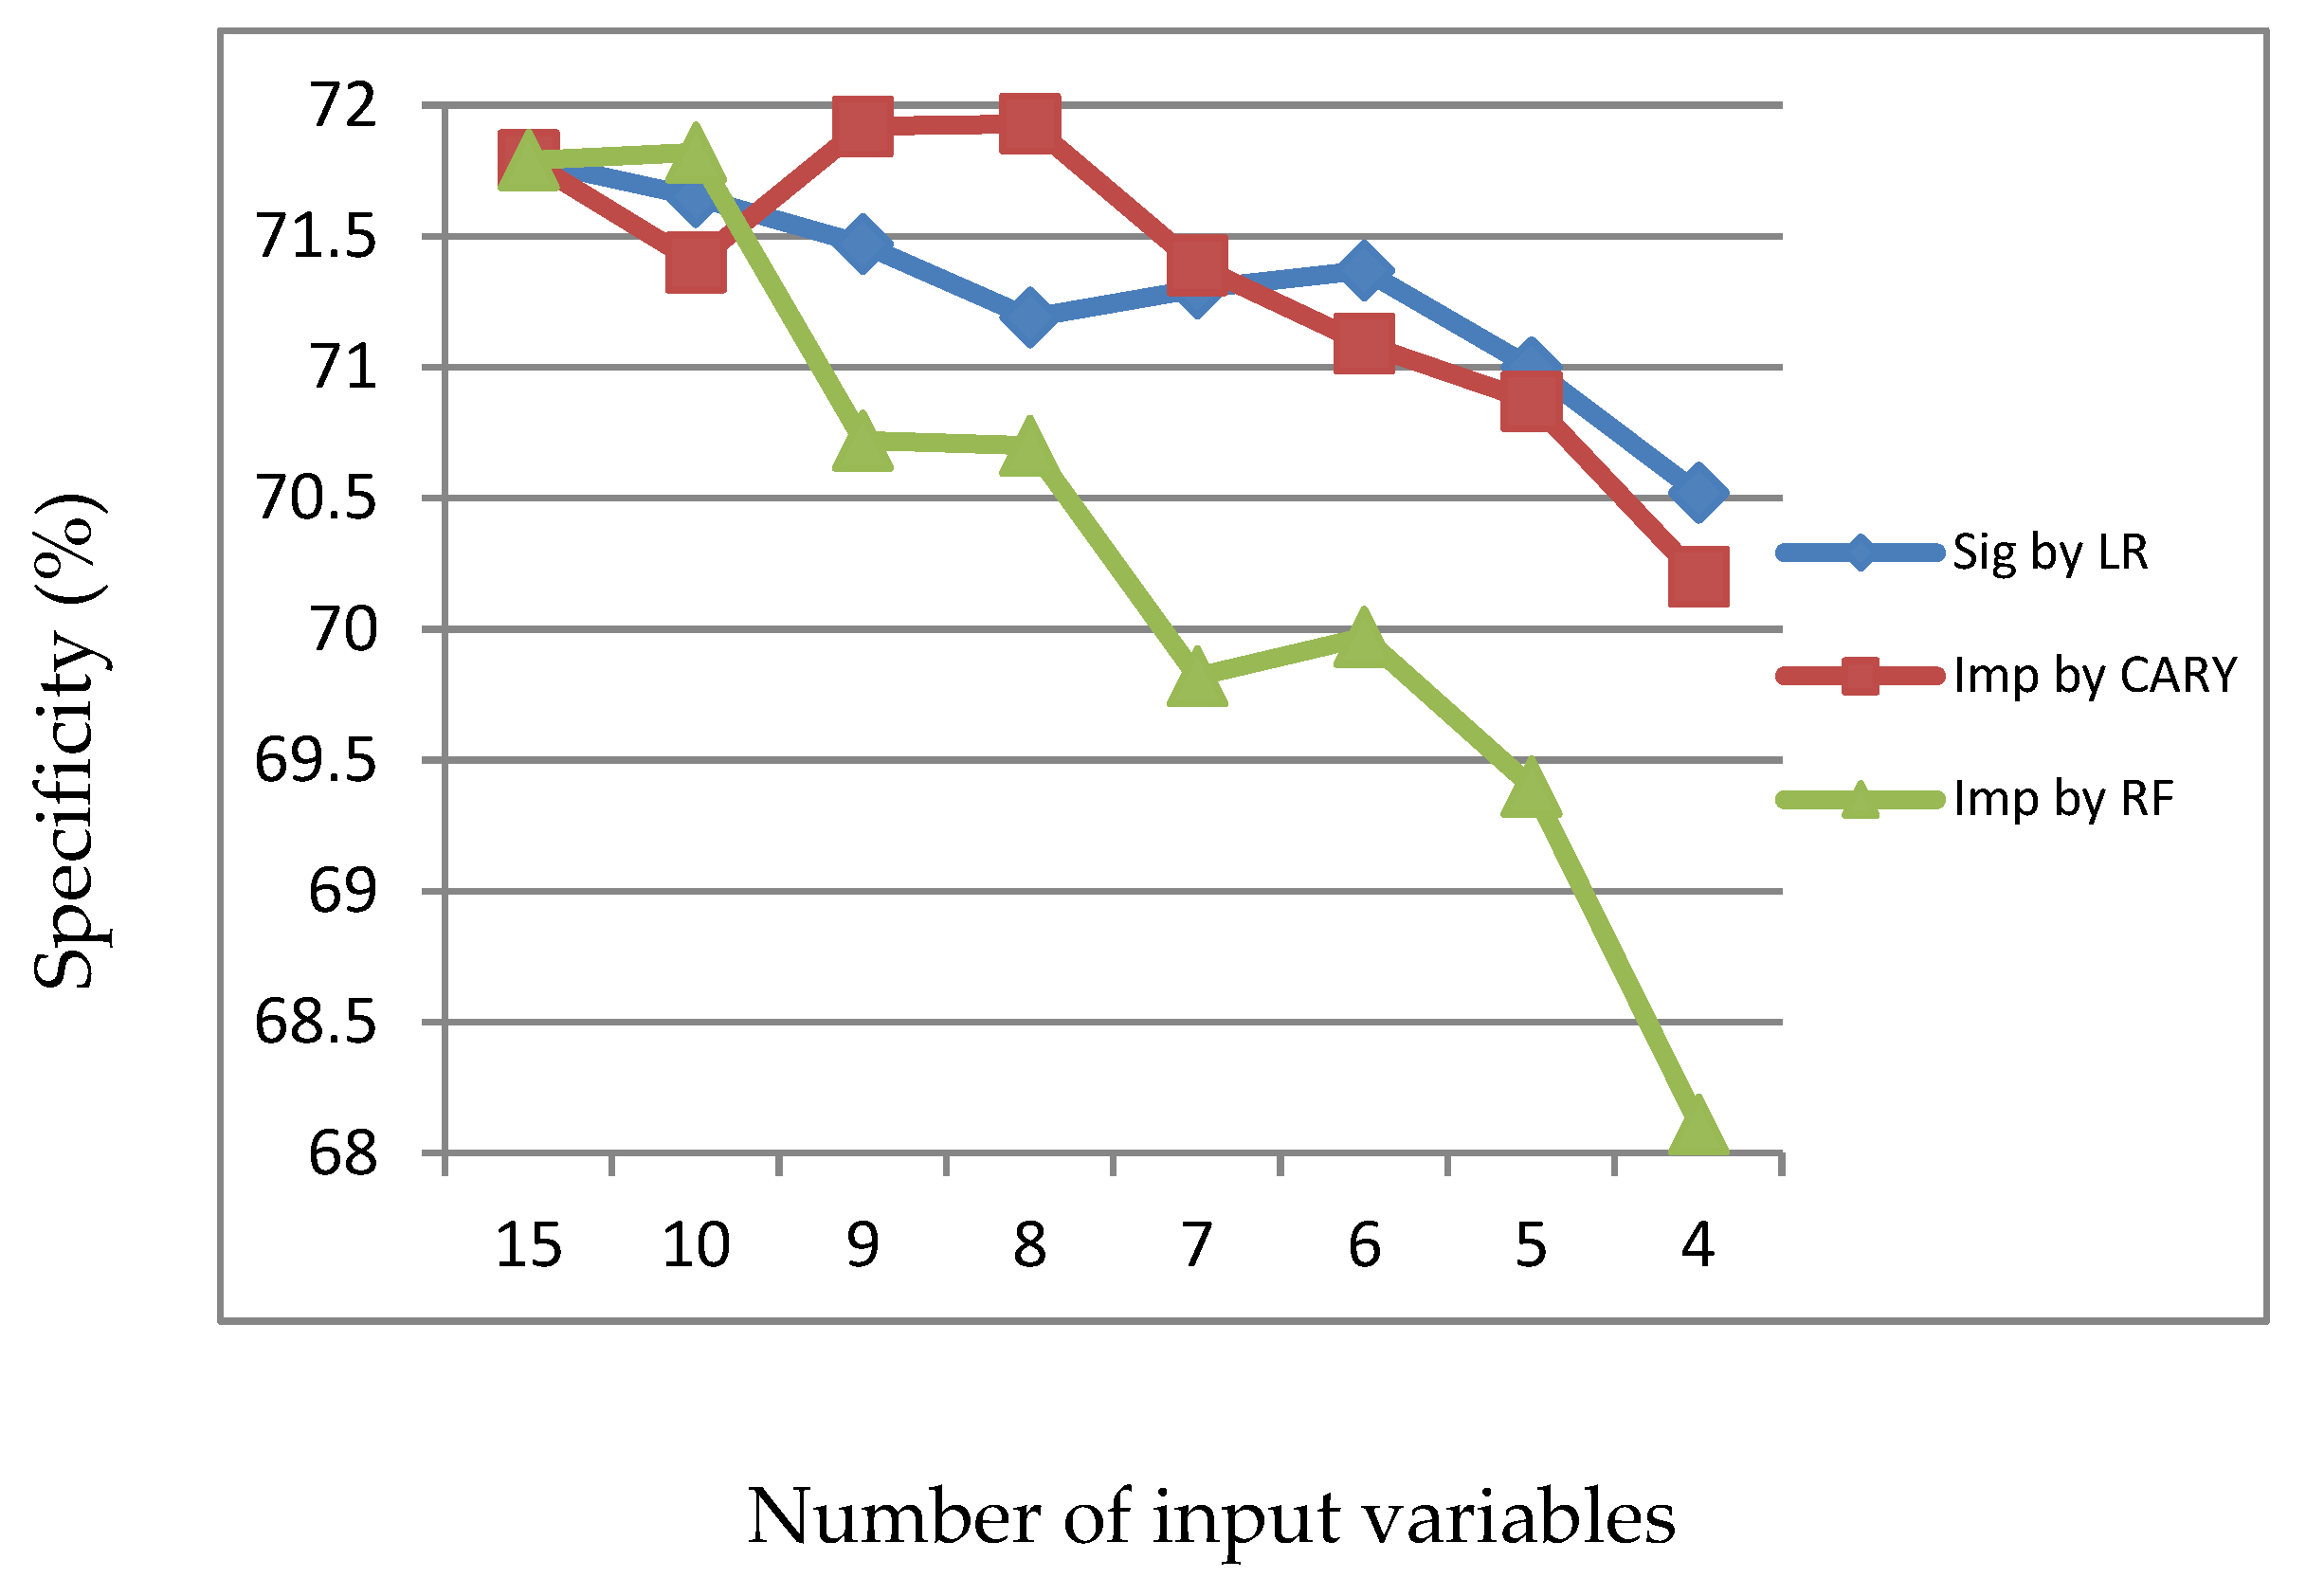
Information 11 00270 g002
Figure 3. Specificity of LR, CART and RF with input of significant variables identified by LR.
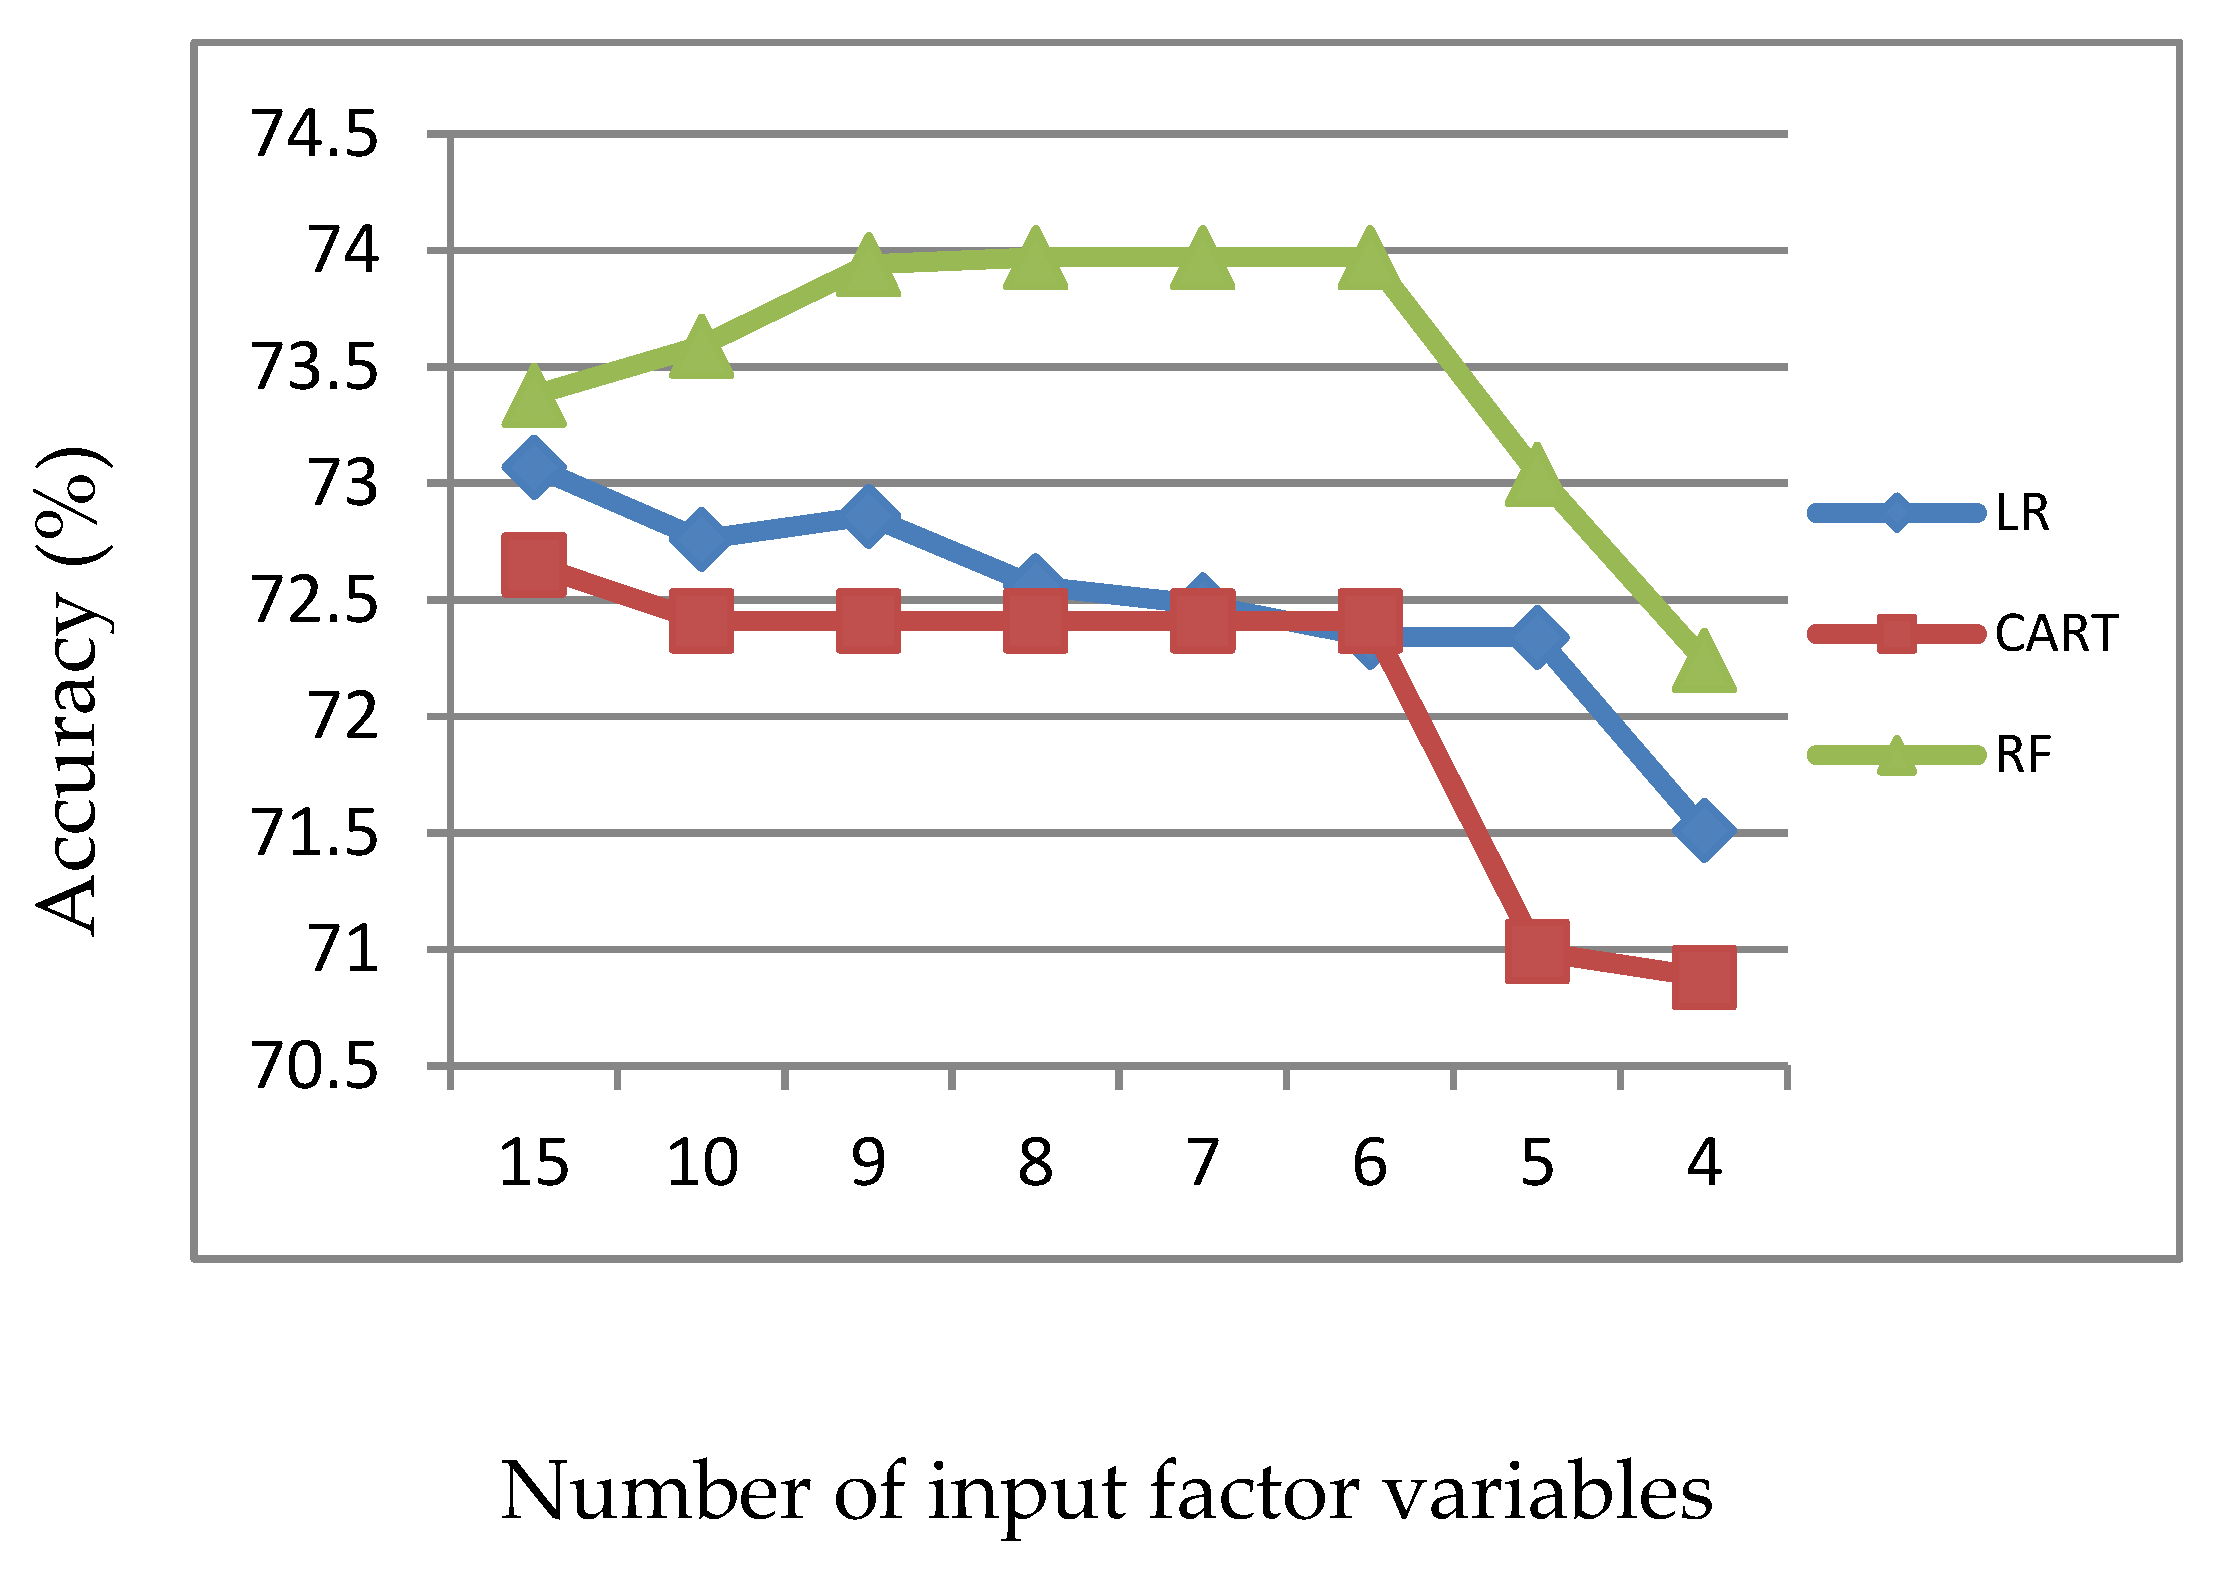
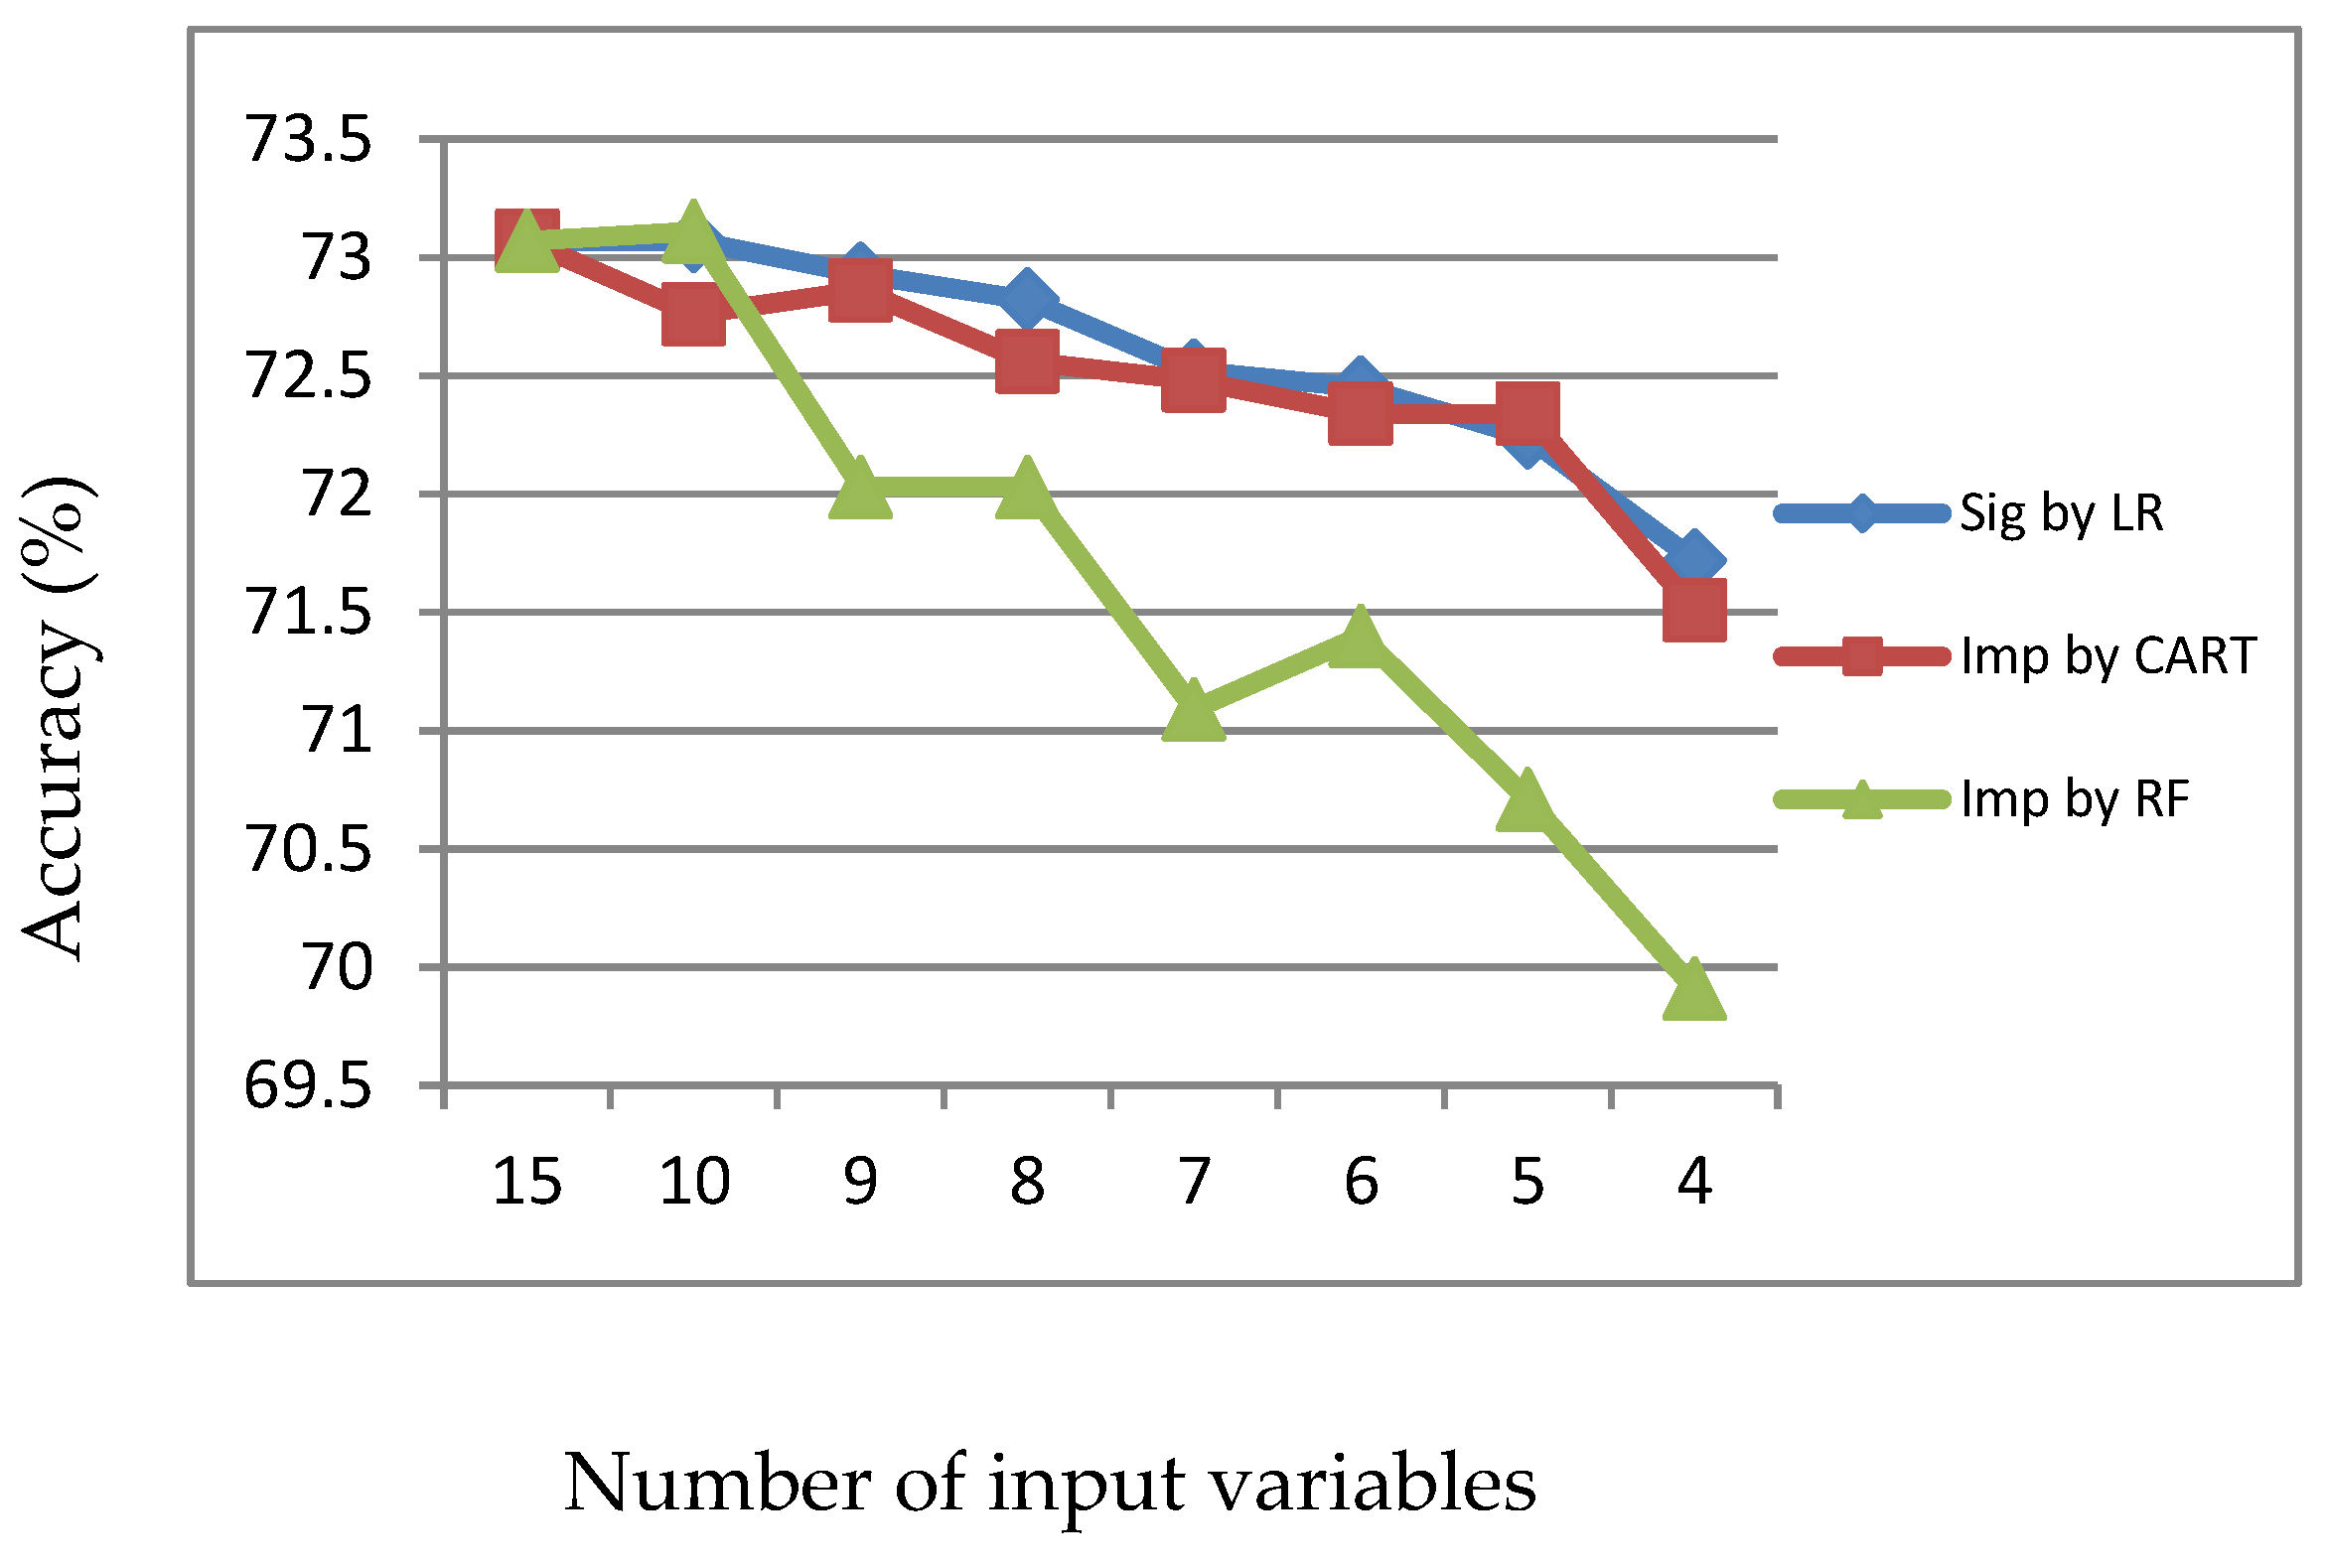
Information 11 00270 g003
Figure 4. Accuracy of LR, CART and RF with input of important variables identified by CART.
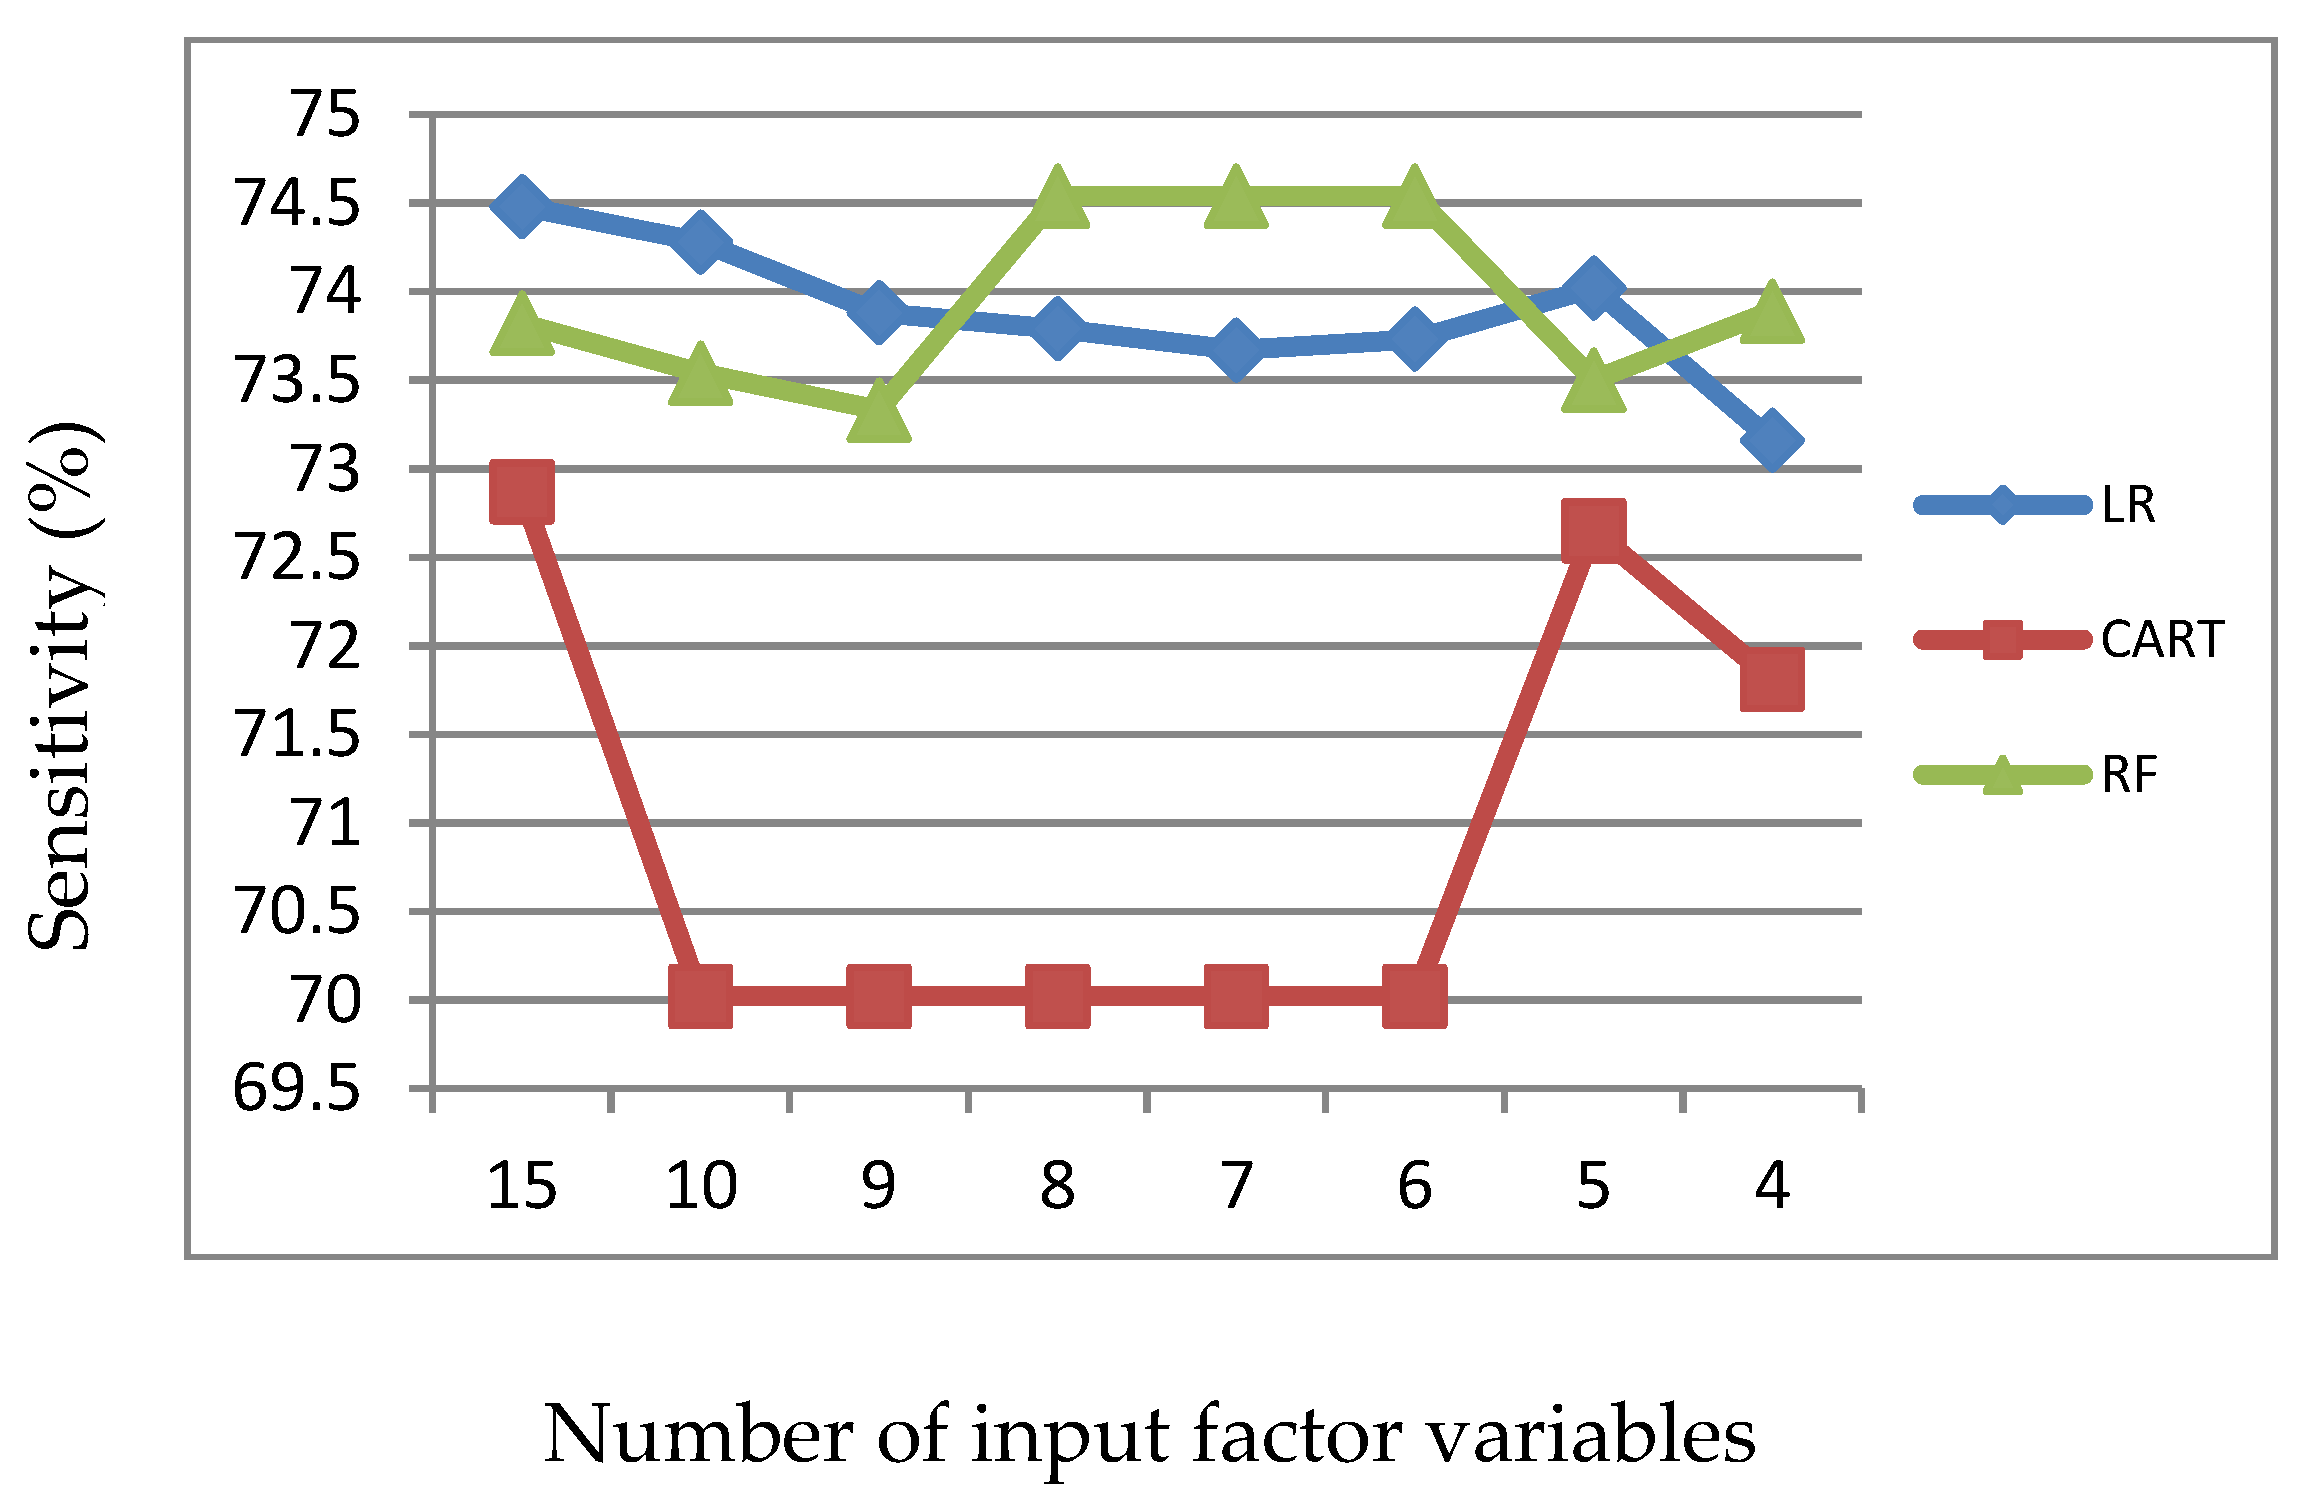
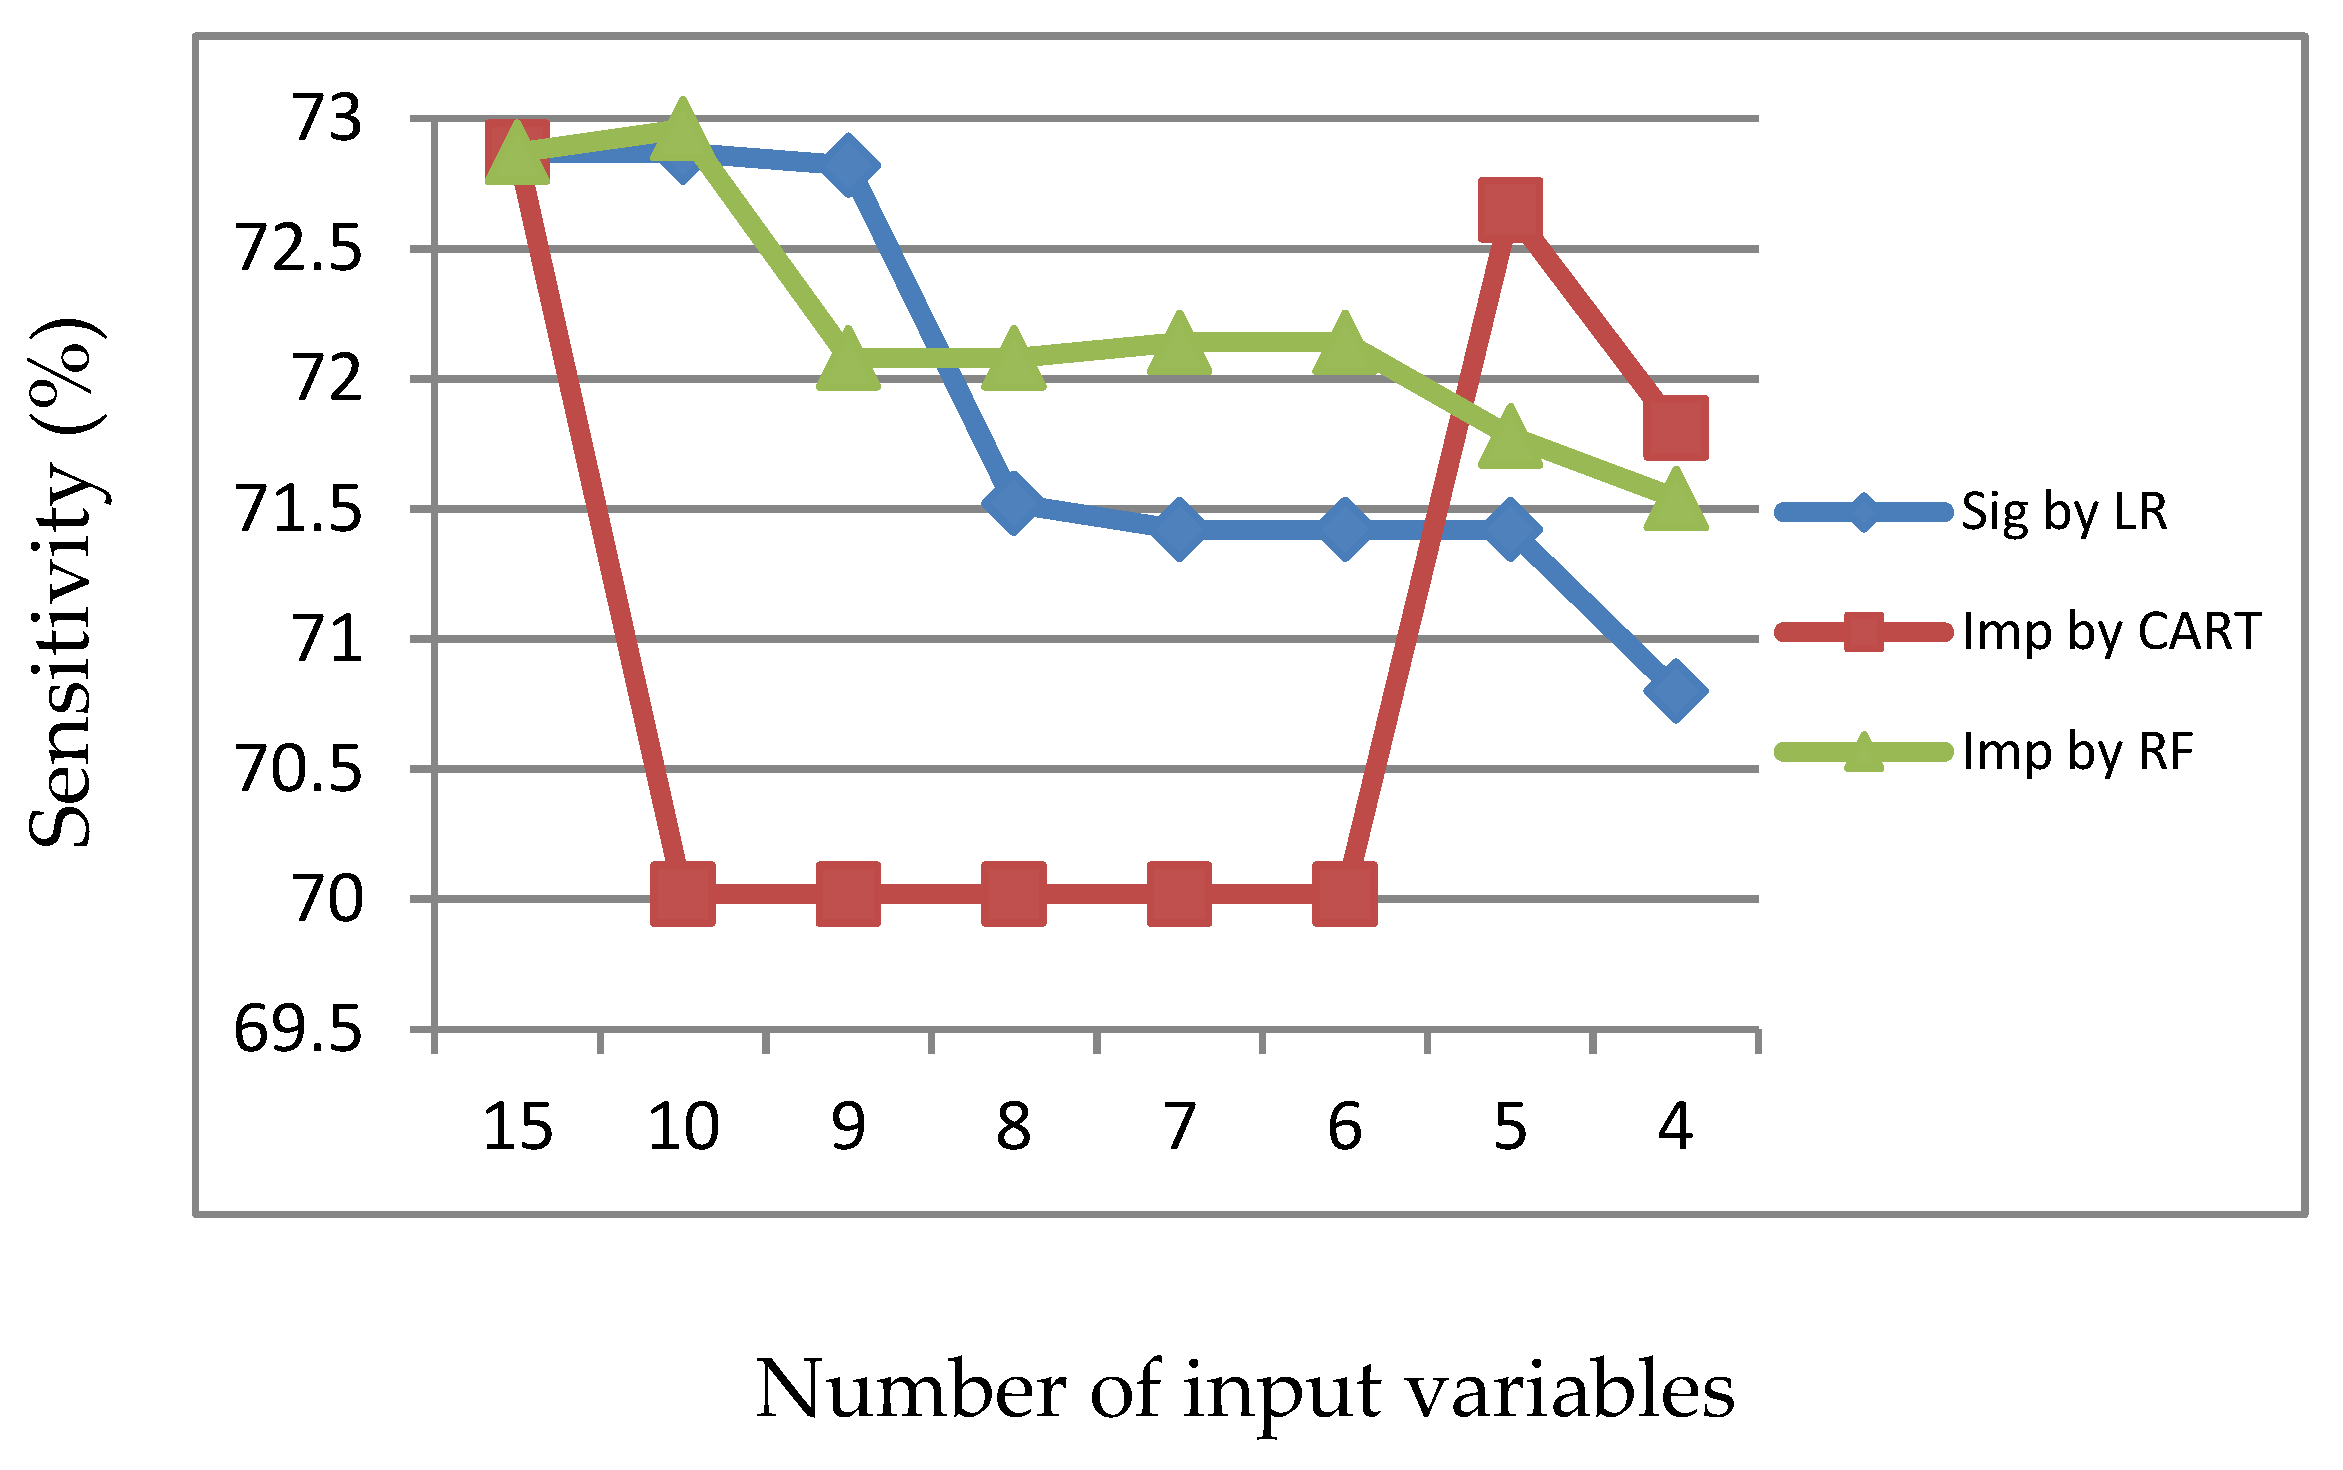
Information 11 00270 g004
Figure 5. Sensitivity of LR, CART and RF with input of important variables identified by CART.
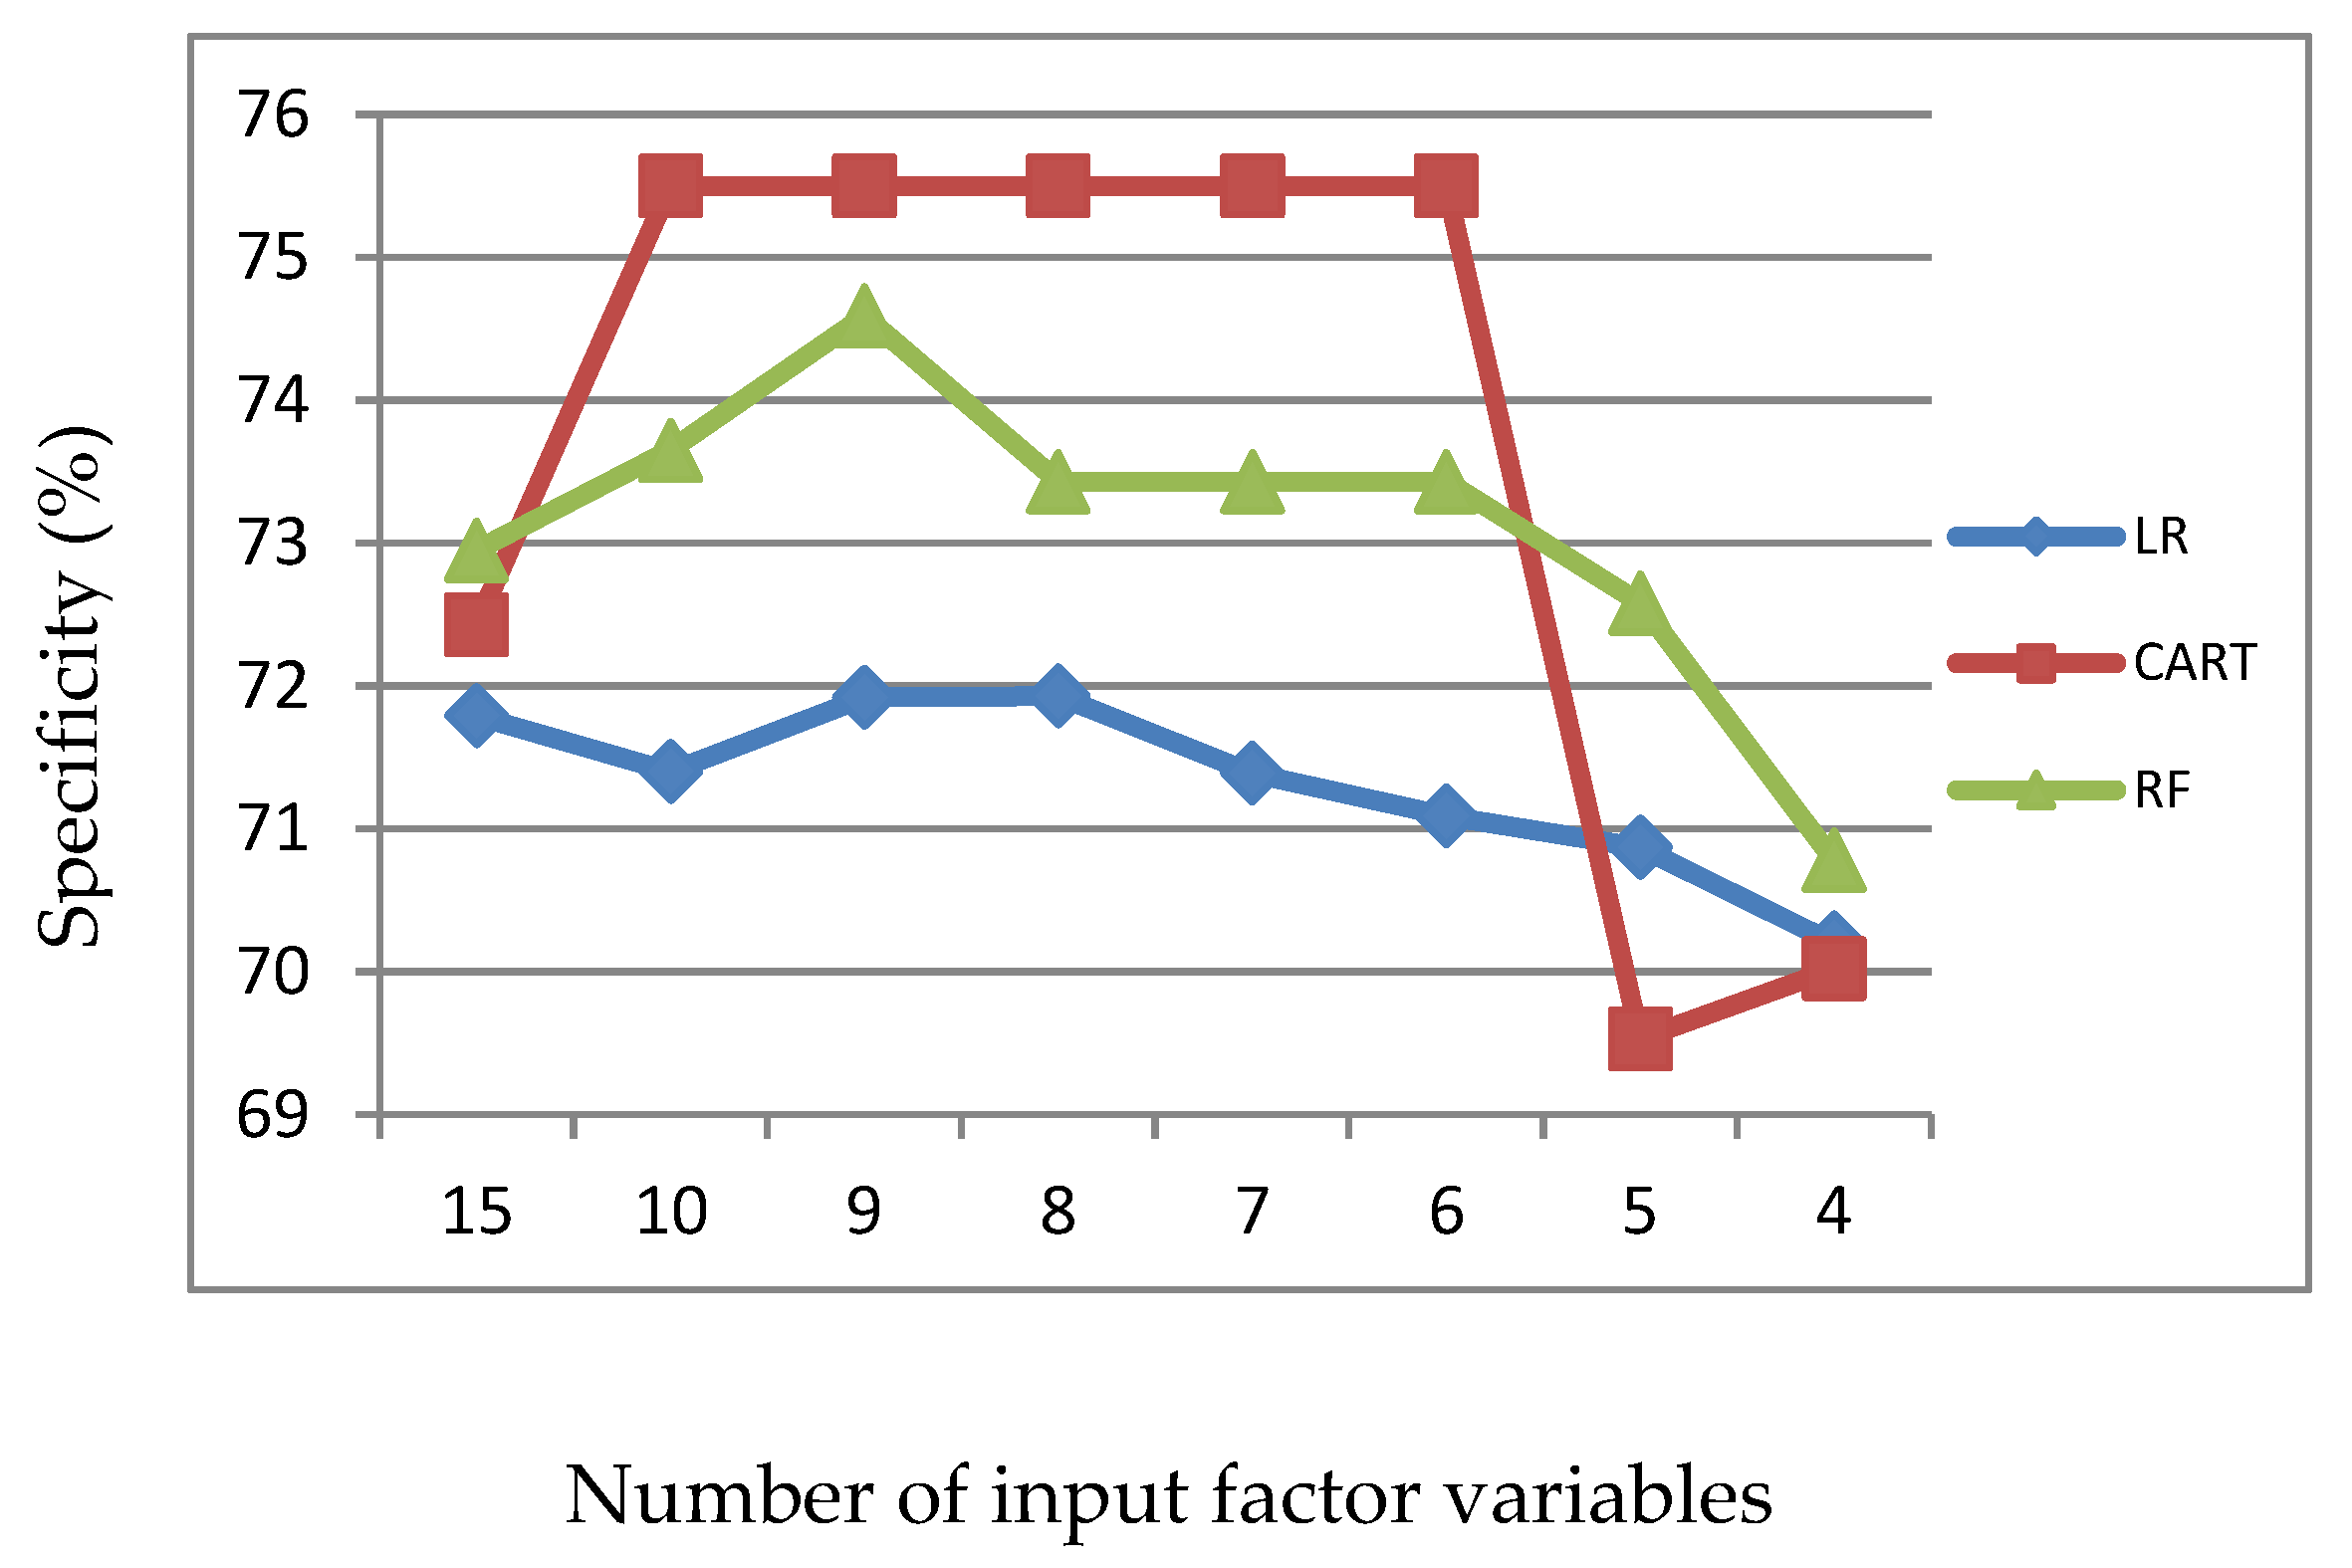
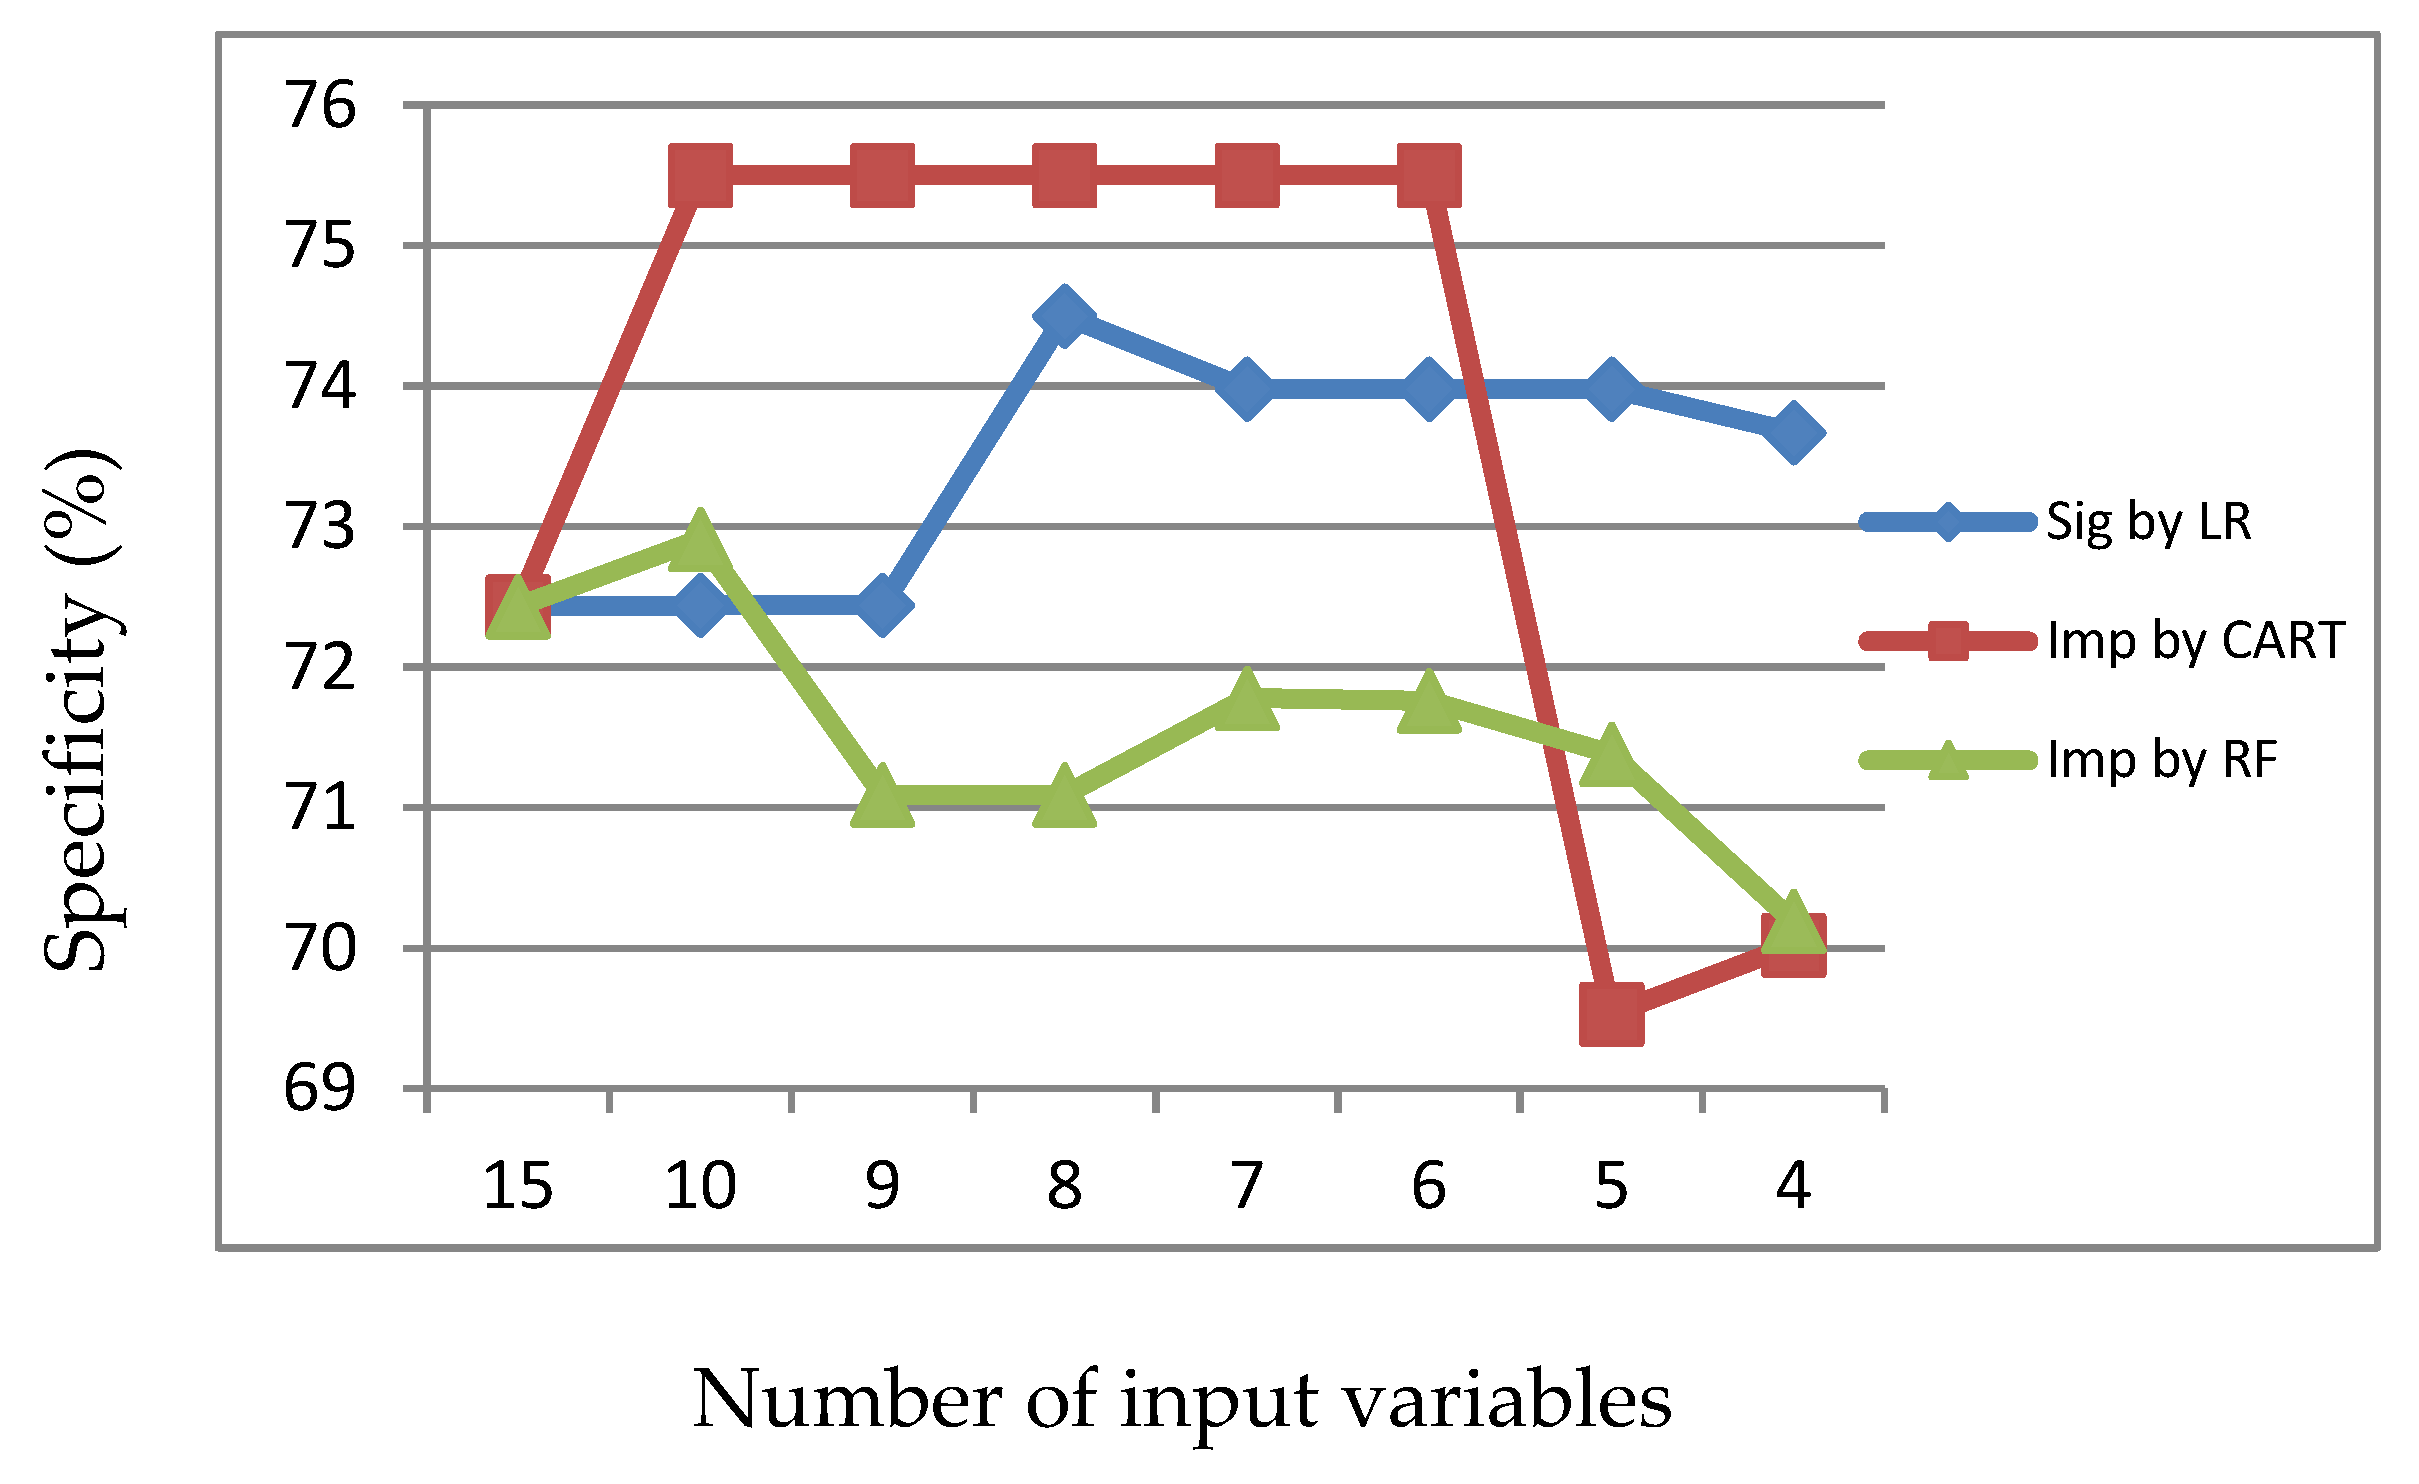
Information 11 00270 g005
Figure 6. Specificity of LR, CART and RF with input of important variables identified by CART.
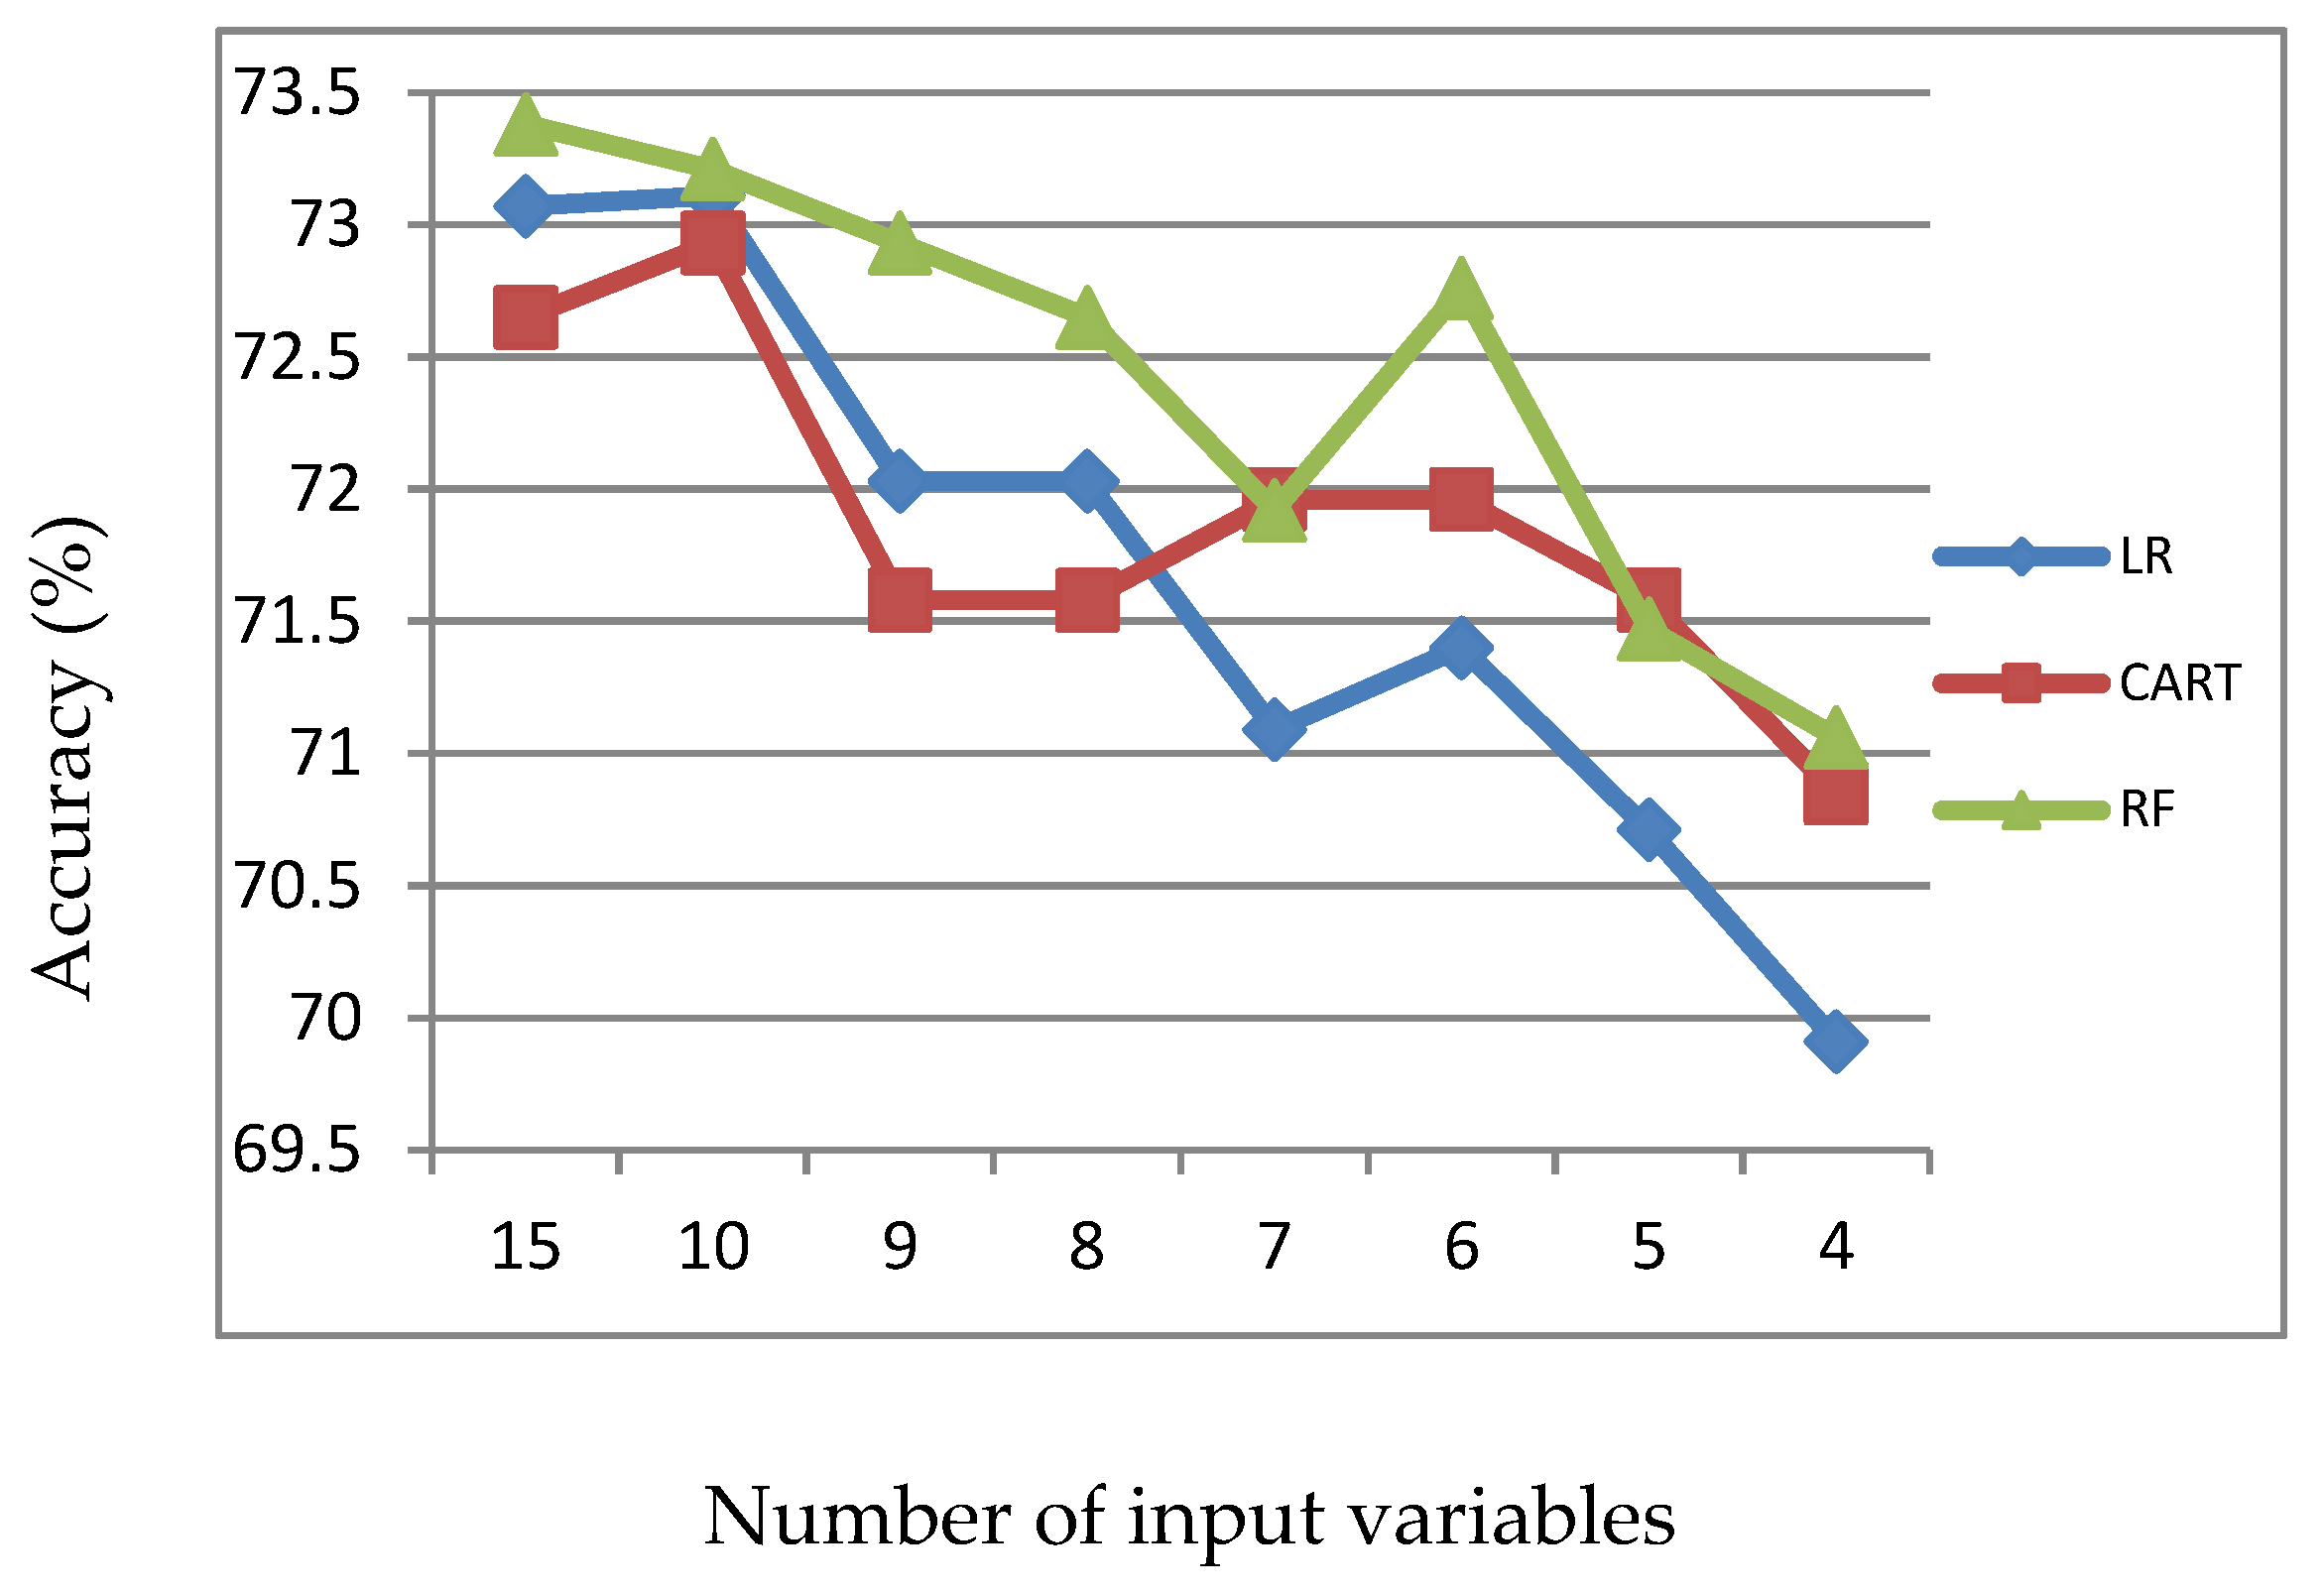
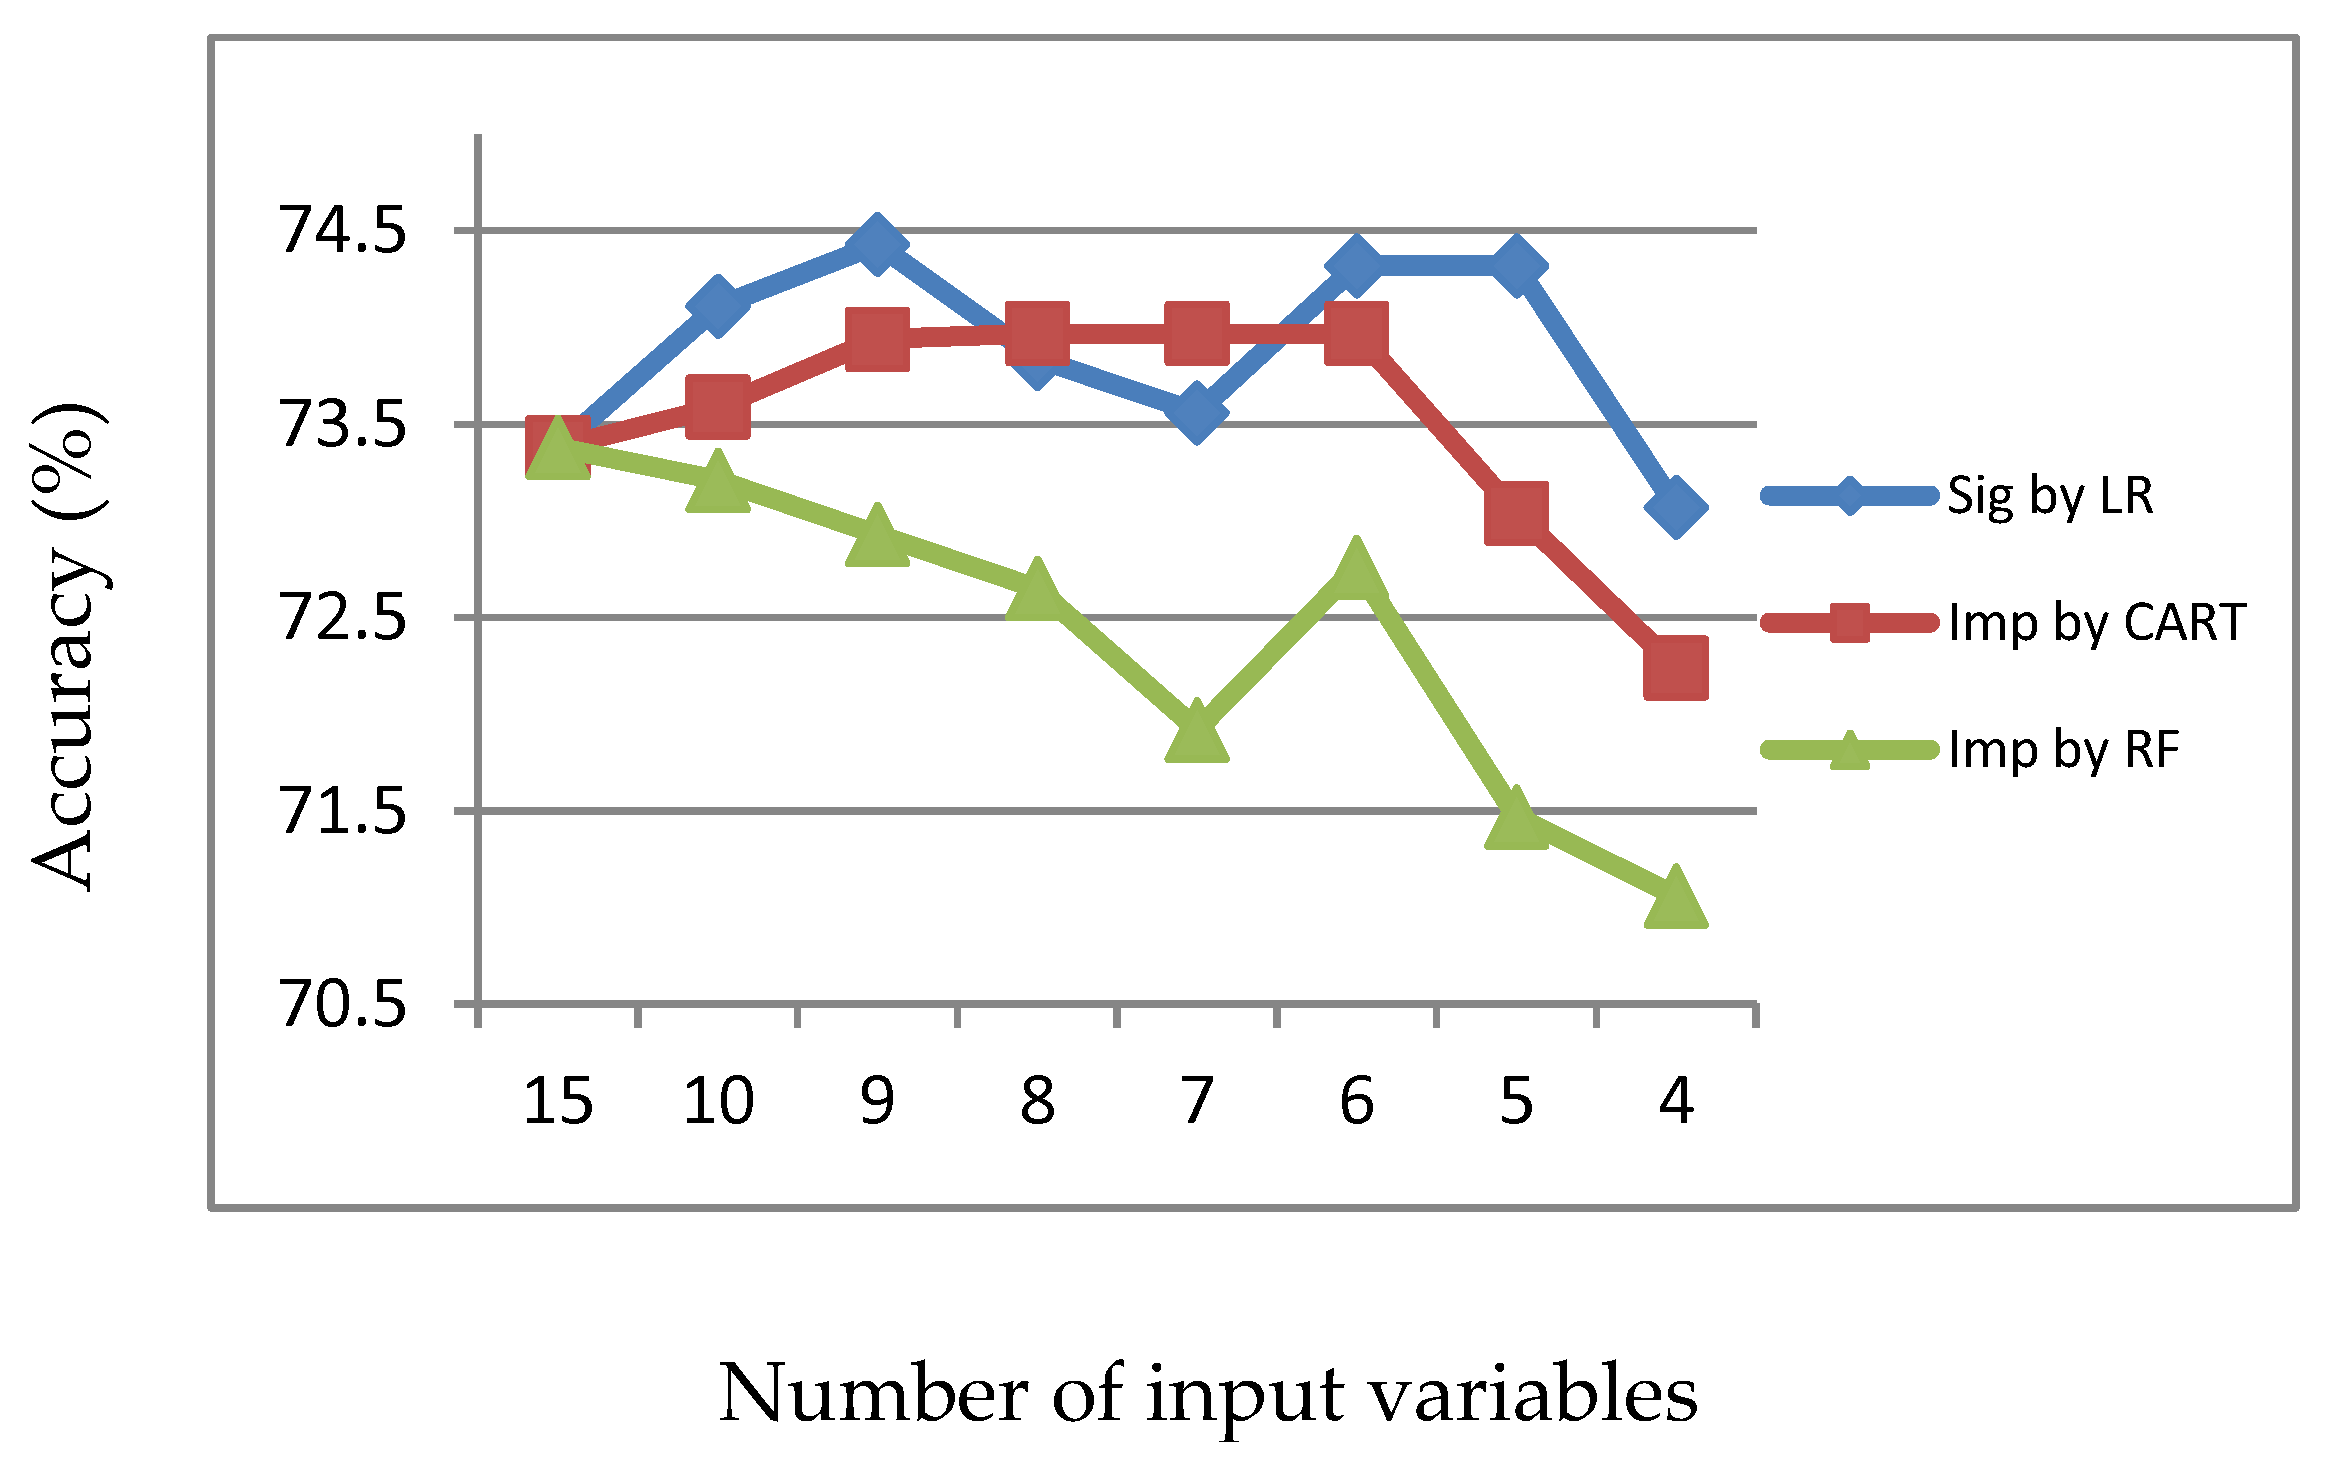
Information 11 00270 g006
Figure 7. Accuracy of LR, CART and RF with input of important variables identified by RF.
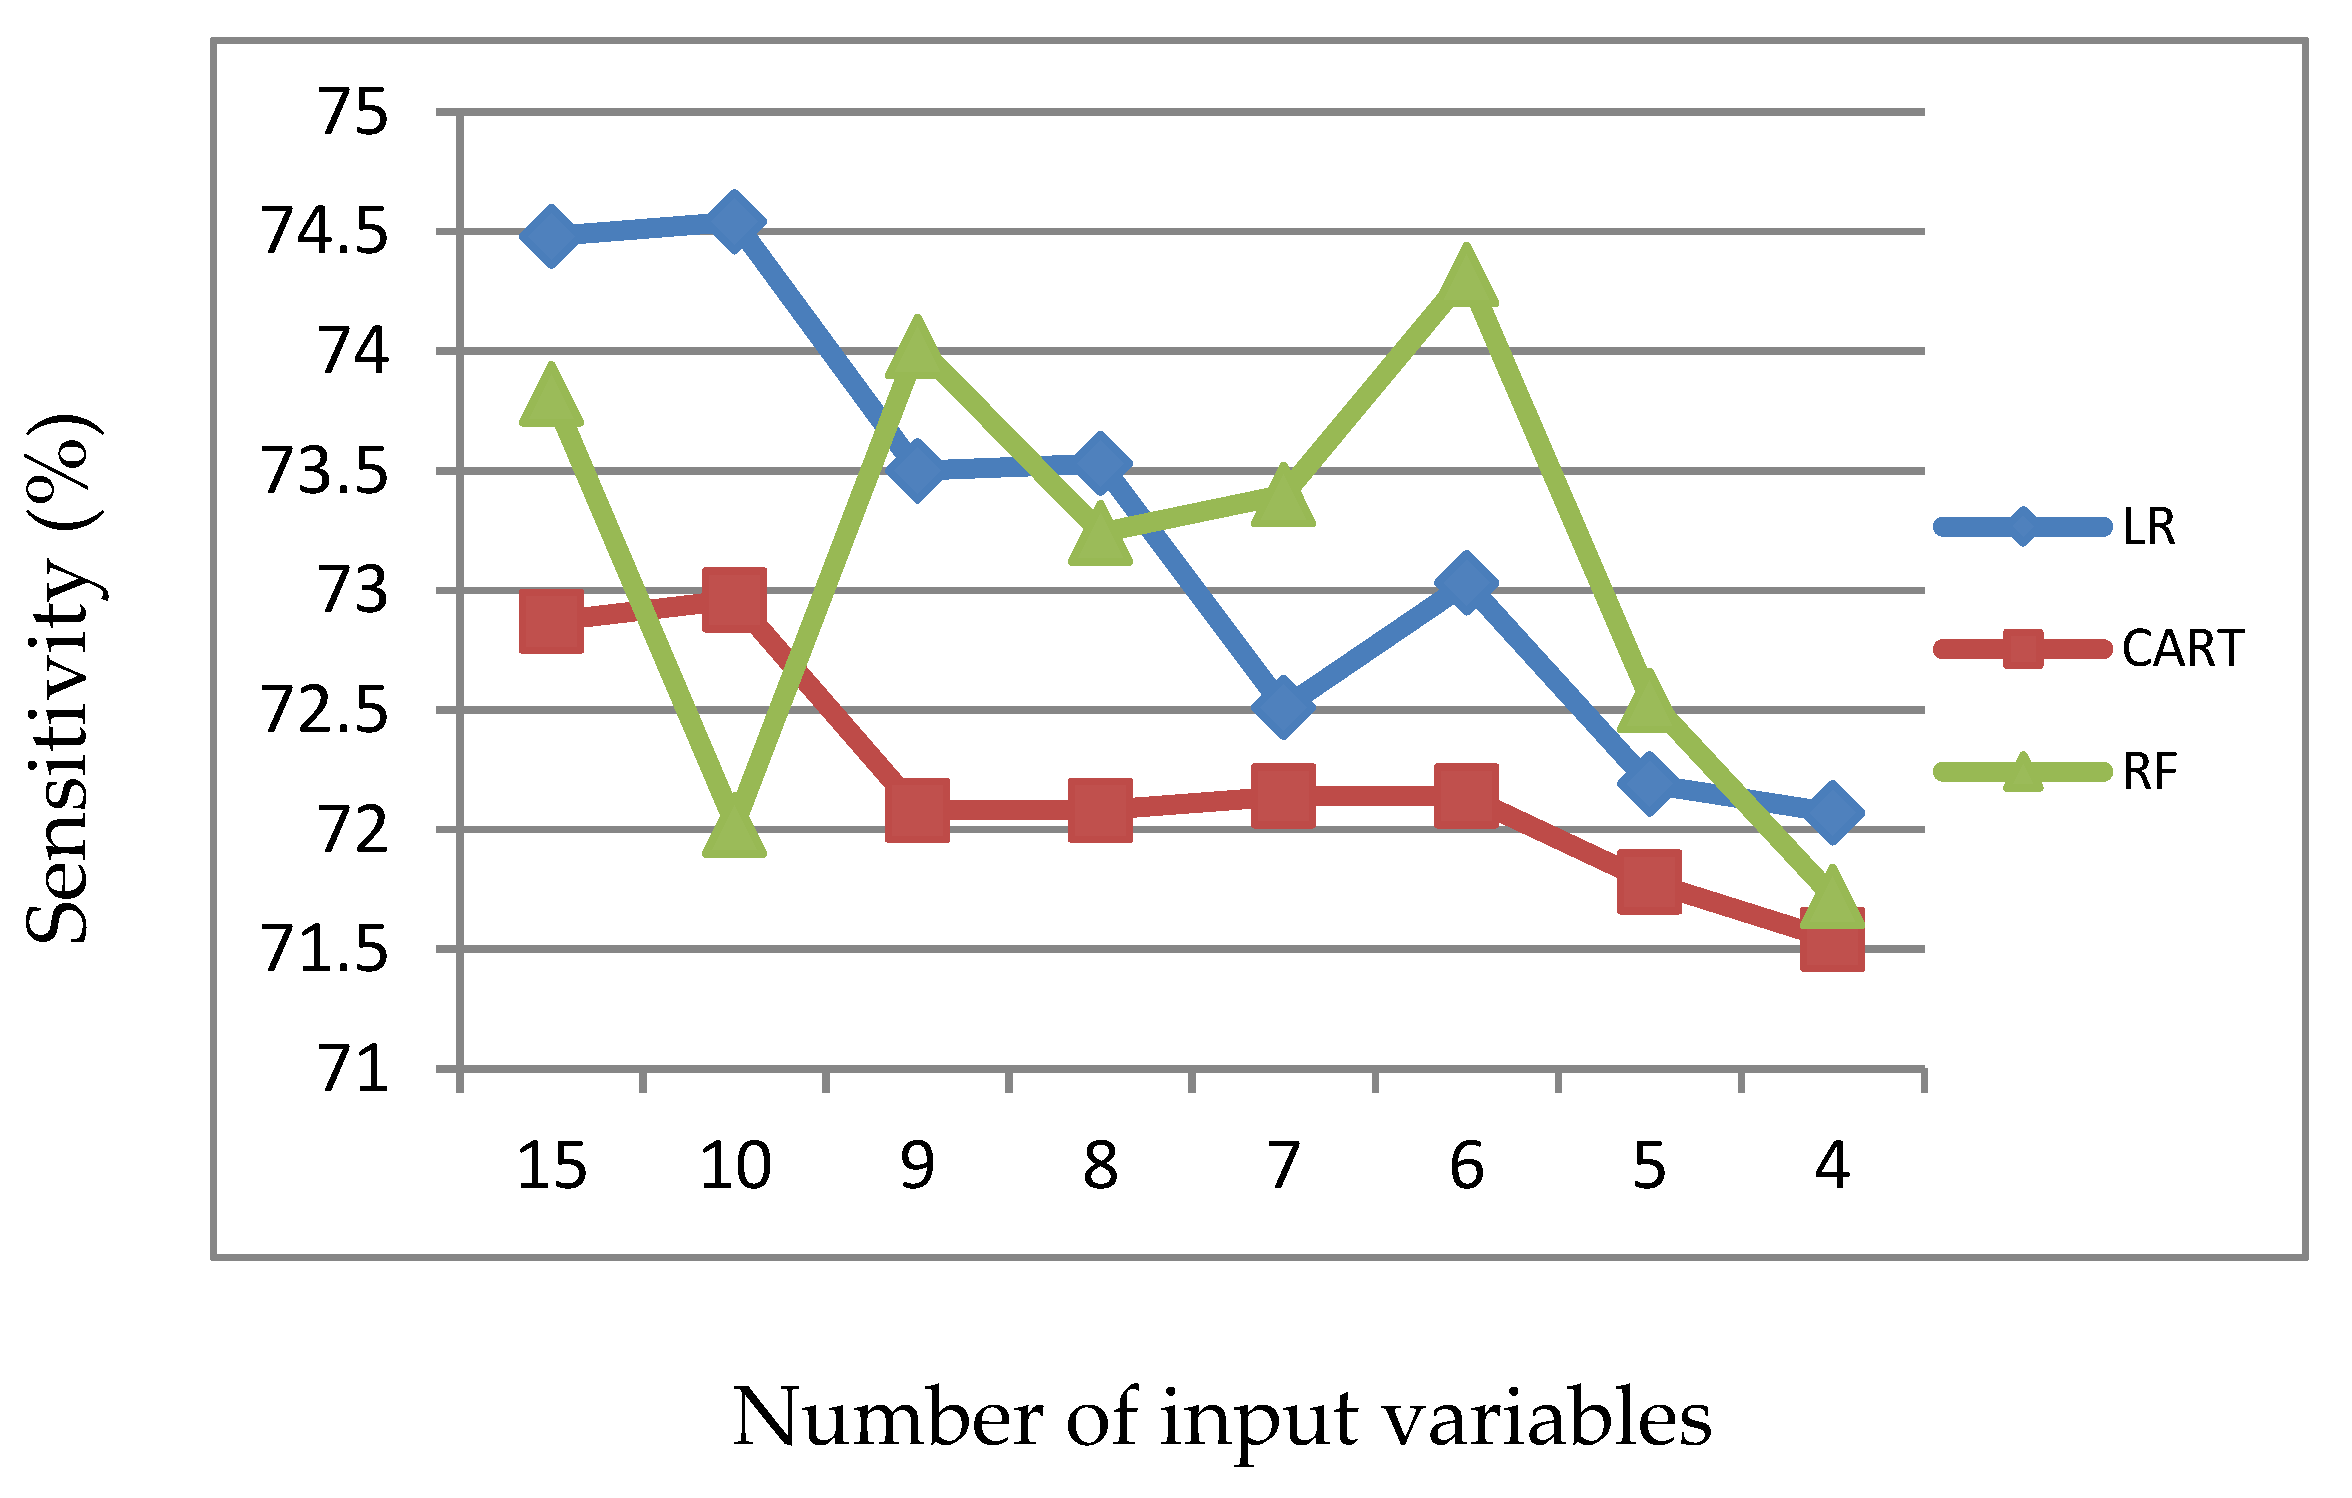
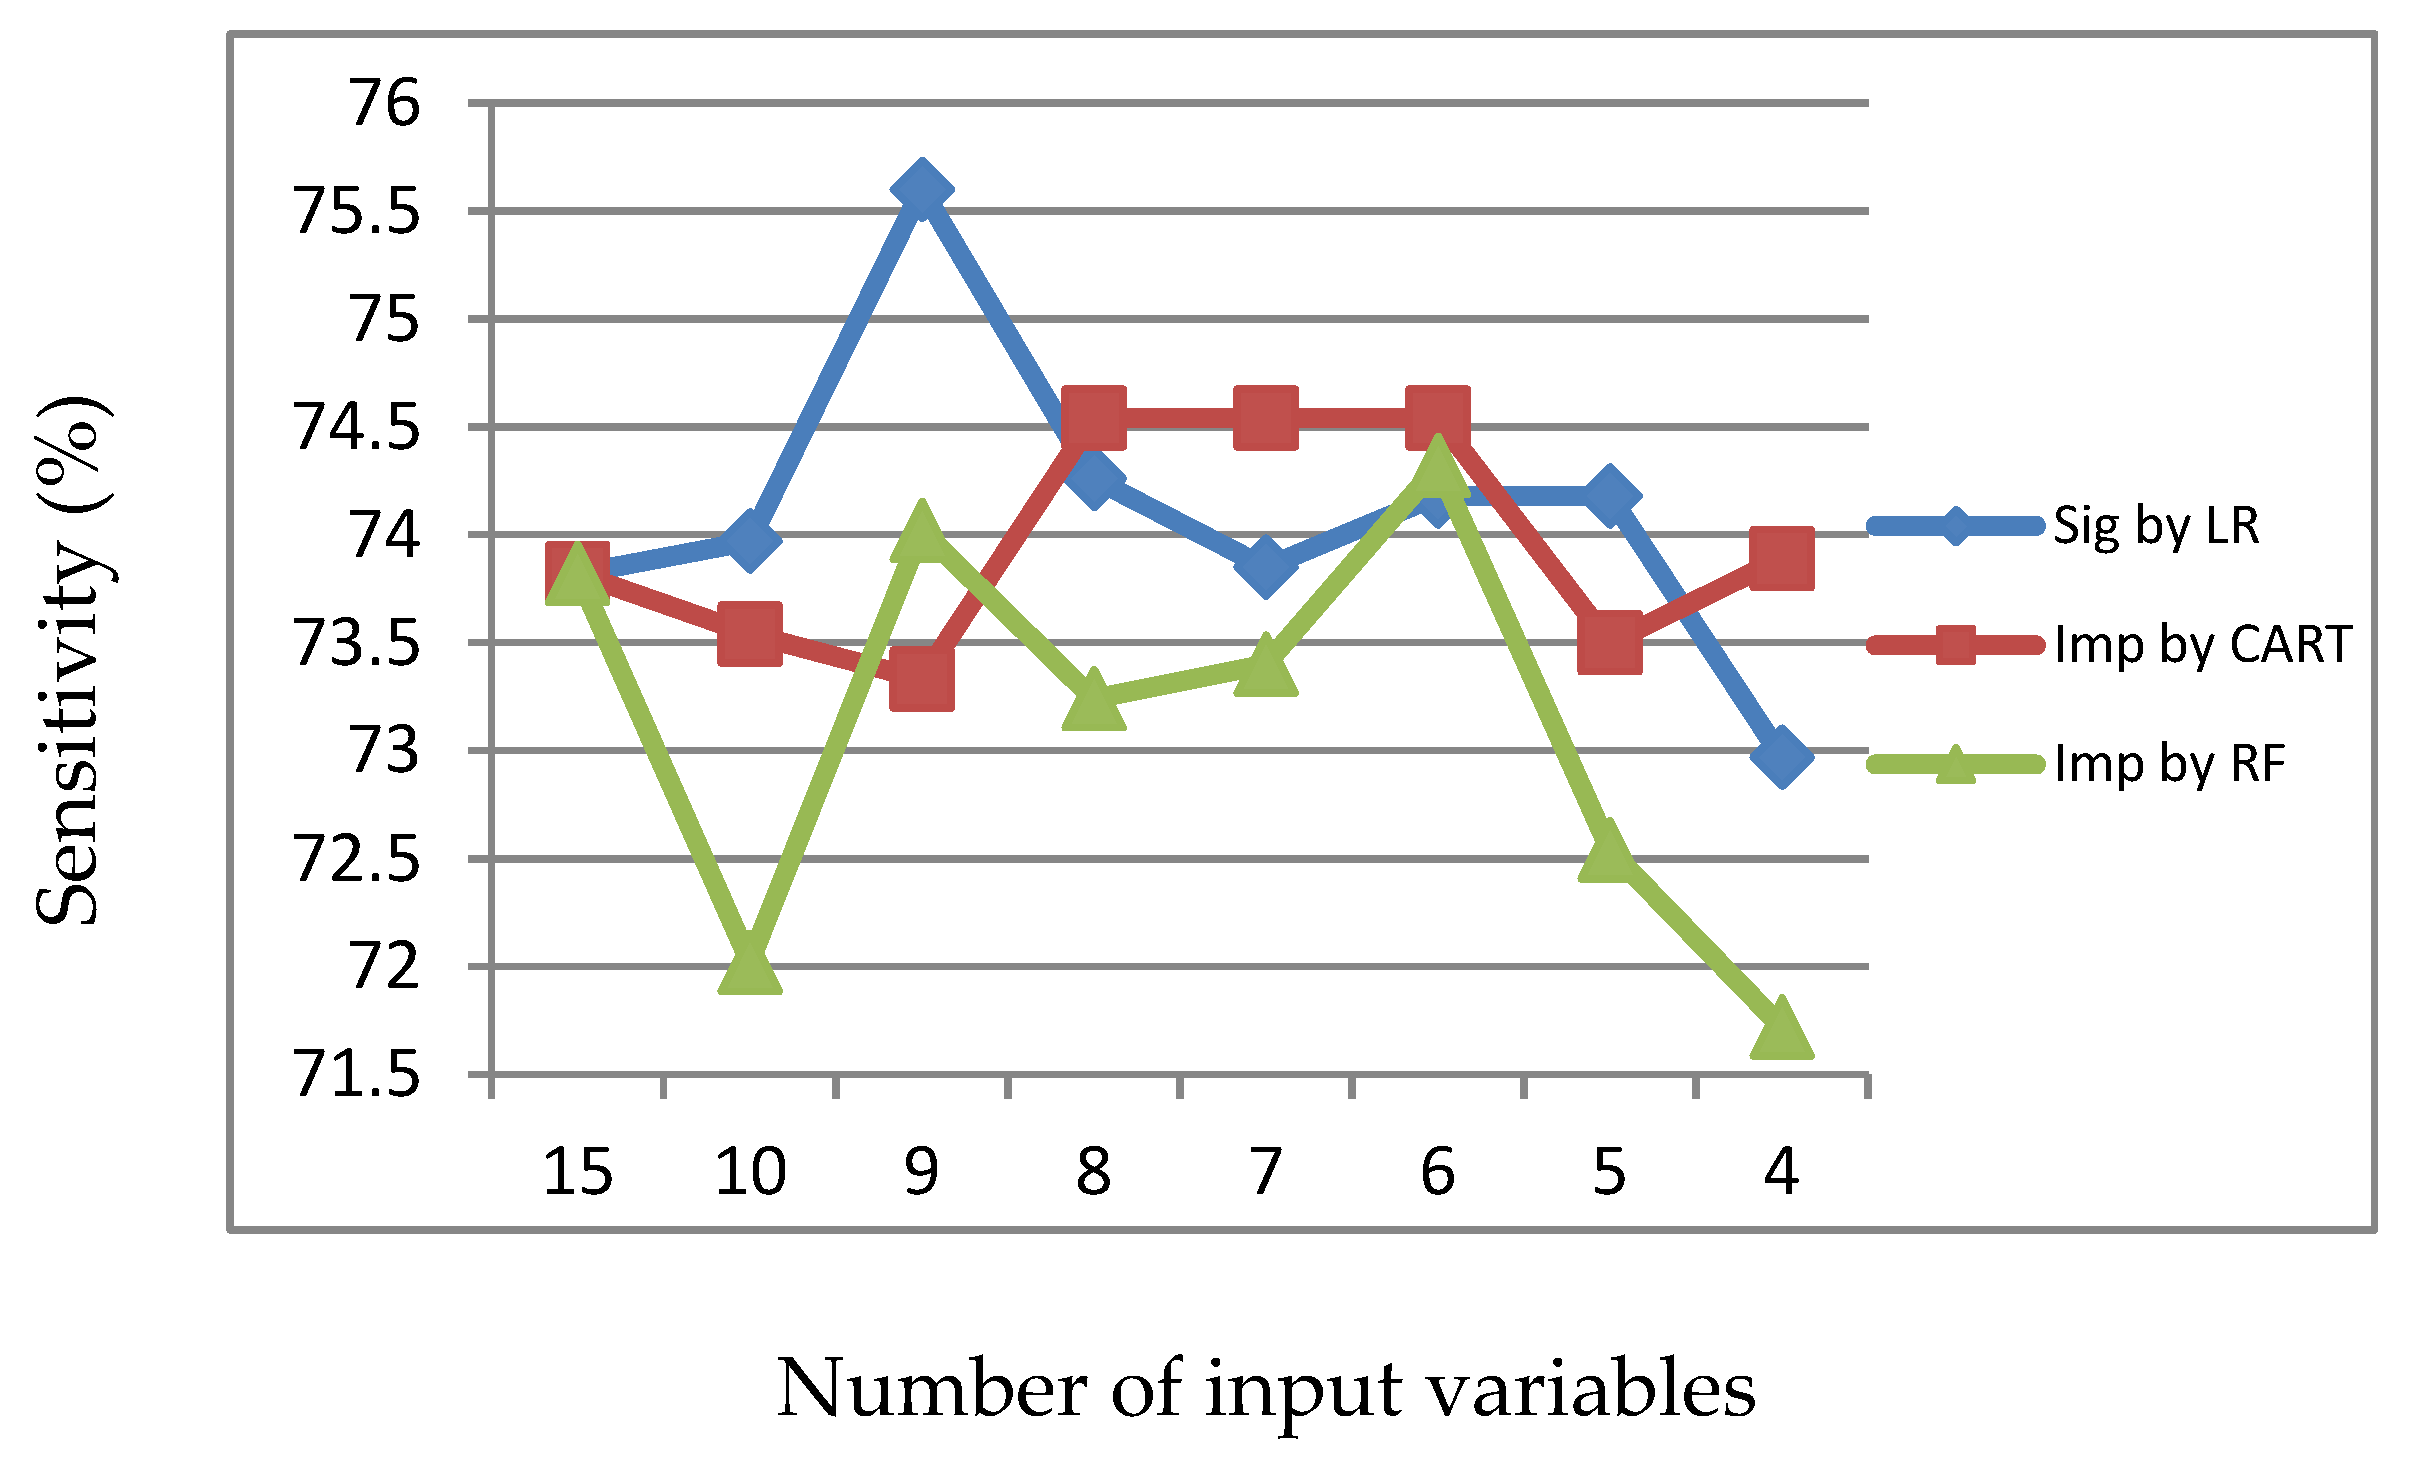
Information 11 00270 g007
Figure 8. Sensitivity of LR, CART and RF with input of important variables identified by RF.
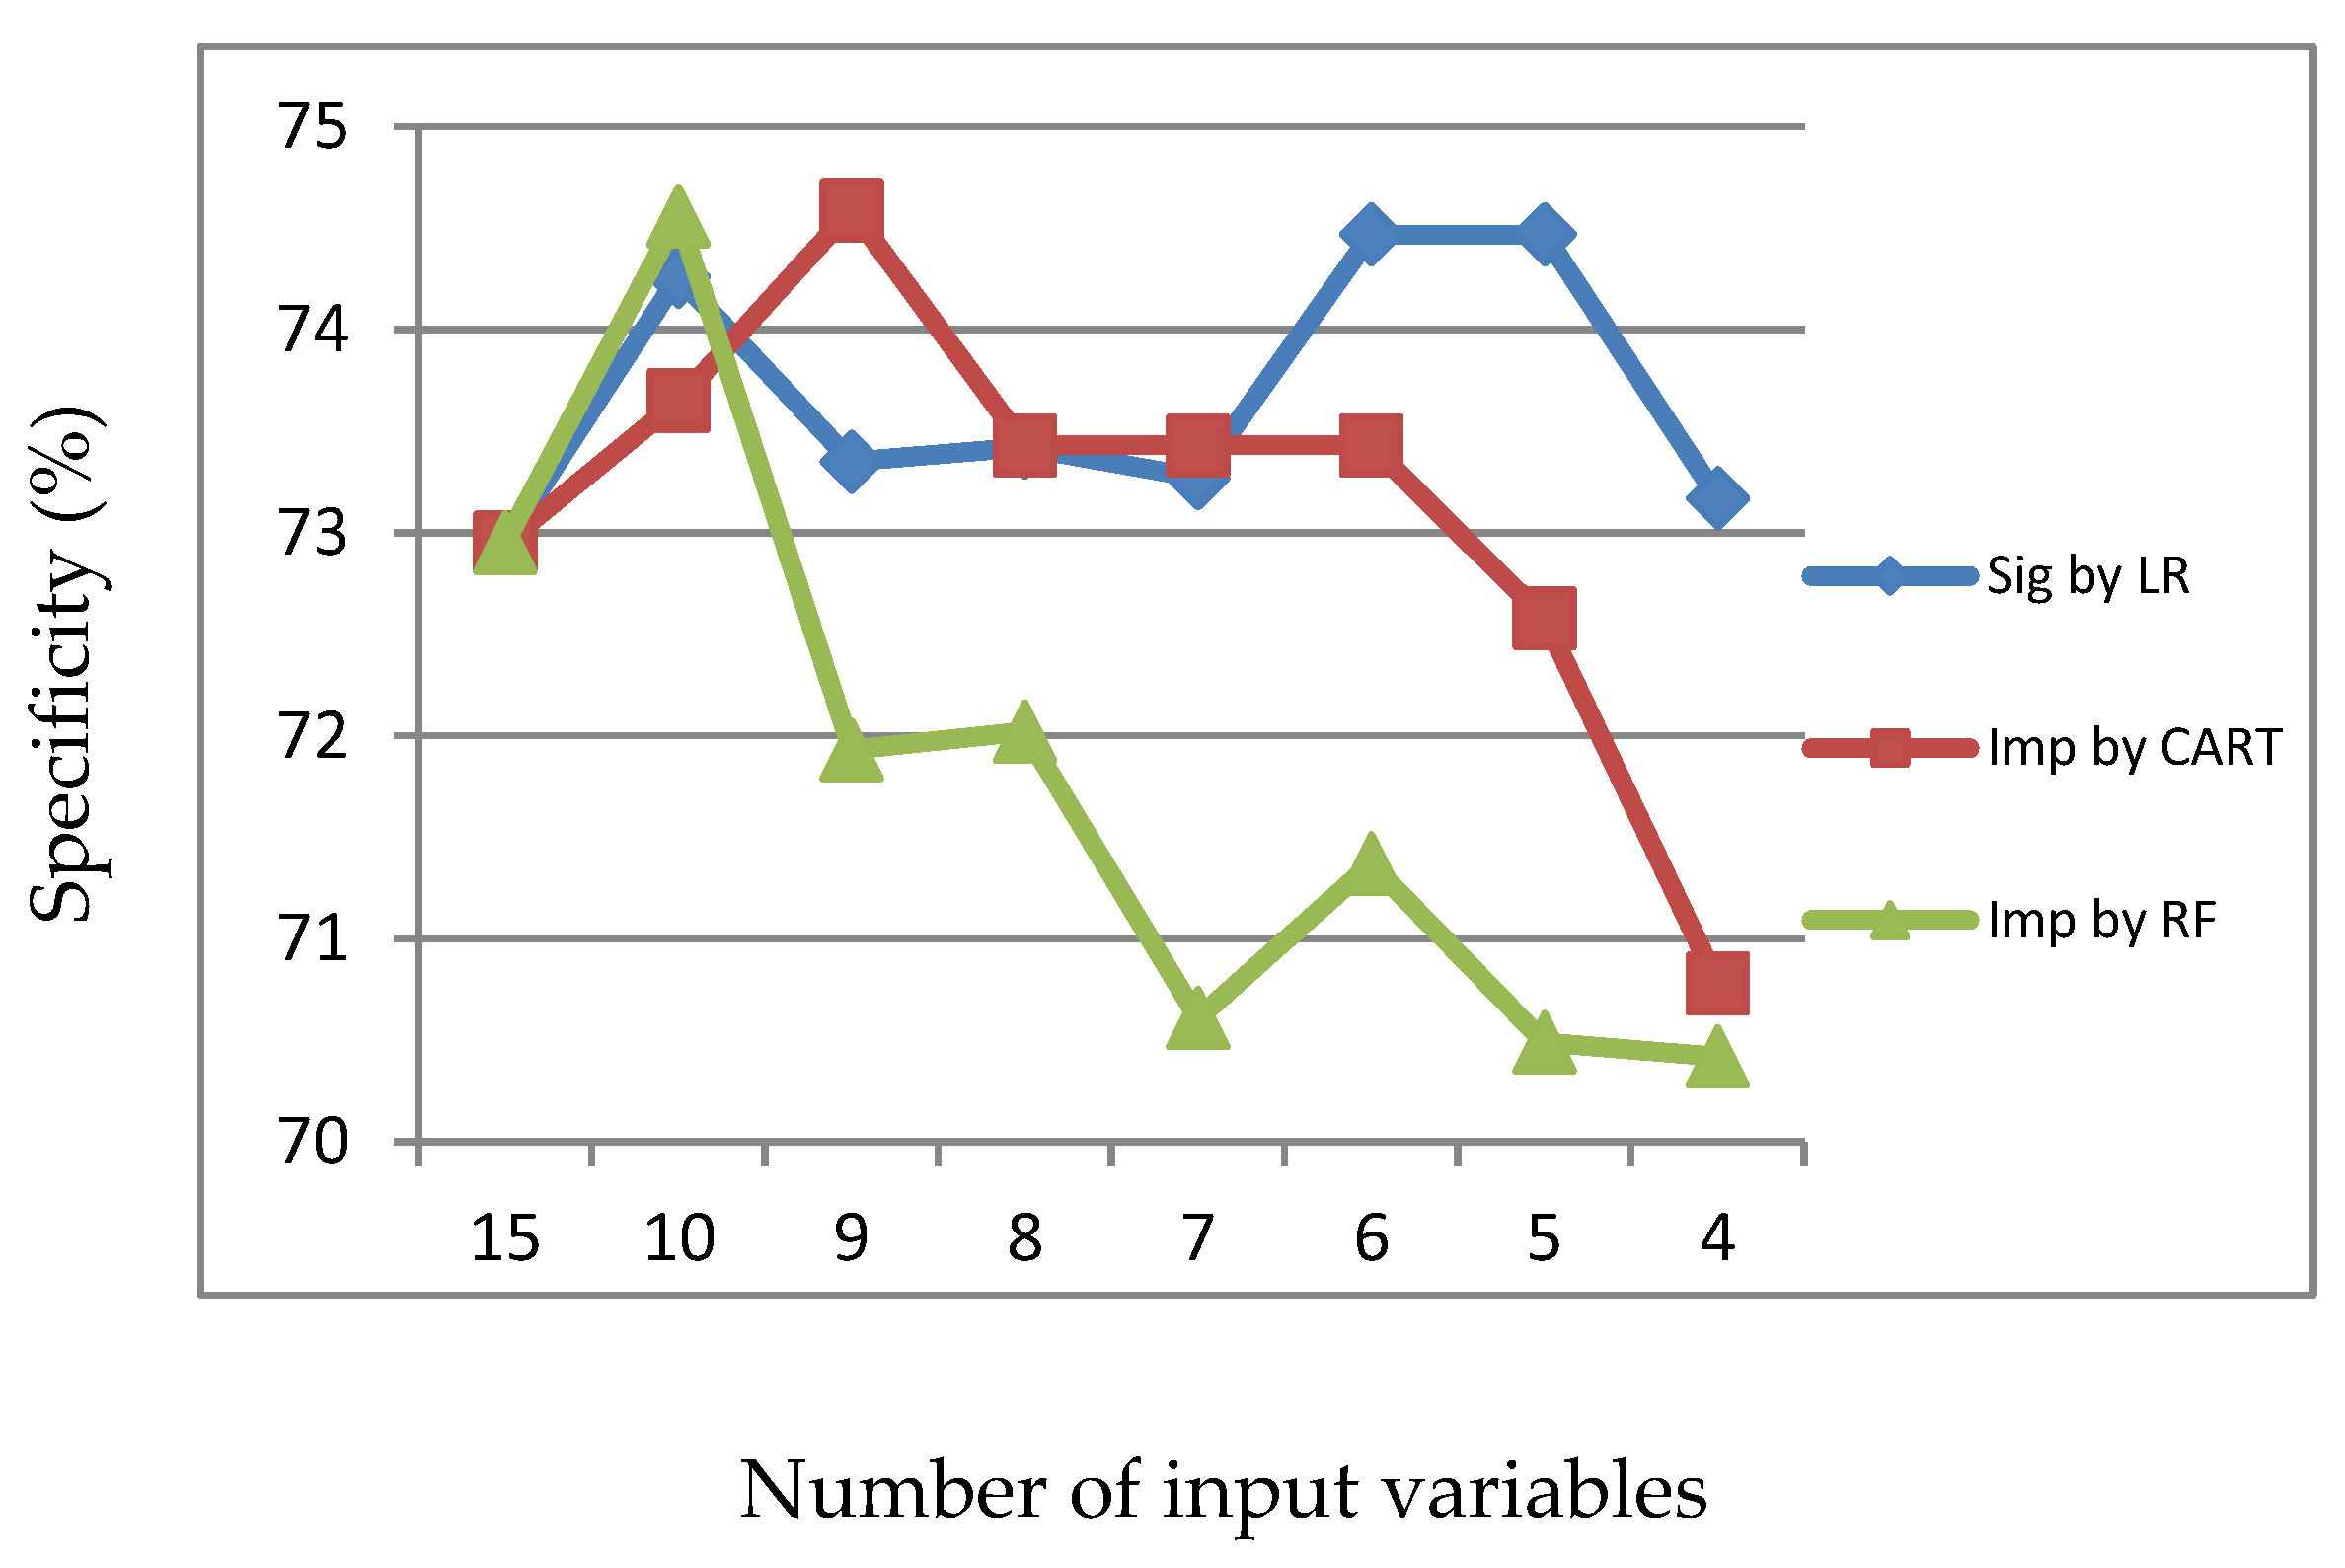
Information 11 00270 g008
Figure 9. Specificity of LR, CART and RF with input of important variables identified by RF.
Information 11 00270 g009
Figure 10. Accuracy of LR with input of significant or important variables.
Information 11 00270 g010
Figure 11. Accuracy of CART with input of significant or important variables.
Information 11 00270 g011
Figure 12. Accuracy of RF with input of significant or important variables.
Information 11 00270 g012
Figure 13. Sensitivity of LR with input of significant or important variables.
Information 11 00270 g013
Figure 14. Sensitivity of CART with input of significant or important variables.
Information 11 00270 g014
Figure 15. Sensitivity of RF with input of significant or important variables.
Information 11 00270 g015
Figure 16. Specificity of LR with input of significant or important variables.
Information 11 00270 g016
Figure 17. Specificity of CART with input of significant or important variables.
Information 11 00270 g017
Figure 18. Specificity of RF with input of significant or important variables.
Information 11 00270 g018
Table 1. Metric of multicollinearity of 15 correlated variables. GEN: driver gender; AGE: driver age; ALC: alcohol use; LIC: license; VEH: vehicle type; DRI: driver occupation; JOU: journey purpose; ACT: action; MAJ: major cause; WEA: weather condition; LIG: light condition; OBS: obstacle; CRA: crash position; LOC: location; SPE: speed limit.
GENAGEALCLICVEHDRIJOUACTMAJWEALIGOBSCRALOCSPE
GEN1−0.064−0.057−0.0090.0610.1200.0740.0090.051−0.006−0.016−0.014−0.004−0.010−0.062
AGE−0.0641−0.021−0.033−0.0440.0120.0100.0070.021−0.025−0.075−0.0040.0180.0280.059
ALC−0.057−0.02110.2190.0650.0470.1000.0110.034−0.0320.189−0.0100.0430.0340.003
LIC−0.009−0.0330.21910.1050.0390.0580.0330.028−0.0050.089−0.0060.0650.008−0.015
VEH0.061−0.0440.0650.10510.1760.1030.0320.0870.0200.009−0.0280.056−0.011−0.086
DRI0.1200.0120.0470.0390.17610.2880.0410.0550.0110.025−0.0200.0100.006−0.077
JOU0.0740.0100.1000.0580.1030.28810.0440.059−0.0040.079−0.030−0.0040.002−0.066
ACT0.0090.0070.0110.0330.0320.0410.04410.013−0.0260.0340.0130.1050.0730.039
MAJ0.0510.0210.0340.0280.0870.0550.0590.01310.1070.0200.0590.1860.125−0.122
WEA−0.006−0.025−0.032−0.0050.0200.011−0.004−0.0260.10710.0260.002−0.0350.015−0.092
LIG−0.016−0.0750.1890.0890.0090.0250.0790.0340.0200.02610.028−0.011−0.058−0.105
OBS−0.014−0.004−0.010−0.006−0.028−0.020−0.0300.0130.0590.0020.02810.031−0.027−0.034
CRA−0.0040.0180.0430.0650.0560.010−0.0040.1050.186−0.035−0.0110.03110.047−0.043
LOC−0.0100.0280.0340.008−0.0110.0060.0020.0730.1250.015−0.058−0.0270.04710.289
SPE−0.0620.0590.003−0.015−0.086−0.077−0.0660.039−0.122−0.092−0.105−0.034−0.0430.2891
Table 2. Descriptive statistics of accident data.
VariableValueTotal Number of Accidents = 9472
CountPercent (%)
Dependent variable:
Accident severity1. serious accident473650
2. minor accident473650
Independent variable:
Driver gender1. male818086.4
2. female129213.6
Driver age1. under 30 years old312132.9
2. 30–39 years old285330.1
3. 40–49 years old217022.9
4. 50–65 years old120112.7
5. above 65 years old1271.3
Alcohol use1. nondrunken driving816486.2
2. drunken driving101610.7
3. unknown2923.1
License1. with license901695.2
2. without license4074.3
3. unknown490.5
Vehicle type1. bus2863.0
2. heavy truck or tractor-trailer152016.0
3. passenger car585961.9
4. light truck168817.8
5. motorcycle or bicycle1191.3
Driver occupation1. in job657569.2
2. student2022.1
3. jobless5475.8
4. unknown214822.7
Journey purpose1. commuting trip130113.7
2. business trip4464.7
3. transportation activity148716.2
4. visiting, shopping or touring trip9399.7
5. others529955.9
Action1. forward687672.6
2. leftward lane change6556.9
3. rightward lane change8318.8
4. overtaking220.2
5. abrupt deceleration5906.2
6. others4985.3
Major cause1. improper lane change98610.2
2. speeding1892.0
3. failure to keep a safe distance400242.3
4. driving disability8779.3
5. failure to pay attention to the front6456.8
6. brake failure or tire puncture6136.5
7. reverse driving a350.4
8. others212522.4
Weather condition1. sunny664370.1
2. cloudy8368.8
3. rainy, stormy or foggy199321.0
Light condition1. daytime534056.4
2. dawn or dusk2792.9
3. nighttime with illumination237225.0
4. nighttime without illumination148115.6
Obstacle1. none903795.4
2. work zone2722.9
3. broken down vehicle on road610.6
4. others1021.1
Crash position1. car front523355.2
2. car rear2122.2
3. car right side187019.7
4. car left side186819.7
5. others2893.1
Location1. traffic lane700273.9
2. ramp122913.0
3. acceleration and deceleration lane2222.3
4. shoulder4895.2
5. others5305.6
Speed limit1. 110 km/h218623.1
2. 100 km/h405442.8
3. 90–70 km/h136714.4
4. 60–40 km/h186519.7
Note: a Reverse driving in this paper indicates driving in the direction opposite to the flow of traffic.
Table 3. Comparisons between significant variables and important variables. LR: logistic regression; CART: classification and regression tree; RF: and random forest.
Significant Variables by LRImportant Variables by CART Important Variables by RF
Variablep-ValueVariableImportance ScoreVariableImportance Score
Major cause0.000Major cause0.61Driver age21.15
Vehicle type0.000Alcohol use0.06Major cause15.10
Speed limit0.000Location0.05Journey purpose14.25
Alcohol use0.000Speed limit0.04Crash position12.20
Crash position0.000Crash position0.03Light condition11.35
License0.000Vehicle type0.03Vehicle type10.65
Journey purpose0.000Obstacle0.03Action10.50
Light condition0.000License0.03Location9.85
Location0.000Driver occupation0.03Weather condition9.50
Action0.001Journey purpose0.03Speed limit8.80
Table 4. Accuracy, sensitivity and specificity of LR, CART and RF with input of the 15 original variables.
Input Variables LR (%)CART (%)RF (%)
15 original variablesAccuracy73.0772.6573.38
Sensitivity74.4872.8773.82
Specificity71.7972.4372.95
Table 5. Accuracy, sensitivity and specificity of LR, CART and RF with input of significant variables identified by LR.
Input Variables LR (%)CART (%)RF (%)
15 original variablesAccuracy73.0772.6573.38
Sensitivity74.4872.8773.82
Specificity71.7972.4372.95
10 significant variables by LRAccuracy73.0772.6574.11
Sensitivity74.6772.8773.97
Specificity71.6572.4474.26
9 significant variables by LRAccuracy72.9372.6574.43
Sensitivity74.5972.8275.60
Specificity71.4772.4473.35
8 significant variables by LRAccuracy72.8272.973.84
Sensitivity73.9271.5274.26
Specificity71.1974.5073.42
7 significant variables by LRAccuracy72.5272.6273.56
Sensitivity73.8771.4273.85
Specificity71.3073.9873.27
6 significant variables by LRAccuracy72.4572.6274.32
Sensitivity73.6271.4274.18
Specificity71.3773.9874.47
5 significant variables by LRAccuracy72.2472.6274.32
Sensitivity74.2771.4274.18
Specificity71.0073.9874.47
4 significant variables by LRAccuracy71.7272.1373.07
Sensitivity73.0470.8072.97
Specificity70.5273.6773.17
Table 6. Accuracy, sensitivity and specificity of LR, CART and RF with input of important variables identified by CART.
Input Variables LR (%)CART (%)RF (%)
15 original variablesAccuracy73.0772.6573.38
Sensitivity74.4872.8773.82
Specificity71.7972.4372.95
10 important variables by CART Accuracy72.7672.4173.59
Sensitivity74.2870.0273.54
Specificity71.4075.5073.65
9 important variables by CART Accuracy72.8672.4173.94
Sensitivity73.8870.0273.33
Specificity71.9275.5074.59
8 important variables by CART Accuracy72.5672.4173.97
Sensitivity73.7970.0274.54
Specificity71.9375.5073.43
7 important variables by CARTAccuracy72.4872.4173.97
Sensitivity73.6770.0274.54
Specificity71.3975.5073.43
6 important variables by CART Accuracy72.3472.4173.97
Sensitivity73.7370.0274.54
Specificity71.0975.5073.43
5 important variables by CART Accuracy72.3470.9973.04
Sensitivity74.0272.6573.50
Specificity70.8769.5372.58
4 important variables by CARTAccuracy71.5170.8872.24
Sensitivity73.1671.8173.89
Specificity70.2070.0270.78
Table 7. Accuracy, sensitivity and specificity of LR, CART and RF with input of important variables identified by RF.
Input VariablesLR (%)CART (%)RF (%)
15 original variablesAccuracy73.0772.6573.38
Sensitivity74.4872.8773.82
Specificity71.7972.4372.95
10 important variables by RF Accuracy73.1172.9373.21
Sensitivity74.5472.9672.02
Specificity71.8272.9174.56
9 important variables by RFAccuracy72.0371.5872.93
Sensitivity73.5072.0874.02
Specificity70.7271.0971.93
8 important variables by RF Accuracy72.0371.5872.65
Sensitivity73.5372.0873.24
Specificity70.7071.0972.02
7 important variables by RF Accuracy71.0971.9671.92
Sensitivity72.5172.1473.40
Specificity69.8271.7870.61
6 important variables by RF Accuracy71.471.9672.76
Sensitivity73.0372.1474.32
Specificity69.9771.7671.37
5 important variables by RFAccuracy70.7171.5871.47
Sensitivity72.1971.7872.54
Specificity69.4071.3870.49
4 important variables by RFAccuracy69.9170.8571.06
Sensitivity72.0771.5471.72
Specificity68.1170.1970.42
Table 8. Estimation result of variable “major cause” and “action”.
VariableValueBp-ValueExp(B)
Major cause1. improper lane change–1.0780.0000.340
2. speeding0.6850.0011.984
3. failure to keep a safe distance–1.8550.0000.157
4. driving disability–0.0340.8090.967
5. failure to pay attention to the front–0.5840.0000.557
6. brake failure or tire puncture0.1210.2981.128
7. reverse driving1.7800.0195.931
8. others0 b00
Action1. forward0.1640.1701.178
2. left lane change0.1890.2501.208
3. right lane change0.4250.0081.529
4. overtaking1.5710.0064.810
5. abrupt deceleration–0.0090.9560.991
6. others0 b00
Reference base: minor accident. Note: b It indicates that “others” is the reference base for the 2 variables of “major cause” and “action”.
Table 9. Rules converted from tree graph as the output of CART.
IDRuleS%C%L
AntecedentConsequent
1Vehicle type = (BS, HT)Severity = MIN1.1785.561.72
and major cause = (ILC, FKS)
and location = (RP)
2Vehicle type = (PC, LT)Severity = MIN0.9579.751.60
and major cause = (ILC)
and speed limit = (60–40)
3Major cause = (SP, DDA, FPF, BRF, RD, OR)Severity = SER10.0586.231.72
and alcohol use = (DRD, UNK)
4Major cause = (SP, DDA, FPF, BRF, RD, OR)Severity = SER20.9071.081.42
and alcohol use = (NDR)
and speed limit = (110, 100, 90–70)

