Article

Engagement in Non-Driving Related Tasks as a Non-Intrusive Measure for Mode Awareness: A Simulator Study

1
BMW Group, Knorrstr. 147, 80937 Munich, Germany
2
Department of Mechanical Engineering, Technical University Munich, Boltzmannstr. 15, 85748 Garching, Germany
*
Author to whom correspondence should be addressed.
Information 2020, 11(5), 239; https://doi.org/10.3390/info11050239
Submission received: 8 April 2020 / Revised: 16 April 2020 / Accepted: 23 April 2020 / Published: 28 April 2020

Abstract

:
Research on the role of non-driving related tasks (NDRT) in the area of automated driving is indispensable. At the same time, the construct mode awareness has received considerable interest in regard to human–machine interface (HMI) evaluation. Based on the expectation that HMI design and practice with different levels of driving automation influence NDRT engagement, a driving simulator study was conducted. In a 2 × 5 (automation level x block) design, N = 49 participants completed several transitions of control. They were told that they could engage in an NDRT if they felt safe and comfortable to do so. The NDRT was the Surrogate Reference Task (SuRT) as a representative of a wide range of visual–manual NDRTs. Engagement (i.e., number of inputs on the NDRT interface) was assessed at the onset of a respective episode of automated driving (i.e., after transition) and during ongoing automation (i.e., before subsequent transition). Results revealed that over time, NDRT engagement increased during both L2 and L3 automation until stable engagement at the third block. This trend was observed for both onset and ongoing NDRT engagement. The overall engagement level and the increase in engagement are significantly stronger for L3 automation compared to L2 automation. These results outline the potential of NDRT engagement as an online non-intrusive measure for mode awareness. Moreover, repeated interaction is necessary until users are familiar with the automated system and its HMI to engage in NDRTs. These results provide researchers and practitioners with indications about users’ minimum degree of familiarity with driving automation and HMIs for mode awareness testing.

1. Introduction

The market introduction of vehicles equipped with SAE Level 3 (L3) automated driving systems (ADS) is only a matter of time. Automated driving promises numerous benefits: among others, it is expected to foster efficiency in terms of time usage. The driver may divert his/her attention to non-driving related activities while the ADS is executing vehicle guidance. SAE Level 2 (L2) driving automation—which is already commercially available—is also capable of controlling vehicle guidance while the driver still has to constantly monitor the system functioning [1]. L3 automated driving systems differ from L2 automation in such a manner that the driver has to be readily available as a fallback performer in case the system requests a transition to manual control. Thus, with the transition from L2 to L3 automation, the human driver’s role shifts from that of an active system supervisor to a fallback-ready user who may engage in non-driving related tasks (NDRT). The availability of different driving modes (i.e., L1, L2, and L3) in one vehicle poses additional challenges to the driver to understand his/her role accordingly and not to confuse different automation modes and levels. Mode awareness as a critical issue in driving automation requires further research efforts for ensuring safe operation of different automated driving functions. Knowledge on the assessment of mode awareness, however, is scarce. Addressing this issue, the present study examines engagement in a representative visual–manual NDRT during different levels of automated driving as a non-intrusive measure for mode awareness. In the following, we first outline theoretical backgrounds on mode awareness and methodology to assess this construct. Subsequently, the research question and hypotheses are derived based on the preceding considerations.

2. Background

In the automotive context, the evaluation of HMIs has a long history. The distraction potential of in-vehicle information systems (IVIS) is the main focus for manual driving (SAE L0). Here, test procedures to assess visual workload associated with the IVIS have already been established [2,3]. However, the change of the driver’s role from manual driver to supervisor in L2 and fallback performer in L3 automation renders the application of these methods unfeasible. For example, NHTSA distraction guidelines only permit 2 s per glance and 12 s total glance duration on IVIS. It might be questionable whether these numbers as they were proposed for manual driving are also suitable for L2 automation. In addition, with the driving automation executing longitudinal and lateral vehicle control, distance and lane keeping are not applicable measures for indicating the suitability of an HMI in this particular context. In contrast, a variety of constructs related to the safe driver–automation interaction such as trust [4,5,6,7] controllability [8,9,10], understanding in form of mental models [11,12,13], or usability [14] could be used as criteria. Research has shown that these pose challenges to the design and evaluation of automated vehicle HMIs. For an outline of evaluation methods for automated vehicle HMIs see [15]. One further step towards an ADS method validation concerns the investigation of mode awareness. This term was proposed by Sarter and Woods [16]. The authors report that even pilots who can be considered highly skilled and trained operators of flight automation can face situations where they are not certain of roles and responsibilities for the aircraft operation task. Such situations can lead to dangerous outcomes and consequently a safety-related assessment is indispensable.
Mode awareness is a central aspect for appropriate and safe human–automation interaction in general and in the context of driving automation in particular. For example, Gopinath and Johansen [17] outline that mode awareness of operators is of crucial importance for safety when interacting with production robots. By appropriate design of the automation and according HMIs, safety risks can be mitigated (e.g., [18]). In the driving automation context, Feldhuetter, Segler and Bengler [19] provide evidence that drivers’ mode awareness is reduced when the vehicle is equipped with additional driving automation functions (see also [20]). Similar to the proposal by Gopinath and Johansen [17], they investigated whether an adaptive HMI design could support mode awareness, but could not find an effect. Other research supports their hypothesis that HMI design can affects drivers’ visual behavior. For example, Kraft, Naujoks, Woerle and Neukum [21] report the impact of the HMI design on glance distributions during active L2 automation. In this study, a reduced and simple display produced positive effects in terms of distraction on both a self-reported and behavioral level. In addition, familiarity-dependent practice effects occurred for glance patterns. In general, behavioral adaptation to automated driving can be expected as outlined in [22]. An appropriate design of L3 automated vehicle HMIs can support self-reported usability and trust in automation (Hergeth, 2016). Since trust is expected to determine reliance behavior [6,23], we assume that such HMI variations can also affect behavioral parameters concerning NDRT engagement. This influence of HMI design on user behavior is of high importance since it must convey information about the driver’s role during active L2 and L3 functioning. Investigating mode awareness between driving episodes, Feldhuetter and colleagues [24] tested whether manual driving episodes as intermittent features between transitions of L2 and L3 automation can help to promote mode awareness. In this experiment, they operationalized mode awareness via the visual attention towards driving-relevant areas and engagement in NDRTs. The study shows that there is a difference of visual attention allocation and NDRT engagement. However, it remains unknown whether this observation is stable or prone to changes over time. As there is research indicating behavioral changes in interaction with driving automation when interacting repeatedly [14,21], NDRT-related behavior might also change. Especially findings of more accurate mental models over time [11,12,13] lead to the question whether mode awareness is also dependent on the familiarity with the driving automation.
As indicated above, reliance behavior is suggested to be closely tied to NDRT engagement during automated driving [7]. The difference between L2 and L3 is that the driver is responsible for supervising the automation in L2 whereas he/she has to be readily available to perform driving task fallback in L3. For the HMI design, this indicates that L2 automation systems require a feature ensuring that drivers are attentive to the supervising task either by steering wheel input or gaze tracking to the forward roadway (see e.g., [25]). By issuing a so called “hands-on request” or “attention request”, the system draws the driver’s attention back towards the supervising task. In comparison, such interface features are not part of a L3 system as it allows NDRT engagement. L3 systems only request driver input at operational design domain (ODD) limits or system malfunctions [26]. Thus, NDRT-related behavior should differ depending on the understanding of the current level of automation (i.e., mode awareness) given an interface is designed in accordance with the prior considerations. The design of automated vehicle HMIs is therefore a crucial aspect for the facilitation of visual attention towards relevant events inside or outside the vehicle [27,28]. A study by Llaneras and colleagues [29] found that drivers tend to engage in NDRTs during reliable L2 automation that does not monitor or restrict behavior. This leads to risky driving and diverts attention away from the roadway and supervision of the system. Therefore, investigation and comparison of NDRT engagement during L2 and L3 automation is of high importance. It is expected that HMI features such as hands-on or attention requests during L2 automation should consequently lead to improved mode awareness with better understanding of his/her roles and responsibilities (i.e., supervising during L2). This understanding eventually translates in observable behavior of less NDRT engagement during L2 as compared to L3 automation.
The study outlined above shows that there is a growing body of research on mode awareness in the driving automation domain. Additionally, HMI considerations outlined above suggest that NDRT engagement can serve as an indicator of mode awareness. However, commonly agreed methodological approaches are still missing. In relation to the theoretical and conceptual developments, the present study’s aim was to investigate how mode awareness can be assessed in a non-intrusive way. It seeks to extend the findings on understanding as reported in [13]. Results of this publication showed that the general understanding of roles and responsibilities (i.e., mode awareness) was high for both L2 and L3 automation. However, the question remained whether this understanding also translates in observable behavior. Non-intrusive measurements of mode awareness bear both advantages for researchers and practitioners as well as for the real-world application of driver-monitoring systems. On the one hand, during the development and evaluation of automated vehicle HMIs, mode awareness represents a critical issue that needs to be assessed. With the availability of a non-intrusive measure, research methodology benefits from the present research. On the other hand, real-world application could use driver monitoring technology to detect potential losses of mode awareness based on the driver’s current behavior. Thus, an ADS might undertake necessary precautions such as displaying warning messages which are already in effect today for fatigue detection.
Research Question and Hypotheses

From theoretical considerations outlined above, the following research question is derived: How does NDRT engagement calibrate for different levels of automation (i.e., for different graphical HMI designs) and with rising system experience? The following two hypotheses are formulated for this research question:
Hypothesis 1 (H1).
Drivers change their engagement in NDRTs over time;
Hypothesis 2 (H2).
There is more NDRT engagement during an active L3 ADS compared to an active L2 driving automation.

3. Method

3.1. Sample

A total of N = 59 participants took part in the driving simulation experiment. N = 10 drop-outs occurred because four participants did not complete the experimental procedure and six incomplete datasets were collected. This left N = 49 (13 female, 36 male) participants for data analysis. Mean age of the final sample was 30.96 years (SD = 9.08, MAX = 62, MIN = 21). All participants were BMW Group employees, held a German driver’s license, and had normal or were corrected to normal vision.

3.2. Driving Simulation and Non-Driving Related Task

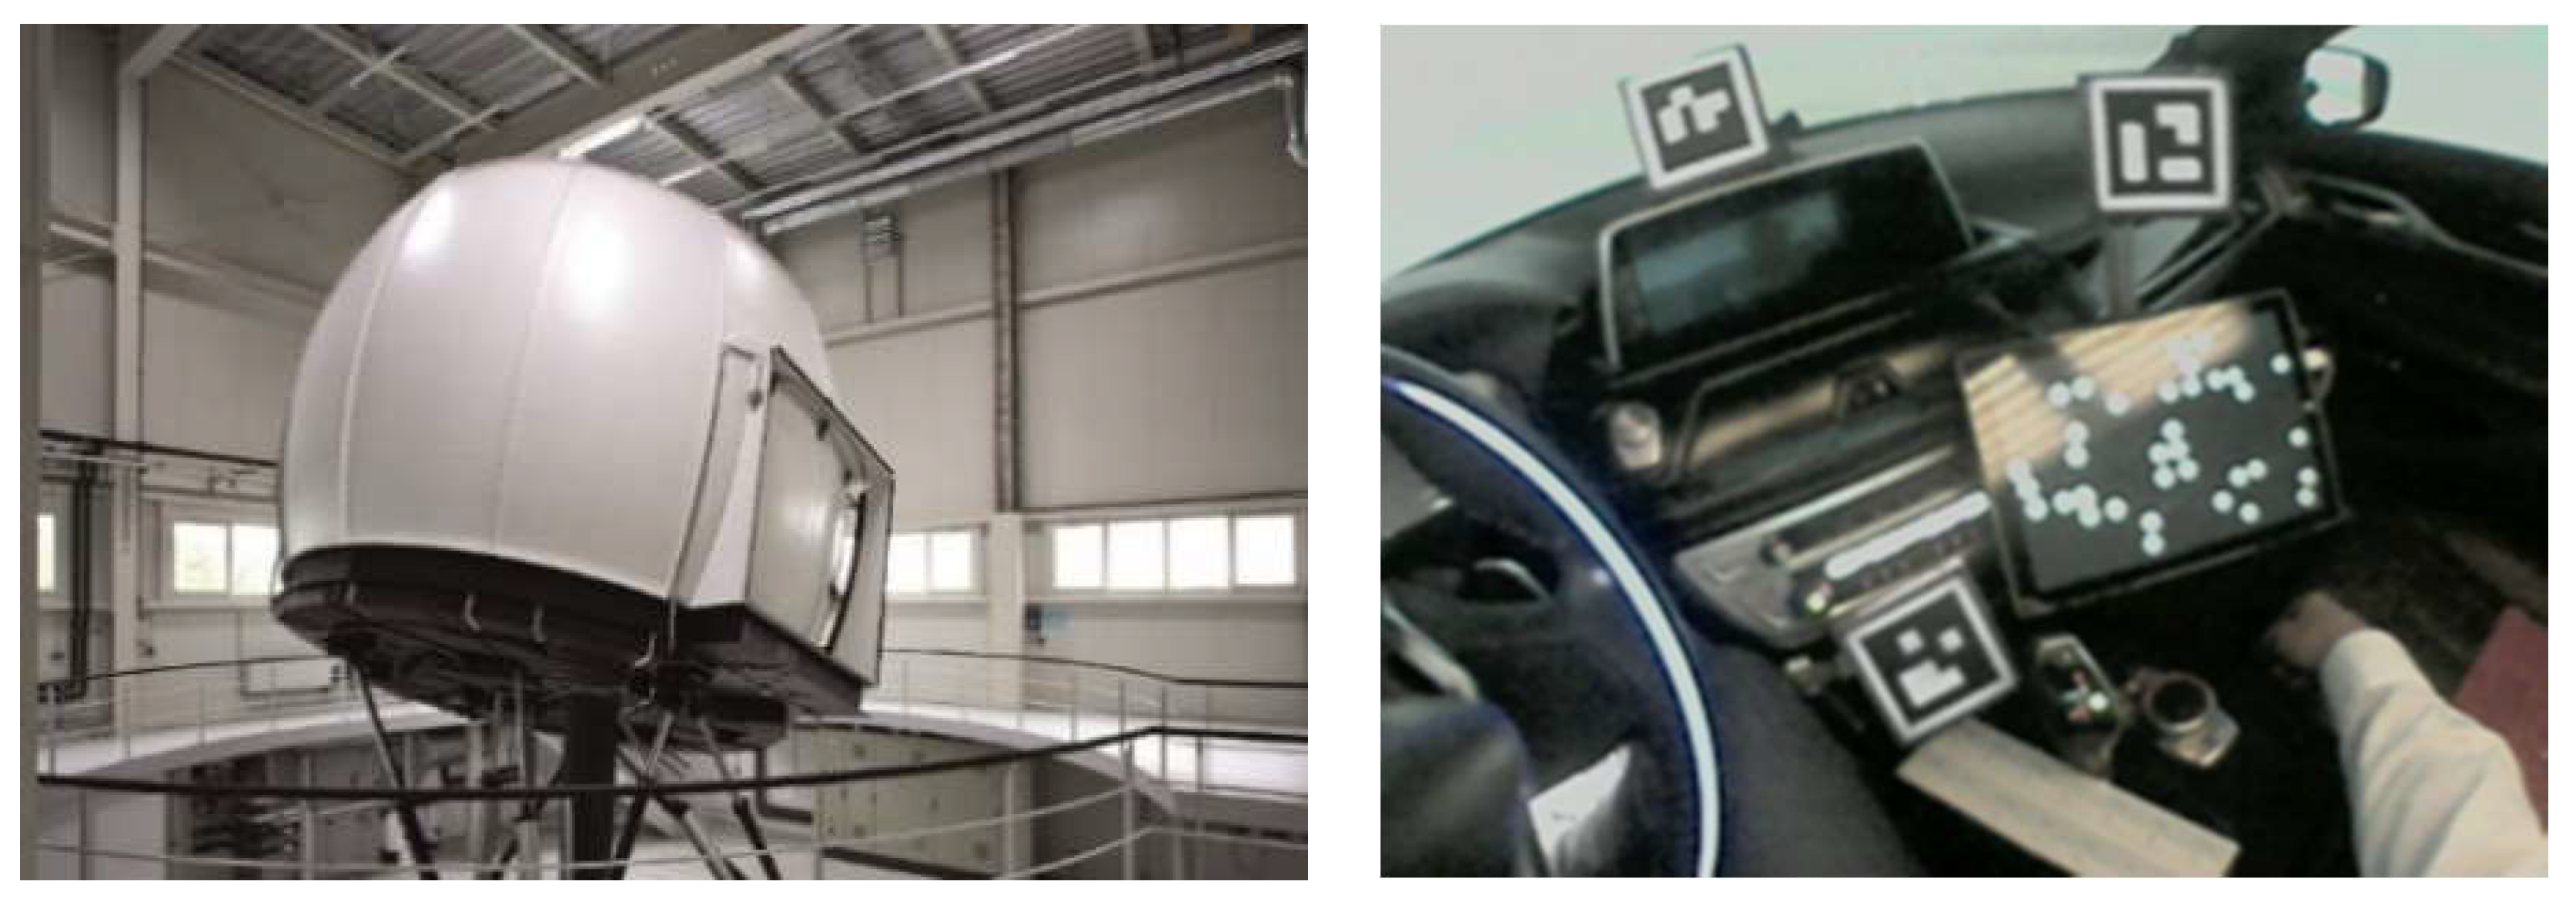
The study was conducted in a moving-base driving simulator (see Figure 1, left). The integrated vehicle’s console contained all necessary instrumentation and was identical to a BMW 5 series with automatic transmission. Seven 1080p projectors provided a 240° horizontal × 45° vertical frontal field of view. One LCD screen positioned behind the back inside the vehicle mockup seats and two outside projections with the same specifications served as rear view. The motion system consisted of a hydraulic hexapod with six degrees of freedom, capable of up to 7 m/s2 transitional acceleration and 4.9 m/s2 continuous acceleration. The Surrogate Reference Task [30] was displayed on a 12.3” tablet mounted on the center stack console and was active during the entire experimental drive (see Figure 1, right). NDRT engagement is measured using a task that is representative for many NDRTs in terms of demands and distraction potential to obtain high external validity. The Surrogate Reference Task (SuRT, [31]) is such a representative task since it is used as a generic visual–manual secondary task in distraction studies. In addition to these, it has also been used for an NDRT in automated driving studies [7,9,32]. The SuRT requires participants to identify a target stimulus (i.e., large circle) within an array of distractors (i.e., small circles). By varying the amount of distractors and size difference between target and distractors, the NDRT demand and resulting workload can be adjusted specifically. An advantage of the SuRT is its potential to support high experimental control while on the downside, it is not a naturalistic NDRT and thus motivation to extensively engage in the SuRT could be limited.
The interface on which the SuRT was presented did not display a score to the drivers to make NDRT engagement completely voluntary and free of a potential competitive character. The circles could be selected by touching the surface with a finger. When the participant selected the correct circle, it turned green before the subsequent pattern emerged. In case the wrong target was selected, it turned red and the pattern stayed until it was solved correctly.

3.3. Study Design and Procedure

The study employed a 2 × 5 mixed within–between subjects design. The within-subject factor “block” had five levels from the first to the fifth block of use cases. The between-subjects factor “feedback” had two levels where participants either received feedback on their interaction success after each use case or not. Because the between-subjects factor was out of scope for the present research question, this research reports results of the within-subject factor “block”.
Upon arrival, participants were welcomed and gave informed consent. After a brief explanation of the study purpose, the experimenter led them to the vehicle mockup. To accustom themselves with the simulator setup, participants had to complete at least two correct trials with the SuRT at standstill. Subsequently, they completed a five-minute manual familiarization drive without NDRT engagement. Prior to the experimental drive, the experimenter outlined the procedure and explained that participants would encounter two automated systems that are a L2 driving automation and a L3 ADS. They also received information stating that they would not have to constantly monitor the correct functioning of the L3 ADS. Concerning NDRT engagement, participants were instructed before each block that they could freely decide whether to engage in the NDRT when the automation was active. In doing so, the experimenter did not specify the level of automation or explicitly named any of the two functions. Furthermore, there was no additional incentive for executing the NDRT. The subsequent experimental drive included five blocks, each consisting of six driver initiated control transitions. After the successful completion of each interaction, there was a 20-s time window where users’ NDRT-related behavior was observed. Table 2 additionally provides an overview of the windows of observation for NDRT-related behavior. Subsequently, there was a brief inquiry during the drive that occurred six times for each block [33]. Having finished use case specific questions, there was another time window of at least 20 s up to one minute where users could freely engage in the NDRT before the upcoming instruction of the next use case. After each block, participants were told to pull over to the right shoulder, stop there, and complete the block inquiry. Participants completed the drive on a three-lane highway with low to medium traffic density. Surrounding vehicles drove with an average of 150 km/h on the center lane and an average of 180 km/h on the left lane. Vehicles on the right lane drove with an average of 130 km/h. The conditions were good with clear visibility at daytime and a dry road. The highway itself was in good condition without potholes or construction areas. The experimental drive lasted approximately 60 min. Figure 2 schematically depicts the procedure.

3.4. Use Cases

The present experiment included driver initiated transitions between manual, L2, and L3 automated driving [34] as use cases (UCs). Considering both upward and downward transitions, one experimental block consisted of six use cases. For the present analysis, only transitions to an automated driving mode are of interest. Consequently, transitions to manual are not considered here. The use cases with transition type, automation level at use case initiation, target automation level, and use case numbering are shown in Table 1. To counteract sequential effects, participants were randomly assigned to one of six possible block sequences that were created using a Latin square. Each block consisted of six trials. In total, each participant completed 30 use cases. To standardize instructions, we recorded samples for each use case that were triggered by the experimenter.

3.5. Automated Driving System

As soon as the driver activated the respective function, it carried out longitudinal and lateral vehicle guidance. The longitudinal and lateral vehicle guidance of the L2 and L3 automation was identical. The L3 ADS was capable of executing independent lane change maneuvers (e.g., overtaking slower vehicles ahead, pulling back to the right lane). The L2 driving automation set speed was the current velocity and could be adjusted without restrictions. The L3 ADS set speed was 130 km/h and could be adjusted to slower speeds. If adjusted to a faster speed than 130 km/h, it deactivated the L3 ADS and activated the L2 driving automation. Vehicle following distance (time headway) to a lead vehicle was 2 s.

3.6. Human–Machine Interface

The visual HMI was shown on the instrument cluster. It showed the vehicle and its surroundings in both L2 and L3 automated driving. The HMI for automated driving resembled a combination of adaptive cruise control and additional steering assistance [35]. The present HMI constitutes a representative solution for an automated system due to the conceptual similarity to solutions in prior research [4,36]. The L2 vehicle surroundings and L3 vehicle surroundings differed in (1) their informational content (i.e., higher level of detail in L3: visibility of adjacent lanes and vehicles) and (2) their perspective (i.e., larger field of view in L3). Thus, specifically the distance between the eye point and the vehicle, the angle between the direct line of sight and the road, and the opening angle of the field of view were manipulated. Figure 3 schematically depicts the configurations for L2 and L3 automation of the vehicle surround views from a profile perspective. An activated L2 automation was colored in green while an activated L3 ADS was colored in blue. In addition, during activated L3 ADS, the steering wheel was illuminated in blue color. The L2 driving automation displayed a hands-on request (HOR) after 15 s of hands-free driving. The HOR was displayed as hands grabbing a steering wheel [37,38] and yellow pulses on the illuminated steering wheel. The system functions could be activated with a button on the left side of the steering wheel for both levels of automation. For a more comprehensive description of the operating elements, see [14].

3.7. Dependent Variables

The present study operationalized NDRT engagement as input with the finger on the NDRT surface. Table 2 visualizes the windows of observation for the dependent variables. To find out about the onset of engagement, we counted the total number of inputs on the surface for a time interval of 20 s after successful completion of each use case (NDRT observation window 1). Since it can be assumed that it takes some time for the NDRT engagement to set in and then to stabilize, we also investigated NDRT-related behavior at the end of an automated driving episode where the onset had most likely occurred and NDRT engagement was on a stable level. For that purpose, there was another window of observation covering the 20 s just before the onset of the subsequent use case (NDRT observation window 2).

3.8. Statistical Procedure and Data Analysis

NDRT data were pre-processed and visualized using Matlab Version 2015 (Mathworks Inc., Natis, MA, USA). Statistical tests were calculated using IBM SPSS Statistics Version 23 (IBM, Armonk, NY, USA). For observation window 1, means and standard deviations (SD) were computed for onset NDRT input frequency by use case and block. In contrast, when observation window 2 started, the transition of control already dated back too far so that a comparison of NDRT-related behavior on use case level (i.e., considering the respective previous level of automation) would not be useful for that period of time. Therefore, we compared NDRT engagement during observation window 2 only in regard to the level of automation that was active at that time. For that purpose, the sum of NDRT inputs during active L2 automation (after UC2 and UC4) and active L3 ADS (after UC1 and UC3), respectively, was calculated for each participant and block. Means and standard deviations (SD) were computed for these ongoing input sums. A significance level of α = 0.05 was applied for inferential testing unless stated otherwise. To control for alpha inflation due to multiple testing, correction after [39] was applied if necessary.

4. Results

4.1. Onset Input Frequency

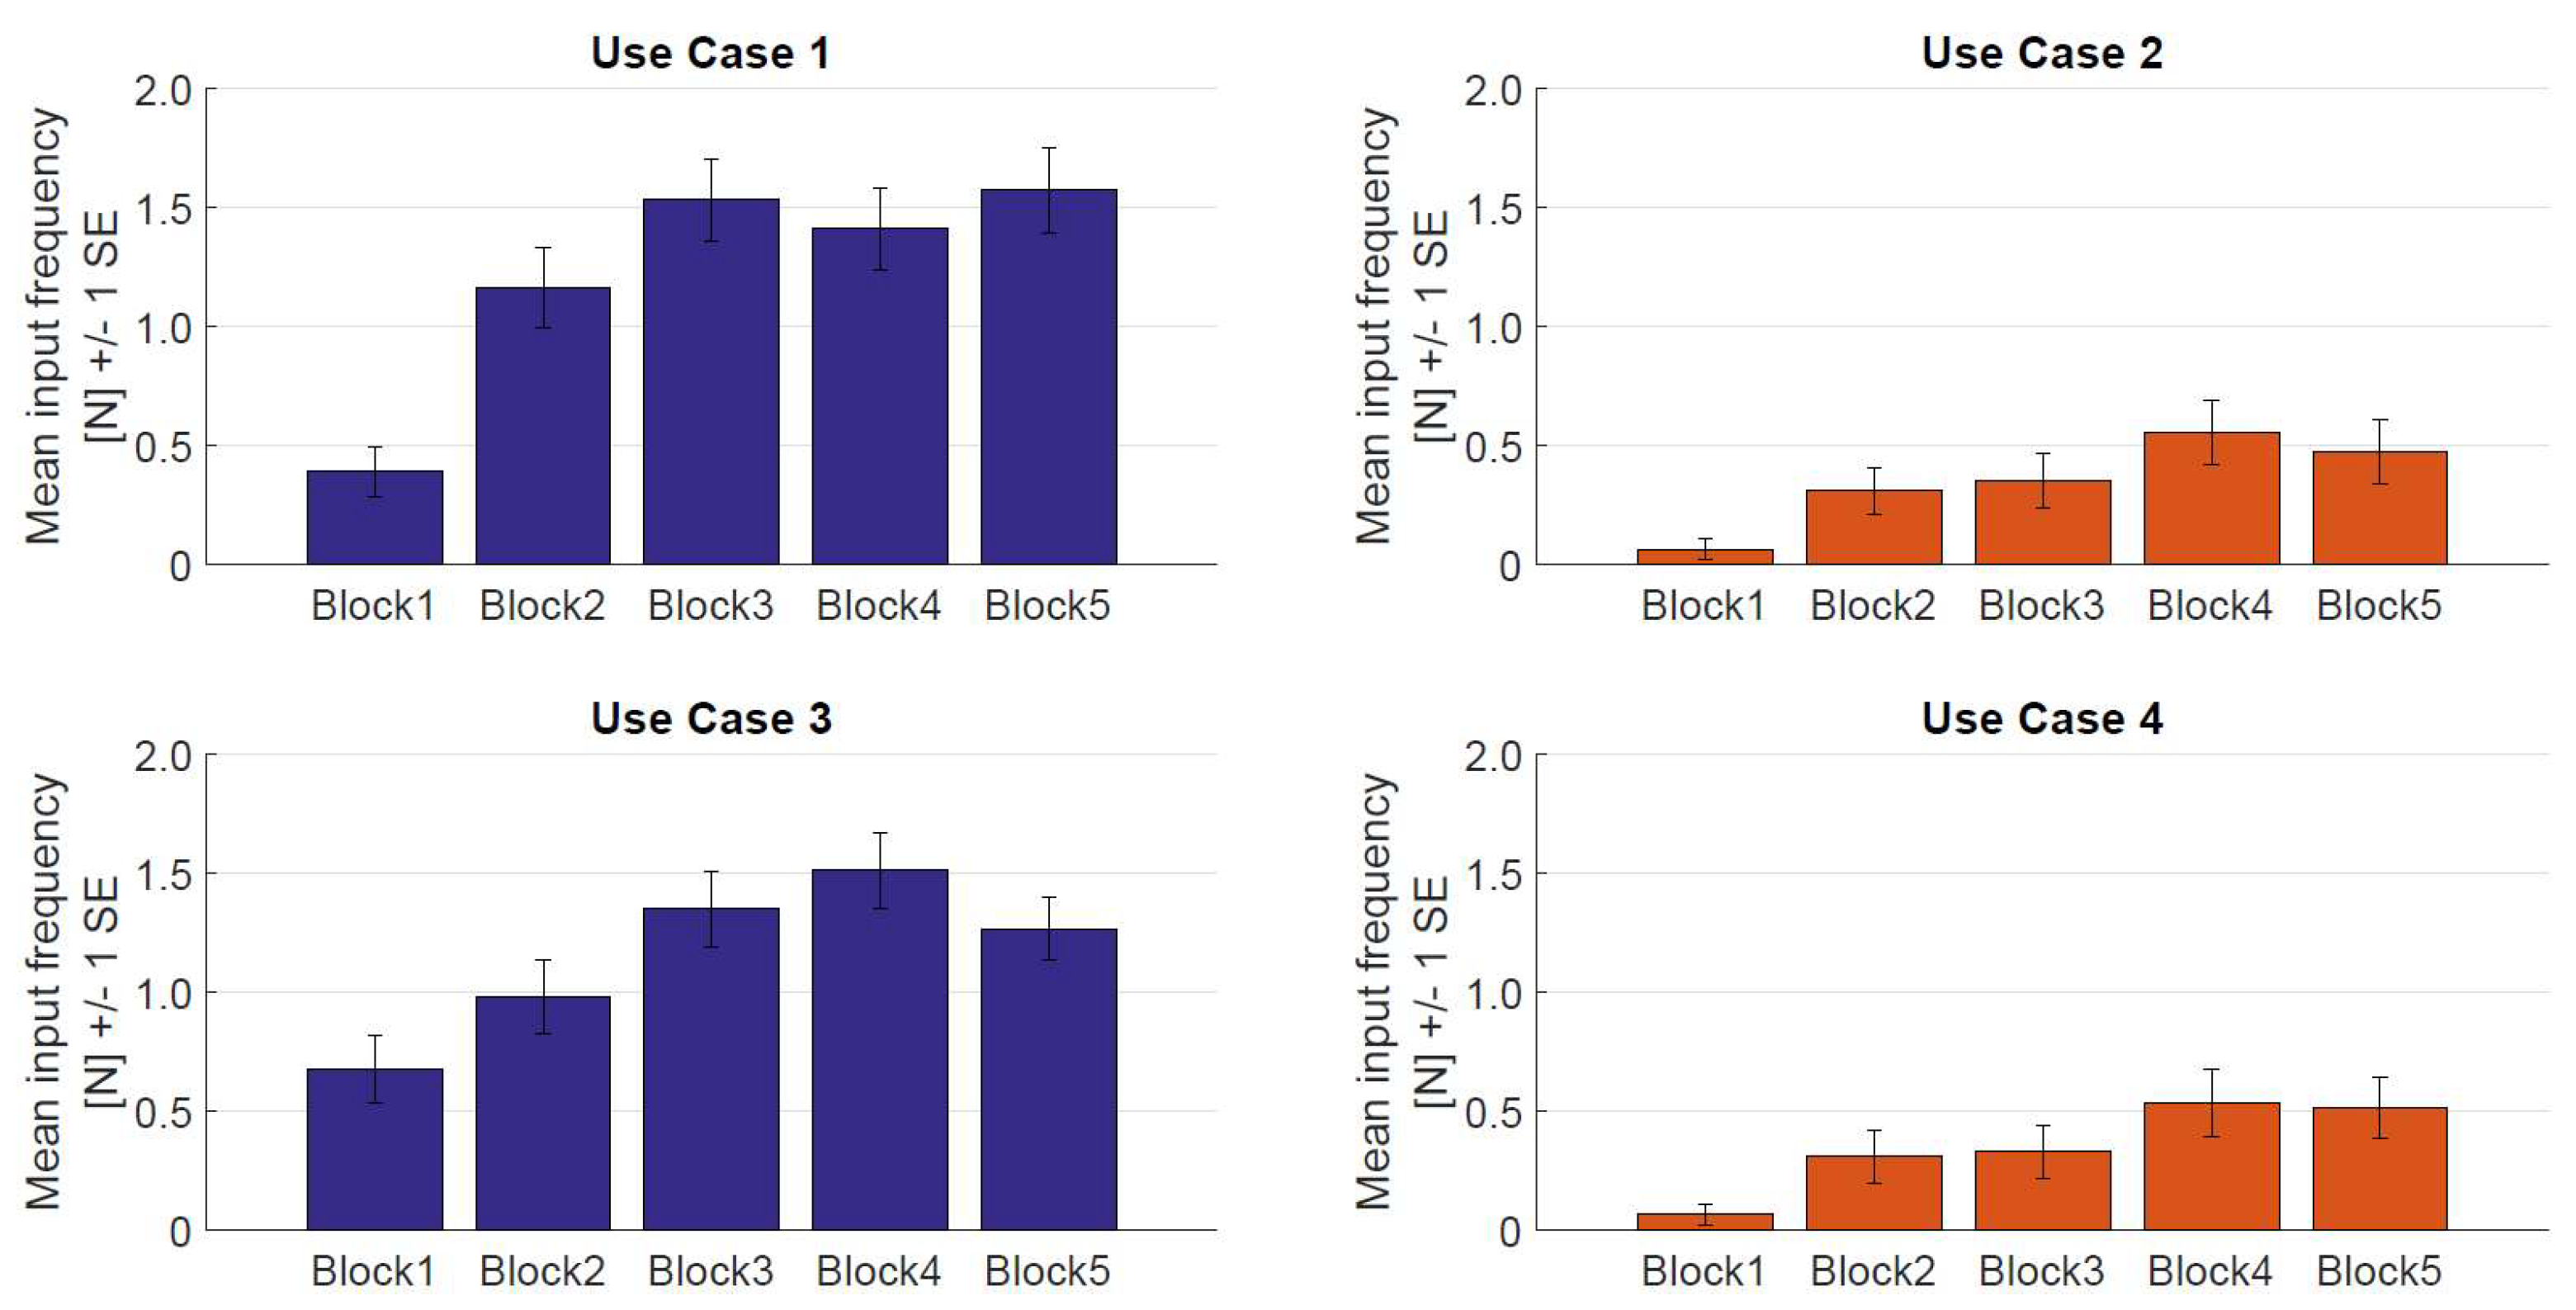
Table 3 shows descriptive statistics (i.e., M, SD) of NDRT input frequency within the 20 s after UC completion by use case and block. Means and standard errors of onset input frequency by use case and block are depicted in Figure 4. Descriptive values revealed that the overall number of NDRT inputs during the 20 s after task completion was on a low level with mean input frequency not exceeding a number of two. Furthermore, there was a tendency towards more NDRT engagement with increasing system experience in all four use cases. However, the observed increase was stronger for transitions to L3 automation (UC1 and UC3) than for transitions to L2 automation (UC2 and UC4). Independent from the block, descriptive data showed considerably more NDRT engagement after transitions to L3 than after transitions to L2.
A 4 × 5 (UC × block) repeated measures analysis of variance (ANOVA) was conducted for onset input frequency. Results revealed significant main effects for both use case and block as well as a significant interaction effect (see Table 4). These inferential results indicate that mean input frequency differed significantly over time and for the different use cases, but the effect of the block depended on the respective use case. The effect sizes showed large effects ([40]; see Table 4). To examine these effects in detail, planned contrast analyses were performed to compare onset input frequency for the two different levels of automation (L2: after UC2 and UC4; L3: after UC1 and UC3) and for consecutive blocks. Results are displayed in Table 5. Regarding the two levels of automation, results revealed that there was significantly more NDRT engagement during active L3 than during active L2 automation; the effect size (see Table 5) indicated a strong effect [40]. Comparisons between consecutive blocks showed a mixed picture: Mean NDRT input frequency was significantly higher in block 2 than in block 1. There were also significantly more NDRT inputs in block 3 as compared to block 2; medium to large effect sizes were obtained [40] (Cohen, 1988). The remaining contrasts between successive blocks did not reach significance (see Table 5). The results of the planned contrast analyses indicate that NDRT engagement increased within the first three system encounters and stabilized in subsequent system encounters.

4.2. Ongoing Input Frequency

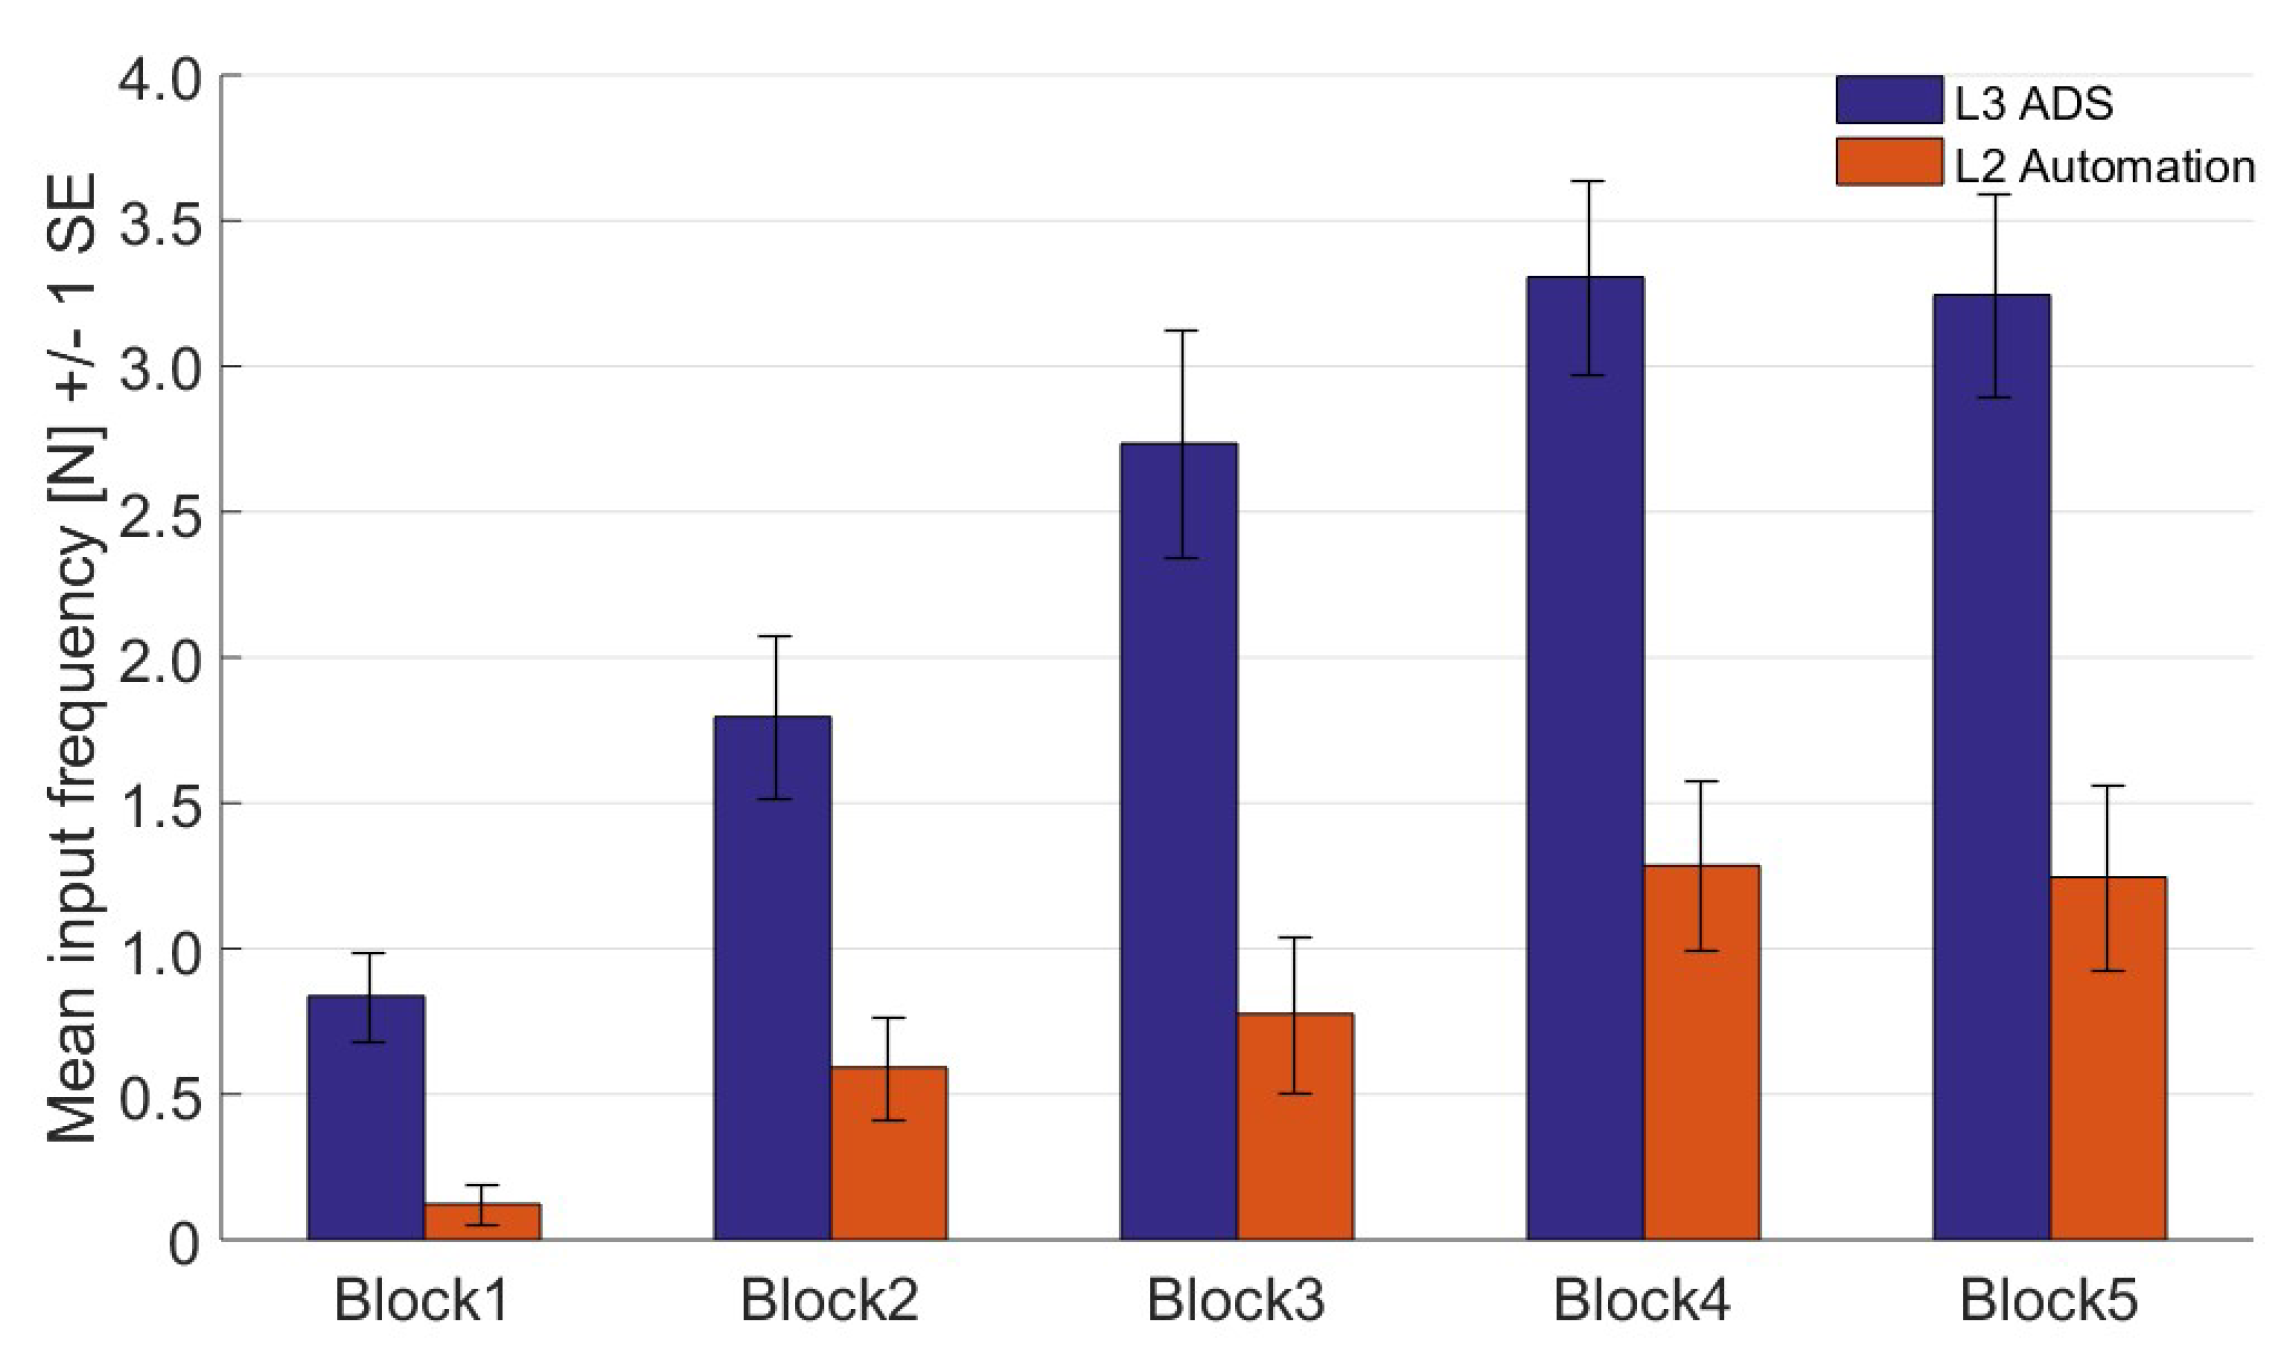
Descriptive statistics (i.e., M, SD) of ongoing NDRT input sums within the 20 s before the onset of the upcoming use case by level of automation (L2: after UC2 and UC4; L3: after UC1 and UC3) and block can be found in Table 6. Figure 5 depicts means and standard errors of ongoing NDRT inputs by level of automation and block. The descriptive values showed similar tendencies as for onset NDRT engagement: The overall number of inputs during the 20 s before onset of the upcoming use case summed for active L2 and L3 automation, respectively, was relatively small with means not exceeding a number of four. Furthermore, a trend towards more NDRT engagement with rising system experience could be observed for both levels of automation with a seemingly weaker upward trend for L2 automation. However, descriptive NDRT engagement tended to stabilize after the first three system encounters. Descriptive data also indicated notably more ongoing NDRT engagement during active L3 automation than during active L2 automation in all five blocks.
A 2 × 5 (level of automation × block) repeated measures ANOVA was performed for ongoing NDRT engagement to examine main and interaction effects of the level of automation. Results are displayed in Table 7. There was a significant main effect of level of automation as well as of block. This means that ongoing NDRT engagement was significantly higher during L3 automation than during L2 automation and differed over time. Furthermore, there was a significant interaction effect indicating that the effect of block on NDRT engagement depended on the level of automation that was active. The effect sizes (see Table 7) showed large effects [40].

5. Discussion and Conclusions

This research investigated the analysis of NDRT engagement at different levels of automated driving. The results of N = 49 participants showed that the levels of driving automation and accordingly designed HMIs lead to differences in NDRT engagement. An increase of NDRT engagement over time was observed for both automation levels whereas this increase was stronger in L3 as compared to L2 automation. These results indicate that users’ behavioral adaptation occurs during initial system encounters. It also shows that the HMI design that follows considerations for L2 and L3 driving automation leads to specific behavioral patterns. The following section discusses the obtained results and relates them to prior considerations about NDRT engagement and mode awareness.
Overall, there were differences in NDRT engagement between the L3 and the L2 automation with significantly more engagement in L3 as compared to L2 automation as indicated by statistically significant main effects in Table 4 and Table 7. Thus, these differences can be traced back to two sources. First, the L3 HMI permitted hands-free driving while the L2 HMI included hands-on requests. Second, the HMI designs differed in adaptations of informational content and perspective. Eventually, there is no final statement possible which HMI variation led to the differences in the observed behavior between the automation levels. Referring back to initial considerations of the HMI design for automated vehicles, it is important to include a form of feedback for L2 automation that prompts the drivers to supervise the driving automation. If these are not present (as in the present L3 case), there is high NDRT engagement. This observation supports the results by Llaneras and colleagues [29] The difference between NDRT engagement during L2 and L3 automation was observed for both the onset (see Figure 4) and ongoing (see Figure 5) NDRT engagement. These observations are in accordance with the findings reported in [19]. The results reported herein extend their findings by repeatedly observing the engagement in an NDRT. Here, similar results were obtained for L2 and L3 automation. Namely, engagement in NDRTs at initial contacts with driving automation—independent of the level of automation—is on a low level. The engagement rises in both instances as indicated by significant main effects for the block factor in both Table 4 and Table 7. However, the rise in NDRT engagement was much stronger for L3 automation as compared to L2 automation as indicated by the significant interaction effects in the same tables. These results show that mode awareness might not only be captured by users’ NDRT engagement in one block but also over the time course (e.g., five repetitions). The behavioral adaptation of NDRT engagement corresponds to related research that investigated human–automation interaction across repeated interactions [13,14,21]. A closer investigation of differences between the blocks by means of planned contrast analysis (see Table 5) showed that a change over time is present from the first up to the third encounter. From then on, stable engagement in NDRTs can be assumed. This has implications for study designs concerning automated driving and engagements in NDRTs. When setting up a study, researchers should be aware that behavioral adaptation requires a certain number of repeated trials until reliable user behavior is present. One example is the study by Hergeth and colleagues [7], where the authors investigated whether NDRT engagement and according glance behavior could be an indicator of reliance behavior and marker for trust in automation. Indeed, they considered familiarization with NDRT and automated driving system including N = 8 repeated NDRT engagements.
NDRT engagement was also present at L2 driving automation. By definition, users of L2 driving automation are responsible for supervising the driving task at all times and may not leave the control loop [1]. Even though NDRT engagement during L2 automation was on a descriptively low level, there were participants that diverted their attention away from supervising the driving automation. This observation has implications for the design of L2 automation. It has to be noted, that secondary task activities occur even in manual driving [41]. Such distraction during manual driving (i.e., engaging in NDRTs) is considered a safety risk and should be minimized [1]. In contrast, there is first evidence that this tendency can be used in a beneficial way during automated driving as it might be turned into controlled engagement. For example, Paetzold and colleagues [42] did not find differences in reaction time to automation errors between participants that were either engaged or not engaged in an NDRT. In the same vein, Hensch and colleagues [43] found effects of display position and secondary task on the driver’s glance behavior in both automated and manual driving. They especially report longer eyes-on display time for NDRTs in head-up display configurations. However, due to its proximity to the driving environment it might enable a faster identification of and reaction to critical situations such as system failures. Thus, there are still challenges for conceptual developments of a HMI design for L2 automated vehicle HMIs.
Eventually, this study supports that NDRT-related behavior can be used to distinguish between levels of automation and their HMI conceptualization. Indeed, drivers’ differences in behavior in NDRTs support the conclusion that mode awareness for the HMIs in L2 and L3 automation was on a high level. This difference is not only apparent overall, but also by differences in changes over time. Moreover, the study showed a methodological aspect on how to evaluate NDRT behavior during an episode (i.e., onset vs. ongoing) which led to similar results. Especially the fact that NDRT engagement changes over time implies that research needs to focus on prolonged periods and that drivers need to adapt to this technology first before it can be used appropriately.

Limitations and Future Research

This study comes with a number of limitations. First, there were no incentives for engaging in the NDRT. In real-road driving, drivers might disengage only if the NDRT has a rewarding character. It remains therefore unknown whether the NDRT engagement in especially L2 automation would remain at such a low level if rewards would have been applied in this study. Second, the NDRT consisted of the SuRT alone, which is a standardized method for visual–manual distraction. This NDRT does, on the one hand, only cover two modalities of distraction (i.e., visual and manual) and, on the other hand, it might not be a very motivating NDRT. For example, Purucker and colleagues [44] have used a more naturalistic set of NDRTs for their study that increases external validity of the findings. Third, the NDRT was mounted in a fixed way in the center console. It might be that engagement is increased if the NDRT is located closer to the line of sight [43]. Thus, future research has to determine how the NDRT-related behavior in a different level of automation evolves for differing activities, modalities, and locations in the vehicle interior. Moreover, the present research only supports insights on the group level that support the predictive character of the SuRT as a measure for mode awareness. However, this does not permit inferences on the individual level. There is still room for future research to determine whether and how predictive the engagement in the SuRT is for mode awareness on an individual level.

Author Contributions

Conceptualization, Y.F., S.H., F.N.; methodology, Y.F., S.H., and F.N.; formal analysis, Y.F., V.G.; data curation, Y.F., V.G.; writing—original draft preparation, Y.F., V.G.; writing—review and editing, Y.F.; visualization, Y.F., V.G.; supervision, S.H., A.K. All authors have read and agreed to the published version of the manuscript.

Funding

This research received no external funding.

Conflicts of Interest

The authors declare no conflict of interests.

References

  1. SAE. Taxonomy and Definitions for Terms Related to On-Road Motor Vehicle Automated Driving Systems (No. J3016R); SAE: Warrendale, PA, USA, 2018. [Google Scholar]
  2. AAM. Statement of Principles, Criteria and Verification Procedures on Driver Interactions with Advanced In-Vehicle Information and Communication Systems; Alliance of Automobile Manufactures: Washington, DC, USA, 2006. [Google Scholar]
  3. NHTSA. Visual-Manual NHTSA Driver Distraction Guidelines for In-Vehicle Electronic Devices; National Highway Traffic Safety Administration (NHTSA), Department of Transportation (DOT): Washington, DC, USA, 2012.
  4. Forster, Y.; Naujoks, F.; Neukum, A. Your Turn or My Turn? Design of a Human-Machine Interface for Conditional Automation. In Proceedings of the 8th International Conference on Automotive User Interfaces and Interactive Vehicular Applications, Ann Arbor, MI, USA, 24–28 October 2016. [Google Scholar]
  5. Forster, Y.; Naujoks, F.; Neukum, A. Increasing anthropomorphism and trust in automated driving functions by adding speech output. In Proceedings of the 2017 IEEE Intelligent Vehicles Symposium (IV), Redondo Beach, CA, USA, 11–14 June 2017. [Google Scholar]
  6. Hergeth, S. Automation Trust in Conditional Automated Driving Systems: Approaches to Operationalization and Design. Ph.D. Thesis, Technische Universität Chemnitz, Chemnitz, Germany, 2016. [Google Scholar]
  7. Hergeth, S.; Lorenz, L.; Vilimek, R.; Krems, J.F. Keep your scanners peeled: Gaze behavior as a measure of automation trust during highly automated driving. Hum. Factors 2016, 58, 509–519. [Google Scholar] [CrossRef] [PubMed]
  8. Gold, C.; Damböck, D.; Lorenz, L.; Bengler, K. “Take over!” How long does it take to get the driver back into the loop? Proc. Hum. Factors Ergon. Soc. Annu. Meet. 2013, 57, 1938–1942. [Google Scholar] [CrossRef] [Green Version]
  9. Happee, R.; Gold, C.; Radlmayr, J.; Hergeth, S.; Bengler, K. Take-over performance in evasive manoeuvres. Accid. Anal. Prev. 2017, 106, 211–222. [Google Scholar] [CrossRef] [PubMed]
  10. Naujoks, F.; Mai, C.; Neukum, A. The effect of urgency take-over requests during highly automated driving under distraction conditions. Adv. Hum. Asp. Trans. 2014, 7 Pt I, 431. [Google Scholar]
  11. Beggiato, M.; Krems, J.F. The evolution of mental model, trust and acceptance of adaptive cruise control in relation to initial information. Trans. Res. Part F Traffic Psychol. Behav. 2013, 18, 47–57. [Google Scholar] [CrossRef]
  12. Beggiato, M.; Pereira, M.; Petzoldt, T.; Krems, J.F. Learning and development of trust, acceptance and the mental model of ACC. A longitudinal on-road study. Trans. Res. Part F Traffic Psychol. Behav. 2015, 35, 75–84. [Google Scholar] [CrossRef]
  13. Forster, Y.; Hergeth, S.; Naujoks, F.; Beggiato, M.; Krems, J.F.; Keinath, A. Learning and Development of Mental Models in Interaction with Driving Automation: A Simulator Study. In Proceedings of the Driving Assessment Conference, Santa Fe, NM, USA, 24–27 June 2019. [Google Scholar]
  14. Forster, Y.; Hergeth, S.; Naujoks, F.; Beggiato, M.; Krems, J.F.; Keinath, A. Learning to Use Automation: Behavioral Changes in Interaction with Automated Driving Systems. Trans. Res. Part F Traffic Psychol. Behav. 2019, 62, 599–614. [Google Scholar] [CrossRef]
  15. Naujoks, F.; Hergeth, S.; Wiedemann, K.; Schömig, N.; Forster, Y.; Keinath, A. Test procedure for evaluating the human–machine interface of vehicles with automated driving systems. Traffic Inj. Prev. 2019, 20 (Suppl. 1), S146–S151. [Google Scholar] [CrossRef] [Green Version]
  16. Sarter, N.B.; Woods, D.D. How in the world did we ever get into that mode? Mode error and awareness in supervisory control. Hum. Factors 1995, 37, 5–19. [Google Scholar] [CrossRef]
  17. Gopinath, V.; Johansen, K. Understanding situational and mode awareness for safe human-robot collaboration: Case studies on assembly applications. Prod. Eng. 2019, 13, 1–9. [Google Scholar] [CrossRef] [Green Version]
  18. Reilhac, P.; Hottelart, K.; Diederichs, F.; Nowakowski, C. User experience with increasing levels of vehicle automation: Overview of the challenges and opportunities as vehicles progress from partial to high automation. In Automotive user interfaces; Springer: Berlin/Heidelberg, Germany, 2017; pp. 457–482. [Google Scholar]
  19. Feldhütter, A.; Segler, C.; Bengler, K. Does Shifting Between Conditionally and Partially Automated Driving Lead to a Loss of Mode Awareness? In Proceedings of the International Conference on Applied Human Factors and Ergonomics, Los Angeles, CA, USA, 17–21 July 2017. [Google Scholar]
  20. Seppelt, B.; Reimer, B.; Russo, L.; Mehler, B.; Fisher, J.; Friedman, D. Consumer confusion with levels of vehicle automation. In Proceedings of the 10th International Driving Symposium on Human Factors in Driver Assessment, Training, and Vehicle Design, Santa Fe, NM, USA, 27 June 2019. [Google Scholar]
  21. Kraft, A.-K.; Naujoks, F.; Wörle, J.; Neukum, A. The impact of an in-vehicle display on glance distribution in partially automated driving in an on-road experiment. Trans. Res. Part F Traffic Psychol. Behav. 2018, 52, 40–50. [Google Scholar] [CrossRef]
  22. Martens, M.H.; Jenssen, G.D. Behavioural adaptation and acceptance. In Handbook Intelligent Vehicles; Springer: London, UK, 2012. [Google Scholar]
  23. Lee, J.D.; See, K.A. Trust in automation: Designing for appropriate reliance. Hum. Factors 2004, 46, 50–80. [Google Scholar] [CrossRef] [PubMed]
  24. Feldhütter, A.; Härtwig, N.; Kurpiers, C.; Hernandez, J.M.; Bengler, K. Effect on Mode Awareness When Changing from Conditionally to Partially Automated Driving. In Advances in Intelligent Systems and Computing: Vol. 823. Proceedings of the 20th Congress of the International Ergonomics Association (IEA 2018); Bagnara, S., Tartaglia, R., Albolino, S., Alexander, T., Fujita, Y., Eds.; Springer: Cham, Switzerland, 2019; Volume 823, pp. 314–324. [Google Scholar] [CrossRef]
  25. Schömig, N.; Wiedemann, K.; Hergeth, S.; Forster, Y.; Muttart, J.; Eriksson, A.; Naujoks, F. Checklist for expert evaluation of automated vehicles HMIs–discussions on its value and adaptions of the method within an expert workshop. Information 2020, 11, 233. [Google Scholar] [CrossRef] [Green Version]
  26. DeGuzman, C.; Hopkins, S.; Donmez, B. Driver Takeover Performance and Monitoring Behaviour with Driving Automation at System-Limit versus System-Malfunction Failures. Trans. Res. Rec. J. Trans. Res. Board 2020. [Google Scholar] [CrossRef]
  27. Louw, T.; Madigan, R.; Carsten, O.; Merat, N. Were they in the loop during automated driving? Links between visual attention and crash potential. Inj. Prev. 2016, 23, 281–286. [Google Scholar] [CrossRef] [Green Version]
  28. Morando, A.; Victor, T.W.; Dozza, M. Reference model for driver attention in automation: Glance behavior changes during lateral and longitudinal assistance. IEEE Trans. Intell. Trans. Syst. 2019, 20, 2999–3009. [Google Scholar] [CrossRef] [Green Version]
  29. Llaneras, R.E.; Salinger, J.; Green, C.A. Human factors issues associated with limited ability autonomous driving systems: Drivers’ allocation of visual attention to the forward roadway. In Proceedings of the 7th International Driving Symposium on Human Factors in Driver Assessment, Training and Vehicle Design, Bolton Landing, New York, NY, USA, 17–20 June 2013. [Google Scholar]
  30. ISO. Road Vehicles—Ergonomic Aspects of Transport Information and Control Systems—Calibration Tasks for Methods which Assess Driver Demand due to the Use of In-Vehicle Systems; (ISO, 14198); ISO: Geneva, Switzerland, 2012. [Google Scholar]
  31. ISO. Road Vehicles—Ergonomic Aspects of Transport Information and Control Systems—Specifications and Test Procedures for In-Vehicle Visual Presentation; (15008); International Organization for Standardization: Geneva, Switzerland, 2017. [Google Scholar]
  32. Radlmayr, J.; Gold, C.; Lorenz, L.; Farid, M.; Bengler, K. How Traffic Situations and Non-Driving Related Tasks Affect the Take-Over Quality in Highly Automated Driving. Proc. Hum. Factors Ergon. Soc. Annu. Meet. 2014, 58, 2063–2067. [Google Scholar] [CrossRef] [Green Version]
  33. Forster, Y.; Hergeth, S.; Naujoks, F.; Krems, J.F.; Keinath, A. Tell them how they did: Feedback on operator performance helps calibrate perceived ease of use in automated driving. Multimodal Technol. Interact. 2019, 3, 29. [Google Scholar] [CrossRef] [Green Version]
  34. Naujoks, F.; Hergeth, S.; Keinath, A.; Wiedemann, K.; Schömig, N. Use Cases for Assessing, Testing, and Validating the Human Machine Interface of Automated Driving Systems. In Proceedings of the Human Factors and Ergonomics Society Annual Meeting, Philadelphia, PA, USA, 1–5 October 2018. [Google Scholar]
  35. Naujoks, F.; Purucker, C.; Neukum, A.; Wolter, S.; Steiger, R. Controllability of Partially Automated Driving functions–Does it matter whether drivers are allowed to take their hands off the steering wheel? Trans. Res. Part F Traffic Psychol. Behav. 2015, 35, 185–198. [Google Scholar] [CrossRef]
  36. Manca, L.; de Winter, J.C.F.; Happee, R. Visual Displays for Automated Driving: A Survey. In Proceedings of the 7th International Conference on Automotive User Interfaces and Interactive Vehicular Applications, Nottingham, UK, 1–3 September 2015. [Google Scholar]
  37. Forster, Y.; Hergeth, S.; Naujoks, F.; Krems, J.F.; Keinath, A. Empirical Validation of a Checklist for Heuristic Evaluation of Automated Vehicle HMIs. In Proceedings of the 10th International Conference on Applied Human Factors and Ergonomics, Washington, DC, USA, 24–28 July 2019. [Google Scholar]
  38. Jarosch, O.; Kuhnt, M.; Paradies, S.; Bengler, K. It’s Out of Our Hands Now! Effects of Non-Driving Related Tasks During Highly Automated Driving on Drivers’ Fatigue. In Proceedings of the Driving Assessment Conference, Manchester Village, VT, USA, 26–29 June 2017. [Google Scholar]
  39. Benjamini, Y.; Hochberg, Y. Controlling the False Discovery Rate: A Practical and Powerful Approach to Multiple Testing. J. R. Stat. Soc. Ser. B (Methodol.) 1995, 57, 189–300. [Google Scholar] [CrossRef]
  40. Cohen, J. Statistical Power Analysis for the Behavioral Sciences, 2nd ed.; Routledge: Hillsdale, NJ, USA, 1988. [Google Scholar]
  41. Dingus, T.A.; Klauer, S.G.; Neale, V.L.; Petersen, A.; Lee, S.E.; Sudweeks, J.D.; Gupta, S. The 100-car Naturalistic Driving Study, Phase II-Results of the 100-Car Field Experiment; U.S. Department of Transportation: Washington, DC, USA, 2006.
  42. Pätzold, A.; Schmidt, C.; Rauh, N.; Cocron, P.; Hergeth, S.; Keinath, A.; Krems, J.F. From distraction to controlled engagement: How secondary tasks affect drivers’ supervisory and fall-back performance of the driving task while using SAE level 2 driving automation. In Proceedings of the Europe Chapter Human Factors and Ergonomics Society Annual Meeting 2017, Rome, Italy, 28–30 September 2017. [Google Scholar]
  43. Hensch, A.-C.; Rauh, N.; Schmidt, C.; Hergeth, S.; Naujoks, F.; Krems, J.F.; Keinath, A. Effects of secondary tasks and display position on glance behavior during partially automated driving. Trans. Res. Part F Traffic Psychol. Behav. 2020, 68, 23–32. [Google Scholar] [CrossRef]
  44. Purucker, C.; Naujoks, F.; Wiedemann, K.; Neukum, A.; Marberger, C. Effects of Secondary Tasks on Conditional Automation State Transitions While Driving on Freeways: Judgements and Observations of Driver Workload. In Proceedings of the 6th International Conference on Driver Distraction and Inattention, Gothenburg, Sweden, 15–17 October 2018. [Google Scholar]
Figure 1. Dynamic driving simulator from the outside (left) and mockup interior with the Surrogate Reference Task (SuRT) tablet used in the current study (right).
Information 11 00239 g001
Figure 2. Schematic outline of experimental procedure.
Information 11 00239 g002
Figure 3. Schematic depiction of vehicle surroundings point of view for L2 (left) and L3 automation (right). The gray dot represents the eye point.
Information 11 00239 g003
Figure 4. Means and SE of onset input frequency by UC and block (blue: transitions to L3 automation, red: transitions to L2 automation).
Information 11 00239 g004
Figure 5. Means and SE of ongoing input frequency summed for L2 and L3 automation by block.
Information 11 00239 g005
Table 1. Overview of use cases for one experimental block.
Transition TypeScenarioAutomation Level at UC InitiationAutomation Target LevelUse Case Number
Upward transitionActivation L3L0L31
Activation L3L2L33
Activation L2L0L22
Downward transitionDeactivation L3L3L24
Table 2. Schematic outline of experimental procedure for each use case. The two observation windows are colored in blue.
StepStandardized Experimenter InstructionTask Completion TimeNDRT Observation Window 1UC Specific InquiryNDRT EngagementNDRT Observation Window 2
Duration5 s0–60 s20 s10–30 s0–20 s20 s
Table 3. Descriptive statistics (i.e., M, SD) of onset input frequency for the four use cases (UCs) by block.
UCBlock 1Block 2Block 3Block 4Block 5
UC10.39 (0.73)1.16 (1.18)1.53 (1.21)1.41 (1.19)1.57 (1.26)
UC20.06 (0.32)0.31 (0.68)0.35 (0.81)0.55 (0.94)0.47 (0.96)
UC30.67 (1.01)0.98 (1.09)1.35 (1.13)1.51 (1.10)1.27 (0.93)
UC40.06 (0.32)0.31 (0.77)0.33 (0.77)0.53 (0.98)0.51 (0.89)
Table 4. Inferential statistics (i.e., F, df1, df2, p, ηp2-value) of main and interaction effects for onset input frequency. Statistically significant effects are colored in gray.
EffectFdf1df2pηp2
Use Case37.378346<0.0010.709
Block12.885445<0.0010.534
Use Case * Block2.6091237<0.050.458
Table 5. Inferential statistics (i.e., F, df1, df2, p, ηp2-value, and 95% CI limits) of planned contrast analyses for L2 (after UC2 and UC4) vs. L3 automation (after UC1 and UC3) and successive blocks for onset input frequency. Statistically significant effects are colored in gray.
ContrastFdf1df2pηp295% CI
L2 vs. L3112.989148<0.0010.702[6.785; 9.950]
Block 1 vs. Block 219.755148<0.0010.292[0.861; 2.282]
Block 2 vs. Block 35.399148<0.050.101[0.107; 1.485]
Block 3 vs. Block 41.0391480.3130.021[−0.436; 1.334]
Block 4 vs. Block 50.2971480.5880.006[−0.862; 0.494]
Table 6. Descriptive statistics (i.e., M, SD) of ongoing input frequency summed for L2 (after UC2 and UC4) and L3 automation (after UC1 and UC3) by block.
Block 1Block 2Block 3Block 4Block 5
L20.12 (0.49)0.59 (1.22)0.78 (1.87)1.29 (2.03)1.25 (2.21)
L30.84 (1.07)1.80 (1.95)2.74 (2.74)3.31 (2.36)3.25 (2.43)
Table 7. Inferential statistics (i.e., F, df1, df2, p, ηp2-value) of main and interaction effects for ongoing input frequency summed for L2 and L3 automation. Statistically significant effects are colored in gray.
EffectFdf1df2pηp2
Level of Automation54.652148<0.0010.532
Block15.105445<0.0010.573
Level of Automation * Block5.085445<0.050.311