Traffic Accident Prediction Based on Multivariable Grey Model

Abstract
1. Introduction
2. Related Work
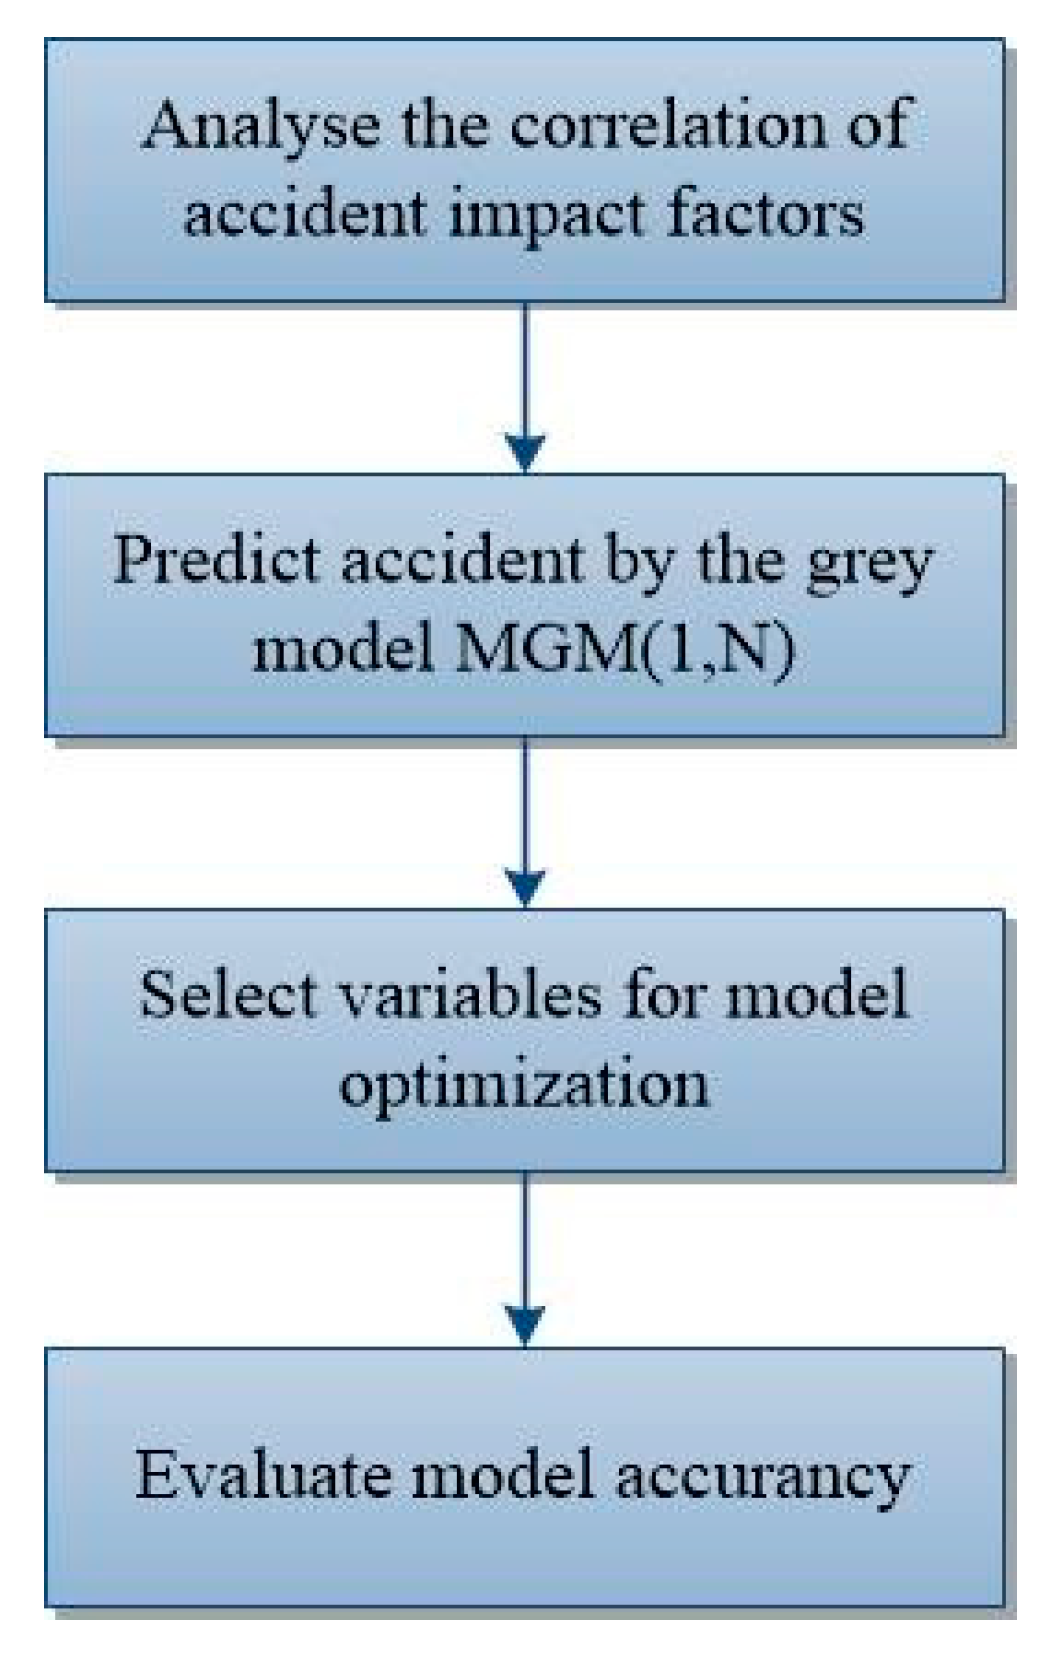
3. Methodology
3.1. Correlation Analysis for Accident Impact Factors
3.2. Multivariable Grey Model MGM(1,N) for Accident Prediction
3.3. Variables Selection for Model Optimization
| Algorithm 1. Variables Selection for Model Optimization. |
| Input: W: The sequence of grey correlation degree of impact factors. Output: S: The set of selected impact factors which optimize the performance of the prediction model. Preliminary: W is represented by , which wi is the grey correlation degree of the ith impact factor. 1. begin 2. Rank the sequence W in descending order; 3. Set a threshold ; 4. for each wi in W do 5. Find the max number k, which meets ; 6. end for 7. Construct the sequence W’ = ; 8. for each wj in W’ do 9. Measure MGM(1, j) model by metric MAPE; 10. Update the MAPE minimum of MGM(1,N) model; 11. end for 12. return s = ; 13. Retrieve the corresponding impact factor from the sequence and return S. 14.end |
3.4. Model Evaluation
4. Experiment
4.1. Dataset
4.2. Results of Grey Correlation Analysis
4.3. Results of Model Selection
4.4. Results of Traffic Accident Prediction
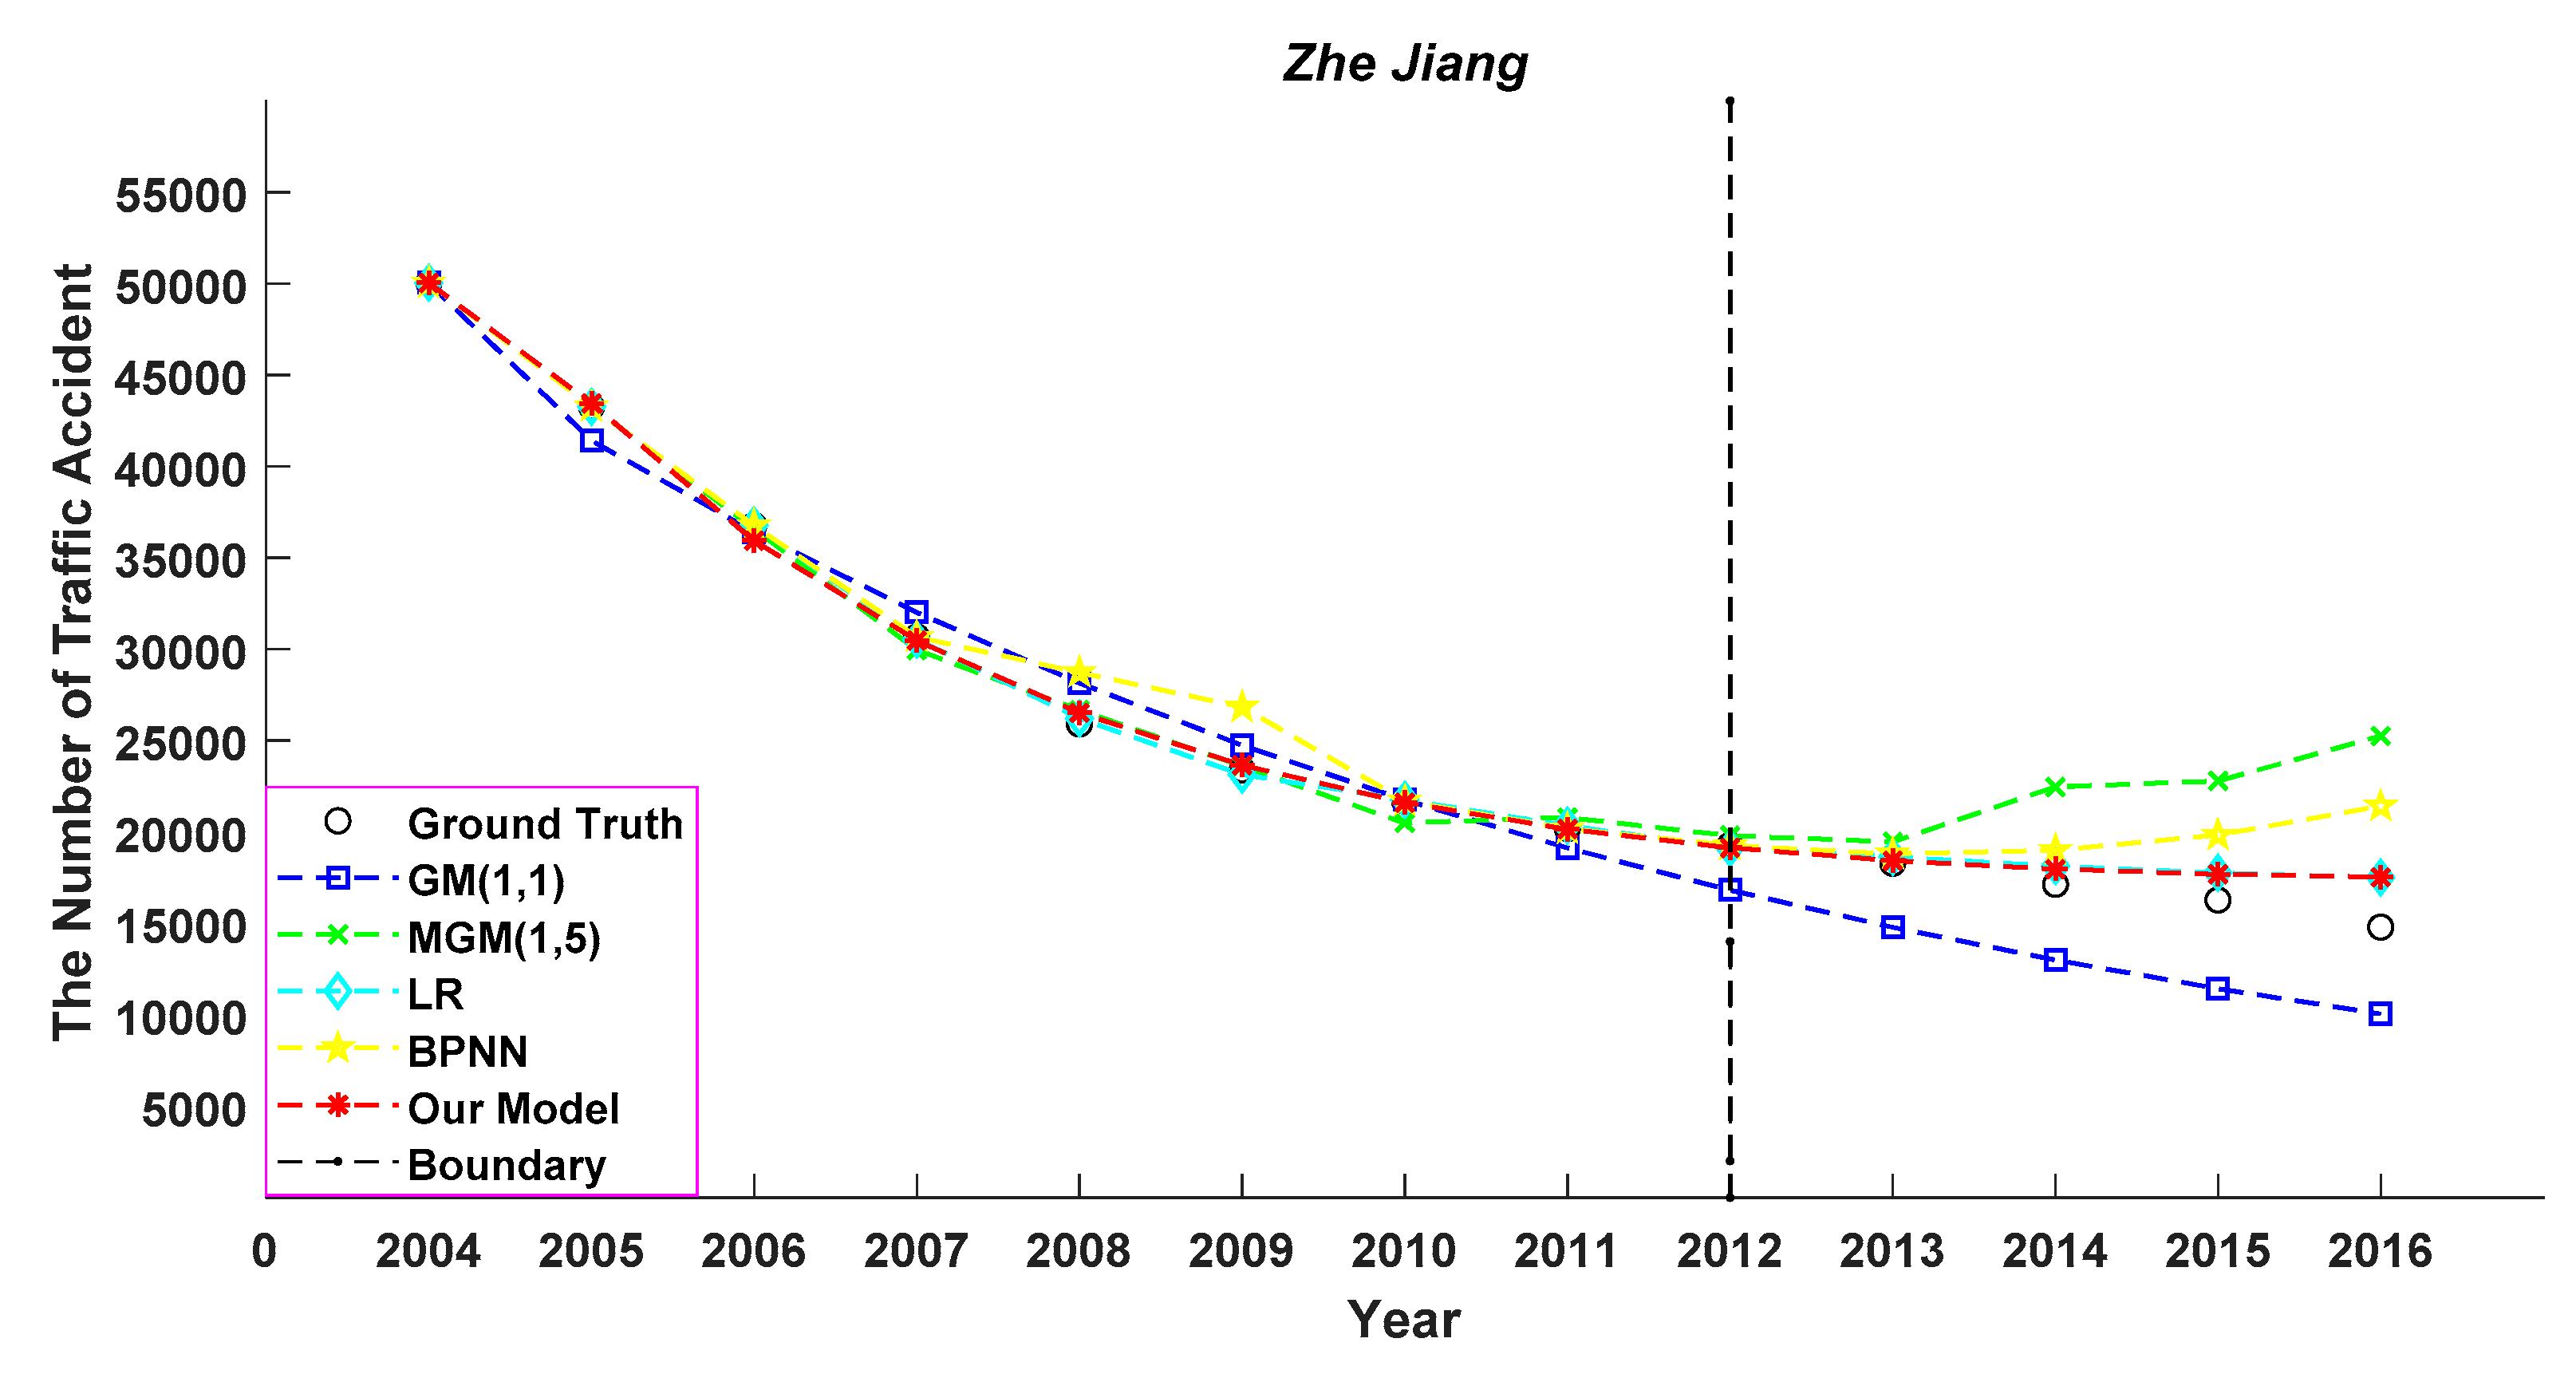
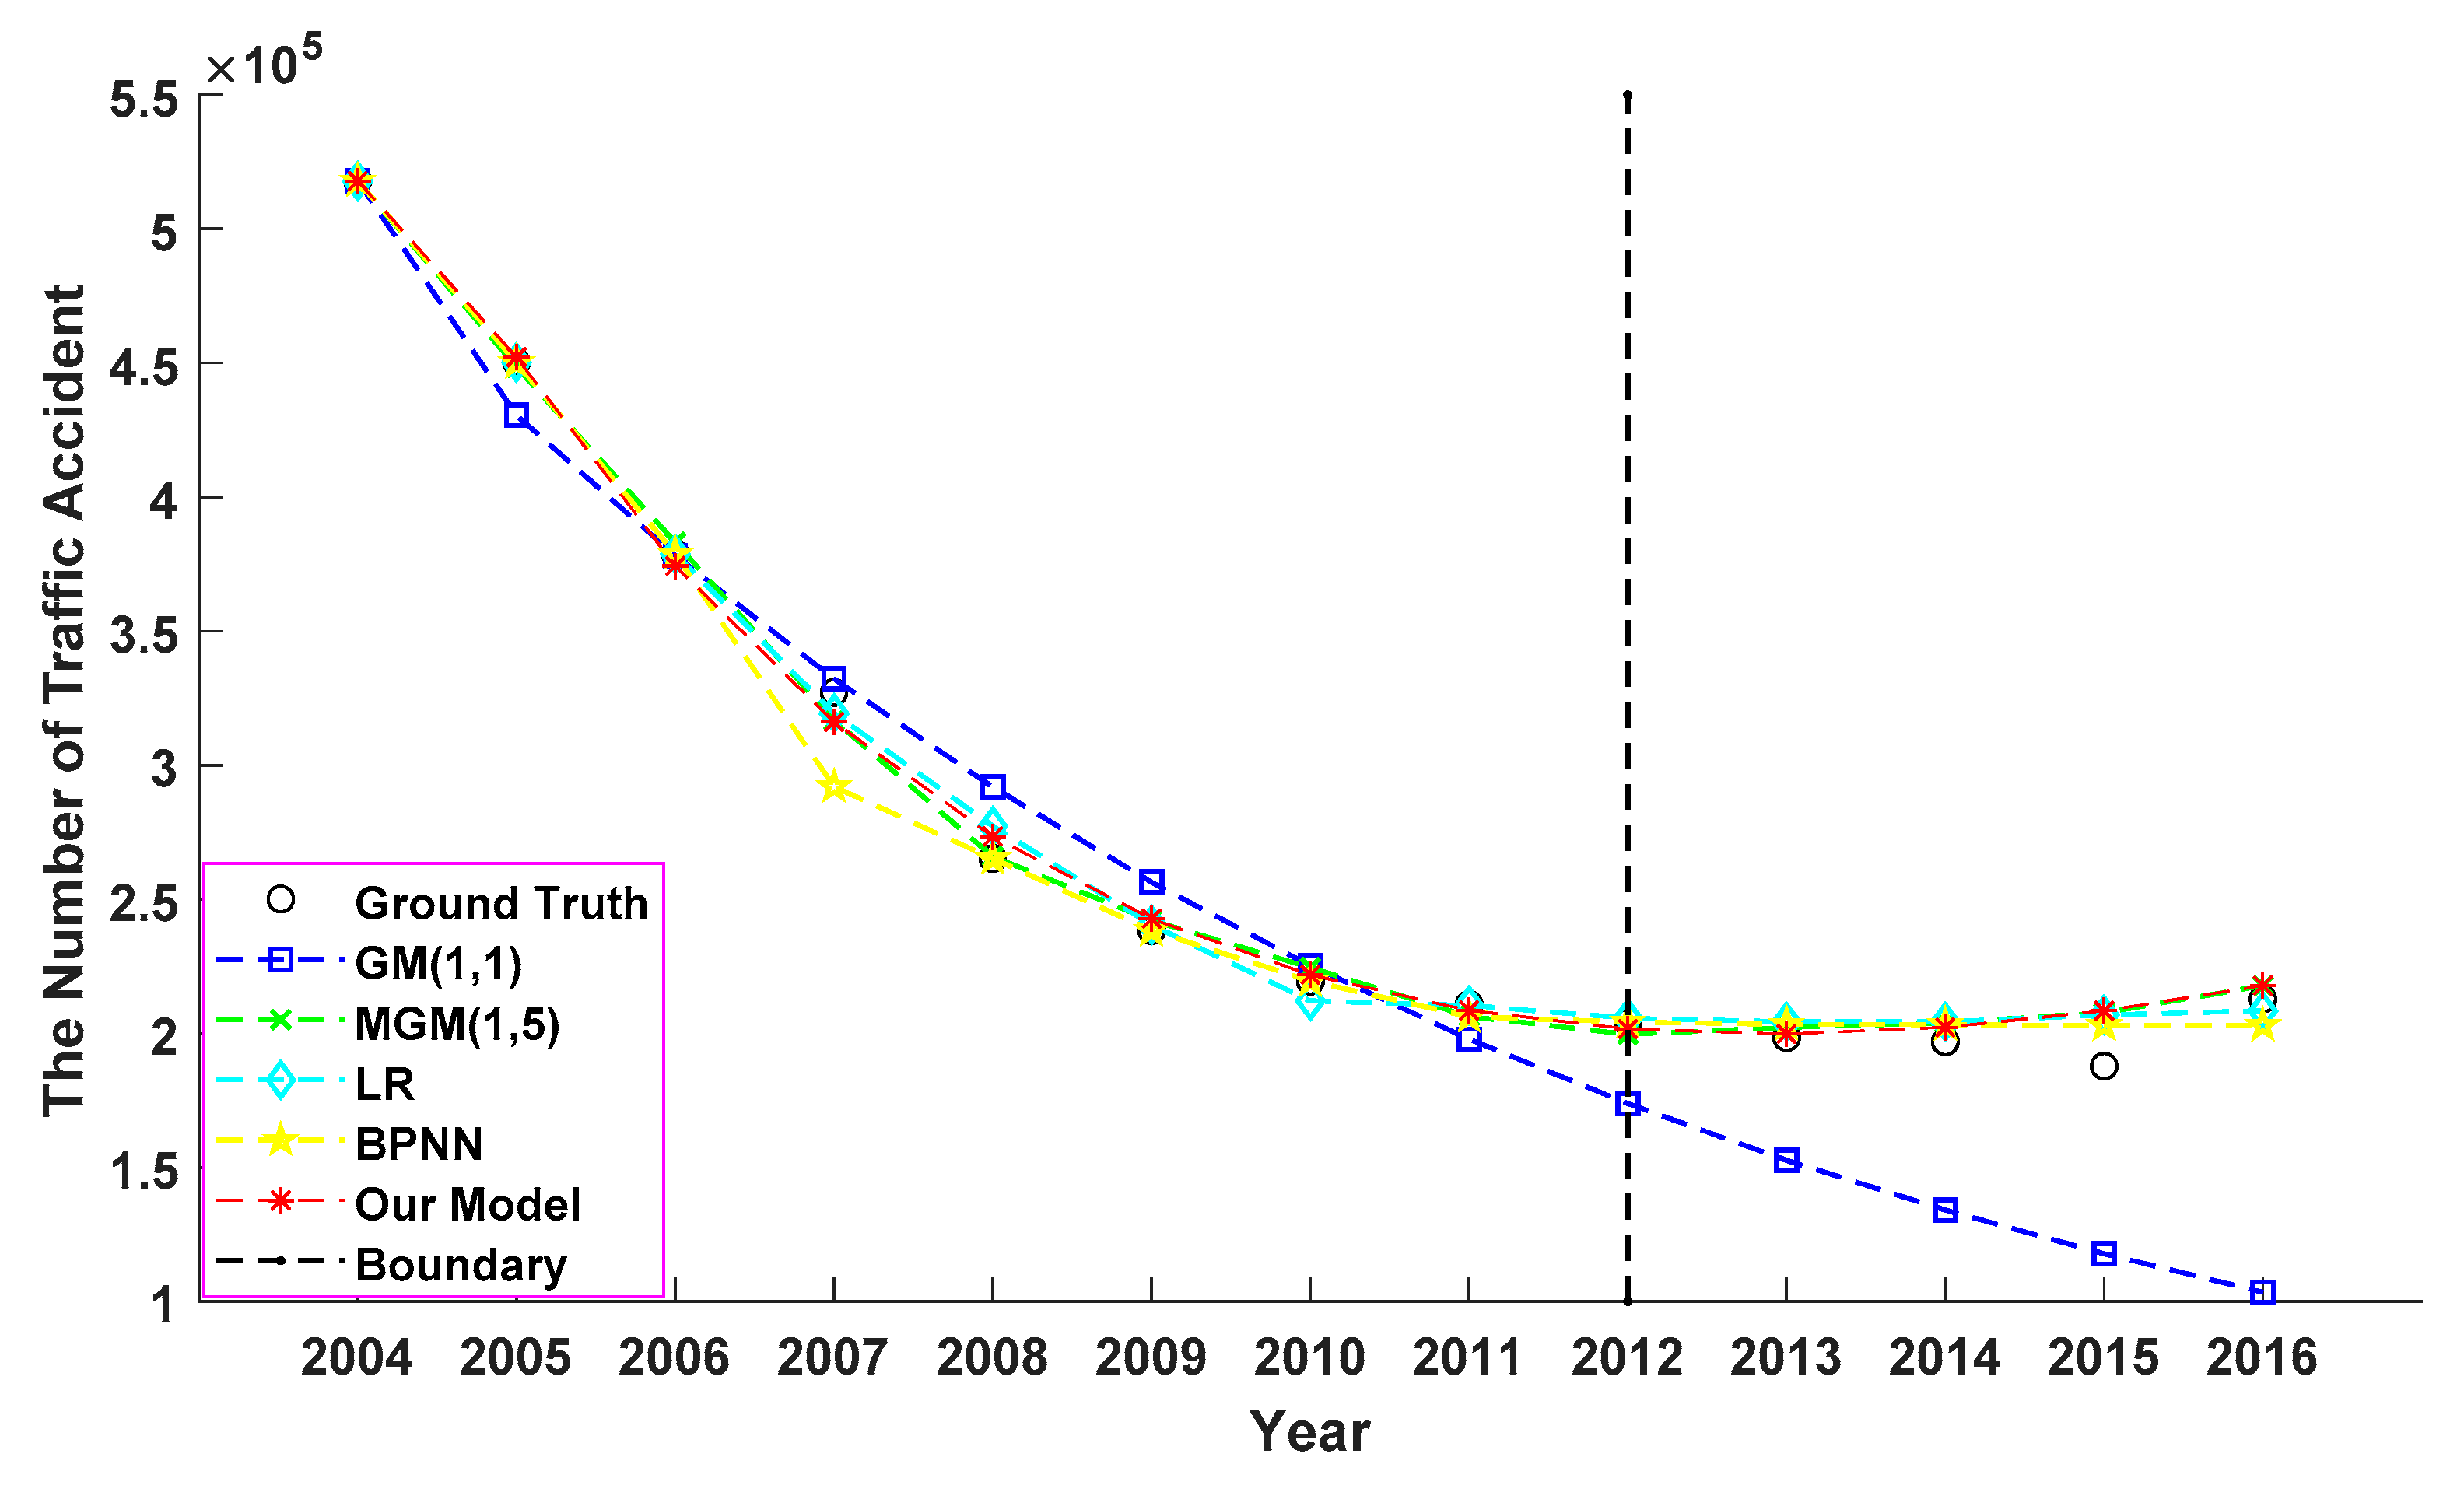
4.5. Results of Trend Prediction
5. Conclusions
Author Contributions
Funding
Conflicts of Interest
References
- Ki, Y.; Lee, D. A traffic accident recording and reporting model at intersections. IEEE Trans. Intell. Transp. Syst. 2007, 8, 188–194. [Google Scholar] [CrossRef]
- Zhidan, L.; Zhenjiang, L.; Kaishun, W.; Mo, L. Urban traffic prediction from mobility data using deep learning. IEEE Netw. 2018, 32, 40–46. [Google Scholar]
- Pecherkova, P.; Nagy, I. Analysis of Discrete Data from Traffic Accidents. In Proceedings of the 2017 IEEE International Conference on Smart City Symposium Prague(SCSP), Prague, Czech Republic, 25–26 May 2017. [Google Scholar]
- Addi, A.M.; Tarik, A.; Fatima, G. An approach Based on Association Rules Mining to Improve Road Safety in Morocco. In Proceedings of the 2016 IEEE International Conference on Information Technology for Organizations Development (IT4OD), Fez, Morocco, 30 March–1 April 2016. [Google Scholar]
- Zou, T.; Li, H.; Li, Y.; Cai, M.; Xiao, J. Methods for calculating intervals of reconstructed results in traffic accidents with different types of interval traces. J. Shanghai Jiaotong Univ. 2017, 22, 555–561. [Google Scholar] [CrossRef]
- Xu, Q.; Zheng, J.; Sun, C. Digital Modeling Analysis of Urban Road Traffic Capacity under the Condition of Traffic Accidents. In Proceedings of the 2017 29th Chinese Control and Decision of the Conference (CCDC), Chongqing, China, 28–30 May 2017. [Google Scholar]
- Cheng, R.; Tian, X.; Zhang, M. Prediction Model for Road Traffic Accident Based on Support Vector. In Proceedings of the Education Science and Development of the International Conference (ICITIA), Guangzhou, China, 21–22 December 2018. [Google Scholar]
- Lin, L.; Wang, Q.; Adel, W. A novel variable selection method based on frequent pattern tree for real-time traffic accident risk prediction. Trans. Res. Part C Emerg. Technol. 2015, 55, 444–459. [Google Scholar] [CrossRef]
- Tao, L.; Zhu, D.; Yan, L. The Traffic Accident Hotspot Prediction Based on the Logistic Regression Method. In Proceedings of the 2015 IEEE International Conference on Transportation Information and Safety (ICTIS), Wuhan, China, 25–28 June 2015. [Google Scholar]
- Cheng, R.; Zhang, M.; Yu, X. Prediction Model for Road Traffic Accident Based on Random Forest. In Proceedings of the Education Science and Development of the International Conference (ICESD), Jakarta, Indonesia, 12–13 January 2019. [Google Scholar]
- Jaroszweski, D.; McNamara, T. The influence of rainfall on road accidents in urban areas: A weather radar approach. Travel Behav. Soc. 2014, 1, 15–21. [Google Scholar] [CrossRef]
- Theofilatos, A. Incorporating real-time traffic and weather data to explore road accident likelihood and severity in urban arterials. J. Safety Res. 2017, 61, 9–21. [Google Scholar] [CrossRef] [PubMed]
- Ren, H.; Song, Y.; Wang, J.; Hu, Y.; Lei, J. A deep learning approach to the citywide traffic accident risk prediction. arXiv 2017, arXiv:1710.09543. [Google Scholar]
- Yuan, Z.; Zhou, X.; Yang, T. Hetero-ConvLSTM: A Deep Learning Approach to Traffic Accident Prediction on Heterogeneous Spatio-Temporal Data. In Proceedings of the 24th ACM SIGKDD International Conference on Knowledge Discovery & Data Mining, London, UK, 19–23 August 2018; pp. 984–992. [Google Scholar] [CrossRef]
- Zhai, J.; Sheng, J.M. The grey model MGM(1,n) and its application. Syst. Eng. Theory Pract. 1997, 17, 109–113. [Google Scholar]
- Guo, X.J.; Liu, S.F. A multi-variable grey model with a self-memory component and its application on engineering prediction. Eng. Appl. Artif. Intell. 2015, 42, 82–93. [Google Scholar] [CrossRef]
- Shen, J.H.; Wang, S.J.; Hu, M.M. The Prediction of Nonlinear Ship Motion Based on Multi-Varible Grey Model MGM(1,n). In Proceedings of the 2007 IEEE International Conference on Mechatronics and Automation, Harbin, China, 5–8 August 2007. [Google Scholar]
- Xiong, P.P.; Dang, Y.G.; Wu, X.H.; Li, X.M. Combined model based on optimized multi-variable grey model and multiple linear regression. Syst. Eng. Electron. 2011, 22, 615–620. [Google Scholar] [CrossRef]
- Truong, D.Q.; Ahn, K.K. Wave prediction based on a modified grey model MGM(1,1) for real-time control of wave energy converters in irregular waves. Renew. Energy 2012, 43, 242–255. [Google Scholar] [CrossRef]
- Wang, L.; Zhu, J.; Lu, H.; Zheng, Y. Forecasting of Traffic Accident in Shanxi Province Based on Grey System Theory. In Proceedings of the 2012 IEEE International Conference on Remote Sensing, Nanjing, China, 1–3 June 2012. [Google Scholar]
- Wang, L.; Zheng, Y. Comparison of Macro Prediction for Traffic Accident between Beijing and Tianjin. In Proceedings of the 2012 IEEE International Conference on Computational and Information Sciences, Chongqing, China, 17–19 August 2012. [Google Scholar]
- Zhao, L. Traffic accident prediction based on equal dimension and new information unbiased grey markov model. Computer Eng. Appl. 2013, 49, 35–383. [Google Scholar]
- René S, H.; Becker, U.; Manz, H. Grey Systems Theory Time Series Prediction applied to Road Traffic Safety in Germany. IFAC-Papers OnLine 2016, 49, 231–236. [Google Scholar] [CrossRef]


| Year | Private Car (Million) | Taxi | Road Operating Car (Million) | Population (Million) | Traffic Accidents |
|---|---|---|---|---|---|
| 2004 | 14.8166 | 903,734 | 10.6718 | 1299.88 | 517,889 |
| 2005 | 18.4807 | 936,973 | 7.3322 | 1307.56 | 450,254 |
| 2006 | 23.3332 | 928,647 | 8.0258 | 1314.48 | 378,781 |
| 2007 | 28.7622 | 959,668 | 8.4922 | 1321.29 | 327,209 |
| 2008 | 35.0139 | 968,811 | 9.3061 | 1328.02 | 265,204 |
| 2009 | 45.7491 | 971,579 | 10.8735 | 1334.50 | 238,351 |
| 2010 | 59.3871 | 986,000 | 11.3332 | 1340.91 | 219,521 |
| 2011 | 73.2679 | 1,002,306 | 12.6375 | 1347.35 | 210,812 |
| 2012 | 88.3860 | 1,026,678 | 13.3989 | 1354.04 | 204,196 |
| 2013 | 105.0168 | 1,053,580 | 15.0473 | 1360.72 | 198,394 |
| 2014 | 123.3936 | 1,074,386 | 15.3793 | 1367.82 | 196,812 |
| 2015 | 140.9910 | 1,092,083 | 14.7312 | 1374.62 | 187,781 |
| 2016 | 163.3020 | 1,102,563 | 14.3577 | 1382.71 | 212,846 |
| Impact Factor | Degree of Correlation |
|---|---|
| Private car | 0.6216 |
| Taxi | 0.8623 |
| Road operating car Population | 0.8837 0.8739 |
| Model Independent Variables | MGM(1,2) Road Operating Car | MGM(1,3) Road Operating Car and Population | MGM(1,4) Road Operating Car, Population and Taxi |
|---|---|---|---|
| MAPE | 1.48% | 1.52% | 3.79% |
| Year | Ground Truth | GM(1,1) Model | MGM(1,5) Model | Linear Regression | BP Neural Network | Our Model |
|---|---|---|---|---|---|---|
| Fitted Value | Fitted Value | Fitted Value | Fitted Value | Fitted Value | ||
| 2013 | 198,394 | 152,680 | 192,351 | 204,321 | 203,372 | 199,773 |
| 2014 | 196,812 | 134,123 | 186,158 | 204,317 | 203,188 | 202,247 |
| 2015 | 187,781 | 117,822 | 180,781 | 206,867 | 202,976 | 208,406 |
| 2016 | 212,846 | 103,502 | 175,094 | 208,365 | 202,952 | 217,798 |
| MAPE | 35.88 | 7.48 | 4.77 | 4.62 | 4.19 | |
| MAE | 71,925.50 | 15,362.25 | 9294.67 | 9110.77 | 8097.75 | |
| RMSE | 75,614.24 | 20,150.92 | 10,906.59 | 9927.52 | 10,969.89 | |
| Region | Chong Qing City | Zhe Jiang Province | ||||
|---|---|---|---|---|---|---|
| MAPE (%) | MAE | RMSE | MAPE (%) | MAE | RMSE | |
| GM (1,1) | 23.55 | 1191.58 | 1196.59 | 26.30 | 4310.30 | 4343.10 |
| MGM (1,5) | 87.00 | 4223.76 | 5166.16 | 37.06 | 5867.46 | 6739.37 |
| LR | 11.62 | 566.93 | 659.01 | 8.79 | 1383.98 | 1634.24 |
| BPNN | 16.26 | 798.28 | 894.36 | 20.08 | 3139.53 | 3882.37 |
| Our Model | 5.76 | 286.19 | 322.09 | 8.20 | 1279.53 | 1595.61 |
© 2020 by the authors. Licensee MDPI, Basel, Switzerland. This article is an open access article distributed under the terms and conditions of the Creative Commons Attribution (CC BY) license (http://creativecommons.org/licenses/by/4.0/).
Share and Cite
Li, W.; Zhao, X.; Liu, S. Traffic Accident Prediction Based on Multivariable Grey Model. Information 2020, 11, 184. https://doi.org/10.3390/info11040184
Li W, Zhao X, Liu S. Traffic Accident Prediction Based on Multivariable Grey Model. Information. 2020; 11(4):184. https://doi.org/10.3390/info11040184
Chicago/Turabian StyleLi, Wei, Xujian Zhao, and Shiyu Liu. 2020. "Traffic Accident Prediction Based on Multivariable Grey Model" Information 11, no. 4: 184. https://doi.org/10.3390/info11040184
APA StyleLi, W., Zhao, X., & Liu, S. (2020). Traffic Accident Prediction Based on Multivariable Grey Model. Information, 11(4), 184. https://doi.org/10.3390/info11040184