Theme Mapping and Bibliometrics Analysis of One Decade of Big Data Research in the Scopus Database


Abstract
1. Introduction
- We introduce a unique approach to exploring the major themes of text collection;
- We present the key-terms clusters analysis and capture the major themes in big data research;
- We provide a descriptive analysis of the big data research structure based on the growth of the number of publications, the most productive countries, institutions, and authors, and the most cited paper.
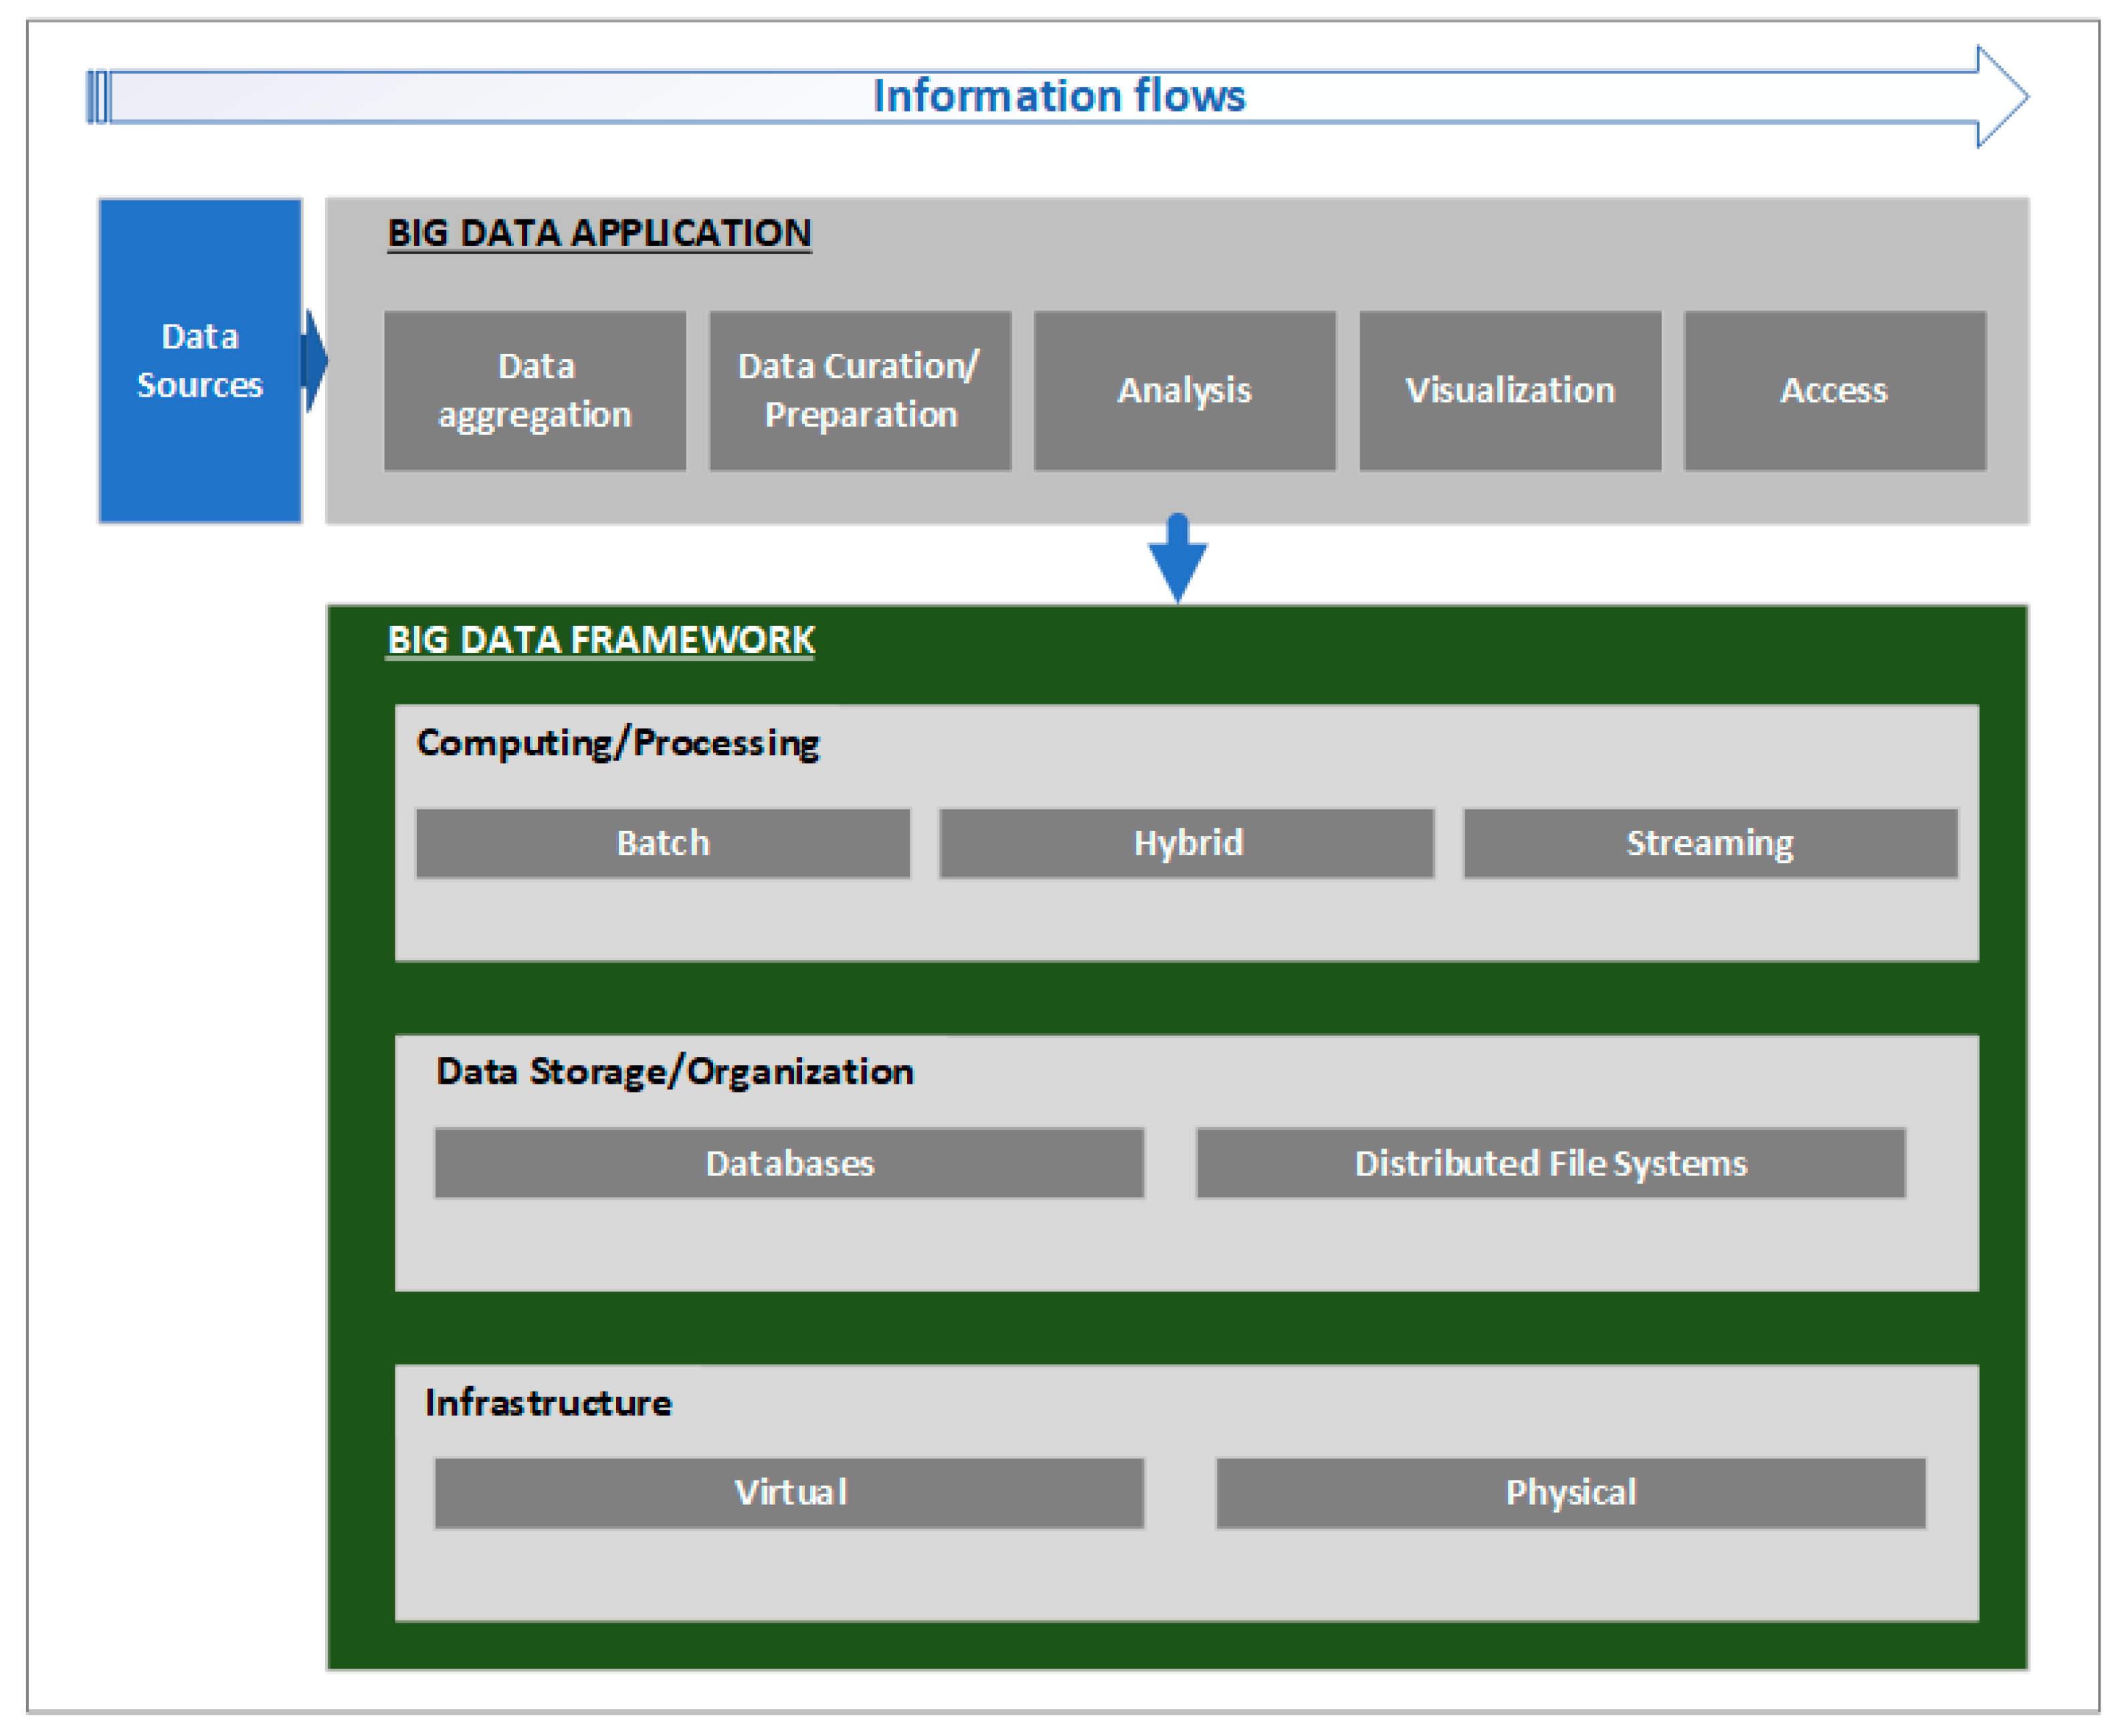
2. An Overview of Big Data Systems
3. Data and Methods
3.1. Data Analysis Framework
3.2. Data Collection
3.3. Data Pre-Processing
3.4. General Analysis and Thematic Mapping
- Construction of data vector (document’s number x the occurrence frequency of keywords/key-phrases);
- Term frequency and inverse document frequency (TF-IDF) weighting [42] and scaling of row vectors to Euclidian norm;
- Bisecting k-means clustering with the cosine similarity measure.
| argmax | the maximum posterior value; |
| j-cluster (vj) of the partion (V); | |
| the prior probability of each j-cluster to their relative frequencies; | |
| the probability product of each (ai) term within each (vj) cluster, where each | |
| is an element of a normalized vector of relative frequencies and each (ai) term is present in the i-context unit to be reclassified. |
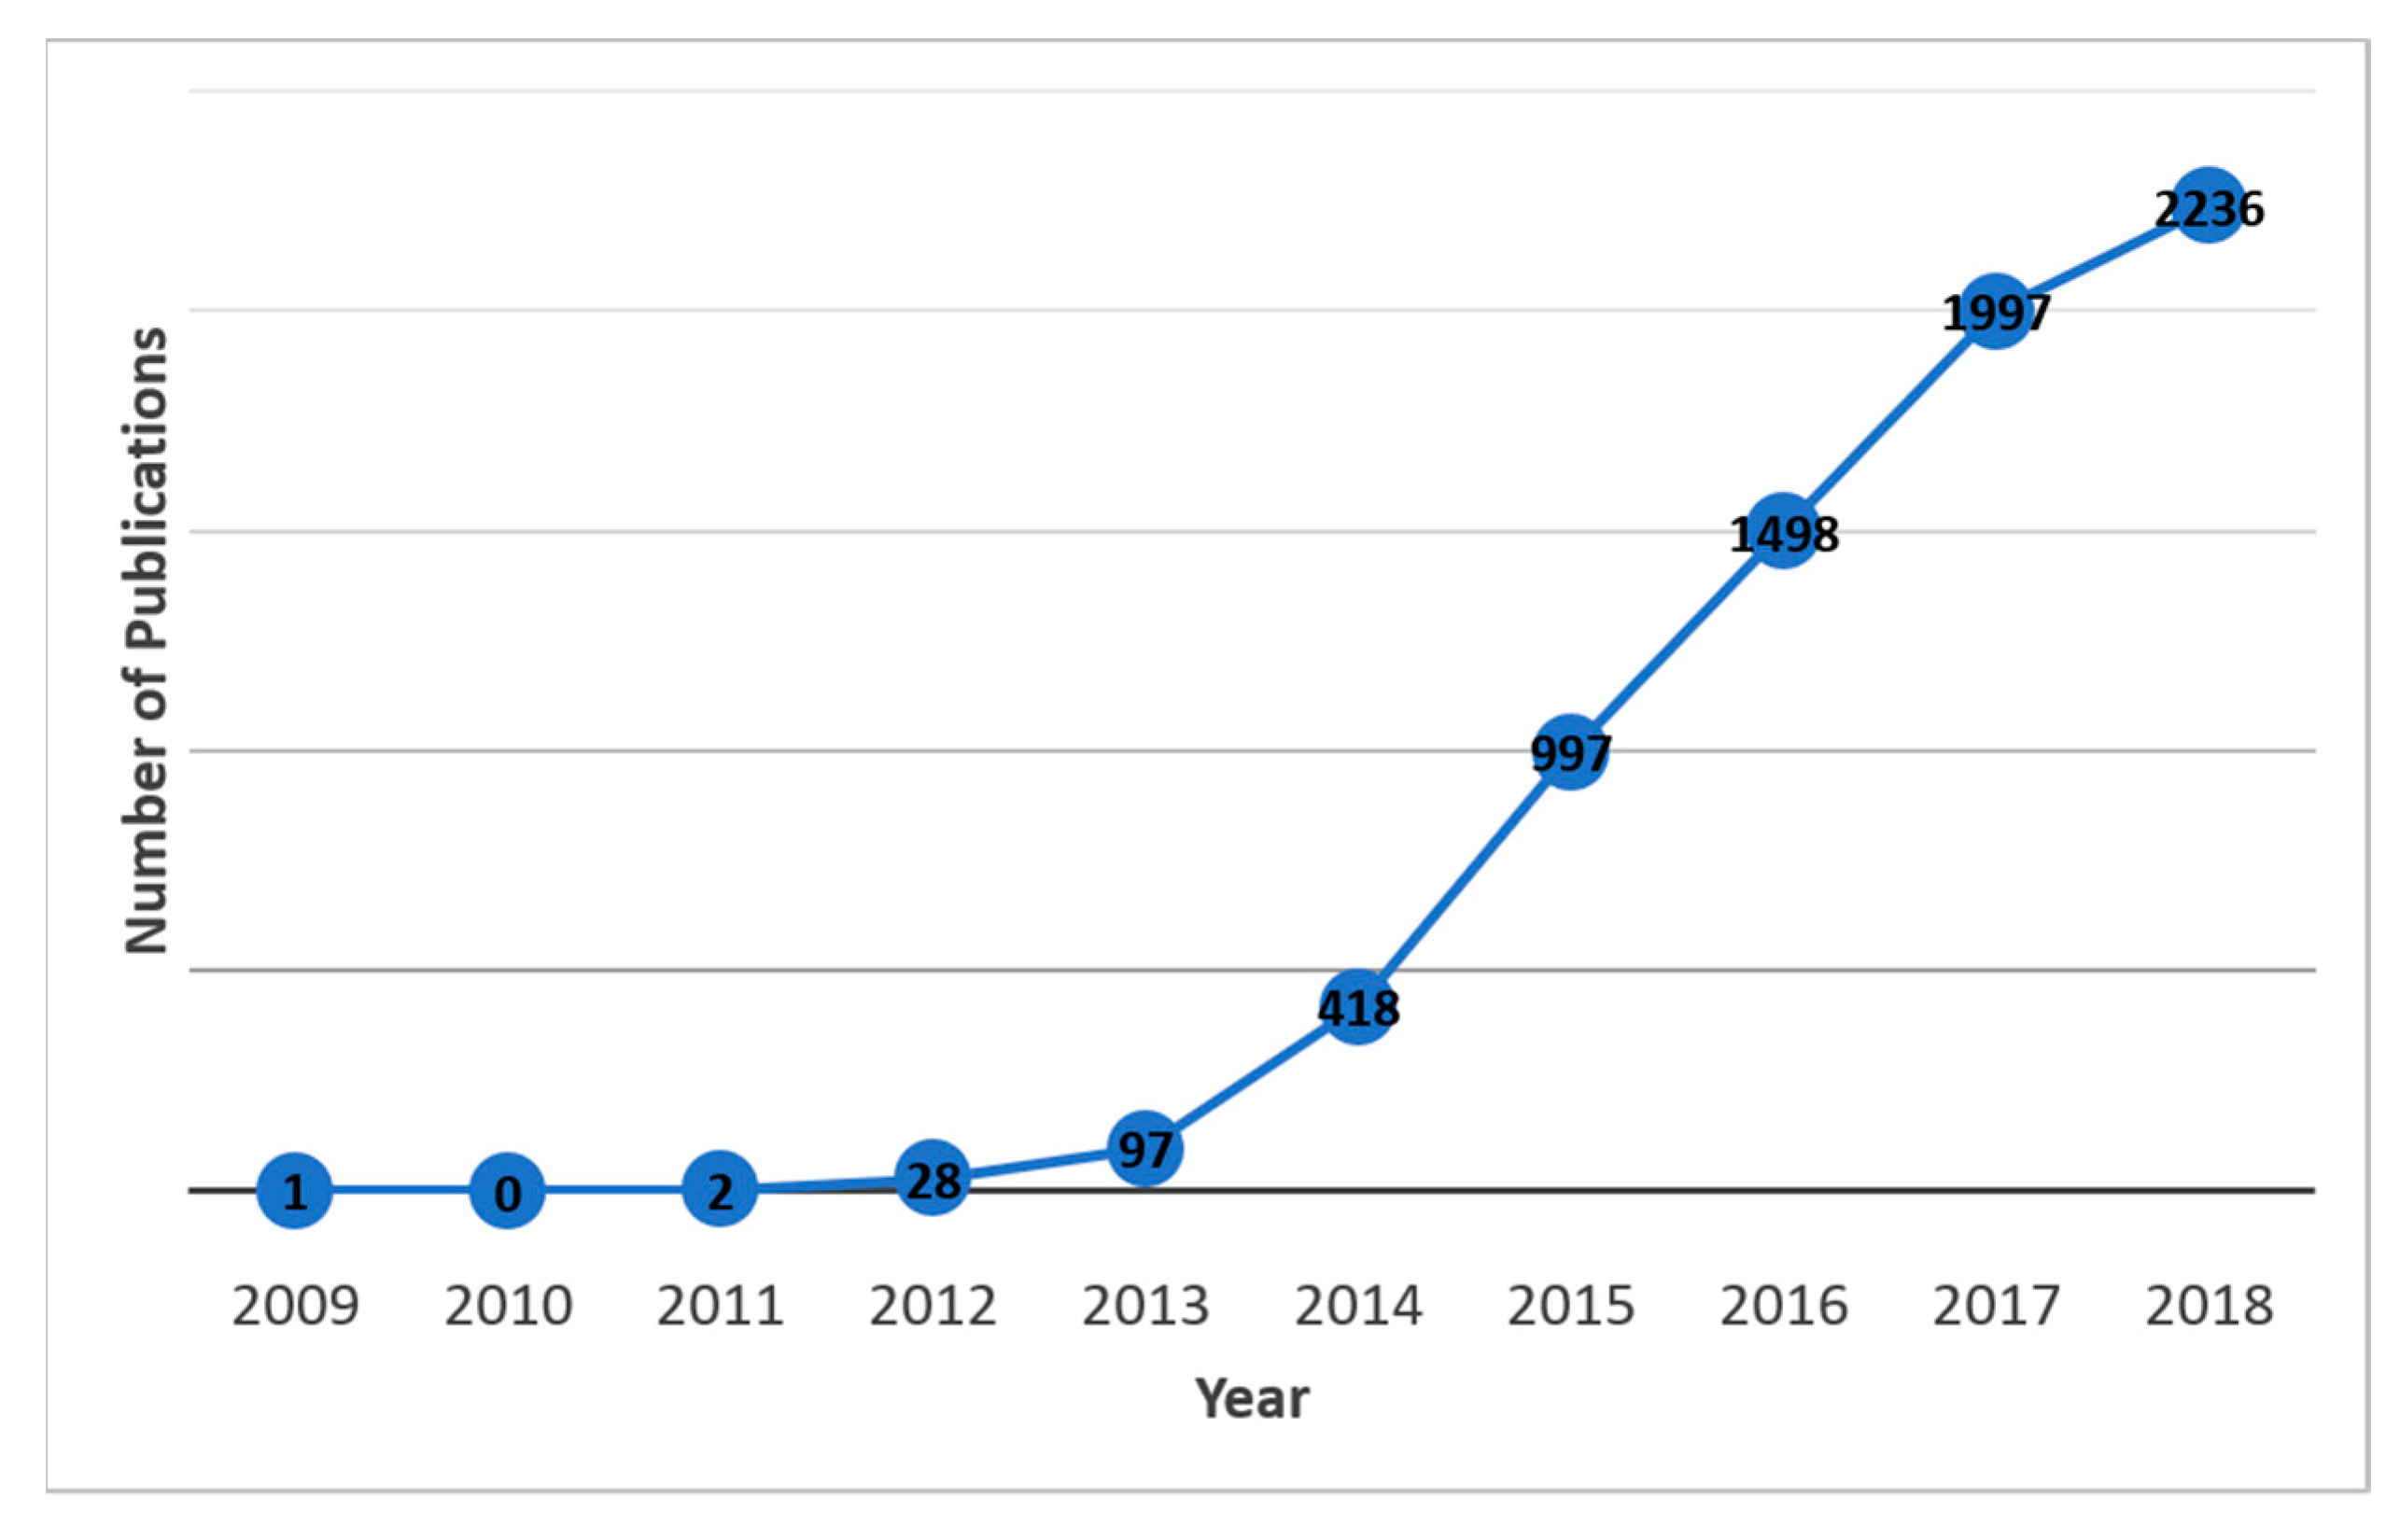
4. Bibliometrics Analysis of Publication Trends
5. Thematic Analysis of the Author and Index Keywords
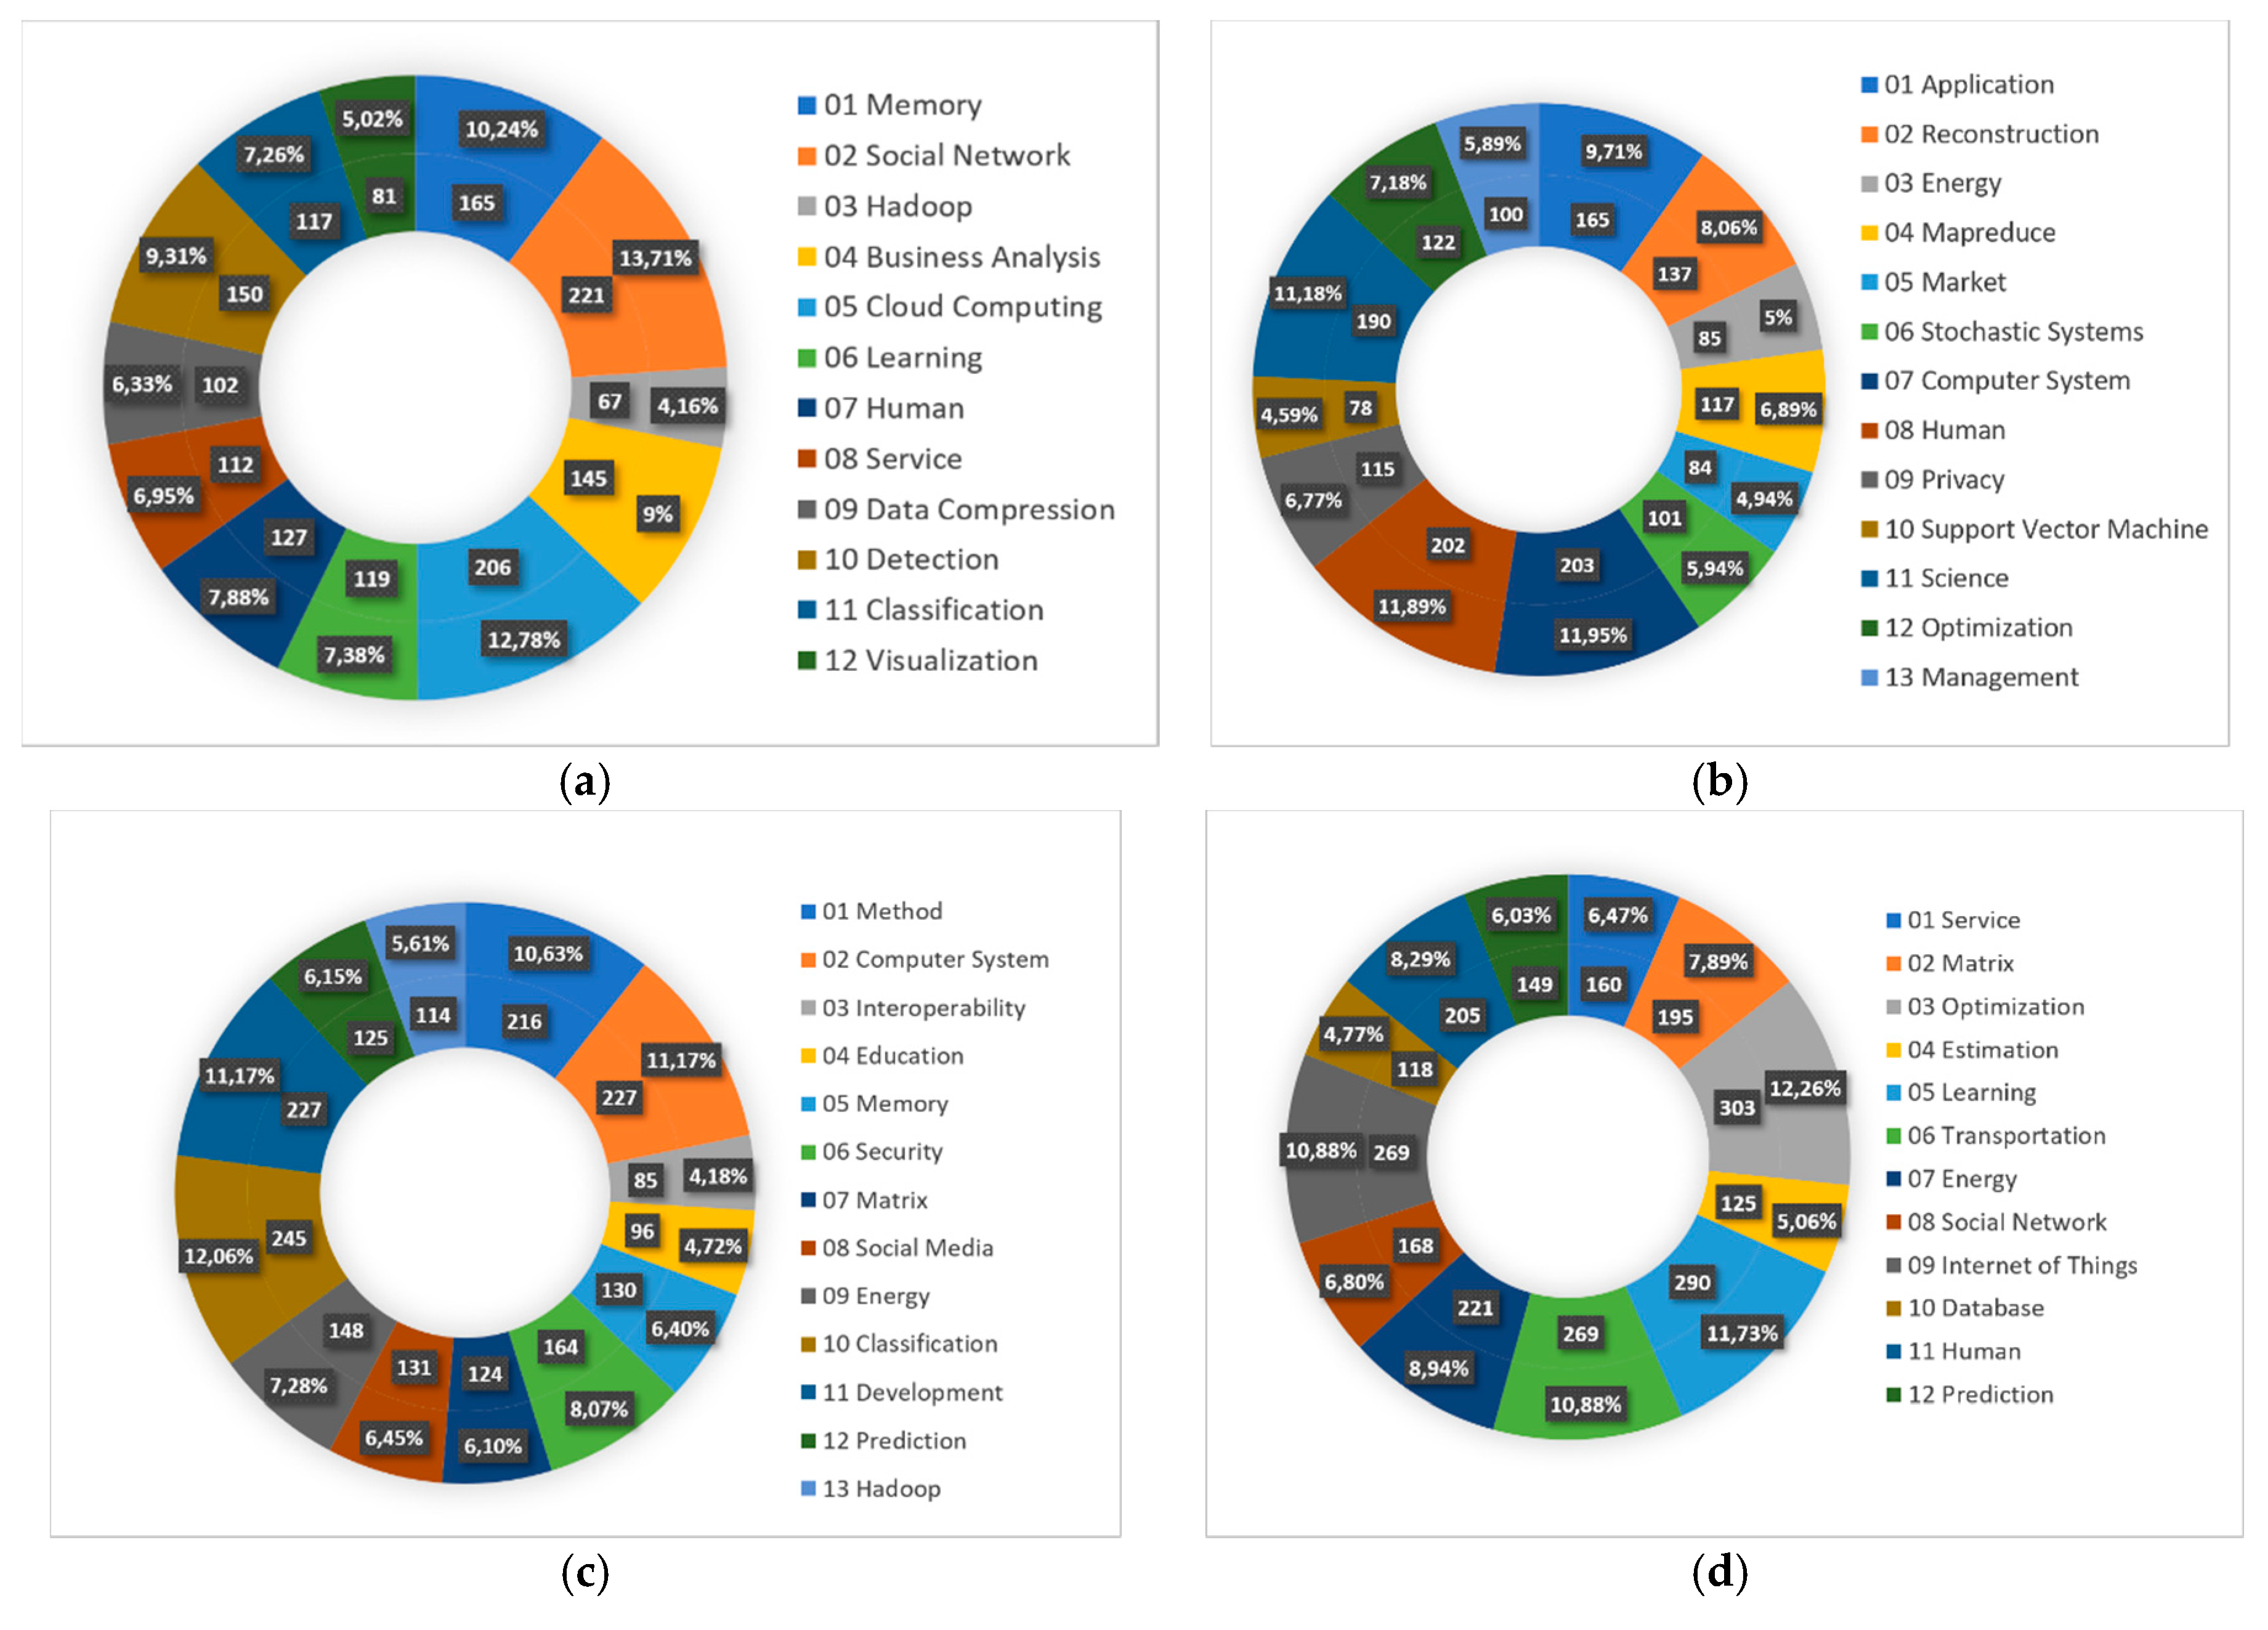
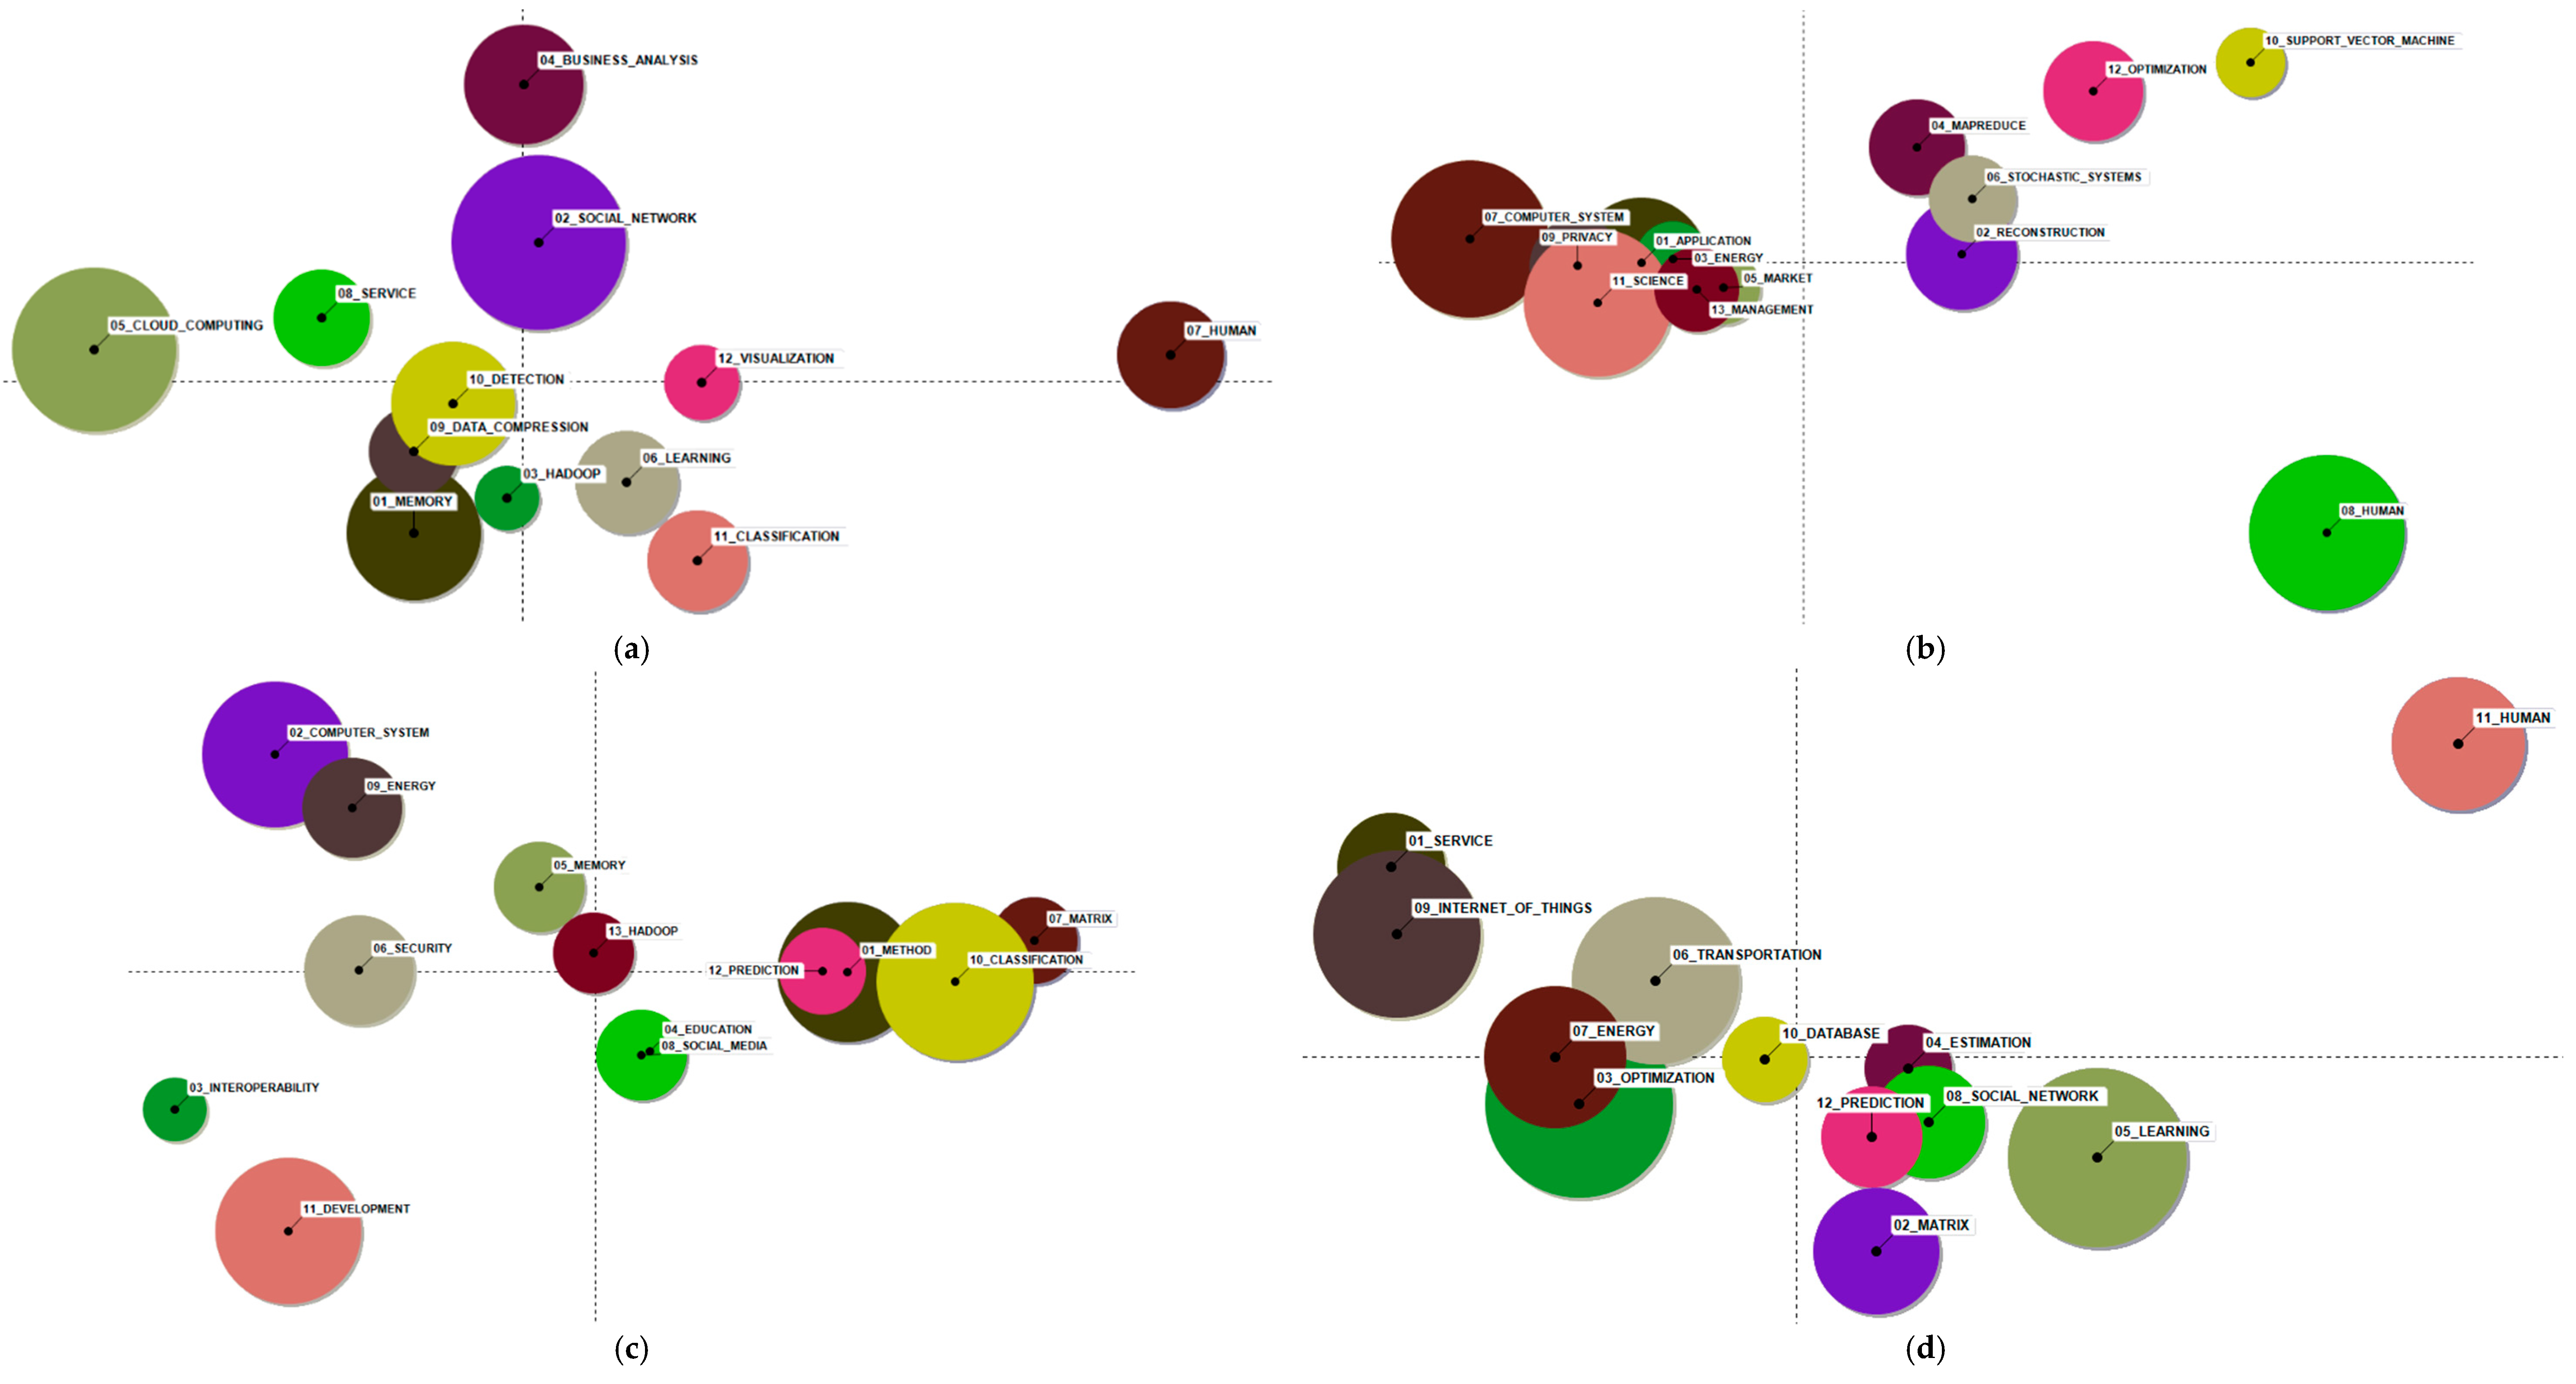
5.1. Major Themes in Big Data Research
5.1.1. Big Data Analytics Tools and Algorithms
5.1.2. Big Data Infrastructure
5.1.3. Privacy and Security Issue in Big Data
5.1.4. Big Data Applications and Services
5.1.5. Big Data-Related Technologies
6. Further Discussions
6.1. Big Data Topic Analysis
6.2. Future Big Data Research Trends
- Big data processing and analyticsDriven by applications in the real world, big data analytics becomes very interesting and challenging. The need to process such extensive data becomes inevitable. However, as there is considerable noise in big data, cleaning and extracting the required data from such a colossal data space demand considerable effort. Furthermore, machine learning plays an essential role in transforming data into useful information and can be interpreted by humans. A vast amount of available data requires sophisticated machine learning algorithms and techniques. The challenge is that the process must take place in a distributed environment [90].
- Advanced supporting technologies for big data analyticsBig data processing and analytics can only be implemented successfully when there is also innovation in the underlying supporting technologies. Efficient and scalable new algorithms for big data analysis need to be developed, as do tools and platforms.
- New or advanced big data applications and servicesIn the future, the amount of data will continue to increase so that gigabytes will no longer be the relevant quantity of data. Billions of devices are connected to the internet and continuously emit data that must be collected and processed. Larger chunks of data, such as terabytes and petabytes, will be processed regularly. This rapid growth and processing of data have led to the emergence of entirely new applications for individuals and companies, such as remote healthcare systems and smart applications [90].
- Privacy and security in big dataWhile the development of new big data technology enables better and more service automation, there are also privacy and security risks that come with this new technology that must be calculated and treated directly from the beginning. Big data technological advancements open up the possibility for more personal data to be collected and can cause severe privacy issues that must be addressed. Not only private data that needs to be secured but also public data and facilities connected to the internet can be targeted for attacks. Therefore, appropriate mechanisms must be developed and applied to reduce the risk of privacy and security.
6.3. Threats to Validity
7. Conclusions
Author Contributions
Funding
Conflicts of Interest
Appendix A

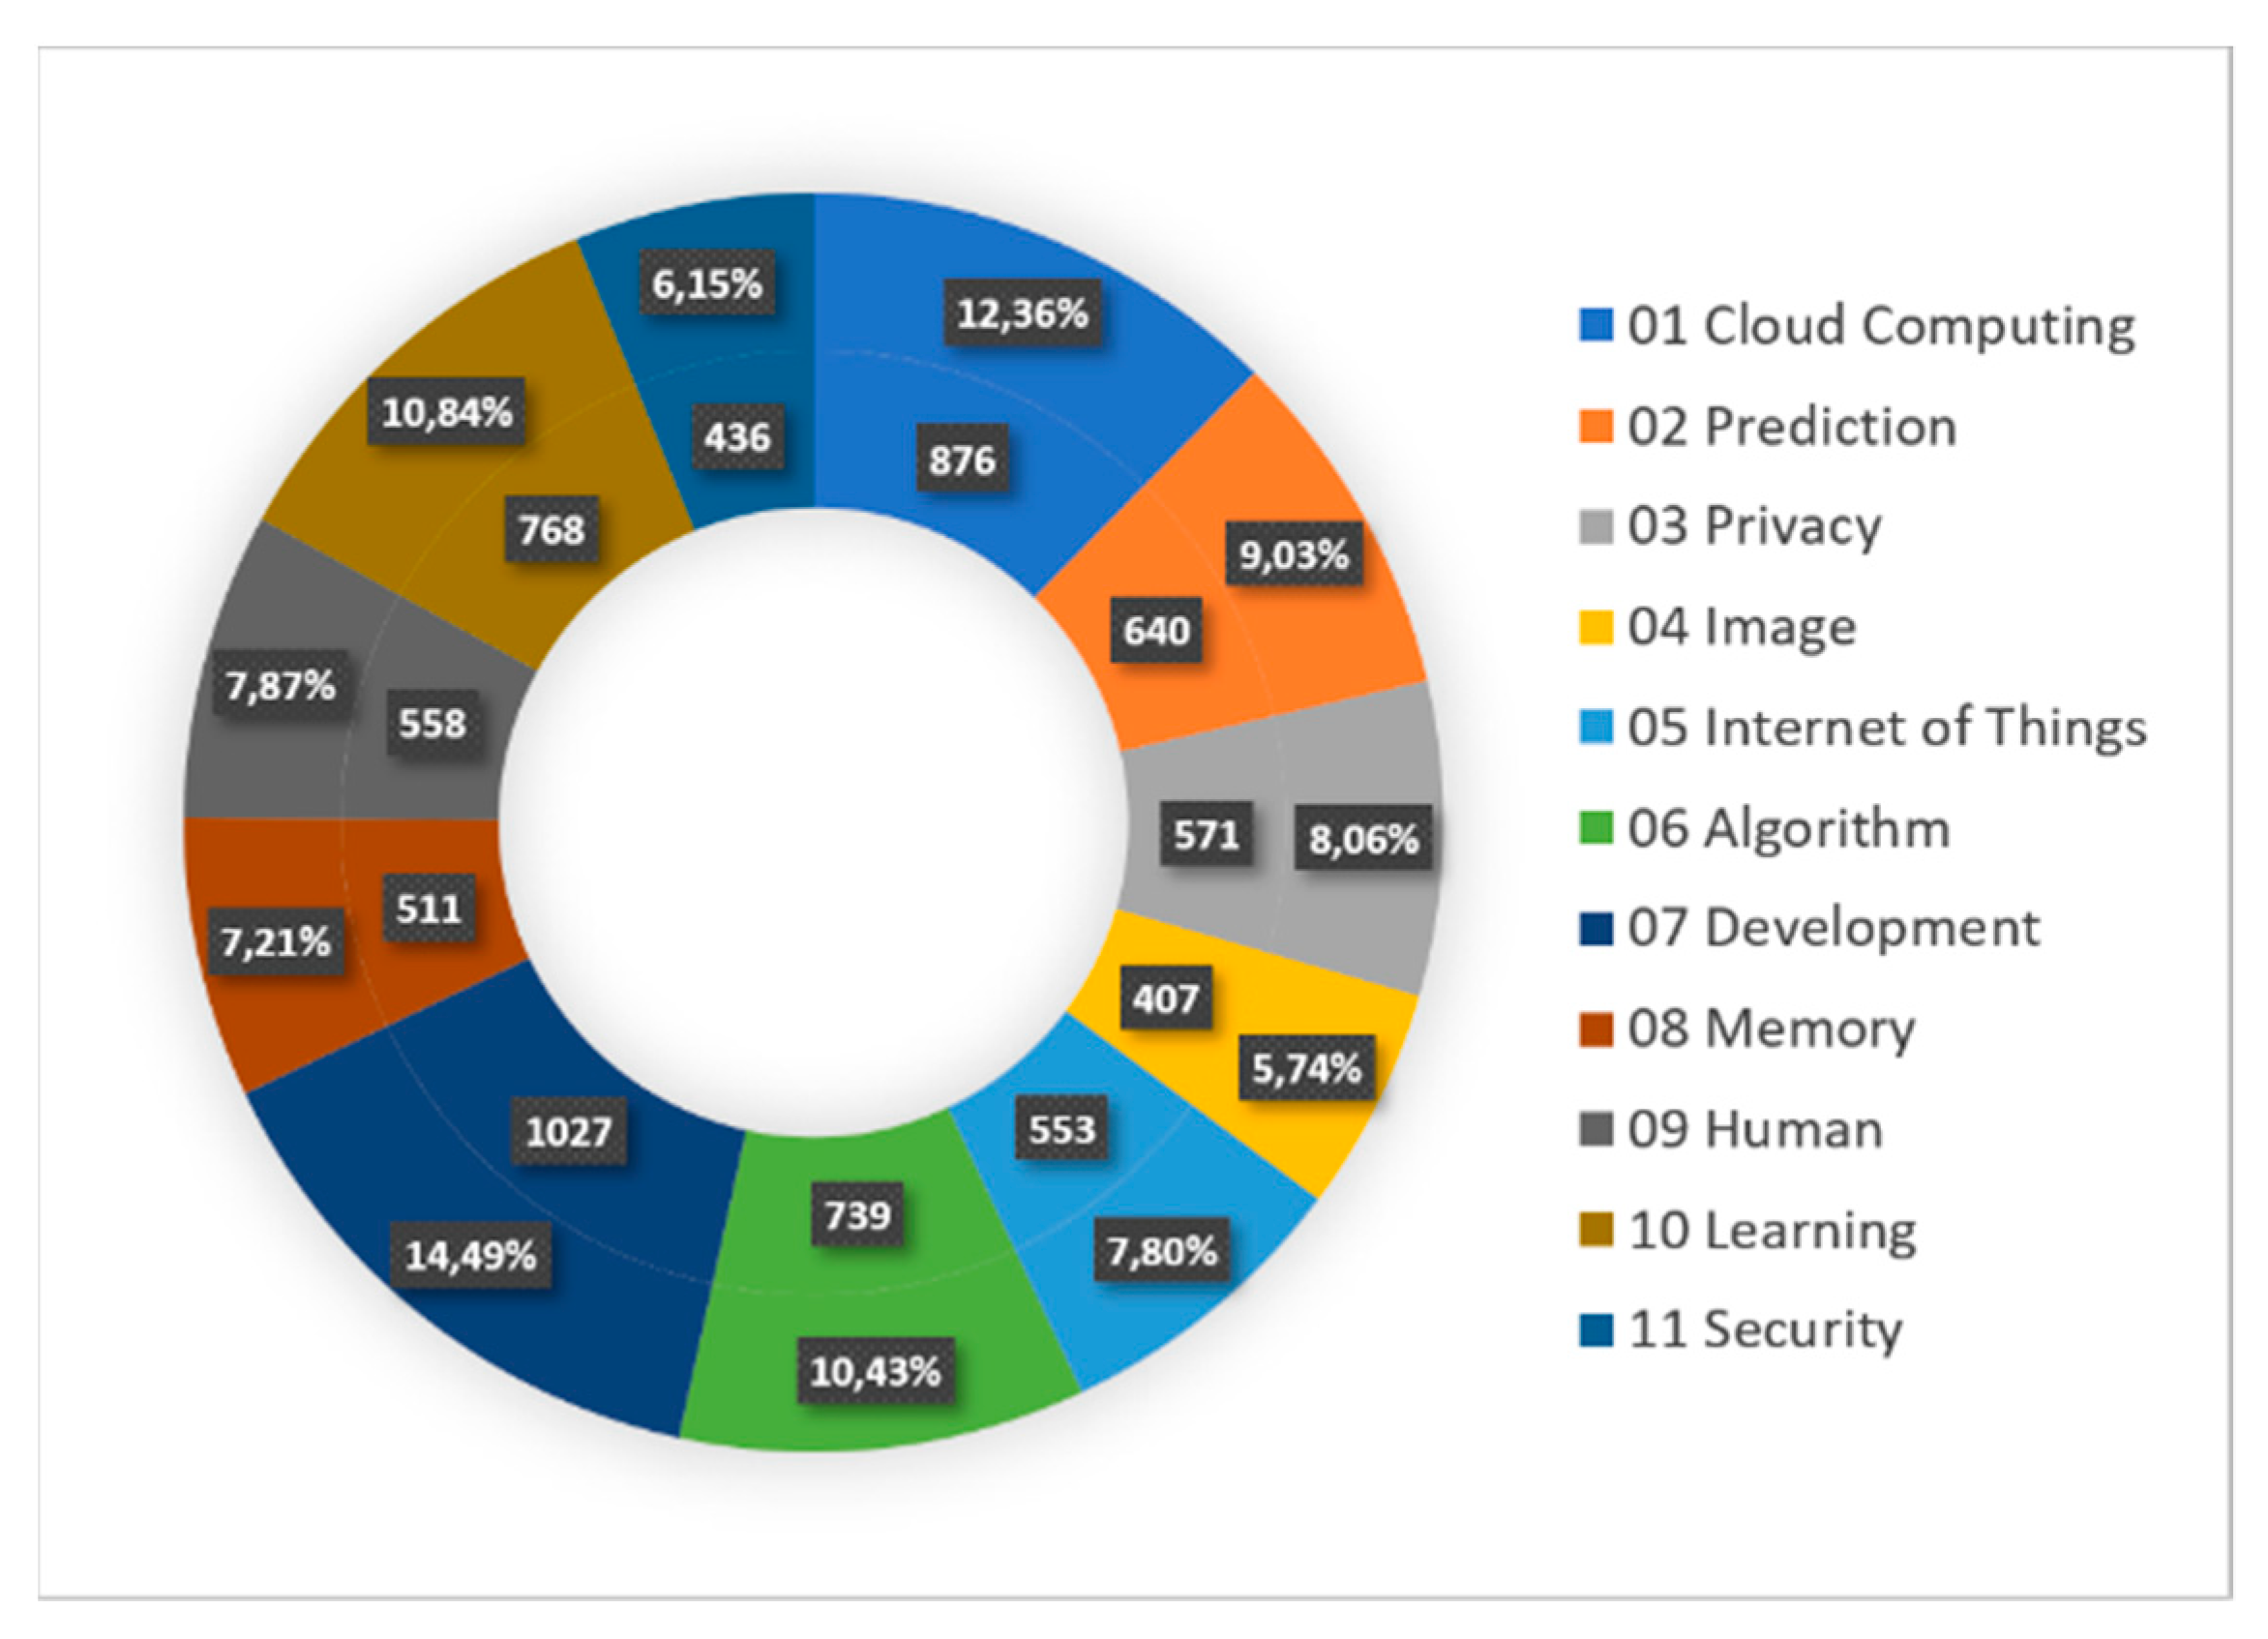
| Labels | Keywords |
|---|---|
| 01 Cloud Computing | cloud computing, cloud, computer system, distribute, schedule, application, service, quality of service, resource, computing. |
| 02 Prediction | forecast, prediction, regression, time series, estimation, model, correlation, method, maximum likelihood, linear. |
| 03 Privacy | privacy, social, data privacy, data protection, personal, science, web, ethic, information, user. |
| 04 Image | image, feature extraction, feature selection, support vector machine, convolutional neural network, feature, detection, classification, recognition, deep learning. |
| 05 Internet of Things | internet of things, energy, monitor, intelligent, smart, sensor, cyber physical system, building, meter, transportation. |
| 06 Algorithm | cluster, algorithm, mapreduce, optimization, hadoop, k means, iterative, parallel, evolutionary, graph. |
| 07 Development | development, management, education, business, teaching, sustainable, industry, product, innovation, environmental. |
| 08 Memory | memory, storage, hardware, file, architecture, data storage, digital storage, random access, cache, query. |
| 09 Human | human, journal, priority, statistical, biology, procedure, genetic, genomics, article, study. |
| 10 Learning | learning, classification, learning system, machine learning, artificial intelligence, decision tree, on-line, data mining, e-learning, supervise. |
| 11 Security | security, wireless, communication, network, wireless communication, authentication, transmission, telecommunication, wireless network, protocol. |
Appendix B

Appendix C

Appendix D
| Labels | Keywords |
|---|---|
| 01 Memory | query, parallel, memory, distribute, architecture, process, parallel processing, graphic processing unit, parallel programming, query languages. |
| 02 Social Network | social network, on-line, social media, web, social, identity, medium, twitter, community, influence. |
| 03 Hadoop | hadoop, mapreduce, k-means, jacobi, preference, job, cluster, iterative, apache, sample. |
| 04 Business Analysis | business analysis, government, privacy, science, information technology, competitive, society, business intelligence, business, research. |
| 05 Cloud Computing | cloud computing, cloud, internet of things, storage, security, mobile, key, application, computer system, access control. |
| 06 Learning | learning, learning system, machine learning, artificial intelligence, mixture, sparse, extreme learning machine, dictionary learning, knowledge, kernel. |
| 07 Human | human, informatics, factual, medical, genetic, procedure, biology, genomics, database, health. |
| 08 Service | service, management, manufacture, availability, information management, iplant, composition, production, chain, customization. |
| 09 Data Compression | schedule, data compression, heuristic, data flow, real time, compression, stream, road, bandwidth, reservation. |
| 10 Detection | detection, wireless sensor network, sensor, power, measurement, decomposition, smart grid, stability, communication, electric power. |
| 11 Classification | classification, classifier, support vector machine, decision tree, mining, frequent itemset mining, rule, association rule, feature selection, text |
| 12 Visualization | statistical, visualization, molecular, statistic, interface, visual, analysis, logit, symposium, multivariate. |
Appendix E
| Labels | Keywords |
|---|---|
| 01 Application | stream, application, computer, data handling, schedule, process, data processing, hardware, multimedia, memory |
| 02 Reconstruction | reconstruction, spatial, image, microscopy, regression, climate change, spatiotemporal, climate, temporal, action. |
| 03 Energy | energy, utilization, transmission, energy efficiency, consumption, allocation, power, wireless, electric, electric power. |
| 04 Mapreduce | cluster, mapreduce, k means, hadoop, algorithm, table, hadoop distributed file system, associative, keyword, header. |
| 05 Market | market, product, chain, knowledge, manufacture, supply, analytic hierarchy process, organizational, finance, internet. |
| 06 Stochastic Systems | stochastic, stochastic systems, text mining, factorization, text, information retrieval, pipeline, natural language processing, arabic, fabrication. |
| 07 Computer System | computer system, distribute, cloud computing, storage, network, data center, cloud, digital storage, radio, software defined network. |
| 08 Human | human, journal, priority, study, factual, article, database, sequencing, information processing, procedure. |
| 09 Privacy | privacy, data privacy, security, encryption, cryptography, privacy preserving, data protection, secure, protection, personal |
| 10 Support Vector Machine | support vector machine, swarm, support vector regression, ridge, classification, feature selection, feature extraction, data mining, ensemble learning, synthesis. |
| 11 Science | science, web, research, technology, social, social network, internet of things, behavioral, smart city, on-line. |
| 12 Optimization | optimization, learning, forecast, prediction, kernel, method, collaborative filtering, algorithm, classification, recommendation system. |
| 13 Management | management, information management, waste, water, control, transportation, transit, nosql, manufacture, business. |
Appendix F
| Labels | Keywords |
|---|---|
| 01 Method | method, numerical, statistical, analysis, graphic, model, surface, graph, optimization, histogram. |
| 02 Computer System | computer system, distribute, internet of things, wireless sensor network, sensor, real time, cloud computing, embedded system, smart city, routing. |
| 03 Interoperability | interoperability, emission, information system, aesthetic, semantic, customer, bold, disaster, semantic web, interview. |
| 04 Education | education, convolutional neural network, teaching, student, image, convolution, facial, deep belief network, deep learning, recognition. |
| 05 Memory | memory, storage, hardware, data storage, random access, reconfigurable, file, architecture, digital storage, flash. |
| 06 Security | security, privacy, data privacy, cryptography, privacy preserving, encryption, protection, data protection, encryptions, product. |
| 07 Matrix | matrix, algebra, subspace, decomposition, cluster, discriminant, density, principal component analysis, sparse, low rank. |
| 08 Social Media | social media, biology, human, social network, twitter, genetic, informatics, vaccine, disease, on-line. |
| 09 Energy | energy, utilization, energy efficiency, consumption, virtual machine, mobile, power management, transmission, meter, wireless network. |
| 10 Classification | classification, learning system, learning, machine learning, artificial intelligence, decision tree, algorithm, extreme learning machine, tree, rough. |
| 11 Development | development, management, sustainable, innovation, environmental, economic, society, technology, education, supply. |
| 12 Prediction | prediction, forecast, inference, wind, recommendation system, fuzzy, particle swarm optimization, markov chain monte carlo, cluster, fault |
| 13 Hadoop | hadoop, mapreduce, hadoop distributed file system, nosql, query, hbase, mongodb, rock, data warehouse, software. |
Appendix G
| Labels | Keywords |
|---|---|
| 01 Service | service, cloud, cloud computing, provider, storage, product lifecycle, mobile, healthcare, edge computing, digital. |
| 02 Matrix | cluster, matrix, mining, algorithm, iterative, association rule, rough set, recommendation system, approximation, data mining. |
| 03 Optimization | schedule, distribute, optimization, program, parallel, high performance computing, computer system, application, resource allocation, memory. |
| 04 Estimation | estimation, statistic, travel, priority, covariance, journal, test, wasserstein, hazard, seismic. |
| 05 Learning | learning, machine learning, classification, learning system, artificial intelligence, supervise, algorithm, e-learning, imbalanced, semi supervised. |
| 06 Transportation | transportation, road, transmission, network, privacy, communication, vehicle, radio, wireless, system. |
| 07 Energy | energy, sustainable, energy efficiency, consumption, utilization, management, conservation, supply, environmental, business analysis |
| 08 Social Network | social network, social media, detection, on-line, extraction, twitter, fault, feature extraction, sentiment analysis, classification. |
| 09 Internet of Things | internet of things, smart, wireless sensor network, smart city, security, sensor, authentication, technology, encryption, cryptography |
| 10 Database | query, database, cache, nosql, transaction, process, mongodb, query languages, punch, tunnel. |
| 11 Human | human, image, medical, procedure, disease, adult, record, drug, image processing, male. |
| 12 Prediction | forecast, prediction, regression, time series, arima, short term, precipitation, deep belief network, stock, convolutional neural network. |
References
- Van Rijmenam, M. A Short History of Big Data. 2019. Available online: https://datafloq.com/read/big-data-history/239 (accessed on 30 October 2019).
- Chen, M.; Mao, S.; Zhang, Y.; Leung, V.C.M. Big Data: Related Technologies, Challenges and Future Prospects; Springer: Berlin/Heidelberg, Germany, 2014. [Google Scholar]
- Datameer. Is the Hype Around Big Data Nothing But Hype. 2018. Available online: https://www.datameer.com/blog/big-data-hype-real-stay/ (accessed on 25 October 2019).
- Zgurovsky, M.Z.; Zaychenko, Y.P. Big Data: Conceptual Analysis and Applications; Springer: Berlin/Heidelberg, Germany, 2020. [Google Scholar]
- Gantz, B.J.; Reinsel, D.; Shadows, B.D. Big Data, Bigger Digital Shadows, and Biggest Growth in the Far East Executive Summary: A Universe of Opportunities and Challenges; IDC: Framingham, MA, USA, 2012; Volume 2007, pp. 1–16. [Google Scholar]
- James, J. Data Never Sleeps 7. Domosphere. 2019. Available online: https://www.domo.com/learn/data-never-sleeps-7 (accessed on 27 October 2019).
- Hu, H.; Wen, Y.; Chua, T.-S.; Li, X. Toward Scalable Systems for Big Data Analytics: A Technology Tutorial. IEEE Access 2014, 2, 652–687. [Google Scholar]
- Gatz, J.; Reinsel, D. Extracting Value from Chaos. 2011. IDC iview 2011, 1142, 1–12. [Google Scholar]
- Laney, D. 3D Data Management: Controlling Data Volume, Velocity, and Variety. 2001. Gartner. Retrieved 2001, 2001, 6. [Google Scholar]
- Shafer, T. The 42 V’s of Big Data and Data Science. 2017. Available online: https://www.kdnuggets.com/2017/04/42-vs-big-data-data-science.html (accessed on 20 October 2019).
- Yin, S.; Kaynak, O. Big Data for Modern Industry: Challenges and Trends. Proc. IEEE 2015, 103, 143–146. [Google Scholar] [CrossRef]
- Xu, Z.; Yu, D. A Bibliometrics analysis on big data research (2009–2018). J. Data Inf. Manag. 2019, 1, 3–15. [Google Scholar] [CrossRef]
- Liu, G.; Nzige, J.H.; Li, K. Trending topics and themes in offsite construction(OSC) research: The application of topic modelling. Constr. Innov. 2019, 19, 343–366. [Google Scholar] [CrossRef]
- Glänzel, W. Bibliometrics as a research field: A course on theory and application of bibliometric indicators; KU Leuven: Leuven, Belgium, 2003; pp. 1–115. [Google Scholar]
- Glenisson, P.; Glänzel, W.; Persson, O. Combining full-text analysis and bibliometric indicators. A pilot study. Scientometrics 2005, 63, 163–180. [Google Scholar] [CrossRef]
- Lee, H.S.; Song, H.G. Classification of Photovoltaic Research Papers by Using Text-Mining Techniques. Appl. Mech. Mater. 2013, 284, 3362–3369. [Google Scholar] [CrossRef]
- Fahad, A.; Alshatri, N.; Tari, Z.; Alamri, A.; Khalil, I.; Zomaya, A.Y.; Foufou, S.; Bouras, A. A Survey of Clustering Algorithms for Big Data: Taxonomy & Empirical Analysis. IEEE Trans. Emerg. Top. Comput. 2014, 2, 267–279. [Google Scholar]
- Kalantari, A.; Kamsin, A.; Kamaruddin, H.S.; Ebrahim, N.A.; Gani, A.; Ebrahimi, A.; Shamshirband, S. A bibliometric approach to tracking big data research trends. J. Big Data 2017, 4, 1–18. [Google Scholar] [CrossRef]
- Hu, J.; Zhang, Y. Discovering the interdisciplinary nature of Big Data research through social network analysis and visualization. Scientometrics 2017, 112, 91–109. [Google Scholar] [CrossRef]
- Akoka, J.; Comyn-Wattiau, I.; Laoufi, N. Research on Big Data—A systematic mapping study. Comput. Stand. Interfaces 2017, 54, 105–115. [Google Scholar] [CrossRef]
- Lu, L.Y.Y.; Liu, J.S. The major research themes of big data literature: From 2001 to 2016. In Proceedings of the 2016 16th IEEE International Conference on Computer and Information Technology CIT, Nadi, Fiji, 8–10 December 2016; pp. 586–590. [Google Scholar]
- Huang, Y.; Zhang, Y.; Lu, J.; Zhang, G.; Porter, A.L. Discovering and forecasting interactions in big data research: A learning-enhanced bibliometric study. Technol. Forecast. Soc. Chang. 2018, 146, 795–807. [Google Scholar]
- Zhang, Y.; Zhang, G.; Chen, H.; Porter, A.L.; Zhu, D.; Lu, J. Topic analysis and forecasting for science, technology and innovation: Methodology with a case study focusing on big data research. Technol. Forecast. Soc. Chang. 2016, 105, 179–191. [Google Scholar] [CrossRef]
- Gu, D.; Li, J.; Li, X.; Liang, C. Visualizing the knowledge structure and evolution of big data research in healthcare informatics. Int. J. Med. Inform. 2017, 98, 22–32. [Google Scholar] [CrossRef] [PubMed]
- van Altena, A.J.; Moerland, P.D.; Zwinderman, A.H.; Olabarriaga, S.D. Understanding big data themes from scientific biomedical literature through topic modeling. J. Big Data 2016, 3, 23. [Google Scholar] [CrossRef]
- Amado, A.; Cortez, P.; Rita, P.; Moro, S. Research trends on Big Data in Marketing: A text mining and topic modeling based literature analysis. Eur. Res. Manag. Bus. Econ. 2018, 24, 1–7. [Google Scholar] [CrossRef]
- Siddiqa, A.; Hashem, I.A.T.; Yaqoob, I.; Marjani, M.; Shamshirband, S.; Gani, A.; Nasaruddin, F. A survey of big data management: Taxonomy and state-of-the-art. J. Netw. Comput. Appl. 2016, 71, 151–166. [Google Scholar] [CrossRef]
- Canito, J.; Ramos, P.; Moro, S.; Rita, P. Unfolding the relations between companies and technologies under the Big Data umbrella. Comput. Ind. 2018, 99, 1–8. [Google Scholar] [CrossRef]
- An Introduction to Big Data Concepts and Terminology | DigitalOcean, 2016. Available online: https://www.digitalocean.com/community/tutorials/an-introduction-to-big-data-concepts-and-terminology (accessed on 24 December 2019).
- Marz, N.; Warren, J. Big Data: Principles and Best Practices of Scalable Realtime Data Systems; Manning Publications Co.: New York, NY, USA, 2015. [Google Scholar]
- T-LAB Plus Quick Introduction. 2020. Available online: https://mytlab.com/QIntroduction_en.pdf (accessed on 26 October 2019).
- Scopus. Why Choose Scopus; 2018. Available online: https://www.elsevier.com/solutions/scopus (accessed on 10 October 2019).
- Harpring, P. Introduction to Controlled Vocabularies: Terminology for Art, Architecture, and Other Cultural Works; Getty Publications: Los Angeles, CA, USA, 2010. [Google Scholar]
- Medelyan, O.; Witten, I.H. Thesaurus based automatic keyphrase indexing. In Proceedings of the ACM/IEEE Joint Conference on Digital Libraries, Chapel Hill, NC, USA, 11–15 June 2006; Volume 2006, pp. 296–297. [Google Scholar]
- Medelyan, O. Human-Competitive Automatic Topic Indexing; The University of Waikato: Hamilton, New Zealand, 2009. [Google Scholar]
- He, G.; Fang, J.; Cui, H.; Wu, C.; Lu, W. Keyphrase extraction based on prior knowledge. In Proceedings of the ACM/IEEE Joint Conference on Digital Libraries, Fort Worth, TX, USA, 3–7 June 2018; pp. 341–342. [Google Scholar]
- Cobo, M.J.; Herrera, F. An approach for detecting, quantifying, and visualizing the evolution of a research field: A practical application to the Fuzzy Sets Theory field. J. Informetr. 2011, 5, 146–166. [Google Scholar] [CrossRef]
- Gutiérrez-Salcedo, M.; Martínez, M.Á.; Moral-Munoz, J.A.; Herrera-Viedma, E.; Cobo, M.J. Some bibliometric procedures for analyzing and evaluating research fields. Appl. Intell. 2018, 48, 1275–1287. [Google Scholar] [CrossRef]
- Steinbach, M.; Karypis, G.; Kumar, V. A Comparison of Document Clustering Techniques. In Proceedings of the KDD-2000 Workshop on Text Mining, Boston, MA, USA, 20–23 August 2000. [Google Scholar]
- Savaresi, S.M.; Boley, D.L. On the performance of bisecting K-means and PDDP. In Proceedings of the 2001 SIAM International Conference on Data Mining, Chicago, IL, USA, 5–7 April 2001. [Google Scholar]
- Savaresi, S.M.; Boley, D.L. A comparative analysis on the bisecting K-means and the PDDP clustering algorithms. Intell. Data Anal. 2004, 8, 345–362. [Google Scholar] [CrossRef]
- Aizawa, A. An information-theoretic perspective of tf-idf measures. Inf. Process. Manag. 2003, 39, 45–65. [Google Scholar] [CrossRef]
- Rish, I. An empirical study of the naive Bayes classifier. In Proceedings of the IJCAI 2001 Workshop on Empirical Methods in Artificial Intelligence, Seattle, WA, USA, 4 August 2001; Volume 3, pp. 41–46. [Google Scholar]
- Raschka, S. Naive Bayes and Text Classification I—Introduction and Theory. arXiv 2014, arXiv:1410.5329. [Google Scholar]
- Lancia, F. User Manual T-Lab 9.1. Tools for Text Analysis. 2015. Available online: https://www.mytlab.com/Manual_en_plus.zip (accessed on 24 October 2019).
- Groenen, P.J.F. An introduction to applied correspondence analysis. PsycCRITIQUES 2000, 45, 327–328. [Google Scholar] [CrossRef]
- Al-Fuqaha, A.; Guizani, M.; Mohammadi, M.; Aledhari, M.; Ayyash, M. Internet of Things: A Survey on Enabling Technologies, Protocols, and Applications. IEEE Commun. Surv. Tutor. 2015, 17, 2347–2376. [Google Scholar] [CrossRef]
- Chen, H.; Chiang, R.H.L.; Storey, V.C. Business intelligence and analytics: From big data to big impact. MIS Q. Manag. Inf. Syst. 2012, 36, 1165–1188. [Google Scholar] [CrossRef]
- Wu, X.; Zhu, X.; Wu, G.-Q.; Ding, W. Data mining with big data. IEEE Trans. Knowl. Data Eng. 2014, 26, 97–107. [Google Scholar]
- Chen, C.L.P.; Zhang, C.-Y. Data-intensive applications, challenges, techniques and technologies: A survey on Big Data. Inf. Sci. 2014, 275, 314–347. [Google Scholar] [CrossRef]
- Gandomi, A.; Haider, M. Beyond the hype: Big data concepts, methods, and analytics. Int. J. Inf. Manag. 2015, 35, 137–144. [Google Scholar] [CrossRef]
- Lv, Y.; Duan, Y.; Kang, W.; Li, Z.; Wang, F.-Y. Traffic flow prediction with big data: A deep learning approach. IEEE Trans. Intell. Transp. Syst. 2014, 16, 865–873. [Google Scholar] [CrossRef]
- Islam, S.M.R.; Kwak, D.; Kabir, M.H.; Hossain, M.; Kwak, K.S. The internet of things for health care: A comprehensive survey. IEEE Access 2015, 3, 678–708. [Google Scholar] [CrossRef]
- Muja, M.; Lowe, D.G. Scalable nearest neighbor algorithms for high dimensional data. IEEE Trans. Pattern Anal. Mach. Intell. 2014, 36, 2227–2240. [Google Scholar] [CrossRef] [PubMed]
- Kitchin, R. Big Data, new epistemologies and paradigm shifts. Big Data Soc. 2014. [Google Scholar] [CrossRef]
- Bagha, A.; Madisetti, V. Big Data Science & Analytics: A Hands-On Approach; VPT: Atlanta, GA, USA, 2016. [Google Scholar]
- Said, A.; Torra, V. Data Science in Practice; Springer: Cham, Switzerland, 2019. [Google Scholar]
- Council, N.R. Frontiers in Massive Data Analysis; The National Academies Press: Washington, DC, USA, 2013. [Google Scholar]
- Tozzi, C. 4 Big Data Infrastructure Pain Points and How to Solve Them. 2018. Available online: https://blog.syncsort.com/2018/11/big-data/4-big-data-infrastructure-points-solve/ (accessed on 10 October 2019).
- Ardagna, C.A.; Damiani, E. Business Intelligence meets Big Data: An Overview on Security and Privacy. In Proceedings of the NSF Workshop on Big Data Security and Privacy, Dallas, TX, USA, 16–17 September 2014. [Google Scholar]
- Matturdi, B.; Zhou, X.; Li, S.; Lin, F. Big Data security and privacy: A review. China Commun. 2014, 11, 135–145. [Google Scholar] [CrossRef]
- Lu, R.; Zhu, H.; Liu, X.; Liu, J.; Shao, J. Toward efficient and privacy-preserving computing in big data era. IEEE Netw. 2014, 28, 46–50. [Google Scholar] [CrossRef]
- Murdoch, T.B.; Detsky, A.S. The inevitable application of big data to health care. J. Am. Med. Assoc. 2013, 309, 1351–1352. [Google Scholar] [CrossRef]
- Zhao, W.; Zou, W.; Chen, J.J. Topic modeling for cluster analysis of large biological and medical datasets. BMC Bioinform. 2014, 15, S11. [Google Scholar] [CrossRef]
- Pröllochs, N.; Feuerriegel, S. Business analytics for strategic management: Identifying and assessing corporate challenges via topic modeling. Inf. Manag. 2018. [Google Scholar] [CrossRef]
- Moro, S.; Cortez, P.; Rita, P. Business intelligence in banking: A literature analysis from 2002 to 2013 using text mining and latent Dirichlet allocation. Expert Syst. Appl. 2015, 42, 1314–1324. [Google Scholar] [CrossRef]
- Corea, F.; Cervellati, E.M. The Power of Micro-Blogging: How to Use Twitter for Predicting the Stock Market. Eurasian J. Econ. Financ. 2015, 3, 1–7. [Google Scholar] [CrossRef]
- Xiang, Z.; Schwartz, Z.; Gerdes, J.H.; Uysal, M. What can big data and text analytics tell us about hotel guest experience and satisfaction? Int. J. Hosp. Manag. 2015, 44, 120–130. [Google Scholar] [CrossRef]
- Jiang, H.; Qiang, M.; Lin, P. A topic modeling based bibliometric exploration of hydropower research. Renew. Sustain. Energy Rev. 2016, 57, 226–237. [Google Scholar] [CrossRef]
- Schuelke-Leech, B.-A.; Barry, B.; Muratori, M.; Yurkovich, B.J. Big Data issues and opportunities for electric utilities. Renew. Sustain. Energy Rev. 2015, 52, 937–947. [Google Scholar] [CrossRef]
- Bertot, J.C.; Choi, H. Big data and e-government: Issues, policies, and recommendations. ACM Int. Conf. Proc. Ser. 2013, 19, 1–10. [Google Scholar]
- Bertot, J.C.; Gorham, U.; Jaeger, P.T.; Sarin, L.C.; Choi, H. Big data, open government and e-government: Issues, policies and recommendations. Inf. Polity 2014, 19, 5–16. [Google Scholar] [CrossRef]
- Kim, G.-H.; Trimi, S.; Chung, J. Big Data Applications in the Government. Commun. ACM 2014, 57, 78–85. [Google Scholar] [CrossRef]
- Chen, Y.-C.; Hsieh, T.-C. Big Data for Digital Government. Int. J. Public Adm. Digit. Age 2014, 1, 1–14. [Google Scholar] [CrossRef]
- Attaran, M.; Stark, J.; Stotler, D. Opportunities and challenges for big data analytics in US higher education: A conceptual model for implementation. Ind. High. Educ. 2018, 32, 169–182. [Google Scholar] [CrossRef]
- Riffai, M.M.M.A.; Duncan, P.; Edgar, D.; Al-Bulushi, A.H. The potential for big data to enhance the higher education sector in Oman. In Proceedings of the 2016 ICBDSC 3rd MEC International Conference on Big Data and Smart City, Muscat, Oman, 15–16 March 2016; pp. 79–84. [Google Scholar]
- Wang, Y. Big Opportunities and Big Concerns of Big Data in Education. TechTrends 2016, 60, 381–384. [Google Scholar] [CrossRef]
- Ghofrani, F.; He, Q.; Goverde, R.M.P.; Liu, X. Recent applications of big data analytics in railway transportation systems: A survey. Transp. Res. Part C Emerg. Technol. 2018, 90, 226–246. [Google Scholar] [CrossRef]
- Wang, C.; Li, X.; Zhou, X.; Wang, A.; Nedjah, N. Soft computing in big data intelligent transportation systems. Appl. Soft Comput. J. 2016, 38, 1099–1108. [Google Scholar] [CrossRef]
- Zheng, X.; Chen, W.; Wang, P.; Shen, D.; Chen, S.; Wang, X.; Zhang, Q.; Yang, L. Big data for social transportation. IEEE Trans. Intell. Transp. Syst. 2015, 17, 620–630. [Google Scholar] [CrossRef]
- Clemment, J. “Global social media ranking 2019”, Statista, 2019. Available online: https://www.statista.com/statistics/272014/global-social-networks-ranked-by-number-of-users/ (accessed on 27 December 2019).
- Mell, P.; Grance, T. The NIST-National Institute of Standars and Technology- Definition of Cloud Computing. 2011. Available online: https://csrc.nist.gov/publications/detail/sp/800-145/final (accessed on 17 October 2019).
- Mittal, M.; Balas, V.E.; Goyal, L.M.; Kumar, R. Big Data Processing Using Spark in Cloud; Springer: Singapore, 2019. [Google Scholar]
- El-Seoud, S.A.; El-Sofany, H.F.; Abdelfattah, M.; Mohamed, R. Big data and cloud computing: Trends and challenges. Int. J. Interact. Mob. Technol. 2017, 11, 34–52. [Google Scholar] [CrossRef]
- Srinivasan, S. Guide to Big Data Applications; Springer: Cham, Switzerland, 2018. [Google Scholar]
- Jamali, M.A.J.; Bahrami, B.; Heidari, A.; Allahverdizadeh, P.; Norouzi, F. Towards the Internet of Things; Springer: Cham, Switzerland, 2019. [Google Scholar]
- Ahmed, E.; Yaqoob, I.; Hashem, I.A.T.; Khan, I.; Ahmed, A.I.A.; Imran, M.; Vasilakos, A.V. The role of big data analytics in Internet of Things. Comput. Netw. 2017, 129, 459–471. [Google Scholar] [CrossRef]
- Xu, X.; Huang, S.; Chen, Y.; Brown, K.; Halilovic, I.; Lu, W.T. SAaaS: Time series analytics as a service on IoT. In Proceedings of the 2014 ICWS IEEE International Conference on Web Services, Anchorage, AK, USA, 27 June–2 July 2014; pp. 249–256. [Google Scholar]
- Li, X.; Xie, Q.; Daim, T.; Huang, L. Forecasting technology trends using text mining of the gaps between science and technology: The case of perovskite solar cell technology. Technol. Forecast. Soc. Change 2019, 146, 432–449. [Google Scholar] [CrossRef]
- Mistrik, I.; Bahsoon, R.; Ali, N.; Heisel, M.; Maxim, B. Software Architecture for Big Data and the Cloud; Morgan Kaufmann: Burlington, MA, USA, 2017. [Google Scholar]


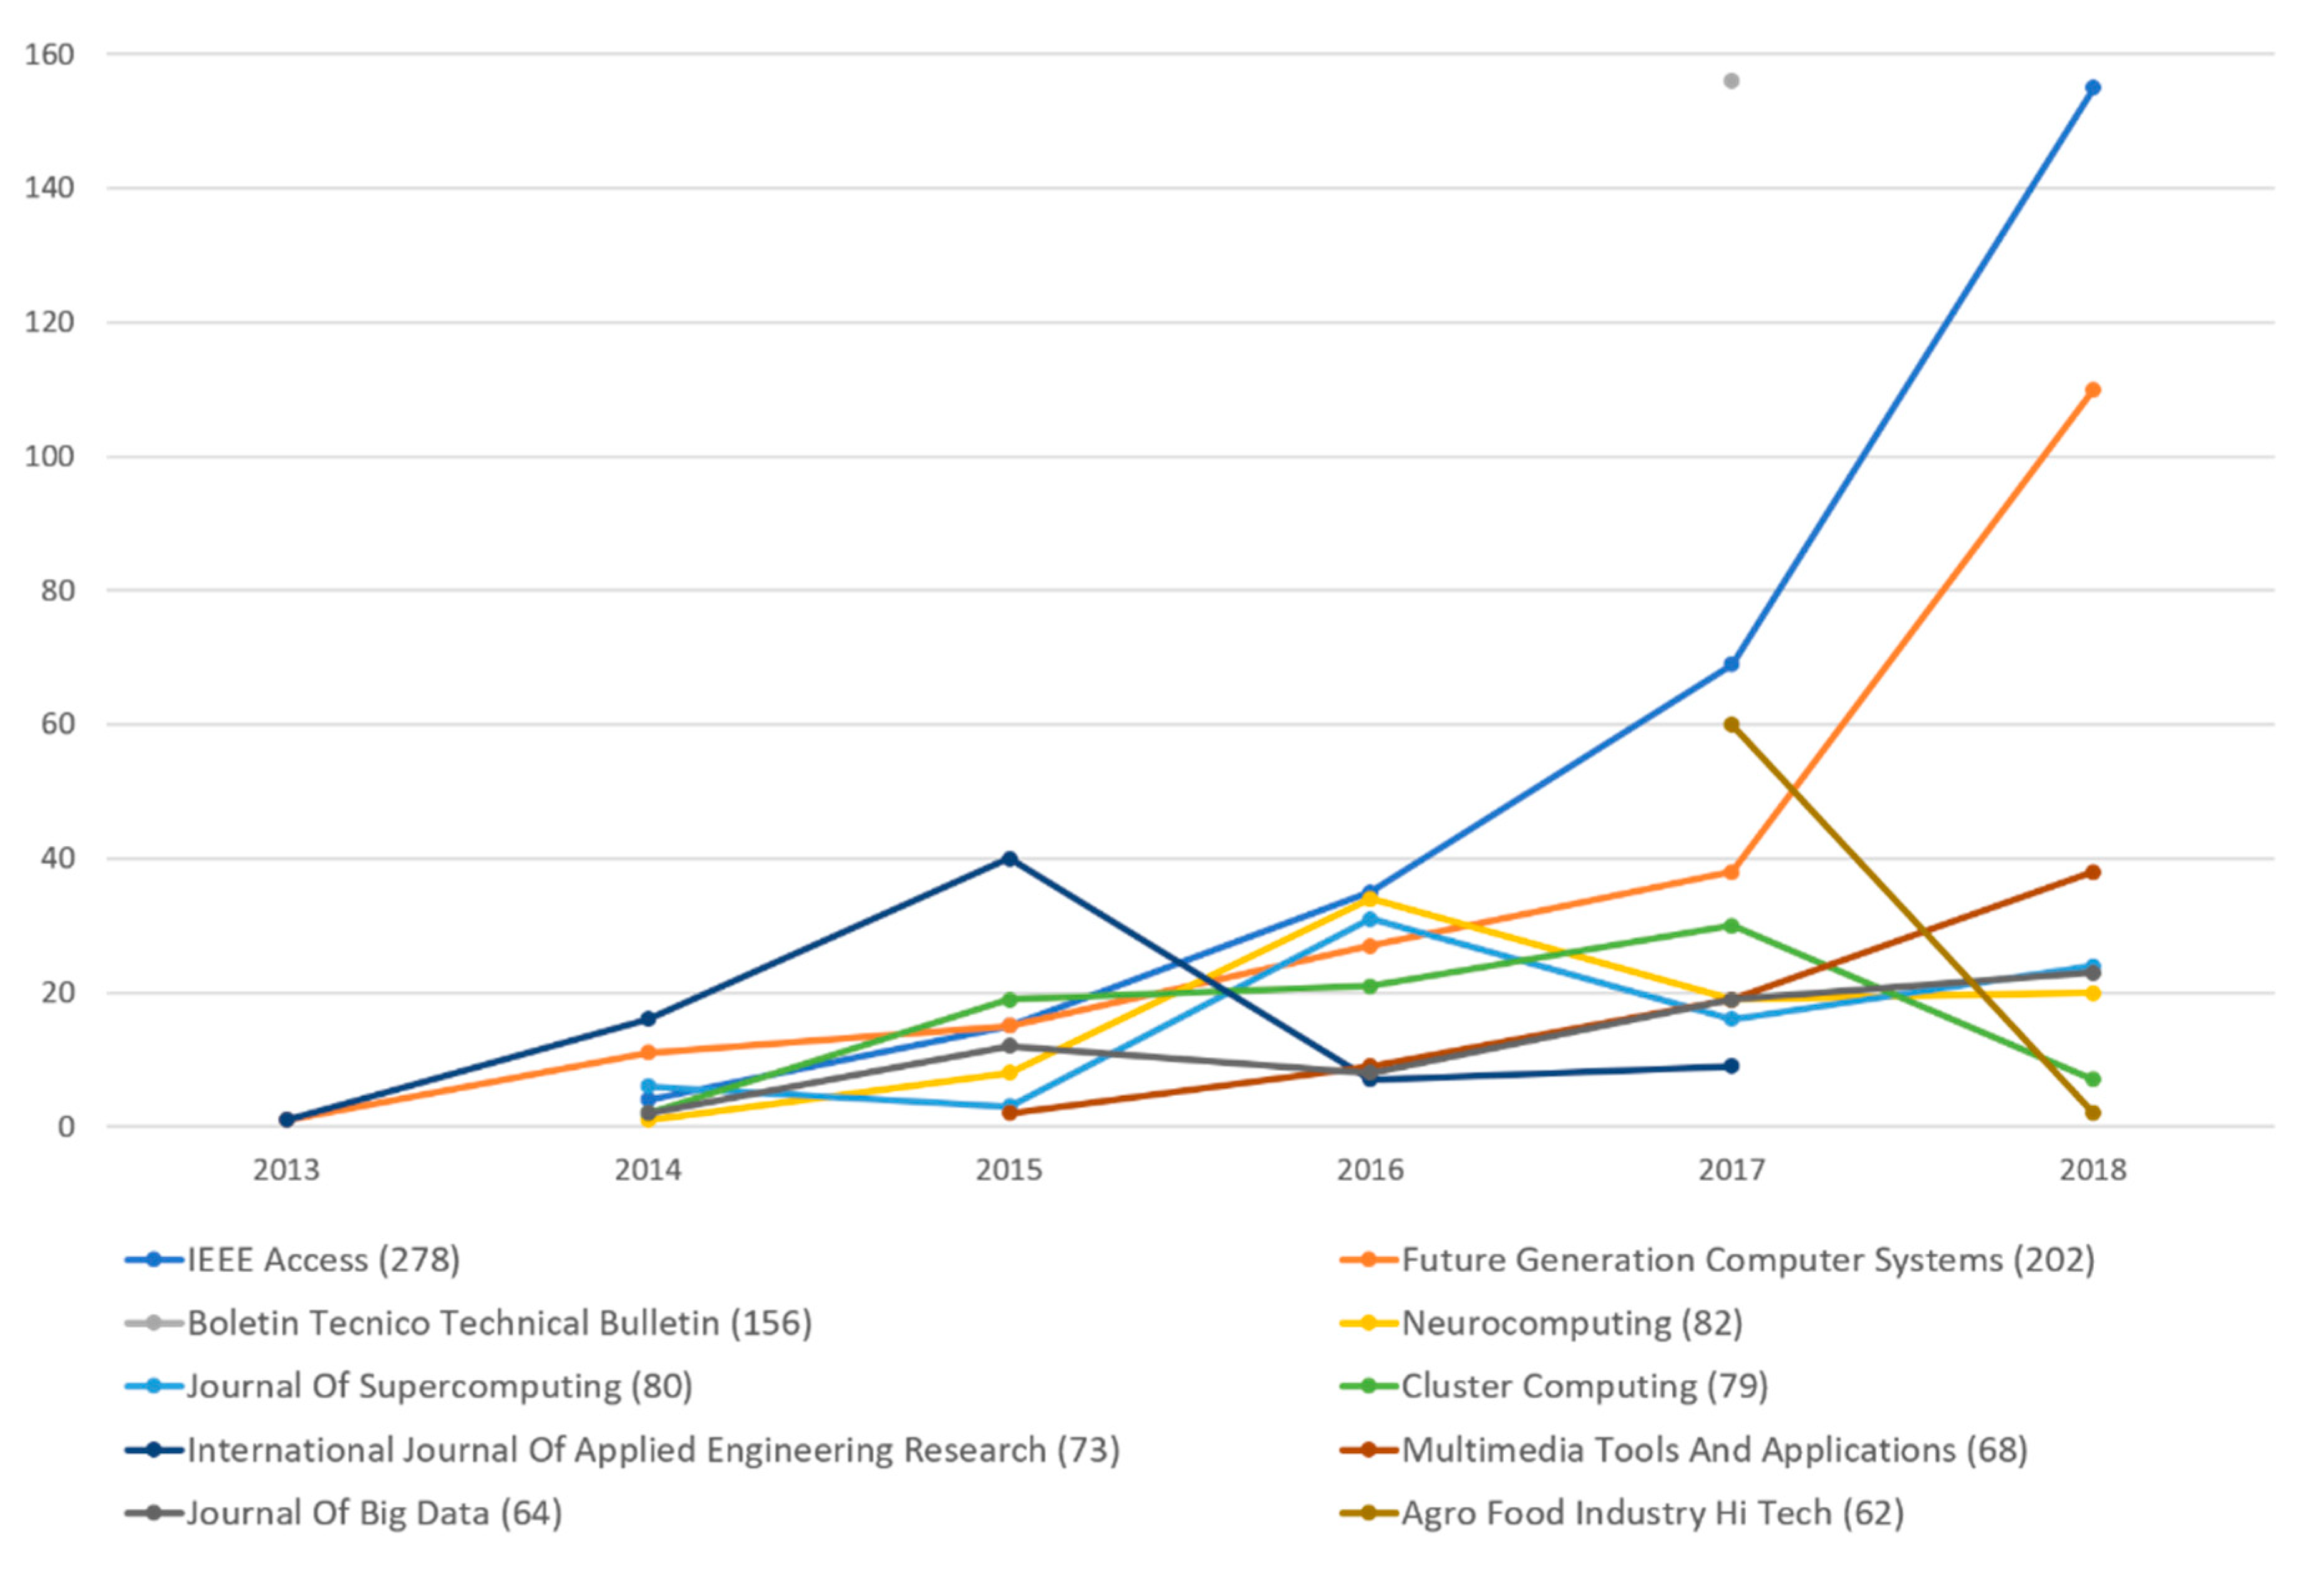
| Journal | 2013 | 2014 | 2015 | 2016 | 2017 | 2018 | Total |
|---|---|---|---|---|---|---|---|
| IEEE Access | 4 | 15 | 35 | 69 | 155 | 278 | |
| Future Generation Computer Systems | 1 | 11 | 15 | 27 | 38 | 110 | 202 |
| Boletin Tecnico Technical Bulletin | 156 | 156 | |||||
| Neurocomputing | 1 | 8 | 34 | 19 | 20 | 82 | |
| Journal of Supercomputing | 6 | 3 | 31 | 16 | 24 | 80 | |
| Cluster Computing | 2 | 19 | 21 | 30 | 7 | 79 | |
| International Journal of Applied Engineering Research | 1 | 16 | 40 | 7 | 9 | 73 | |
| Multimedia Tools and Applications | 2 | 9 | 19 | 38 | 68 | ||
| Journal of Big Data | 2 | 12 | 8 | 19 | 23 | 64 | |
| Agro Food Industry Hi Tech | 60 | 2 | 62 |
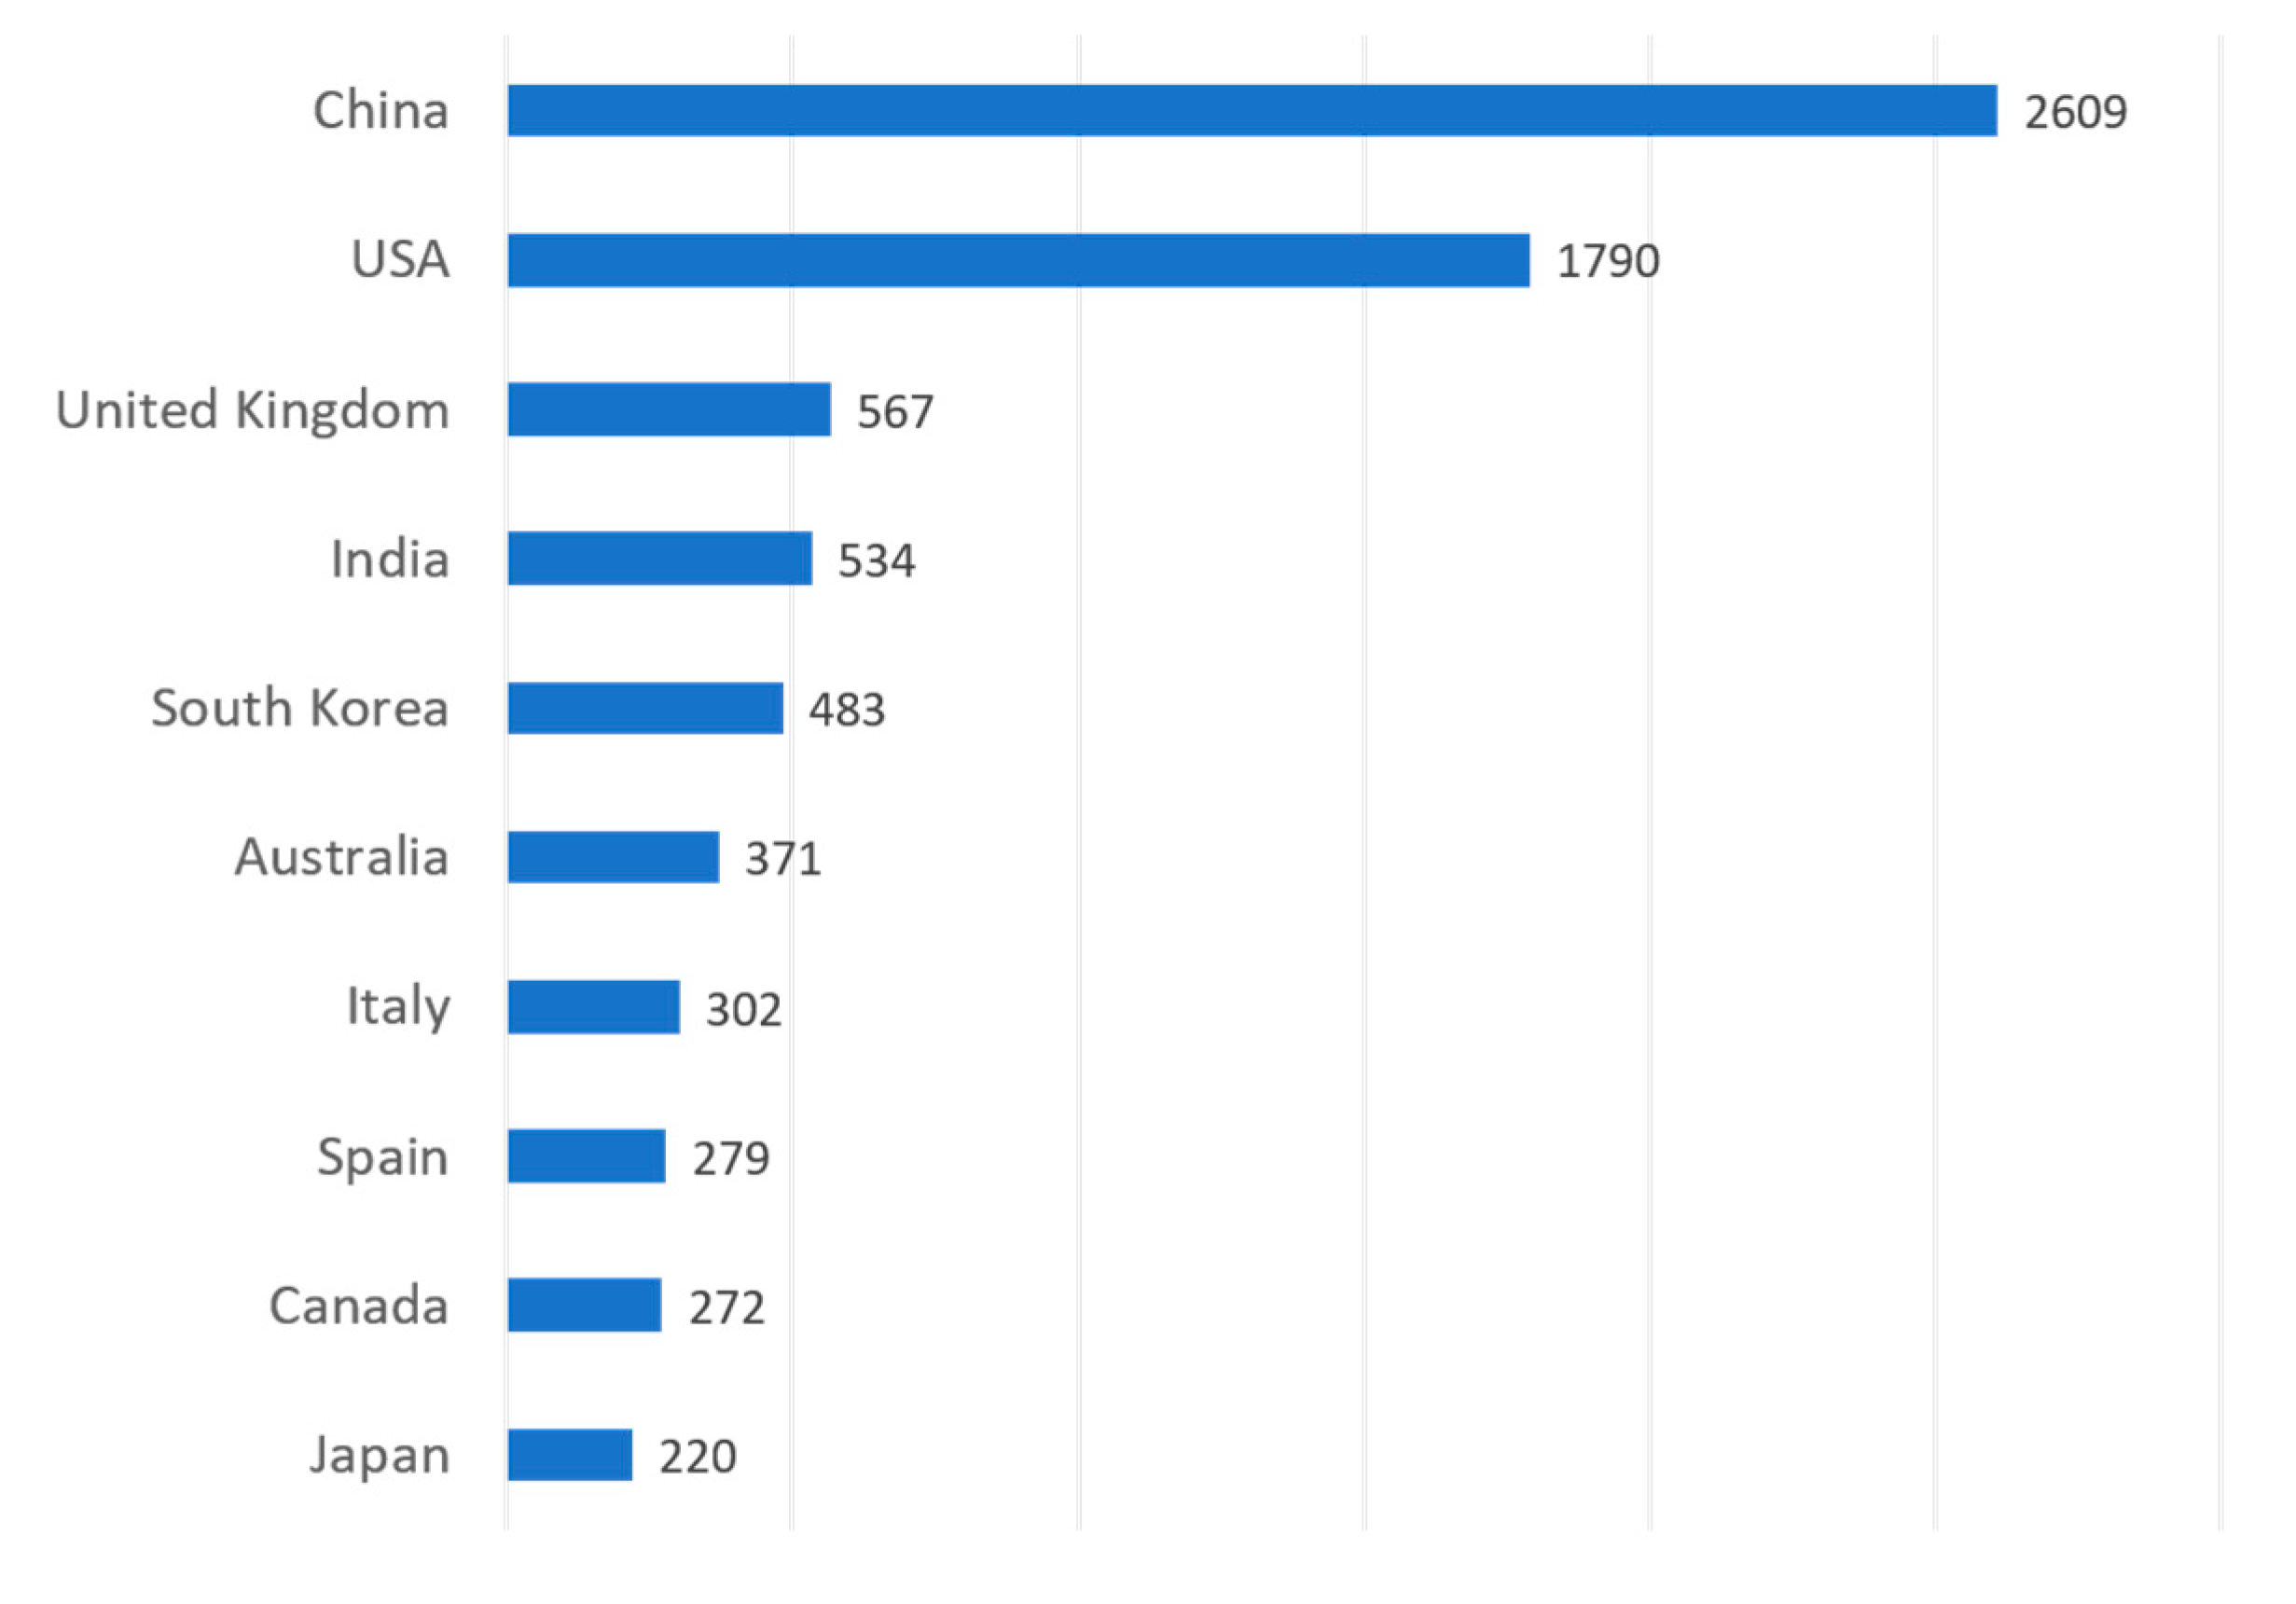
| Country | H-index | Number of Publications (Pub.) | Total Citations (Cit.) | Cit./ Pub. | 2009–2015 | 2016 | 2017 | 2018 |
|---|---|---|---|---|---|---|---|---|
| China | 83 | 2609 | 21507 | 8.24 | 428 | 536 | 790 | 855 |
| USA | 88 | 1790 | 27171 | 15.18 | 530 | 369 | 395 | 496 |
| United Kingdom | 54 | 567 | 7386 | 13.03 | 123 | 127 | 133 | 184 |
| India | 33 | 534 | 1642 | 3.07 | 102 | 103 | 110 | 219 |
| South Korea | 32 | 483 | 3212 | 6.65 | 102 | 118 | 112 | 151 |
| Australia | 51 | 371 | 5607 | 15.11 | 88 | 68 | 95 | 120 |
| Italy | 31 | 302 | 2453 | 8.12 | 57 | 58 | 75 | 112 |
| Spain | 36 | 279 | 3141 | 11.26 | 55 | 63 | 63 | 98 |
| Canada | 42 | 272 | 4566 | 16.79 | 60 | 61 | 70 | 81 |
| Japan | 24 | 220 | 1150 | 5.23 | 70 | 49 | 40 | 61 |
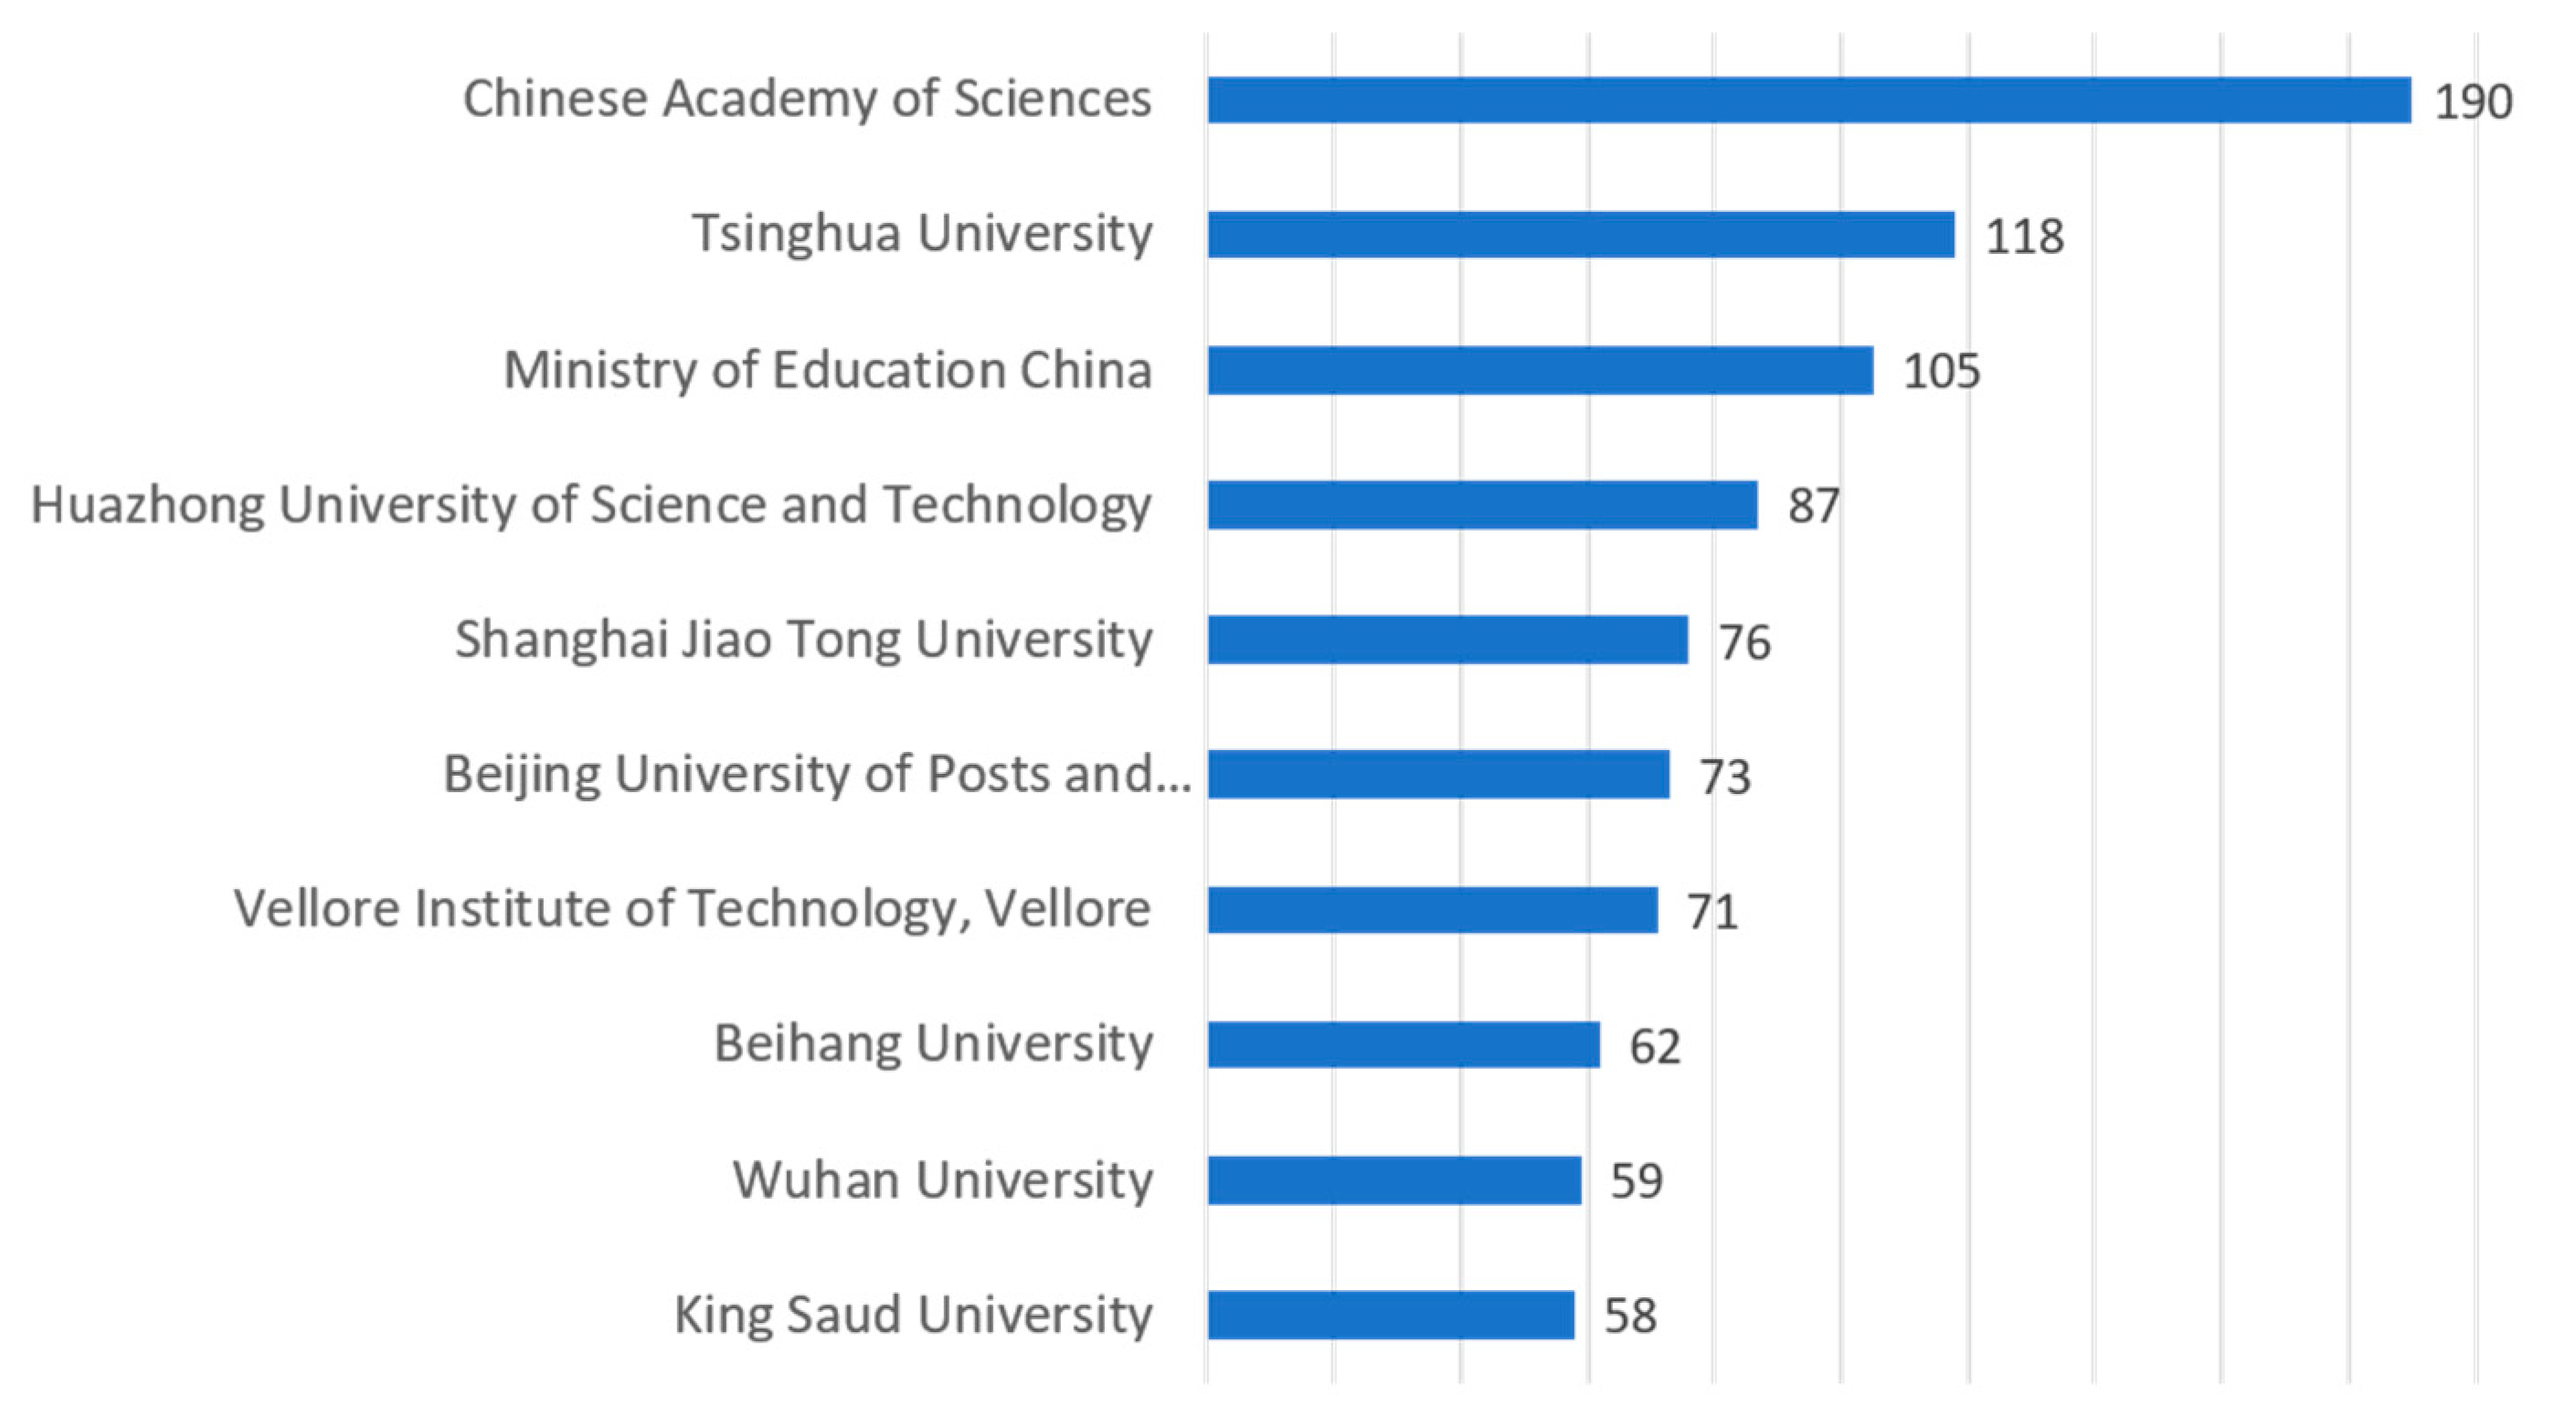
| Institution | Country | H-index | Pub. | Cit. | Cit./Pub. | 2009–2015 | 2016 | 2017 | 2018 |
|---|---|---|---|---|---|---|---|---|---|
| Chinese Academy of Sciences | China | 31 | 190 | 2511 | 13.22 | 51 | 38 | 46 | 55 |
| Tsinghua University | China | 27 | 118 | 1667 | 14.13 | 35 | 29 | 24 | 30 |
| Ministry of Education China | China | 21 | 105 | 912 | 8.69 | 12 | 21 | 26 | 46 |
| Huazhong University of Science and Technology | China | 23 | 87 | 1161 | 13.34 | 13 | 19 | 21 | 34 |
| Shanghai Jiao Tong University | China | 19 | 76 | 722 | 9.50 | 10 | 18 | 27 | 21 |
| Beijing University of Posts and Telecommunications | China | 15 | 73 | 654 | 8.96 | 4 | 22 | 24 | 23 |
| Vellore Institute of Technology, Vellore | India | 15 | 71 | 288 | 4.06 | 8 | 21 | 11 | 31 |
| Beihang University | China | 19 | 62 | 739 | 11.92 | 7 | 13 | 20 | 22 |
| Wuhan University | China | 15 | 59 | 424 | 7.19 | 8 | 14 | 11 | 26 |
| King Saud University | Saudi Arabia | 21 | 58 | 870 | 15.00 | 1 | 10 | 18 | 29 |
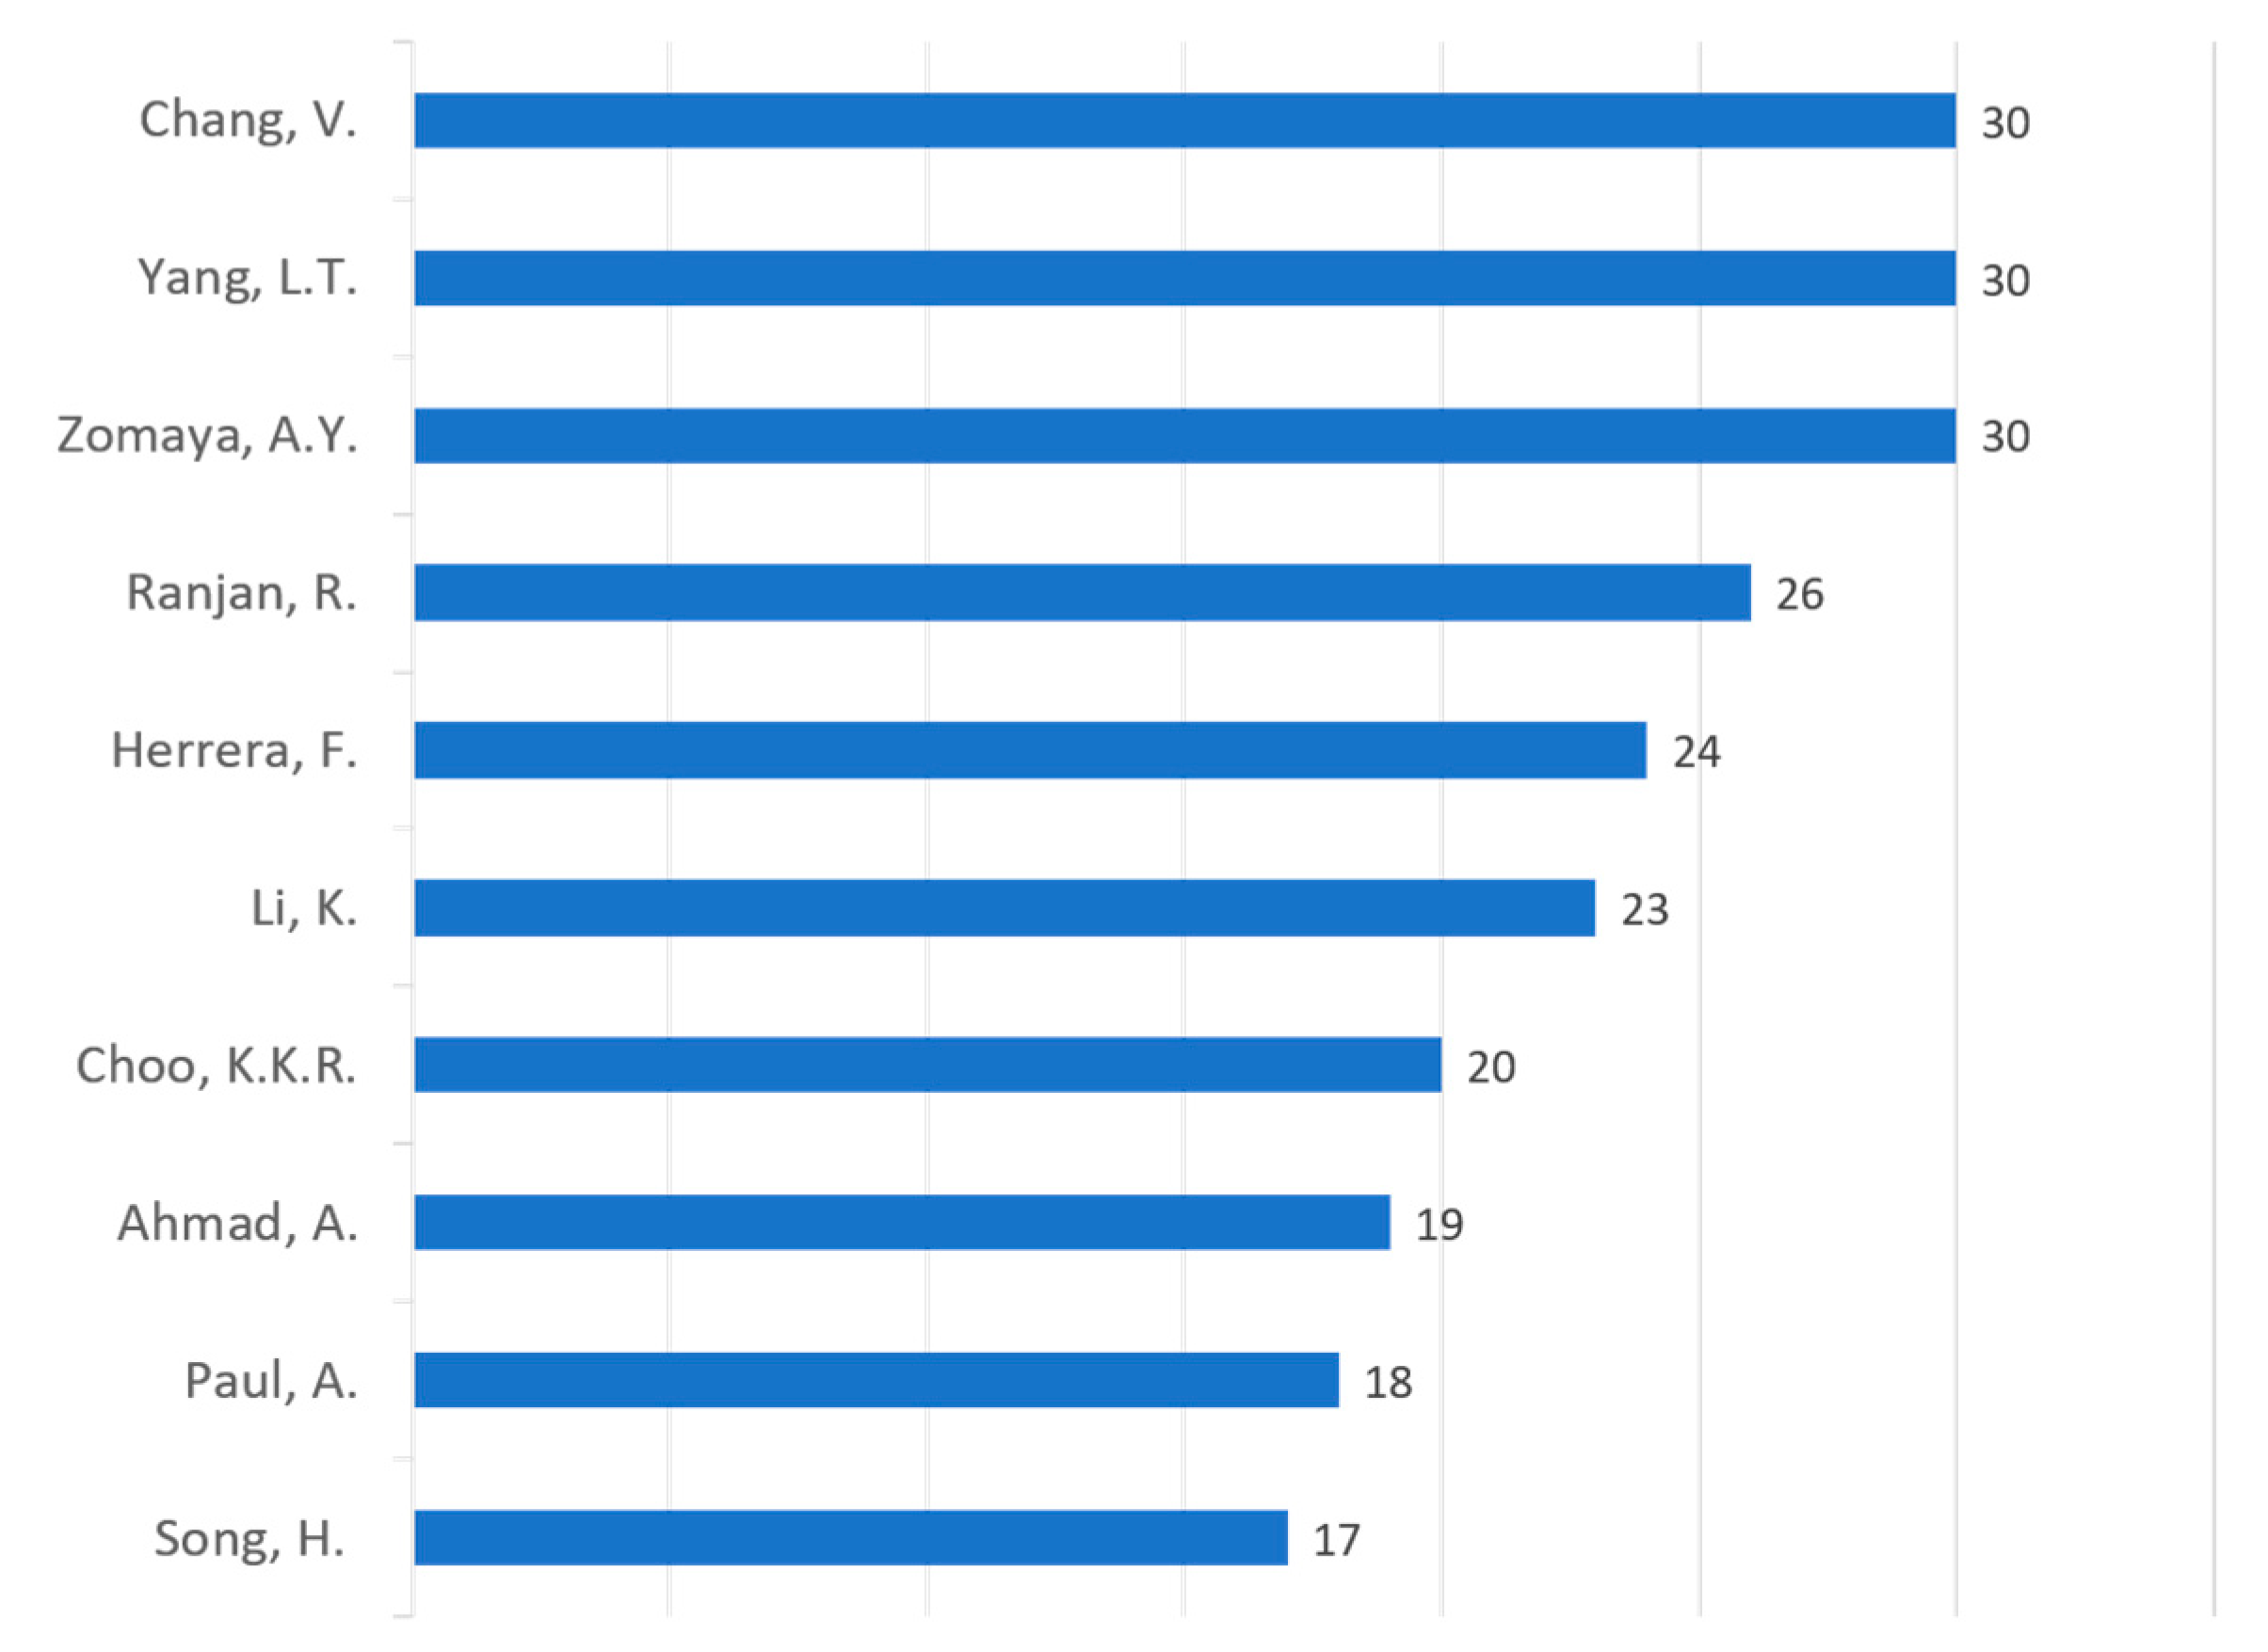
| 2009–2015 | 2016 | 2017 | 2018 | Total | |||||||
|---|---|---|---|---|---|---|---|---|---|---|---|
| Author | Pub. | Cit. | Pub. | Cit. | Pub. | Cit. | Pub. | Cit. | Pub. | Cit. | Cit./Pub. |
| Chang, V. | 1 | 73 | 7 | 604 | 7 | 109 | 15 | 255 | 30 | 1041 | 34.7 |
| Yang, L.T. | 4 | 195 | 7 | 220 | 7 | 154 | 12 | 228 | 30 | 797 | 26.6 |
| Zomaya, A.Y. | 9 | 608 | 6 | 130 | 8 | 107 | 7 | 101 | 30 | 946 | 31.5 |
| Ranjan, R. | 12 | 696 | 2 | 34 | 5 | 95 | 7 | 82 | 26 | 907 | 34.8 |
| Herrera, F. | 8 | 801 | 2 | 99 | 7 | 170 | 7 | 129 | 24 | 1199 | 49.9 |
| Li, K. | 8 | 250 | 3 | 28 | 5 | 165 | 7 | 75 | 23 | 518 | 22.5 |
| Choo, K.K.R. | 1 | 60 | 3 | 71 | 8 | 215 | 8 | 63 | 20 | 409 | 20.4 |
| Ahmad, A. | 0 | 0 | 6 | 412 | 4 | 55 | 9 | 63 | 19 | 530 | 27.8 |
| Paul, A. | 0 | 0 | 6 | 412 | 4 | 55 | 8 | 81 | 18 | 548 | 30.4 |
| Song, H. | 1 | 35 | 7 | 380 | 4 | 154 | 5 | 76 | 17 | 645 | 37.9 |
| No. | Title | Authors | Year | Cited by | Refs. |
|---|---|---|---|---|---|
| 1. | Internet of Things: A Survey on Enabling Technologies, Protocols, and Applications | Al-Fuqaha A. et al. | 2015 | 2072 | [47] |
| 2. | Business intelligence and analytics: From big data to big impact | Chen H. et al. | 2012 | 2058 | [48] |
| 3. | Data mining with big data | Wu X. et al. | 2014 | 1253 | [49] |
| 4. | Data-intensive applications, challenges, techniques, and technologies: A survey on Big Data | Philip Chen C.L. and Zhang C.-Y. | 2014 | 1202 | [50] |
| 5. | Beyond the hype: Big data concepts, methods, and analytics | Gandomi A. and Haider M. | 2015 | 993 | [51] |
| 6. | Traffic Flow Prediction with Big Data: A Deep Learning Approach | Lv Y. et al. | 2015 | 738 | [52] |
| 7. | The internet of things for health care: A comprehensive survey | Islam S.M.R. et al. | 2015 | 693 | [53] |
| 8. | Scalable nearest neighbour algorithms for high dimensional data | Muja M. and Lowe D.G. | 2014 | 606 | [54] |
| 9. | Big Data, new epistemologies and paradigm shifts | Kitchin R. | 2014 | 515 | [55] |
| 10. | Toward scalable systems for big data analytics: A technology tutorial | Hu H. et al. | 2014 | 475 | [7] |
| Period | Total Key-Terms | Number of Key-Terms Classified | Percentage |
|---|---|---|---|
| 2009–2018 | 9456 | 7086 | 74.94% |
| 2009–2015 | 1969 | 1612 | 81.87% |
| 2016 | 2045 | 1699 | 83.08% |
| 2017 | 2480 | 2032 | 81.94% |
| 2018 | 3064 | 2472 | 80.68% |
| Title and Reference | Objectives | Comments |
|---|---|---|
| Topic analysis and forecasting for science, technology and innovation: Methodology with a case study focusing on big data research [23] | To propose an analytic method for clustering associated terms and phrases to constitute meaningful technological topics and their interactions and identifying changing topical emphases. | The proposed method focuses on technology road mining (TRM). The results of the study are the identification of TRM components and TRM models that visualize objective results and qualitative discussions based on expert knowledge. |
| The major research themes of big data literature: From 2001 to 2016 [21] | To identify the major research themes in big data literature. | This paper clusters big data literature using the edge-betweenness clustering technique applied to the citation network. |
| Discovering and forecasting interactions in big data research: A learning-enhanced bibliometric study [22] | To discover interactions in big data research by detecting and visualizing its evolutionary pathways. | This paper integrates a machine learning and a bibliometrics approach to investigate global big data research from 2000 to 2015. The topic is defined based on the scientific evolutionary pathway model. |
| Research trends on big data in marketing: A text mining and topic modeling based literature analysis [26] | To identify the main trends on big data in marketing. | This study focuses on big data in marketing in an attempt to identify the trends in these applied domains using topic modeling methods. It provides a summarized overview of the literature by grouping articles in logical topics characterized by key relevant terms. |
| Theme mapping and bibliometrics analysis of one decade of big data research in the Scopus database [this paper] | To provide a comprehensive overview of big data research trends by integrating traditional bibliometrics and text mining approaches. | This study uses bibliometrics analysis and keyword clustering methods to systematically study and analyze the big data literature in the Scopus databases. Major research themes and future research directions are identified. |
© 2020 by the authors. Licensee MDPI, Basel, Switzerland. This article is an open access article distributed under the terms and conditions of the Creative Commons Attribution (CC BY) license (http://creativecommons.org/licenses/by/4.0/).
Share and Cite
Parlina, A.; Ramli, K.; Murfi, H. Theme Mapping and Bibliometrics Analysis of One Decade of Big Data Research in the Scopus Database. Information 2020, 11, 69. https://doi.org/10.3390/info11020069
Parlina A, Ramli K, Murfi H. Theme Mapping and Bibliometrics Analysis of One Decade of Big Data Research in the Scopus Database. Information. 2020; 11(2):69. https://doi.org/10.3390/info11020069
Chicago/Turabian StyleParlina, Anne, Kalamullah Ramli, and Hendri Murfi. 2020. "Theme Mapping and Bibliometrics Analysis of One Decade of Big Data Research in the Scopus Database" Information 11, no. 2: 69. https://doi.org/10.3390/info11020069
APA StyleParlina, A., Ramli, K., & Murfi, H. (2020). Theme Mapping and Bibliometrics Analysis of One Decade of Big Data Research in the Scopus Database. Information, 11(2), 69. https://doi.org/10.3390/info11020069