Article

Evaluation of Push and Pull Communication Models on a VANET with Virtual Traffic Lights

Algoritmi Center, University of Minho, 4710-057 Braga, Portugal
*
Authors to whom correspondence should be addressed.
Information 2020, 11(11), 510; https://doi.org/10.3390/info11110510
Submission received: 1 October 2020 / Revised: 26 October 2020 / Accepted: 26 October 2020 / Published: 30 October 2020
(This article belongs to the Special Issue Vehicle-To-Everything (V2X) Communication)

Abstract

:
It is expected in a near future that safety applications based on vehicle-to-everything communications will be a common reality in the traffic roads. This technology will contribute to improve the safety of vulnerable road users, for example, with the use of virtual traffic light systems (VTLS) in the intersections. This work implements and evaluates a VTLS conceived to help the pedestrians pass safely the intersections without real traffic lights. The simulated VTLS scenario used two distinct communication paradigms—the pull and push communication models. The pull model was implemented in named data networking (NDN), because NDN uses natively a pull-based communication model, where consumers send requests to pull the contents from the provider. A distinct approach is followed by the push-based model, where consumers subscribe previously the information, and then the producers distribute the available information to those consumers. Comparing the performance of the push and pull models on a VANET with VTLS, it is observed that the push mode presents lower packet loss and generates fewer packets, and consequently occupies less bandwidth, than the pull mode. In fact, for the considered metrics, the VTLS implemented with the pull mode presents no advantage when compared with the push mode.

1. Introduction

Statistics show that pedestrians are more vulnerable to accidents than other road users. Indeed, in European Union, in 2016, 21% of all traffic fatalities were pedestrians [1]. Traffic signals play an important role to improve vulnerable road users (VRU) safety, because red lights stop cars at the intersections so that VRUs (pedestrians, bicyclists) can cross safely. Unfortunately, many intersections have no traffic light systems (TLS). However, there has been a significant increase in the number of connected devices on the public roads with the increase of connected vehicles. The use of vehicle-to-everything (V2X) communications is still expanding and improving, but in the future it will be certainly a common technology in the roads. It is expected that safety applications based on V2X communications will come up, thus contributing particularly to improve the safety of VRUs. Inspired by this near future reality, this work implements and evaluates a virtual traffic light system (VTLS) conceived to help the pedestrians pass safely the intersections without real TLSs. The VTLS is implemented and evaluated using two distinct communication paradigms—the pull and push communication models, as discussed next.
The pull model was implemented with named data networking (NDN) [2], which is a very popular information centric networking architecture. The goal of NDN is to redesign completely the Internet by replacing internet protocol (IP) datagrams with content chunks as a universal component of transport. Neither IP addresses nor port numbers are used in NDN packets. The communications in NDN are driven by the receivers and involve the exchange of interest and data packets. Basically, a consumer sends an interest packet to the network asking for content, and then a data packet carrying the requested content is replied by the provider. This communication model allows the decentralization through in-network caching, making it very appropriate for large-scale environments with highly dynamic topologies, such as VANETs.
Three major data structures are present in the NDN nodes: Content Store (CS), Pending Interest Table (PIT), and Forwarding Information Base (FIB). The CS is a temporary cache of data packets received by the router, and it is used to satisfy the future interests. The PIT stores all interests received by the router that were not still satisfied. The FIB stores information related with forwarding, namely the outgoing faces to forward the interests that match a name prefix. NDN uses natively a pull-based communication model, where consumers send requests to pull the contents from the provider. A distinct communication paradigm is followed by the push-based model. The consumers subscribe previously the information and then the producers distribute (i.e., push) to the consumers the available information, periodically (e.g., monitoring messages) or based on events (e.g., safety warnings).
To help understand the focus of this work, let us consider the following use-case. A pedestrian equipped with a smartphone walks along the sidewalk of a city, where all road intersections have one road-side unit (RSU) to implement a virtual semaphore. To increase the safety of this vulnerable road user (VRU) during the passing of the intersections, the pedestrian’s smartphone communicates with the RSU in order to inform his/her position and the crosswalk that intends to use. After receiving the data from the pedestrian, the RSU sets the state of the virtual traffic light signals and this information is delivered to the vehicles approaching the intersection controlled by the RSU. If the vehicle receives a red light signal from the RSU, then it must stop at the intersection to let the pedestrian pass safely on the crosswalk. If the vehicle receives a green light signal from the RSU, then it must follow the traffic rules to pass the intersection in presence of other vehicles. The RSU interaction with pedestrians and cars can follow the pull or the push communication models, as illustrated in Figure 1. In the push model, the pedestrian P sends the data message D to the RSU S and this sends the virtual traffic light message L to car C. In the pull model, the messages D and L are only sent after being requested by RSU S (through message I) and car C (through message J), respectively.
The pull-based communication model offers some advantages when compared to the push model, namely in terms of bandwidth control and number of data requests. Indeed, the pull model is able to regulate better the communications. For example, in a group of RSUs close enough to each other, interests may be sent out of phase by the RSUs to guarantee that at any time only one RSU is sending an interest in that communication domain. This traffic distribution helps to achieve a better use of the channel bandwidth, which in turn helps to decrease packet collisions. Moreover, an RSU is able to ask for specific information from data providers, such as pedestrians. However, as pedestrians can only send data after receiving an interest from the RSU, this imposes some synchronicity in the transmissions of the pedestrians, which can originate a significant content for the wireless channel if there are a great number of pedestrians near the RSU. This problem may be less relevant in the push model, because transmissions are asynchronous. The pull model also has the disadvantage of requiring a more complex communication model, which may impact the data delivery delay and the reliability of the system. Indeed, the pull model is more suitable for data without strict timeliness constraints, because a request for the data must be received by the provider before being transmitted. Moreover, the pull mode requires the double of the messages for pedestrians sending the information to the RSU and also for the cars receiving the virtual traffic lights from the RSU. So, if the probability of losing a message in the wireless channel is p (for simplicity, all messages have the same size), then the success probability for a pedestrian sending the information to the RSU or for the cars receiving the traffic lights from the RSU is (1−p) in the push mode, and (1−p)2 in the pull mode. So, the mentioned success probability is (1−p) times lower in pull mode than in push mode.
It is expectable that the pull mode be outperformed by the push mode in the implementation of the VTLS scenario presented in the use-case. However, it is not clear how worst is the performance of the pull mode when compared to the push mode, or if such performance degradation would prevent the usage of the pull mode to implement a VTLS. The goal of this work is to clarify these issues, by comparing the performance of the push and pull models on a VANET with virtual traffic lights placed on the road intersections to improve the pedestrians’ safety. The implemented VTLS only tries to protect the pedestrians from the vehicles, and not the vehicles from other vehicles.

2. Related Works

Diverse studies and projects have been developed using vehicle-to-pedestrian communications for safety of VRUs [3], including vehicular NDNs [4]. However, to the best of our knowledge, only the work indicated in [5] presents a VTLS application for VANETs over NDN. Instead of installing traffic lights at every intersection, it is used a RSU in each intersection acting as traffic controller. The RSU collects the information of vehicles that have arrived or are going to arrive at the intersection, processes the information, and then sends a message for every vehicle to pass the intersection or stop. A geolocation-based forwarding strategy is used to disseminate packets. The authors claim that this was the first design of a smart traffic light system in a vehicular NDN. Nevertheless, the presence of VRUs is not considered in the simulation scenario.
There are other works that addressed the use of virtual traffic lights in VANETs or intersection signal decision-making algorithms. Originally proposed by Ferreira et al. [6], VTLSs were studied in posterior works, such as [6,7,8]. However, these works do not use NDN and do not take in consideration the presence of pedestrians. For example, in the work presented in [6], the vehicles moving on the same direction form a cluster. The cluster leader is the vehicle that moves farther from the intersection, and is responsible for choosing the priorities and broadcasting the VTL messages to the other vehicles of the cluster. In the paper indicated in [7], each vehicle collects the neighbor information to select a leader. Then, the leader creates and maintains the VTL, and broadcasts the traffic signals to the remaining vehicles of the group. In [8], the vehicles send its own information to the cloud infrastructure, which then informs the vehicles to pass or stop at the intersection. An algorithm is proposed in [9] to define the priorities of the road intersections with VTLS. Vehicles exchange information and then priority is given to the vehicle that first arrives at the intersection or to the priority vehicles. An intersection signal control mechanism is proposed in [10], whereby the RSU at the intersection collects the real-time information of far vehicles. Then, after merging this data with the information of vehicles in the intersection via image acquisition, the waiting times of the traffic flows are predicted for the signal decision-making. The work in [11] proposes an algorithm that assigns vehicles to the group of each lane and calculates traffic volume and congestion degree using the traffic information of each group through inter-vehicle communications, without requiring cameras. In [12], a dynamic traffic regulation method is proposed, where the driver’s willingness is taken into account, using a distributed collective decision mechanism to control the virtual traffic light.
In order to benefit from the one-way delay offered by the push-based models, a few works have investigated push-based content retrieval solutions for NDNs [13,14], including the use of long-lived interests [15]. These special interests allow producers to send multiple data packets for a certain time period, without requiring additional interests, thus reducing the PIT size and the network traffic. Moreover, the work presented in [16] proposes a mechanism for push-based data dissemination for vehicular NDNs, in which a producer node can inject content without preceding interest packets, thus reducing both the content forwarding and caching delay. The push mode is also recommended by ETSI to implement a use-case involving traffic lights [17], where VRUs and vehicles broadcast continuously messages at a certain frequency to the RSU. This unit analyzes the crossing status and then transmits the information to the nearby vehicles to let the VRUs pass safely the crosswalk.

3. Pull-Based Virtual Semaphore

This section presents the implementation of the use-case, described previously, using the pull-based model. As NDN integrates natively a pull-based model, the pull-based virtual semaphore is implemented in NDN. In the proposed VTLS, the consumer can be static (RSU) and dynamic (vehicles), and the producer can be static (RSU) and dynamic (pedestrians). All exchanges of messages with the RSU are done using direct line of sight communications, as the RSU is assumed to be in a strategic position at the intersection, so that all nearby pedestrians and cars can reach it in one-hop. The role of the pedestrians, vehicles, and RSU in the VTLS will be discussed in the next sections.

3.1. Pedestrians and RSU

The RSU broadcasts periodically an interest to know all pedestrians that are less than a certain distance to it. The interest name has the following format: /vtlsId/VRU, where /vtlsId/ is the identification of the domain name of the virtual traffic light system, and “VRU” is the content’s directory path. The nonce, the hop limit, the distance range, and the GPS coordinates (or any other form of unique identification) of the RSU are also sent within the interest packet. The range and the GPS coordinates of the RSU are application parameters used to parameterize the data request. These two parameters are sent in the “application parameters” field of the interest packet, and are only used for the pedestrians to know whether the received interest should be ignored or not. The other parameters are sent respectively in the “nonce” and “hop limit” fields of the interest packet [18]. The hop limit is set to one, for the pedestrians do not forward any received interest. An interest packet is uniquely identified by the name and the nonce. The nonce is a random number generated by the consumer application and is used to detect duplicate packets.
After receiving an interest from the RSU, the minimum distance to the RSU is calculated by the pedestrian. If this distance is above the announced range, then the received interest is ignored by the pedestrian. Only the pedestrians inside the range and approaching or leaving the intersection controlled by the RSU reply to the interest, sending a data packet with the same name of the interest, along with the following information: the pedestrian identification, the GPS coordinates of the pedestrian, the crossroad heading, and the next sidewalk GPS coordinates. The GPS coordinates, the crossroad heading, and the next sidewalk GPS coordinates of the pedestrian are a tuple that is obtained from the content store (CS) of the pedestrian, which is updated regularly by the NDN daemon running in the smartphone. The “next sidewalk GPS coordinates” identifies the sidewalk that the pedestrian intends to take after passing the intersection. This identification is done through the GPS coordinate of a point of the next sidewalk. The “crossroad heading” is the direction that the pedestrian will take after reaching the intersection, and it can assume the following values: go straight, turn left, and turn right. When the pedestrian is moving to the intersection, he/she can indicate the planned crossroad heading using, for example, a specific smartphone application. As the pedestrians are configured for not caching the content of any other node, the pedestrian’s CS only holds the own pedestrian’s content. If the reply of a pedestrian is lost because of a communication problem in the wireless channel, a more updated data packet can be sent in response to the next interest broadcast by the RSU.
Whenever a data packet is received from a pedestrian, the RSU saves the information contained in the data packet in the internal database. So, one interest broadcast by the RSU may generate multiple entries in this internal database—one entry for each distinct reply received from a pedestrian that is inside the RSU announced range. Afterwards, the RSU invokes an internal application, named traffic management controller (TMC), which calculates the light signal associated to each crosswalk and for all possible vehicle directions, taking in consideration the pedestrian registers in the internal database. Then, the RSU caches the traffic light signals returned by the TMC in the CS. The entries of the CS are updated whenever the internal database of the RSU is changed, for example, when the RSU receives a data packet from a pedestrian. Once a pedestrian has crossed the intersection and starts moving away from it, the RSU is able to know this situation from the data packet received from the pedestrian and, consequently, the RSU deletes the register in the internal database associated to that pedestrian. The register of a pedestrian is also deleted if no reply is received from that pedestrian during a predefined time interval. When the internal database of the RSU becomes empty, the TMC sets green light to all crosswalks and directions, and the CS is updated accordingly.

3.2. Vehicles and RSU

When a vehicle approaches an intersection, it sends periodically an interest to the RSU requesting the respective virtual traffic light signal of that intersection. The interest name has the following format: /vtlsId/RSU/roadId1/roadId2, where /vtlsId/ is the identification of the domain name of the VTLS, and “RSU/roadId1/roadId2” is the content’s directory path. The component roadId1 identifies the road where the vehicle is located and roadId2 identifies the road that the vehicle intends to take after passing the intersection. This information can be obtained, for example, from the GPS track, if the destination was defined by the driver at the beginning of the travel, or from the turn signal. If the car is unable to determine roadId2, it sends the interest name “RSU/roadId1/*”, and the RSU replies with the traffic lights of all crosswalks. The nonce and the hop limit are also sent within the interest packet. The hop limit is set to one for the vehicles not forwarding any received interest. The RSU that should reply to the interest can be decided from the components roadId1 and roadId2.
After receiving an interest from a vehicle, the RSU gets the virtual traffic light from the CS, which has one entry for each possible direction a car may follow in the intersection. For example, if an intersection has four crosswalks, as shown in Figure 2, there are three possible directions that a car may take after reaching a crosswalk (left, right, ahead), and so the CS of the RSU contains 4 × 3 = 12 entries. After receiving the traffic light signal from the CS, the RSU replies to the vehicle with a data packet, having the same name of the interest and carrying the traffic light signal in the content. The virtual traffic light signal is zero for green light signal, and one for red light signal (for sake of simplicity, the yellow light signal is not considered in this work). Since the location of the moving pedestrians near the intersection is always changing, the vehicle sends periodically an interest to the RSU in order to update the information of the traffic light signal, as the vehicle approaches the intersection.
After receiving a data packet with the same name of the interest sent to the RSU, the vehicle stores the new traffic light signal in the CS and deletes the traffic light signal of the data packet received previously. This information will be used by the vehicle in the intersection to let the nearby pedestrians pass safely. The interests received from the vehicles and the data packets sent by the RSU are ignored by the pedestrians. Also, the data packets received from the pedestrians are ignored by the vehicles.
As each vehicle receives its own traffic light signal, two vehicles in the same road may receive different traffic light signals, depending on their crossroad headings. The crossroad heading is the direction that the vehicle will take after reaching the intersection (go straight, turn left, turn right), and it may deduce from the components roadId1 and roadId2. In the example of Figure 2, vehicles A and B are both moving straight ahead and receive a green light signal from the RSU, because their routes do not intersect the trajectory of the pedestrian P. However, vehicle C receives a red light signal, because it intends to turn left and this maneuver will intersect the pedestrian in the inferior horizontal crosswalk.
To understand better the meaning and the importance of the crossroad heading, let us consider the example of Figure 3. If the pedestrian P wants to reach the sidewalk S, it can do it by taking the two crosswalks marked by (i) the continuous line; or (ii) by the dashed line. In the first case, the crossroad heading is “turn right,” and in the second case, the crossroad heading is “go straight.” As each case may imply distinct traffic light signals for the vehicles, then the crossroad heading is an important parameter to be taken in consideration by the TMC. For example, if the pedestrian P choose to follow the continuous line path, then cars A, B, and C receive red light signals, because the trajectory of the three cars intersect the pedestrian’s trajectory. However, if the pedestrian P chooses to follow the dashed line path, then all cars may receive green light signals while the pedestrian walks through the superior horizontal crosswalk. However, when the pedestrian reaches the left vertical crosswalk and if cars A, B, and C have not yet crossed the intersection, then cars A and B receive red light signal and car C receives green light, because this car, unlike A and B, does not intersect the pedestrian’s trajectory.
Unlike the traditional NDN behavior, the moving nodes (pedestrians, cars) of the scenario with the NDN-based semaphore system do not save the unsatisfied interests in the PIT, neither cache the data of other nodes in the CS, because there is no relevant advantage in doing so. In fact, as the node only sends a packet when is close to the RSU, the data packet can reach the RSU directly, in one-hop. Moreover, as the moving nodes have only one face to receive and transmit packets, there is no role for the FIB. Indeed, the packets are usually flooded in the NDN-enabled VANETs [19,20,21].

3.3. Flowcharts

The flowcharts of the algorithms used by the RSU, pedestrians and vehicles in the pull-based scenario are presented next. The algorithms are shown in a simplified way, illustrating only the basic actions.

3.3.1. Flowchart of RSUs

Figure 4 shows the algorithm used by the RSUs in pull mode. After starting up, the RSU sends periodic interests (I pkt) to the nearby pedestrians. When a data packet (D pkt) is received from a pedestrian, the location conditions are checked. If these conditions are valid, then the RSU saves in the internal database the content, namely the identification, current sidewalk, next sidewalk, and the crossroad heading of the pedestrian. Then, the TMC is called to define the traffic light signals. By analyzing the information contained in the database, the TMC decides the traffic light signals for all routes a car may take after getting the intersection, and saves this information in the CS. After receiving an interest packet from a vehicle that is going to the intersection, the RSU broadcasts a data packet containing the respective traffic light signal.

3.3.2. Flowchart of Pedestrians and Vehicles

Figure 5 shows the algorithms used by pedestrians and vehicles in pull mode.
Pedestrian: After starting up the VTLS application, the pedestrian’s smartphone waits for external communication messages. If an interest is received from the RSU controlling the intersection that the pedestrian is going to, and if the pedestrian is at a distance to this RSU lower than the range value announced in the interest, then the pedestrian sends to the RSU a data packet containing the identification, current sidewalk, next sidewalk, and crossroad heading of the pedestrian. Otherwise, the received message is ignored by the pedestrian.
Vehicle: When the vehicle is at a distance to the RSU lower than a pre-defined value, the vehicle sends periodically an interest to this RSU. When a data packet is received from this RSU, the vehicle saves in the CS the received traffic light signal. When the vehicle gets close to the intersection, it checks the last saved traffic light signal. If this signal is red, then the vehicle must stop at the intersection, because there is a pedestrian near or on the crosswalk that intersects the vehicle trajectory. If it is green, then there is no pedestrian near or on the crosswalk that intersects the vehicle trajectory. In this case, the vehicle should pass the intersection considering only the presence of other vehicles in the intersection. Recall that the virtual semaphore only tries to protect the pedestrians from the vehicles, and not the vehicles from other vehicles.

4. Push-Based Virtual Semaphore

This section presents the implementation of the virtual semaphore using the push-based communication model.

4.1. Pedestrians and RSU

When a pedestrian, walking to an intersection, is less than a certain distance to the RSU installed at that intersection, the pedestrian’s smartphone sends (pushes) periodically a message to this RSU. Only the pedestrians inside the range and moving toward or just leaving the intersection controlled by the RSU are allowed to send messages. The message sent by the pedestrian contains the following information: application identification, “VRU”, pedestrian identification, current sidewalk of the pedestrian, next sidewalk of the pedestrian, and crossroad heading. “VRU” is a reserved string, which is used to inform the receiver that the message was sent by a pedestrian. The remaining parameters were already discussed in the pull-based mode.

4.2. Vehicles and RSU

The RSU caches the data received from the nearby pedestrians. The RSU periodically calls the TMC, which decides the virtual traffic lights signals of the intersection. There is one traffic light signal for each crosswalk of the intersection controlled by the RSU. Whenever there is at least one person on a crosswalk or a person close to a crosswalk that he/she intends to pass, the TMC sets a red signal for that crosswalk. The RSU broadcasts periodically a message containing the set of traffic lights of the intersection, along with the identification of the RSU. The set of traffic lights contains one signal for each crossroad of the intersection, as defined by the TMC. For example, in the case of Figure 2, the RSU transmits a message containing one red light for the inferior horizontal crosswalk, and three green lights for the remaining crosswalks. This set of traffic light signals can be represented, in binary, as 1000. The RSU has no information about the nearby vehicles, because the vehicles do not send any data to it. Consequently, the RSU is not able to define the traffic light signal for a specific vehicle, as it does in the pull-based system.
After receiving the traffic light signals from the RSU, the car determines if its route intersects a crosswalk with red light. If true, then the car stops at the intersection to let pass the pedestrians near or on those crosswalks. Otherwise, the car driver must follow the traffic rules to pass the intersection in presence of other vehicles. Recall that the VTLS implemented in this work was only directed to improve the pedestrians’ safety.
If the car does not receive any reply from the RSU after sending a certain number of interests, the OBU issues an alert informing the driver about the unresponsiveness or inexistence of the RSU at the intersection. In this case, the driver should take full control of the situation.

4.3. Flowcharts

The algorithms run by the RSU, pedestrians and vehicles in the push-based scenario are presented next. The algorithms are shown in a simplified way, illustrating only the basic actions.

4.3.1. Flowchart of RSUs

Figure 6 shows the algorithm used by the RSUs in push mode. When a packet is received from a pedestrian, the location conditions are checked and if these are valid, then the RSU saves the pedestrian information (identification, current sidewalk, next sidewalk, crossroad heading) in the internal database. Afterwards, the TMC is called to determine the traffic light signals, based on the cached information. Then, the RSU broadcasts periodically the updated traffic light signals to the vehicles.

4.3.2. Flowchart of Pedestrians and Vehicles

Figure 7 shows the simplified algorithms used by pedestrians and vehicles in push mode.
Pedestrian: After starting up the smartphone application, when the pedestrian is at a distance to the RSU of the intersection lower than a pre-defined value, then the smartphone sends periodically a message to the RSU, containing the identification, current sidewalk, next sidewalk, and crossroad heading of the pedestrian.
Vehicle: After starting up the VTLS application, the OBU of the vehicle listens for external communication messages. Whenever it receives a message from the RSU of the intersection that the vehicle is rolling to, and if the vehicle is at a distance to this RSU lower than a pre-defined value, then the vehicle gets the set of traffic light signals contained in the received message and save it in the internal cache. The vehicle determines if its route intersects a crosswalk with red light. If true, then the vehicle stops at the intersection to let pass the pedestrians on those crosswalks. If false, the car driver must follow the traffic rules to negotiate the intersection in presence of other vehicles.

5. VTLS Simulation Scenario and Results

To evaluate the VTLS using the pull, and the push-based modes, a set of simulations were carried out on a grid road map with seven horizontal roads and seven vertical roads. The simulation setup is presented in more detail next. Then, the results obtained in the simulations are shown and discussed.

5.1. Simulation Setup

The simulation setup regarding the used simulator, the road map configuration, the wireless communications, the VTLS implementation, the simulation parameters, and the simulation runs are presented in the following.
Simulator: It was used the simulator Veins-5.0, modified to allow pedestrian’s communications. Veins is a vehicular network simulation framework that couples the mobility simulator SUMO-0.32.0 with a wireless network simulator built on the discrete event simulator OMNeT++. Veins has a manager module to synchronize the mobility of the vehicles between the wireless network simulator and SUMO (simulation of urban mobility).
Road map: The simulation was carried on a grid road map with a size of 7 × 7. The length of each road is around 200 m and each road connected to an intersection has a crossroad at that intersection, as shown in Figure 8. The routes of the cars were generated with the SUMO traffic generator (randomTrips.py). This tool was configured to generate a car every 1.0 s to run a minimum trip distance of 2000 m with a maximum speed of 10.0 m/s. The pedestrians walk a maximum distance of 2000 m with a speed between 1.1 and 1.4 m/s. Cars and pedestrians leave the simulation after completing theirs trips.
Communications: The vehicles and pedestrians used the same communication parameters. All vehicles owned an OBU running WSMP over IEEE 802.11p. All pedestrians used a smartphone also provided with WSMP over IEEE 802.11p. The transmission power was 20 mW, which corresponds to a signal range of around 530 m. The total length of the MAC frames containing the messages was 166 bytes. The transmission bit rate was 6 Mbps, as this value has been generally assumed as the default channel bit rate. No channel switching was used. The simple path loss propagation model was used, and no buildings were considered in the simulation scenario.
Virtual semaphores: Simulations were carried out with twenty-five virtual semaphores, each one placed at the center of the intersection with four roads. For simplicity, the yellow light was not implemented in the semaphores.
Parameters: The values of the parameters used in the simulations are shown in Table 1. The name of the parameter makes clear its meaning, except the parameters ndn_*, wsm_*, person_*, which are explained in the following.
In the pull mode (NDN), when a car is at a distance to the road end lower than the value specified in ndn_car_dst_to_road_end, it starts sending interests to the RSU with a periodicity of ndn_car_interest_mesg_period seconds. The RSU sends interests to the pedestrians with a periodicity of ndn_rsu_interest_mesg_period seconds. Only the pedestrians at a distance to the road end lower than person_dst_to_road_end or at a distance from the road beginning lower than person_dst_from_road_start reply to the interests. In this way, the RSU is able to know the pedestrians that are approaching the intersection and those that have crossed the intersection and are leaving it. In the push mode, when a pedestrian is at a distance to the road end lower than person_dst_to_road_end, the smartphone of the pedestrian starts sending interests to the RSU with a periodicity of wsm_person_mesg_period seconds. The RSU announces the state of the traffic lights to the cars with a periodicity of wsm_rsu_beacon_tx_period seconds.
So, according to the parameters defined in Table 1, in the push mode, the pedestrians send a message to the RSU every 500 ms, when they are at a distance lower than 4 m to the crosswalk of the intersection. The RSU broadcasts to the nearby cars a message with the traffic light signals every 200 ms. In the pull mode (NDN), each RSU broadcasts an interest to the pedestrians every 500 ms. The pedestrian replies to the received interest when it is positioned at a distance lower than 4 m to the crosswalk of the intersection. Whenever a car is at a distance lower than 18 m to the crosswalk of the intersection, it sends an interest to the RSU every 500 ms asking for the traffic light signals.
Simulation runs. The simulations were ran during 500 s for each one of the three tested modes—notls, push, and pull, where notls (no TLS) means the absence of virtual traffic light signals, push refers to the push-based mode, and pull to the push-based mode (implemented by NDN). Six distinct ratios R of “number of pedestrian/number of cars” were considered: 2.5, 2.0, 1.5, 1.0, 0.5, and 0.25. For example, a ratio of 2.5 means that the number of pedestrians walking in the sidewalks is 2.5 times higher than the number of cars rolling in the map roads. The ratio R becomes relatively stable after a certain time (~150 s). The results were collected during this stabilized period, which is between 150 s and 500 s. In all simulations, a car enters in the simulation every 1.0 s. In order to obtain the specified ratios, the pedestrian generation period was respectively 0.26, 0.33, 0.44, 0.66, 1.32, and 2.64 s. For example, the generation pedestrian period of 0.26 means that a pedestrian enters in the simulation every 0.26 s. The pedestrian generation period (T) is related to the ratio (R) approximately by the equation: T = 0.66/R.
Eighteen (3 × 6) simulation runs were ran to build one set of results. The trips of cars and pedestrians were chosen randomly at the beginning of each set of simulations. However, the trips taken by the pedestrians and the cars do not change for each set of test modes (notls, push, pull) run in the simulation at a certain ratio R.
Simulations were run first without using the VTLS, i.e., it only used the native SUMO strategy to let pass pedestrians on the crosswalks, which have always priority over the cars in the crosswalks. This simulation sets a priori the optimal situation for the cars, in terms of lowest waiting time, to let the pedestrians pass in the intersections. Then, simulations were run using the push and the pull-based modes with the same traffic, and pedestrian mobility traces used in the run without VTLS. The simulations using the push and the pull-based modes were run with the native SUMO strategy turned off. In this way, the traffic at the intersections is only controlled by the VTLS in order to let the pedestrian pass safely in the crosswalks.
The results shown next represent the average values obtained after running 35 sets of simulations, where each set includes the notls, push, and pull test modes. So, these 35 sets of simulations corresponds to 35 × (3 × 6) individual simulation runs, and 35 × 6 distinct pedestrians, and cars trips.

5.2. Results

This section presents the results obtained for the following metrics: traffic queue size, car trip distance, car stop time, and communication metrics: sent packets, and packet loss. The traffic queue size is the number of cars queued per road at the intersections. The car trip distance is the distance ran by all cars, i.e., the summation of the individual car trip distances, in kilometers. The car stop time is the total stopped time of all cars, i.e., the summation of the individual car stopped times, in minutes. The communication metrics are explained later.
Excepting the communication metrics, only the results obtained for the cars are presented next. The pedestrians were not considered in the results, because the virtual semaphores do not control the pedestrians. In the graphics presented next, pull is synonymous of pull-based mode, push means push-based mode, and notls denotes that no virtual semaphores were used. The ratio R is defined as: R = number of pedestrians/number of cars. Recall that the notls mode was used only as reference, because it indicates a priori the optimal performance regarding the mobility of the cars.
To have an idea of the number of pedestrians crossing the intersections, Figure 9 shows, for different ratios R, the maximum, average, and minimum number of persons that crossed the twenty-five intersections with RSUs during a simulation run of five hundred seconds. As in the simulation scenario the cars always give way to the pedestrians on the crosswalks (i.e., a pedestrian never stops at a crosswalk to give way to a car), the graphics are the same for notls, push, and pull test modes, because the same mobility trace of pedestrians is used in these three test modes.

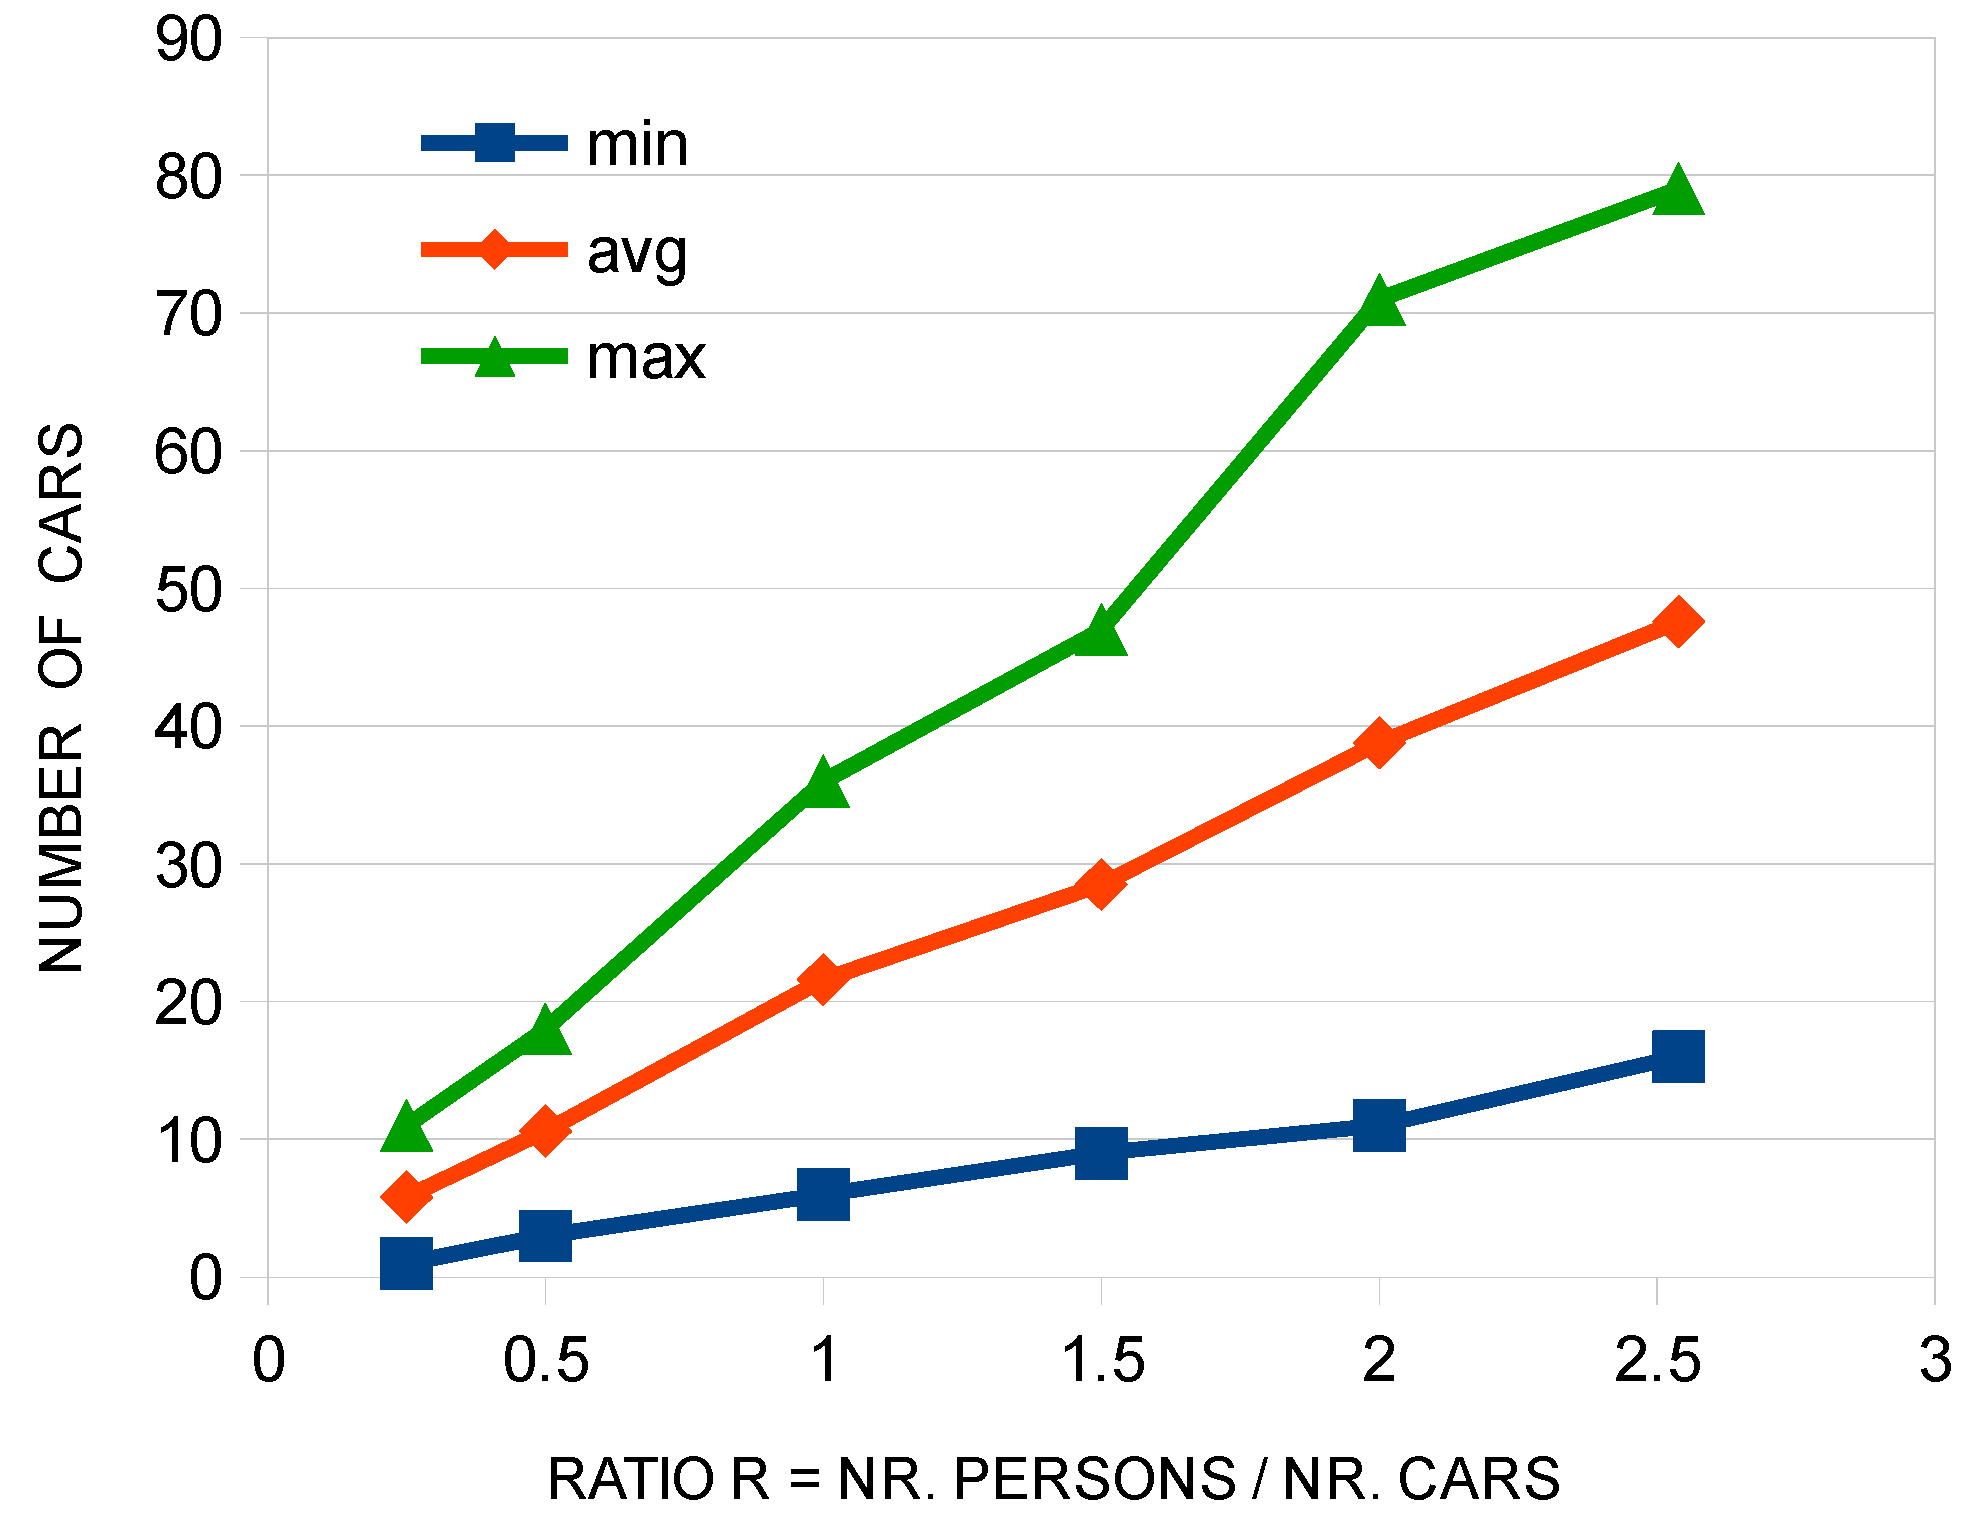
5.2.1. Average and Maximum Traffic Queue Sizes

Figure 10 shows the maximum, and average traffic queue sizes found at each road connected to the twenty-five intersections with RSUs. These results were obtained immediately before the end of the simulation (i.e., t ≈ 500 s). The average traffic queue sizes show no significant difference between the push and pull modes. When R is above 1, the average traffic queue sizes become larger with the use of VTLS than without using it.
The results also show that, in the three test modes, there were roads at the intersections with queue sizes of eight cars at least.

5.2.2. Car Trip Distance

Figure 11 shows the average distance rolled by each car during the simulation. The graphic is normalized to 100%, which corresponds to 1483.4 m. As expected, the best results were obtained without using the VTLS, where the cars reached a longer distance than the cars controlled by virtual traffic light systems. Moreover, the difference between the push and pull modes is negligible. As expected, the distance travelled by the cars decreases with the increment of the number of pedestrians, since the cars tend to be stopped longer in the crossing to let pass the pedestrians. Such situation becomes more notorious with the use of VTLS than without using any VTLS. This shows that the algorithms used by VTLS are less efficient than the one used by SUMO in terms of traffic fluidity at the intersections.

5.2.3. Car Stop Time

Figure 12 shows the average time that each car was stopped at the intersections or jammed in the traffic queues during the simulations. The graphic is normalized to 100%, which corresponds to 106.4 s. Once again, there is no significant difference between the push and pull modes. Considering the results obtained for the trip distance, this is an expected result. Indeed, the stop time of the cars increases with the number of pedestrians, since the cars tend to be longer stopped in the crossing to let pass the pedestrians. This situation becomes more notorious with the use of VTLS than without using it.

5.3. Communication Metrics
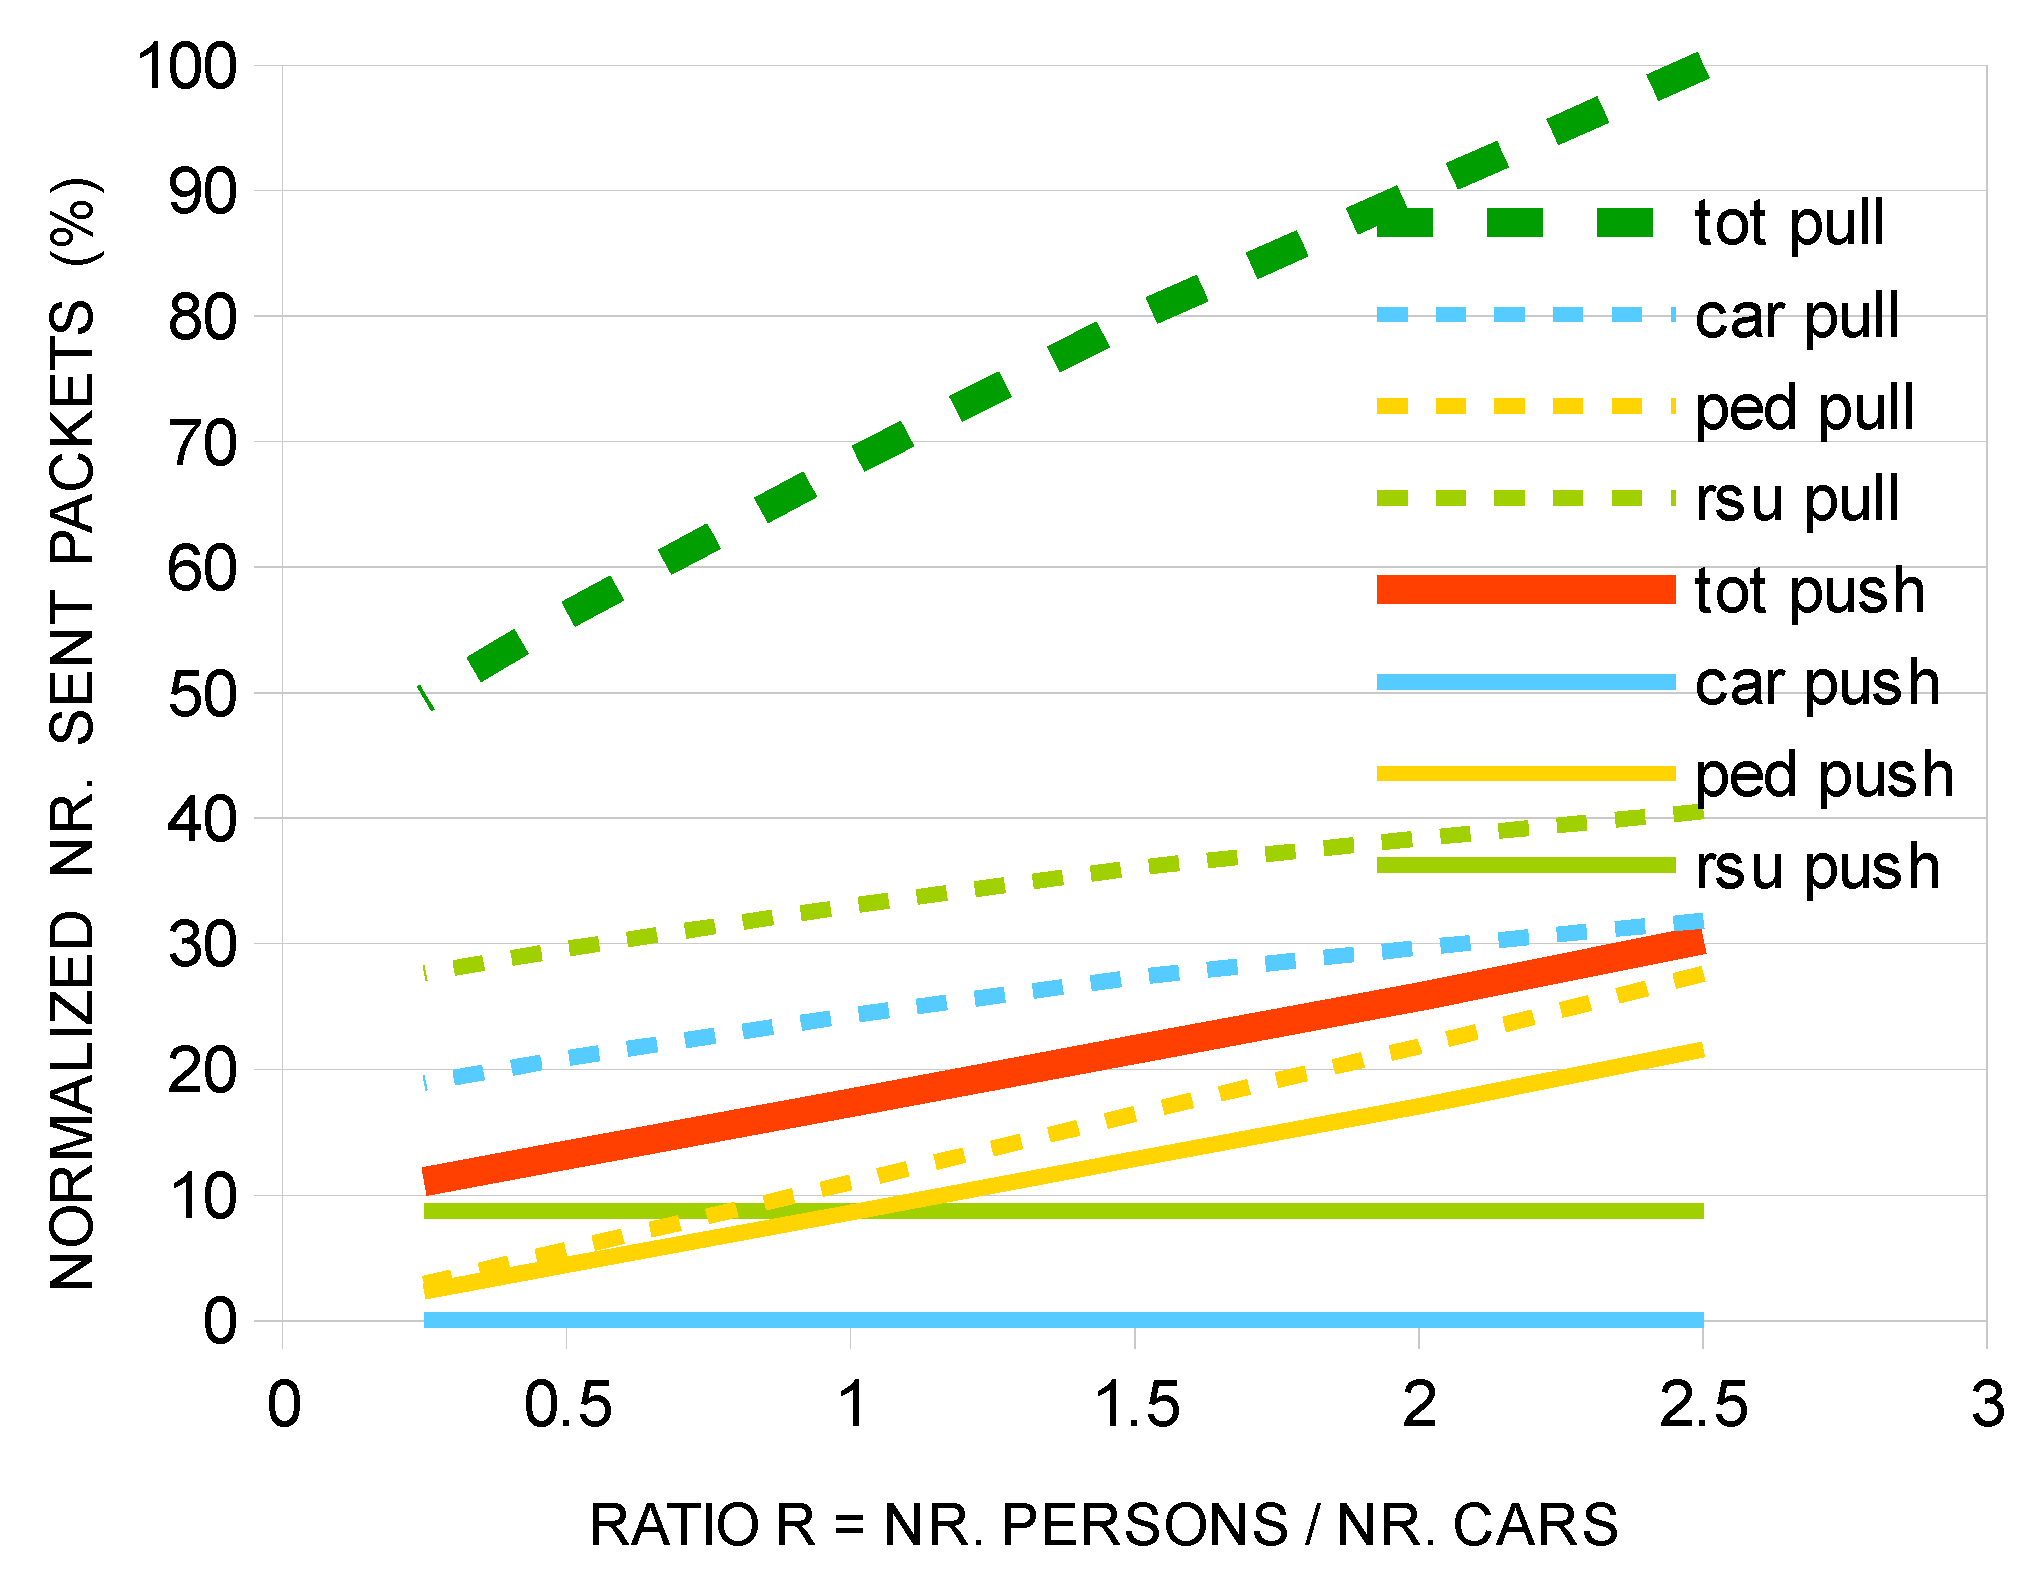
The results obtained for the number of sent packets and packet loss are presented and discussed next. The curves for the case of using no VTLS are not shown in the graphics, because in this test mode the number of packets sent by the nodes is always zero.

5.3.1. Sent Packets

Figure 13 shows the total number of packets sent by all nodes (cars, pedestrians, RSUs), as well as the packets sent partially by the pedestrians, cars, and RSUs. The graphic is normalized to 100%, which corresponds to 190,742 packets. It observed that, globally, the pull mode generated, in average, 3.9 (±0.6) times more packets than the push mode in all ratios R.
The results show that in the pull mode, the RSUs are the nodes that generate more packets, followed by the cars. In the push mode, the pedestrians are the nodes that generate more packets, followed by the RSUs, and the cars generate no communication traffic. In the push mode, the number of packets sent by the RSU does not change with the increment of the ratio R.

5.3.2. Packet Loss

The signal-to-interference-plus-noise ratio (SNIR) lost packets indicates the number of lost packets due to bit errors, caused by packet collisions or noise interferences at the destination receivers. A TxRx lost packet is a packet that was not transmitted neither received, because a packet arrived to the wireless interface precisely when another packet was being sent by this wireless interface. So, the TxRx parameter evaluates how often a wireless interface is receiving and transmitting packets at the same time, causing the loss of both packets. The total number of lost (unreceived) packets by a node at the lower communication layers is the sum of the total SNIR lost packet plus the TxRx lost packets in that node. The percentage of lost packets by SNIR and TxRx problems is calculated by the expression: (SNIRlostPkts + TxRxLostPkts)/(SNIRlostPkts + TxRxLostPkts + recvdPkts) * 100%, where SNIRlostPkts is the number of SNIR lost packets, TxRxLostPkts is the number of TxRx lost packets, and recvdPkts is the number of packets received by the wireless node. This metric can be used as an indirect indication of the bandwidth occupancy of the wireless channel, in that the higher is its value, the more occupied is the wireless channel used by the wireless communication modules.
Figure 14 shows the average percentage of the SNIR + TxRx lost packets of all nodes (pedestrians, cars, RSUs), using the push, and pull modes. The results show indirectly that the wireless channel bandwidth globally available in the simulated scenario is more occupied in pull mode than in push mode. Indeed, the difference in the average SNIR + TxRx packet loss between the pull and push mode increases with the ratio R, from 1.3 percentage points (p.p.) (R = 0.25) to 1.9 p.p. (R = 2.5). The results also revealed that the packet losses were almost all caused by SNIR problems, as the losses caused by TxRx problems were really quite negligible (<0.002%).

5.3.3. Application Message Loss

The average percentage of messages lost at the application layer was calculated too. For simplicity, this metric considers only the messages sent by pedestrians and cars that failed to reach the application layer of the RSUs. The messages sent by the RSUs that failed to reach the application layers of the pedestrians and cars were not considered. The percentage of lost messages is calculated by the expression: (sentPktPed + sentPktCar − recvdPktRSU)/(sentPktPed + sentPktCar) * 100%, where sentPktPed and sentPktCar are the total number of messages sent respectively by all pedestrians and cars, and recvdPktRSU is the total number of messages received by all RSUs from the pedestrians and the cars, and not from other RSUs. So, in push mode, this metric indicates the messages lost by the RSUs from the nearby pedestrians. In pull mode, it measures the messages lost by the RSUs from the nearby pedestrians and cars. The messages received by the RSU from pedestrians and cars out of range are ignored in this metric.
Figure 15 shows the results of the average message loss, in percentage, obtained with the push, and pull modes. The average application message lost is lower in the push mode than in the pull mode. This result is somewhat expected taking in consideration the results obtained for the SNIR + TxRx lost packets. The difference in the average message loss between the pull and push mode increases with the ratio R, from 0.031 p.p. (R = 0.25) to 0.19 p.p. (R = 2.5).

6. Conclusions

When compared with the push mode, the pull mode (implemented by NDN) revealed similar performance in all metrics, excepting the communication metrics (sent packets and packet loss). Indeed, when compared to the push mode, both the SNIR + TxRx packet loss and the application message loss are higher with the pull mode, with maximum differences of 1.9 p.p. and 0.19 p.p., respectively, obtained for the ratio R (number of pedestrian/number of cars) equal to 2.5. Comparatively to the notls mode, which defines a priori the optimal performance regarding the mobility of the cars, the performances of the push, and pull modes are particularly worst for the stop time and the car trip distance of the cars, when the ratio R is above 0.5. Regarding the traffic queue sizes, no significant difference was observed between the three test modes (notls, pull, push).
The results show that the push mode presents lower packet loss and generates fewer packets, and consequently occupies less bandwidth than the pull mode. In fact, for the considered metrics, the virtual semaphore implemented with the pull mode presents no advantage when compared with the push mode. However, this does not mean that the pull mode should not be considered to implement a VTLS. Indeed, apart from the communication metrics, the performances obtained with the pull and push modes are very similar. Moreover, in pull mode, the performance, in terms of packet collisions, may be improved if the nearby RSUs could somehow regulate the transmission of interests, so that these are sent out of phase to the pedestrians.
This work has considered only the implementation of a VTLS directed to the pedestrian’s safety. However, it would be convenient that the VTLS also takes the vehicles safety in consideration. This issue will be tackled in a future work.

Author Contributions

The first author, O.G., is the major contributor to this work. All other authors followed the work closely and discussed it openly in several project work meetings. Details follow. Conceptualization: O.G. Methodology: O.G., M.J.N., A.C. Software: O.G. Validation: O.G., M.J.N., A.C., J.M., B.D., A.S. Investigation: O.G., J.S., B.R., F.G. Data curation, writing—original draft preparation: O.G. Review: M.J.N., A.C., J.M., B.D., A.S. Editing: O.G. Supervision: A.C., M.J.N., J.M., B.D., A.S. Resources, project administration and funding acquisition: A.S. All authors have read and agreed to the published version of the manuscript.

Funding

This work has been supported by national funds through FCT—Fundação para a Ciência e Tecnologia within the Project Scope: UID/CEC/00319/2020 and by the European Structural and Investment Funds in the FEDER component, through the Operational Competitiveness and Internationalization Programme (COMPETE 2020) [Project nº 039334; Funding Reference: POCI-01-0247-FEDER-039334].

Conflicts of Interest

The authors declare no conflict of interest.

References

  1. Mobility and Transport | Road Safety. Available online: https://ec.europa.eu/transport/road_safety/ (accessed on 30 September 2020).
  2. Zhang, L.; Afanasyev, A.; Burke, J.; Jacobson, V.; Claffy, K.C.; Crowley, P.; Lan Wang, L.; Zhang, B. Named data networking. Comput. Commun. Rev. 2014. [Google Scholar] [CrossRef]
  3. Sewalkar, P.; Seitz, J. Vehicle-to-Pedestrian Communication for Vulnerable Road Users: Survey, Design Considerations, and Challenges. Sensors 2019, 19, 358. [Google Scholar] [CrossRef] [PubMed] [Green Version]
  4. Khelifi, H.; Luo, S.; Nour, B.; Moungla, H.; Faheem, Y.; Hussain, R.; Ksentini, A. Named Data Networking in Vehicular Ad hoc Networks: State-of-the-Art and Challenges. Commun. Surv. Tutor. 2019. [Google Scholar] [CrossRef]
  5. Al-qutwani, M.; Wang, X. Smart Traffic Lights over Vehicular Named Data Networking. Information 2019, 10, 83. [Google Scholar] [CrossRef] [Green Version]
  6. Ferreira, M.; Fernandes, R.; Conceição, H.; Viriyasitavat, W.; Tonguz, O.K. Self-organized traffic control. In Proceedings of the Annual International Conference on Mobile Computing and Networking, Mobicom, Chicago, IL, USA, 20–24 September 2010; pp. 85–89. [Google Scholar]
  7. Chou, L.-D.; Jin-Hua, J.-Y.; Tseng, Y. Adaptive Virtual Traffic Light based on Vanets for Mitigating Congestion in Smart City. In Proceedings of the third International Conference on Digital Information and Communication Technology and its Applications, Dijon, France, 21–23 June 2011; pp. 40–44. [Google Scholar]
  8. Münst, W.; Dannheim, C.; Mäder, M.; Gay, N.; Malnar, B.; Al-Mamun, M.; Icking, C. Virtual traffic lights: Managing intersections in the cloud. In Proceedings of the 2015 7th International Workshop on Reliable Networks Design and Modeling, Munich, Germany, 5–7 October 2015; pp. 329–334. [Google Scholar]
  9. Bazzi, A.; Zanella, A.; Masini, B.M. A distributed virtual traffic light algorithm exploiting short range V2V communications. Ad Hoc Netw. 2016, 49, 42–57. [Google Scholar] [CrossRef]
  10. Cai, Z.; Deng, Z.; Li, J.; Zhang, J.; Liang, M. An Intersection Signal Control Mechanism Assisted by Vehicular Ad Hoc Networks. Electronics 2019, 8, 1402. [Google Scholar] [CrossRef] [Green Version]
  11. Chang, H.J.; Park, G.T. A study on traffic signal control at signalized intersections in vehicular ad hoc networks. Ad Hoc Netw. 2013, 11, 2115–2124. [Google Scholar] [CrossRef]
  12. Shi, J.; Peng, C.; Zhu, Q.; Duan, P.; Bao, Y.; Xie, M. There is a Will, There is a Way: A New Mechanism for Traffic Control Based on VTL and VANET. In Proceedings of the IEEE International Symposium on High Assurance Systems Engineering, Daytona Beach, FL, USA, 8–10 January 2015; pp. 240–246. [Google Scholar]
  13. Burke, J.; Gasti, P.; Nathan, N.; Tsudik, G. Secure sensing over named data networking. In Proceedings of the 2014 IEEE 13th International Symposium on Network Computing and Applications, Cambridge, MA, USA, 21–23 August 2014; pp. 175–180. [Google Scholar]
  14. Mori, K.; Kamimoto, T.; Shigeno, H. Push-based traffic-aware cache management in named data networking. In Proceedings of the 2015 18th International Conference on Network-Based Information Systems, NBiS 2015, Taipei, Taiwan, 2–4 September 2015; pp. 309–316. [Google Scholar]
  15. Amadeo, M.; Campolo, C.; Molinaro, A. Internet of Things via Named Data Networking: The support of push traffic. In Proceedings of the 2014 International Conference on the Network of the Future, Paris, France, 3–5 December 2014. [Google Scholar]
  16. Majeed, M.F.; Ahmed, S.H.; Dailey, M.N. Enabling push-based critical data forwarding in vehicular named data networks. IEEE Commun. Lett. 2017. [Google Scholar] [CrossRef]
  17. ETSI TR 103 300-1 V2.1.1 (2019-09)-Intelligent Transport System (ITS); Vulnerable Road Users (VRU) Awareness; Part 1: Use Cases Definition; Release 2. Available online: https://standards.iteh.ai/catalog/standards/etsi/8b7acf23-d5b3-4c9b-ae81-4865b45f22a5/etsi-tr-103-300-1-v2.1.1-2019-09 (accessed on 25 October 2020).
  18. Interest Packet—NDN Packet Format Specification Version 0.3. Available online: https://named-data.net/doc/NDN-packet-spec/current/interest.html (accessed on 30 September 2020).
  19. Grassi, G.; Pesavento, D.; Pau, G.; Vuyyuru, R.; Wakikawa, R.; Zhang, L. VANET via named data networking. In Proceedings of the 2014 IEEE Conference on Computer Communications Workshops (INFOCOM WKSHPS), Toronto, ON, Canada, 27 April–2 May 2014. [Google Scholar]
  20. Deng, G.; Xie, X.; Shi, L.; Li, R. Hybrid information forwarding in VANETs through named data networking. In Proceedings of the IEEE International Symposium on Personal, Indoor and Mobile Radio Communications, Istanbul, Turkey, 8–11 September 2019. [Google Scholar]
  21. Duarte, J.M.; Braun, T.; Villas, L.A. Receiver mobility in vehicular named data networking. In Proceedings of the 2017 Workshop on Mobility in the Evolving Internet Architecture, Part of SIGCOMM 2017, Los Angeles, CA, USA, 25 August 2017. [Google Scholar]
Figure 1. Illustration of the named data networking (NDN) push (left), and pull (right) communication models. In the push model, P sends D to road-side unit (RSU) S and this sends the L to C, while in the pull model, D and L are sent after being requested by S and C, respectively.
Information 11 00510 g001
Figure 2. Intersection with three cars (A, B, C) and one pedestrian (P) in the inferior horizontal crosswalk.
Information 11 00510 g002
Figure 3. Intersection with three cars (A, B, C) and one pedestrian (P).
Information 11 00510 g003
Figure 4. Algorithm used by the RSU in pull mode.
Information 11 00510 g004
Figure 5. Algorithms used by the cars (left) and pedestrians (right) in pull mode.
Information 11 00510 g005
Figure 6. Algorithm used by the RSU in push mode.
Information 11 00510 g006
Figure 7. Algorithms used by pedestrians (left) and cars (right) in push mode.
Information 11 00510 g007
Figure 8. Partial map showing 4 crossroads in each intersection. Each road has 2 sidewalks (in gray).
Information 11 00510 g008
Figure 9. Minimum, average, maximum number of persons that crossed all intersections with RSUs.
Information 11 00510 g009
Figure 10. Maximum, and average traffic queue sizes per road at the intersections.
Information 11 00510 g010
Figure 11. Average car trip distance, normalized to 100% = 1483.4 m.
Information 11 00510 g011
Figure 12. Average stop time of the cars, normalized to 100% = 106.4 s.
Information 11 00510 g012
Figure 13. Total sent packets, and packets sent partially by pedestrians, cars, and RSUs, normalized to 100% = 190,742 packets.
Information 11 00510 g013
Figure 14. Average SNIR + TxRx packet loss, in percentage, considering all nodes in the simulation.
Information 11 00510 g014
Figure 15. Average message loss, in percentage, considering only the application messages received by RSUs.
Information 11 00510 g015
Table 1. Parameterizations used in the simulated scenario.
ParameterValueParameterValue
road grid size7 × 7ndn_car_dst_to_road_end18 m
nr. of virtual semaphores25ndn_car_interest_mesg_period0.5 s
road length200 mndn_rsu_interest_mesg_period0.5 s
min. car trip distance2000 mwsm_rsu_beacon_tx_period0.5 s
max. pedestrian trip distance1000 mwsm_person_mesg_period0.5 s
road limit velocity10 m/sperson_dst_to_road_end4 m
pedestrian maximum velocity1.5 m/sperson_dst_from_road_start 4 m
car acceleration3 m/s2physical thermal noise−110 dBm
car deceleration10 m/s2physical noise floor−98 dBm
simulation time per test500 sphysical minimum power level−85 dBm
car generation period1 swireless communication protocolWSMP/IEEE 802.11p
pedestrian generation period0.26, 0.33, 0.44, 0.66, 1.32, 2.64 stransmission power20 mW
number of simulation sets35transmission bit rate6 Mbps
Publisher’s Note: MDPI stays neutral with regard to jurisdictional claims in published maps and institutional affiliations.

