Article

Energy-Efficient Check-and-Spray Geocast Routing Protocol for Opportunistic Networks

by
Khuram Khalid
1,†,‡,
Isaac Woungang
1,*,‡,
Sanjay Kumar Dhurandher
2,‡,
Jagdeep Singh
2,‡ and
Joel J. P. C. Rodrigues
3,4,‡
1
Department of Computer Science, Ryerson University, Toronto, ON M5B 2K3, Canada
2
Department of Information Technology, Netaji Subhas University of Technology, New Delhi 110078, India
3
Post-Graduation Program in Electrical Engineering, Federal University of Piauí (UFPI), Teresina 64049-550, Brazil
4
Covilhã Delegation, Instituto de Telecomunicações, 6201-001 Covilhã, Portugal
*
Author to whom correspondence should be addressed.
Current address: Department of Computer Science, Ryerson University, Toronto, ON M5B 2K3, Canada.
These authors contributed equally to this work.
Information 2020, 11(11), 504; https://doi.org/10.3390/info11110504
Submission received: 20 September 2020 / Revised: 18 October 2020 / Accepted: 24 October 2020 / Published: 28 October 2020
(This article belongs to the Special Issue Vehicle-To-Everything (V2X) Communication)

Abstract

:
Opportunistic networks (OppNets) are a type of challenged network where there is no guaranteed of end-to-path between the nodes for data delivery because of intermittent connectivity, node mobility and frequent topology changes. In such an environment, the routing of data is a challenge since the battery power of the mobile nodes drains out quickly because of multi-routing activities such as scanning, transmitting, receiving, and computational processing, effecting the overall network performance. In this paper, a novel routing protocol for OppNets called Energy-Efficient Check-and-Spray Geocast Routing (EECSG) is proposed, which introduces an effective way of message distribution in the geocasting region to all residing nodes while saving the energy consumption by restricting the unnecessary packet transmission in that region. A Check-and-Spray technique is also introduced to eliminate the overhead of packets in the geocast region. The proposed EECSG is evaluated by simulations and compared against the Efficient and Flexible Geocasting for Opportunistic Networks (GSAF) and the Centrality- Based Geocasting for Opportunistic networks (CGOPP) routing protocols in terms of average latency, delivery ratio, number of messages forwarded, number of dead nodes, overhead ratio, and hop count, showing superior performance.

1. Introduction

In an OppNet, due to the highly dynamic low density, the limited power of nodes, intermittent connectivity and high error rates, an end-to-end path between the source and destination nodes is not guaranteed. Instead, the nodes communicate through short-range wireless interfaces (such as Wifi, Bluetooth, to name a few) and forward the data packets using the Store–Carry–Forward mechanism [1]. Typically, that each node stores the data packets in its buffer, and when it meets another node opportunistically, it forwards the duplicated data packets to that node, hoping that the latter will carry them towards their destination. In this context [2], sending a message from a node to one destination node is called unicasting. In case the message is to be routed to a specific area instead of a selected node, and then flooded to all the nodes within that area, the process is referred to as geocasting [3].
In the most recent literature [4], solutions for routing the message towards the destination cast have been proposed. However, in the context of opportunistic networks (OppNets), to the best of our knowledge, only a few routing protocols that support the geocasting mechanism have been investigated [5,6,7,8,9,10,11]. For any geocasting protocol, it is expected that the message be delivered in the destination area first, then efficiently disseminated within the destination cast. Implementing such an approach requires the consideration of spatial and temporal domains while following some restrictions in terms of nodes’ resources.
In this paper, a novel routing protocol called Energy-Efficient Check-and-Spray Geocast Routing (EECSG) protocol for OppNets is proposed, whose main purpose is twofold: (1) efficiently deliver a message from its source to a destination location (or cast), and (2) efficiently deliver the message to all nodes within the geocast region using a controlled flooding mechanism. It also follows the current member delivery membership model i.e., all the messages are scheduled to a targeted area, and the information on this (such as endpoint identifier) is embedded into the messages’ block. Whenever a node receives a message, it will match it with its own location with the message’s endpoint identifier before forwarding it to any other node. The design of our proposed EECSG protocol fundamentally differs from the previous work [5,6,7,8,9,10,11] as follows: (1) The location information on any node is acquired on-the-go using location sampling and a location maintenance strategies; (2) Message endpoint identification and cast definition are used for membership check, and an energy-efficient controlled flooding mechanism (so-called Check-and- Spray) is utilized to distribute the geo messages to all nodes within the geocast region; (3) A forwarding utility metric is computed to quantify the routing contribution that can be made by the nodes encountered outside the destination cast, and based on this, a relay node is selected to carry the message forward towards its destination.
The rest of the paper is organized as follows. In Section 2, related work on geocasting routing protocols for OppNets are presented. In Section 3, the proposed EECSG routing protocol is presented. In Section 4, the performance evaluation of the EECSG protocol is presented. Finally, Section 5 concludes the paper.

2. Related Work

Very few works in the literature have investigated geocasting routing protocols for OppNets.
In [5], Liu et al. proposed a routing protocol called Geoopp for OppNets, which is used to transfer the messages from a node to a stationary destination based on selected encountered neighbors within its geographical location. In doing so, the selected relay nodes accept messages that are being routed by interchanging the visiting and meeting records with each other. For forwarding the message to a specified geocast region, a geographic greedy routing scheme is utilized in conjunction with a progress within radius metric (PWRM) that measures how much progress a node has achieved in carrying the message towards the destination cast. In this process, the Chebyshev’s inequality is utilized to estimate the probabilities that a node visits a region and establishes some contact in that region. In this sense, the contact availability per visiting and inter-visiting time are the node’s mobility patterns that are used to estimate the number of regular visits and contacts in that specific geocast region.
In [6], Lu et al. proposed a location-based geocasting routing protocol for OppNets (called Location-based routing for Opportunistic networks (LOOP)), which makes use of a greedy mechanism to transmit the messages towards the destination region. Their scheme exploits the regularity encountered in the human movement mobility as a pattern to estimate a node’s future locations based on its mobility trace. In doing so, the movement pattern-mining of a node is formulated as a classification problem, based on which a Bayes’ predictive model is constructed to estimate the node’s versatility history, a parameter taken into consideration in the selection of the relay node to which to forward the message.
In [7], Ott et al. introduced a distributed content sharing scheme for OppNets, in which the geographical vicinity of the mobile nodes is utilized as a means for information dissemination, taking into account the spreading and lifetime of information. In their content distribution scheme, the content is exclusively created and distributed locally and cannot be explicitly deleted. An analysis of their proposed scheme in terms of assessing the operational range for floating content is performed, showing promising results.
In [8], Ma and Jamalipour proposed a geocasting routing protocol for delay tolerant networks (called Expected Visiting Rate (EVR)), which relies on the idea of forwarding the messages to the destination location rather than to all nodes in that cast based on the EVR information, itself derived based on the historical information on the visited areas in the network. In this routing process, for a particular source node, the node with the highest EVR, which is qualified as node with the expected visiting rate, is selected for carrying the message forward towards its destination.
In [9], Rajaei et al. proposed a geocasting routing protocol for OppNets (called Flexible Geocasting for Opportunistic Networks (GSAF)), where the casts are defined as polygons by the sender node and then carried in the routed message in such a way that potential relay nodes only need to check whether they reside, or not, within the defined cast, noting that a node can still send a message in a cast even if it is located outside it. In their scheme, most of the messages follow random walks en route to the destination cast and those messages that do not follow a path to the destination cast are subject to deletion when the node’s buffer become full. Whenever a message has reached the destination cast, it gets disseminated via a controlled flooding mechanism and will no longer be rerouted when it exits the destination cast.
In [10], Singh et al. proposed a multi-copy based geocasting routing protocol for OppNets (called Centrality-Based Geocasting for Opportunistic networks (CGOPP)), which transmit the messages towards its destination cast by using an integrated uni-casting and flooding mechanism. In their scheme, the messages are forwarded to the destination cast, then intelligently flooded inside this cast by using a centrality-based flooding mechanism that relies on the degree centrality of the nodes in the cast. Whenever a node gets a message, it examines whether it is located within the specified area or not. This is achieved by using the Crossing test algorithm [12] (although the Angle summation test algorithm or Triangle test algorithm could have been utilized as well).
In [11], Dhurandher et al. proposed a geocasting routing protocol for OppNets (called F-GSAF), which uses fuzzy attributes such as direction and speed, remaining energy, and buffer space of nodes, to determine the relay nodes to carry the message toward its destination. In this scheme, the Mamdani fuzzy controller is considered and the routing of a message from the source to a destination cast follows two steps. First, the messages are relayed to the geocast region following a multi-copying spray approach. Once in that cast region, the messages are intelligently flooded to all the nodes therein. During this flooding step, an acknowledgment mechanism is implemented, which takes care of deleting the messages that have already been delivered and dropping the undelivered copies from the buffers of the nodes that still carry them.
Unlike the above discussed work [5,6,7,8,9,10,11], our proposed EECSG protocol involves: (1) predicting the node’s movement through acquiring the location information on-the-go, (2) Identifying the destination cast and determining whether the current node’s position is located within it, (3) computing a forwarding utility metric that quantifies the routing contribution that can be made by the nodes that are encountered outside the destination cast, and (4) selecting a relay, based on this forwarding utility metric.

3. Proposed EECSG Routing Protocol

The proposed EECSG protocol (described in Algorithm 1) consists of the following steps:
  • Acquiring the location information on-the-go. At this step, two tasks are involved in predicting the node movement. The first tasks consist of collecting the mobility traces, which deals with location sampling and node’s location information maintenance. The second task consists of extracting the information relevant to a given message from the available movement history. The following sub-steps are involved:
    (a)
    Location sampling: A node location may either be sampled periodically or triggered by an external event. In periodic sampling, the choice of the sampling interval presents a trade-off between accuracy and energy consumption in the sense that fine-grained intervals provide a more accurate movement history and higher energy consumption while larger intervals consume less energy, but may fail to record important locations. With an event-triggered approach, the location is sampled only when a node is encountered. While this approach records only the locations in which the encounter opportunities are available, some of the encounters may not be regular. As such, when using this technique, we have collected GPS traces at regular intervals and logged them into a file in order to analyze them and uncover some correlations on the number of visits between nodes to a given location.
    (b)
    Location information maintenance: This is taken care of as follows: the geographic area of the network is partitioned into a grid of square cells, where each cell is treated as a place (i.e., a collection of nearby locations in the network), and every node then maintains a list of its most visited places. It is worth noting that here, a location is obtained by using the Global Positioning System (GPS). After location sampling, the information that is relevant to a given message is extracted from the available movement history.
  • Defining the destination cast as well as determining whether the current position is located within it. This involves the following sub-steps:
    (a)
    Identifying the message endpoint: A message in OppNet is created along with the Endpoint Identifier (EID), which specifies its destination address. Unlike unicasting and multicasting, the naming approach in geocasting depends on the geographical location/area and the membership of the location. A location could be a point, polygon, grid, circle, to name a few. Besides, the membership of a node is subject to time and space. This is different in the case of uni-casting and multicasting, where the message destination is assigned to a node along with its EID.
    (b)
    Cast definition: In geocasting, the message destination is defined as a cast, i.e., a geographical area considered as the destination of the transmitted message. All network users residing within a defined geographical area is a potential recipient of a message, i.e., a user is a recipient if a message destination address corresponds with its current location. A cast can be defined as a point, circle, polygon, grid, to name a few, and a user defines the cast as a point of Polygon, and the casts are defined as a set of pairs of two-dimensional coordinates. The strategies that are often used to identify the position of a point inside or outside the polygon include Crossing test, Angle Summation test and Triangle test [12]. In this work, we make use of the Crossing test algorithm.
    (c)
    Membership check: A node is identified with a location. To be qualified as a recipient of a message, a node is checked to determined whether it is a member of a location i.e., belongs to a cast. Frequently visited places also known as Point of Interests (PoIs) are locations of the nodes that are often visited. The nodes that are currently located in the PoIs in the polygon are checked.
  • Computing a forwarding utility metric to quantify the routing contribution that can be made by the nodes encountered outside the destination cast. The forwarding algorithm is designed for a message carrier to always identify the best node with a higher chance to relay the message to its destination. This involves the following considerations:
    (a)
    Buffer scheduling policy: In order to reduce the energy consumption, buffer management should be taken care of, for instance, by deciding on which buffer scheduling policy is to be adopted, which will result in a minimum packets delivery loss. In that sense, in our simulation experiment, the following four scheduling policies can be considered: (1) the First-In-First-Out (FIFO)—where the messages are forwarded to the nodes in the that order that they have been received; (2) Last-In-First-Out (LIFO)—where the messages are forwarded to the nodes in the reverse order that they have been received; (3) Highest-Time-to-Live-First-Out (HTFO)—where the message with the longest lifetime is first forwarded, followed by others; and (4) Lowest-TTL-First-Out (LTFO)—where the message with the shortest lifetime is first forwarded, followed by others. For most of our simulations, we have considered the default buffer scheduling policy, i.e., random policy—meaning that the messages are randomly selected from the node’s buffer when a node encounters another one.
    (b)
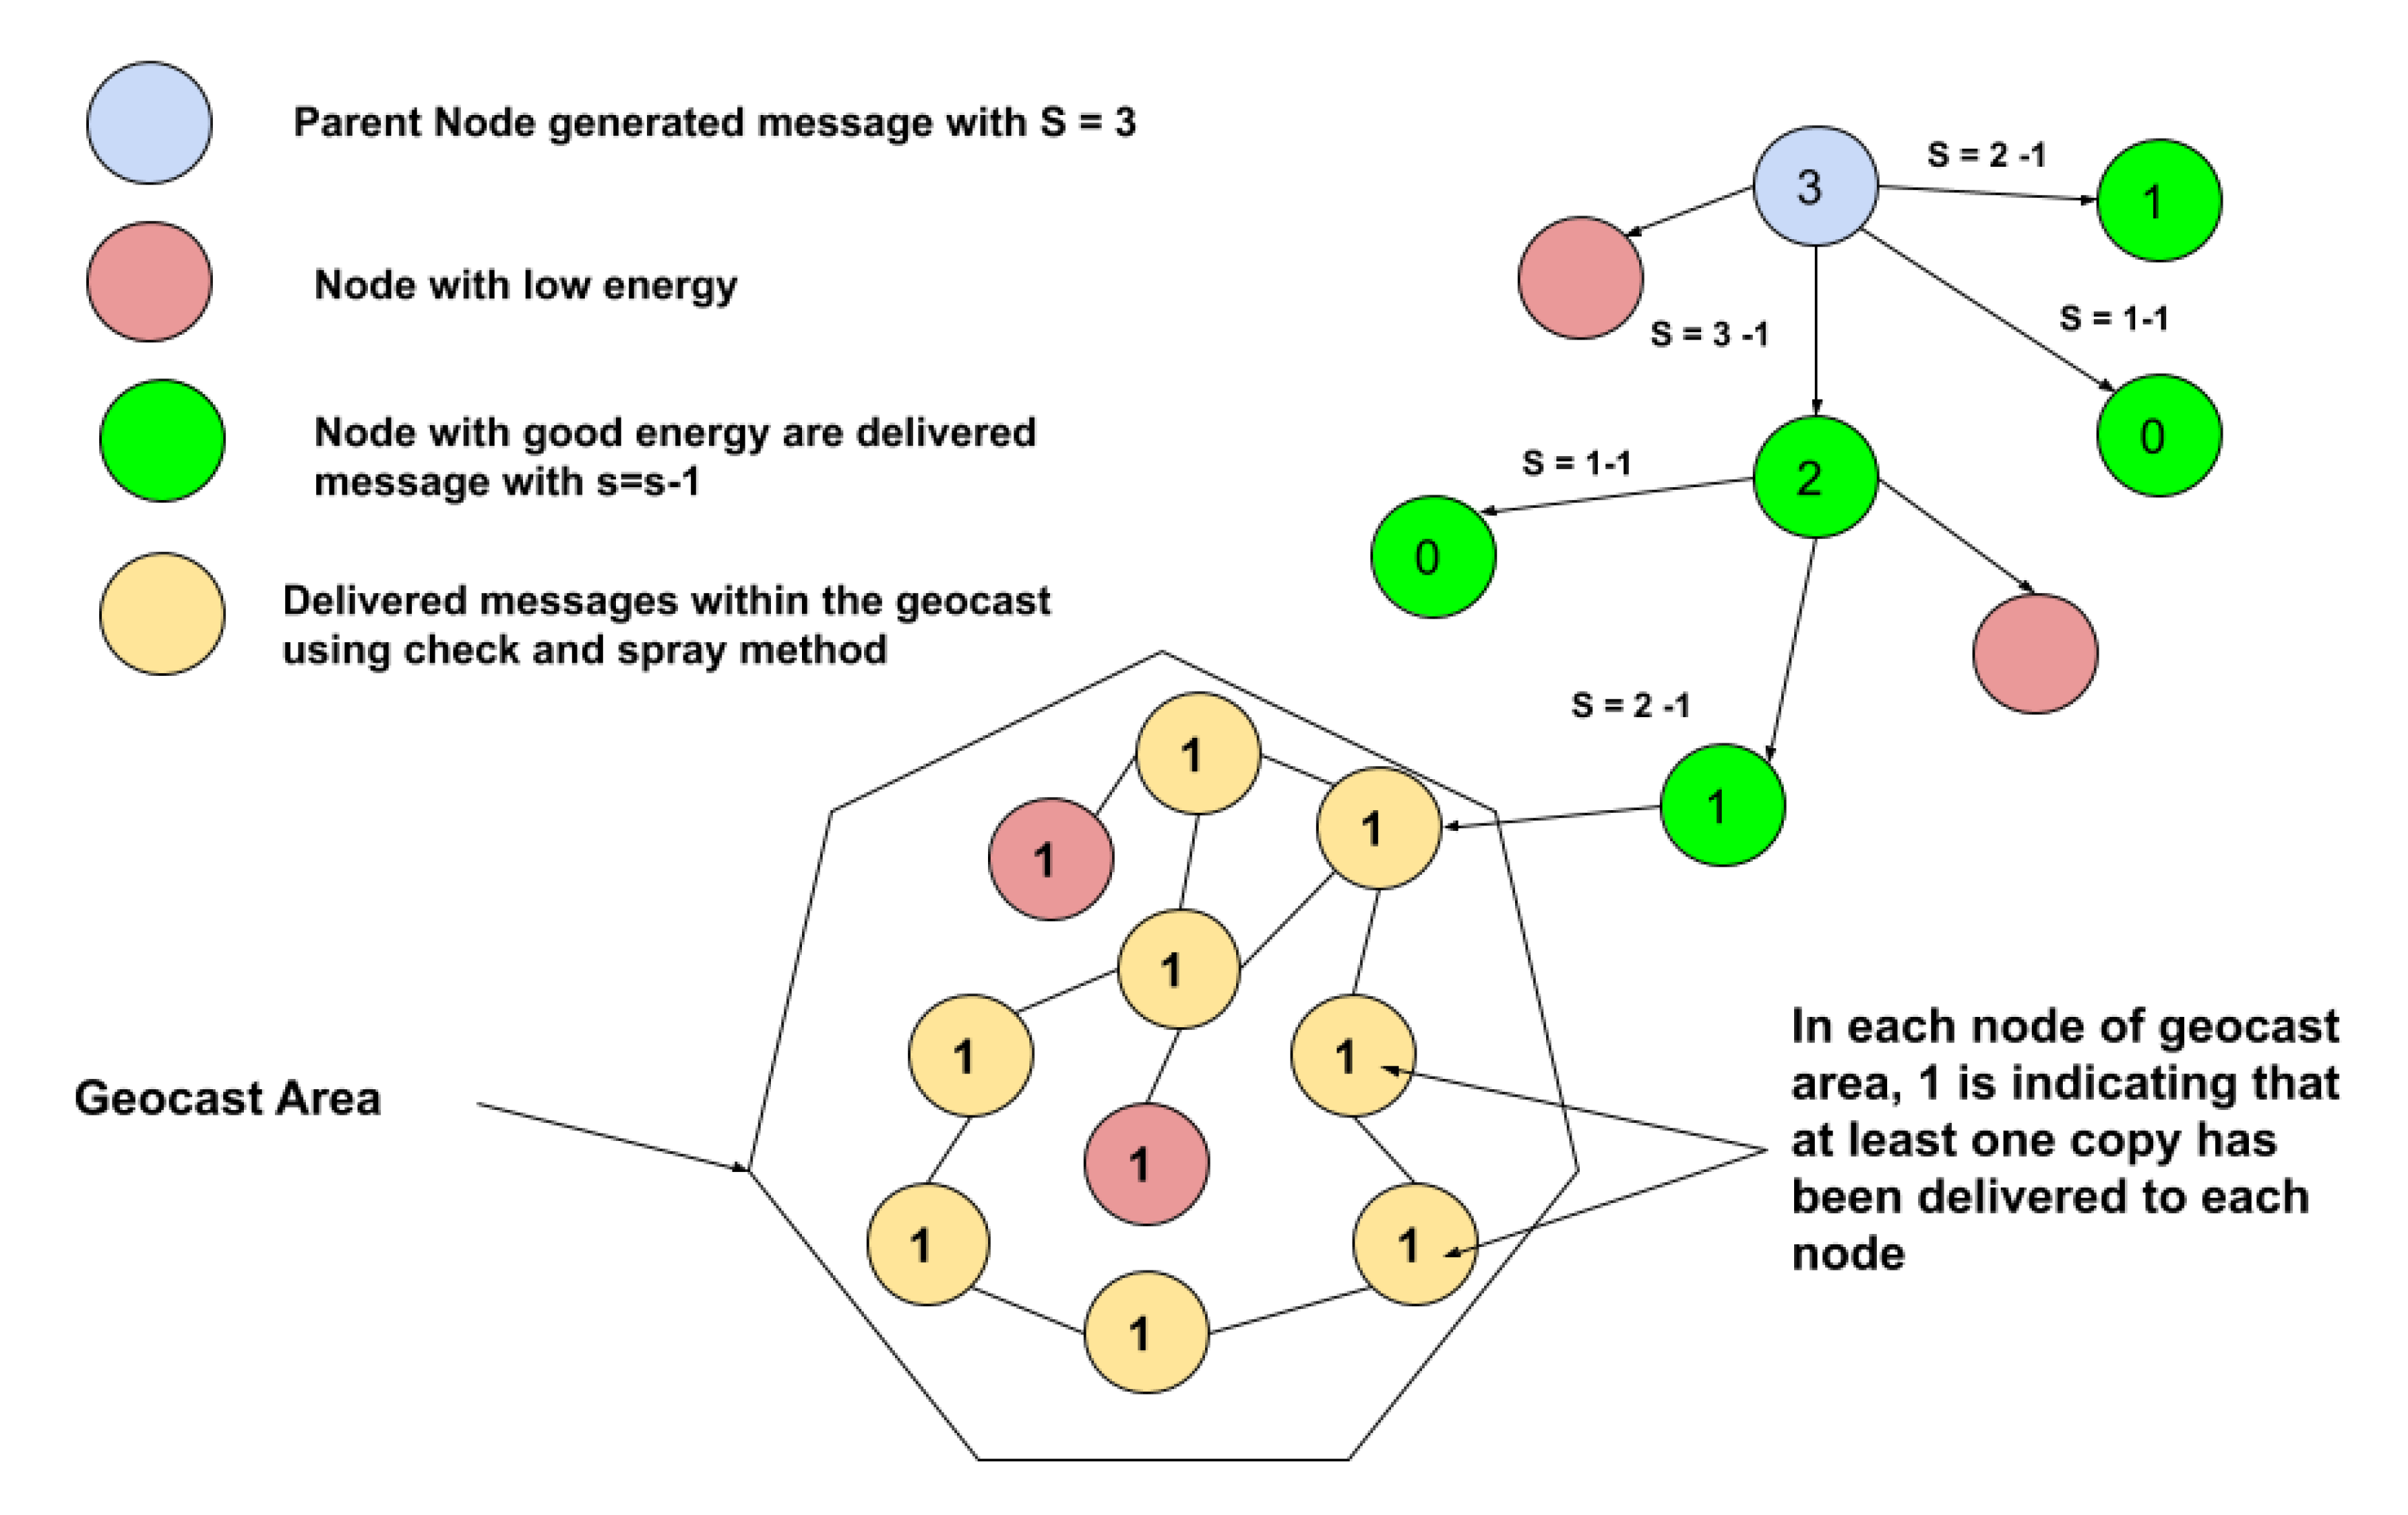
    Energy efficiency: In an OppNet, the energy consumption of a node is a critical issue which frequently occurs when the node sends and receives the data packets or when one packet is sent many times by the node to other nodes. In order to save the node’s battery life, thereby increase the chance of successful packet delivery, it is desirable to route the packets only through those nodes that have enough remaining battery power, in such a way that the delivery ratio of packets is maximized. In our proposed EECSG protocol, the energy level of the receiving nodes have been taken into account when deciding on the suitable relay nodes to carry the message towards its destination. Indeed, during the first phase of the EECSG protocol, while forwarding the message to its destination, the energy level of any neighboring node n of a source node is checked. If it is below a prescribed energy threshold level, the message is not forwarded to that node n. Once in the geocast region, the energy level of the receiving nodes is again checked. If the energy level of such receiving node it is less than the prescribed energy threshold, such a node will only receive one data packet and will be prevented from transmitting the messages further.
    For the calculation of the energy threshold E T , the residual energy of each neighbour node of the source node is calculated. We consider CurrentEnergy(node) the residual energy of the source/intermediate node and neighbourEnergy(node) the residual energy of the neighbor node of the source node. These are calculated as
    C u r r e n t E n e r g y ( n o d e ) = g e t C u r r e n t E n e r g y ( s r c e / i n t e r , n o d e )
    n e i g h b o u r E n e r g y ( n o d e ) = g e t C u r r e n t E n e r g y ( n e i g h b o u r ) ,
    where g e t C u r r e n t E n e r g y ( ) is a function that returns the residual energy of the corresponding node. The energy threshold level E T of a node is obtained as:
    E T = n e i g h b o u r E n e r g y ( n o d e ) / c o u n t ,
    where c o u n t is the total number of neighbours of the current node.
    It should be noted that in this work, E T is referred to as a forwarding utility metric because the selection of a suitable relay node to forward the message is based on the above mentioned formulae.
  • Selecting a relay node based on the forwarding utility metric.
  • Message dissemination using the Check-and-Spray controlled flooding methodology: The message dissemination within the cast is a typical floating content issue, which offers an opportunity to enable the localized information sharing without the need for an infrastructure, data collection or central control. Ultimately, it offers some degree of privacy by not allowing the remote access to the content within a defined geographical location. Besides, flooding a message is resource consuming, but can guarantee an optimum message delivery ratio. In our proposed EECSG routing protocol, an energy-efficient controlled flooding methodology (referred to as Check-and-Spray) is designed to distribute the geo messages to all the nodes within the geocast region. It consists of two parts. In the first part, the node’s energy level is checked against the threshold. The presence of the already existing message in the receiving node cast and the receiving node’s current location are checked. In the second part, the message is flooded to only those nodes which have passed all the checks mentioned in the first part. Afterwards, the receivers become the senders and the Check-and-Spray method is re-invoked. This process is continued until it is resumed. Due to the first part, this controlled flooded technique tend to consume less energy.
Algorithm 1 EECSG protocol.
   
Phase 1: Forwarding the message towards the destination cast
1:
for each Sender Node(SN) meets the receiver node(RN) do
2:
    Calculate the Energy Threshold(ET)
3:
    if RN energy is < ET then
4:
        Skip this RN and go to the next node
5:
    end if
6:
    Drop Expired Messages from the Buffer
7:
    Apply Buffer Scheduling Policy
8:
    for each message m in the buffer do
9:
        if m already exists in RN then
10:
           Skip this m and goto the next m in the loop
11:
        end if
12:
        if RN is located in geocast area then
13:
           forward message to RN
14:
           S = 0
15:
        else if S > 0 then
16:
           S = S - 1
17:
           Forward a copy to RN
   
Phase 2: Flooding the message to nodes within the geocast region
18:
        else if S = 0 and m is in geocast region then
19:
           if RN is inside the destination geocast then
20:
               if SN energy is greater than threshold then
21:
                   if RN does not have the m already then
22:
                       Forward m to RN
23:
                   end if
24:
               end if
25:
           end if
26:
        end if
27:
    end for
28:
end for
An illustration of the working of the proposed EECSG routing protocol is shown in Figure 1. where the parent node in blue colour generates a message with the sequence number 3 (this is because here, the message should be able to reach the destination cast in 3 hops, otherwise it will be lost). The node in blue colour meets with its first neighbor node (node in red colour on the right) and finds out that its energy level is lower than the prescribed energy level threshold (ET). In this case, the message is not sent to that node in red and the node in blue looks for its next neighbor (node in green colour) with a good energy level, then delivers the message by decrementing the sequence number S to 2 (i.e., S = S−1). For each encountered node with a good energy level, the message is delivered by decrementing the sequence number. If S becomes 0 and the node is not in the geocast area, the message will not be forwarded further and will be considered as lost. As soon as the destination node receives the message within the geocast area, it will start implementing a check-and-wait technique for controlled flooding of the message within the geocast area. Afterwards, the nodes in yellow colour, which have shown a good energy level are those that will take part in the dissemination of the message across all neighboring nodes. The nodes in red colour, which have shown an energy level less than that of the threshold level, will only receive the messages, but could not transmit them further.

4. Performance Evaluation

The proposed EECSG routing protocol is evaluated using the ONE simulator [13], and its performance is compared against that of two benchmark- routing protocols: CGOPP and GSAF, for both synthetic dataset [13] and the INFOCOM 2006 real data mobility traces [14]. In CGOPP, the messages are flooded in the geocast area using a centrality-based technique, whereas in GSAF, the messages are flooded in the geocast region by using a spray and flood technique. All the studied protocols follow a ticketing-based message forwarding mechanism from source to the destination cast.
In our simulations, the considered performance metrics are average latency, delivery ratio, number of messages forwarded, number of dead nodes, overhead ratio, and hop count, under varying parameters which are: number of nodes, buffer size and Time-to-Live (TTL).
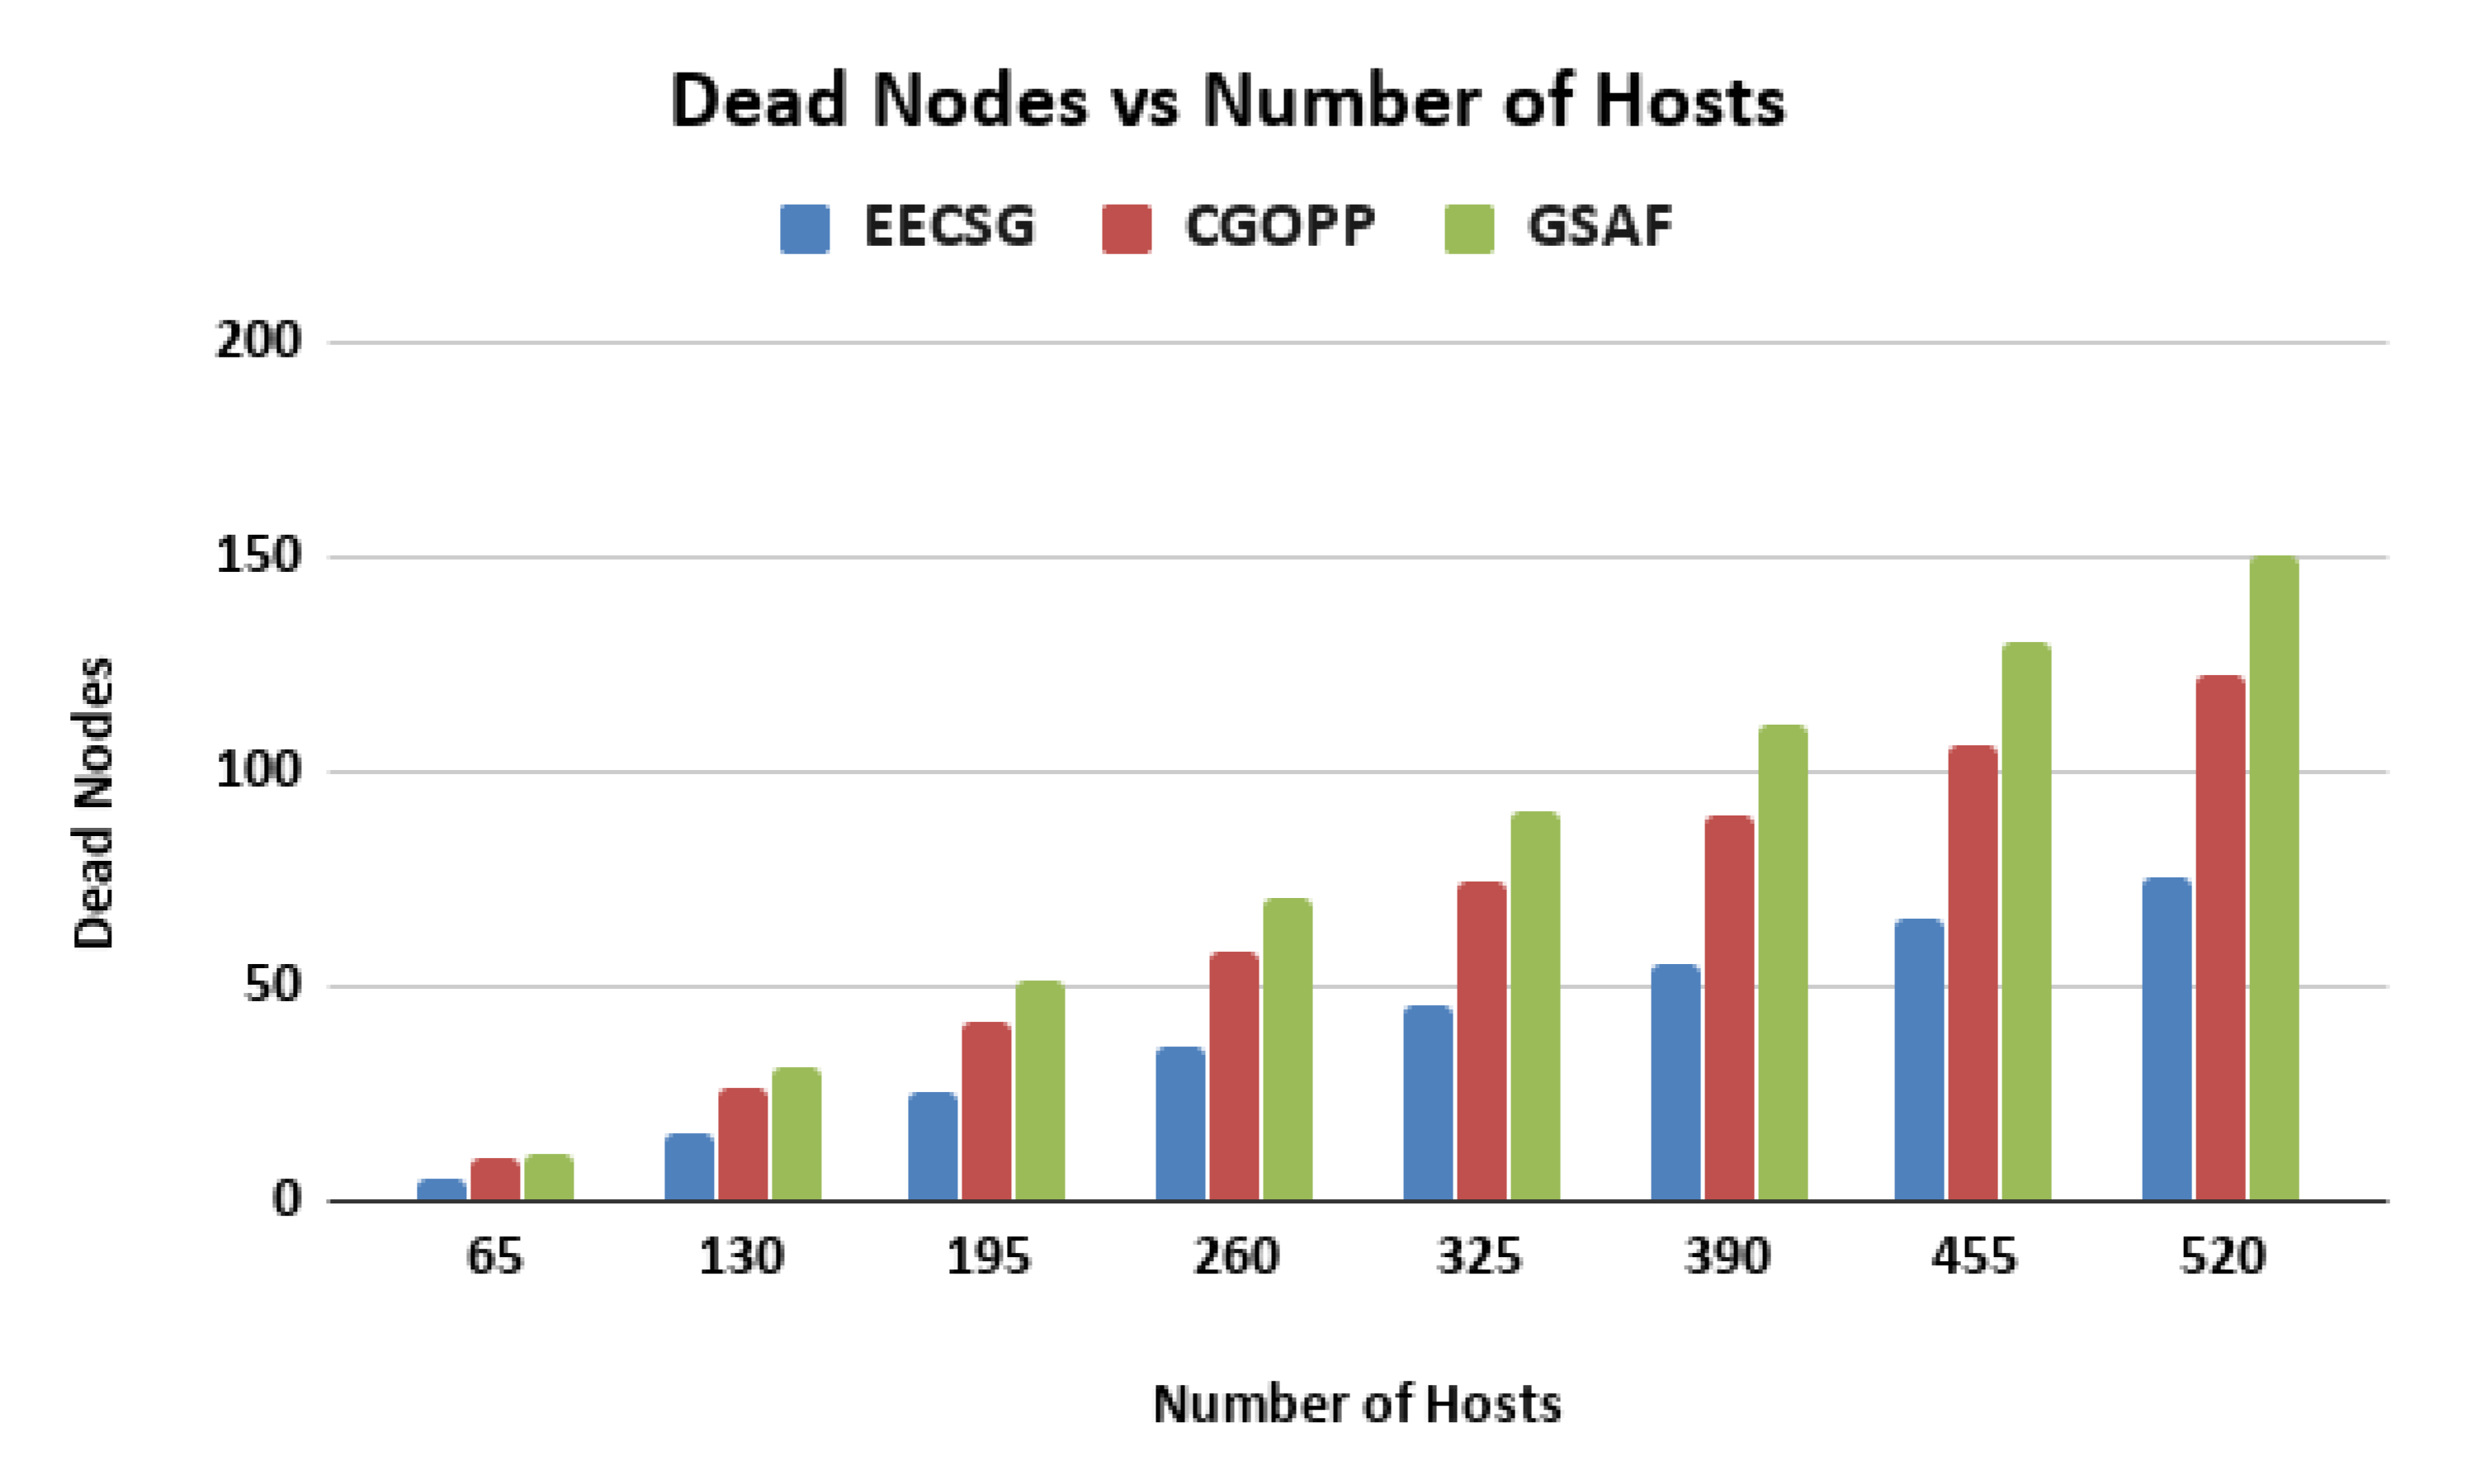
  • Number of dead nodes: This represents the number of nodes whose remaining energy are less than the prescribed minimum energy threshold at the end of the simulations. Initially, 5000 J energy is given to the node. Transmit energy of a node is 0.2 J. The battery level threshold of the node is set to 600 J. When a node’s energy is less than 600 J then it is considered as a dead node. node [15].
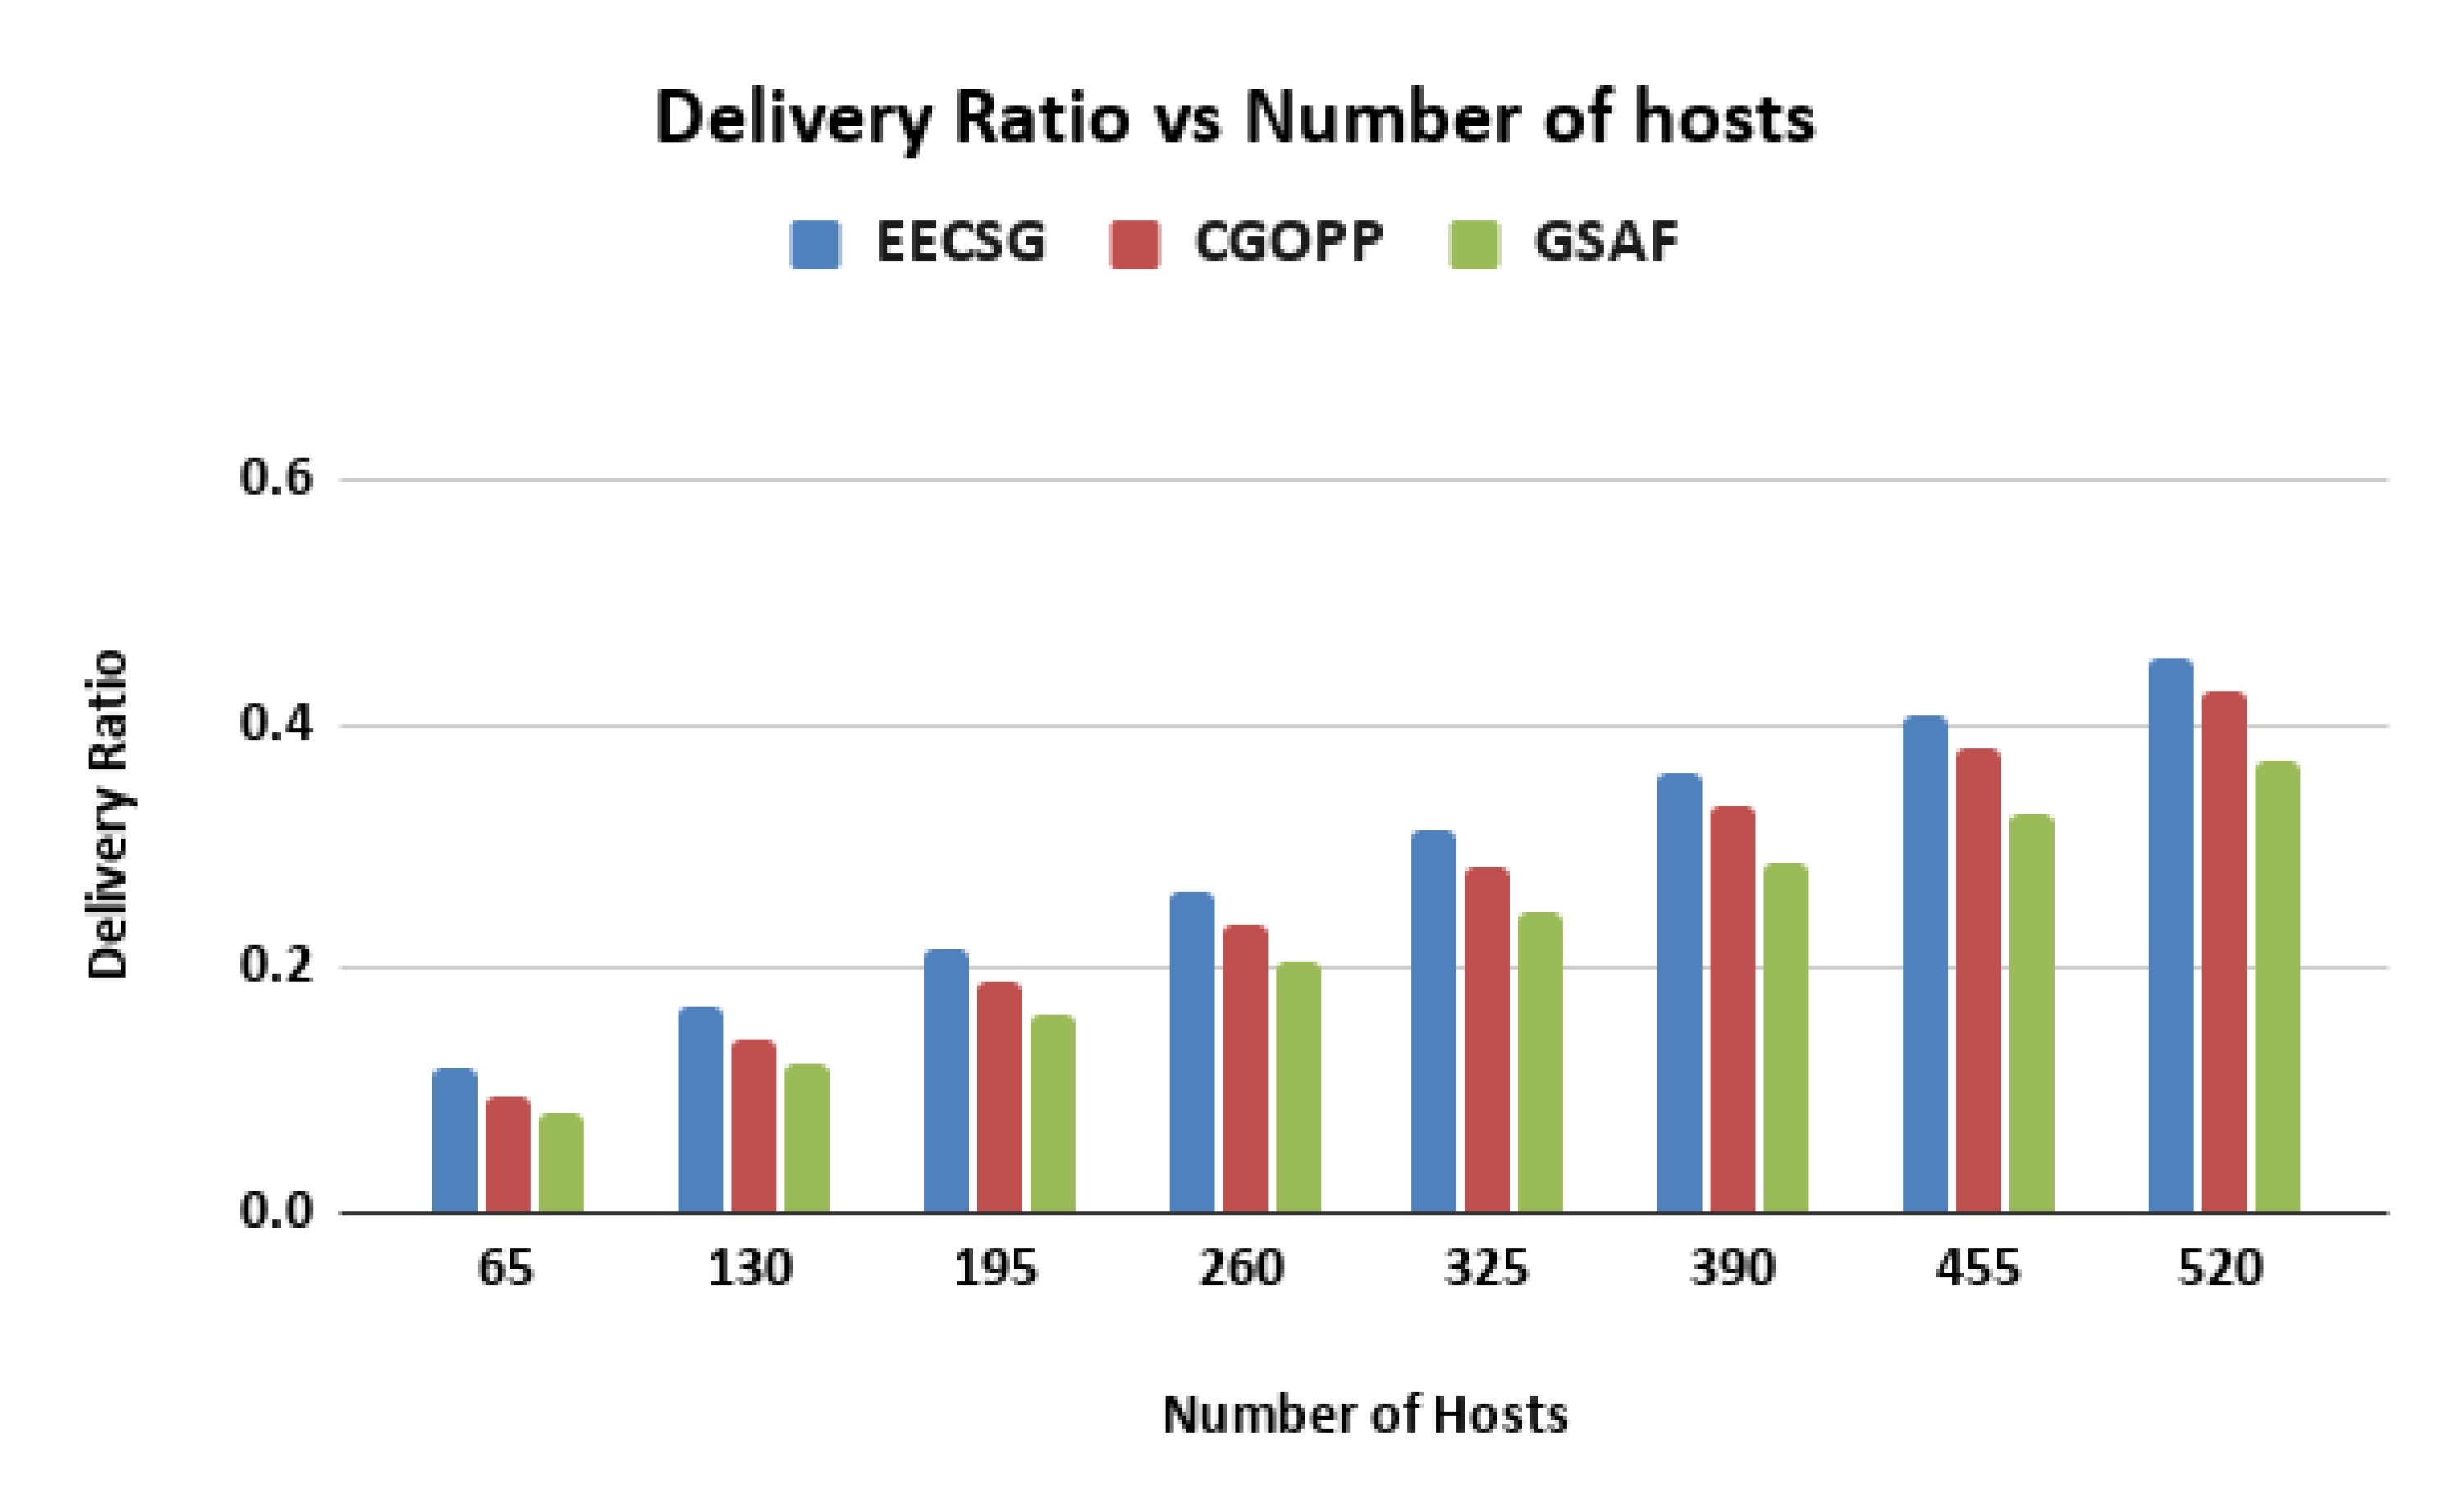
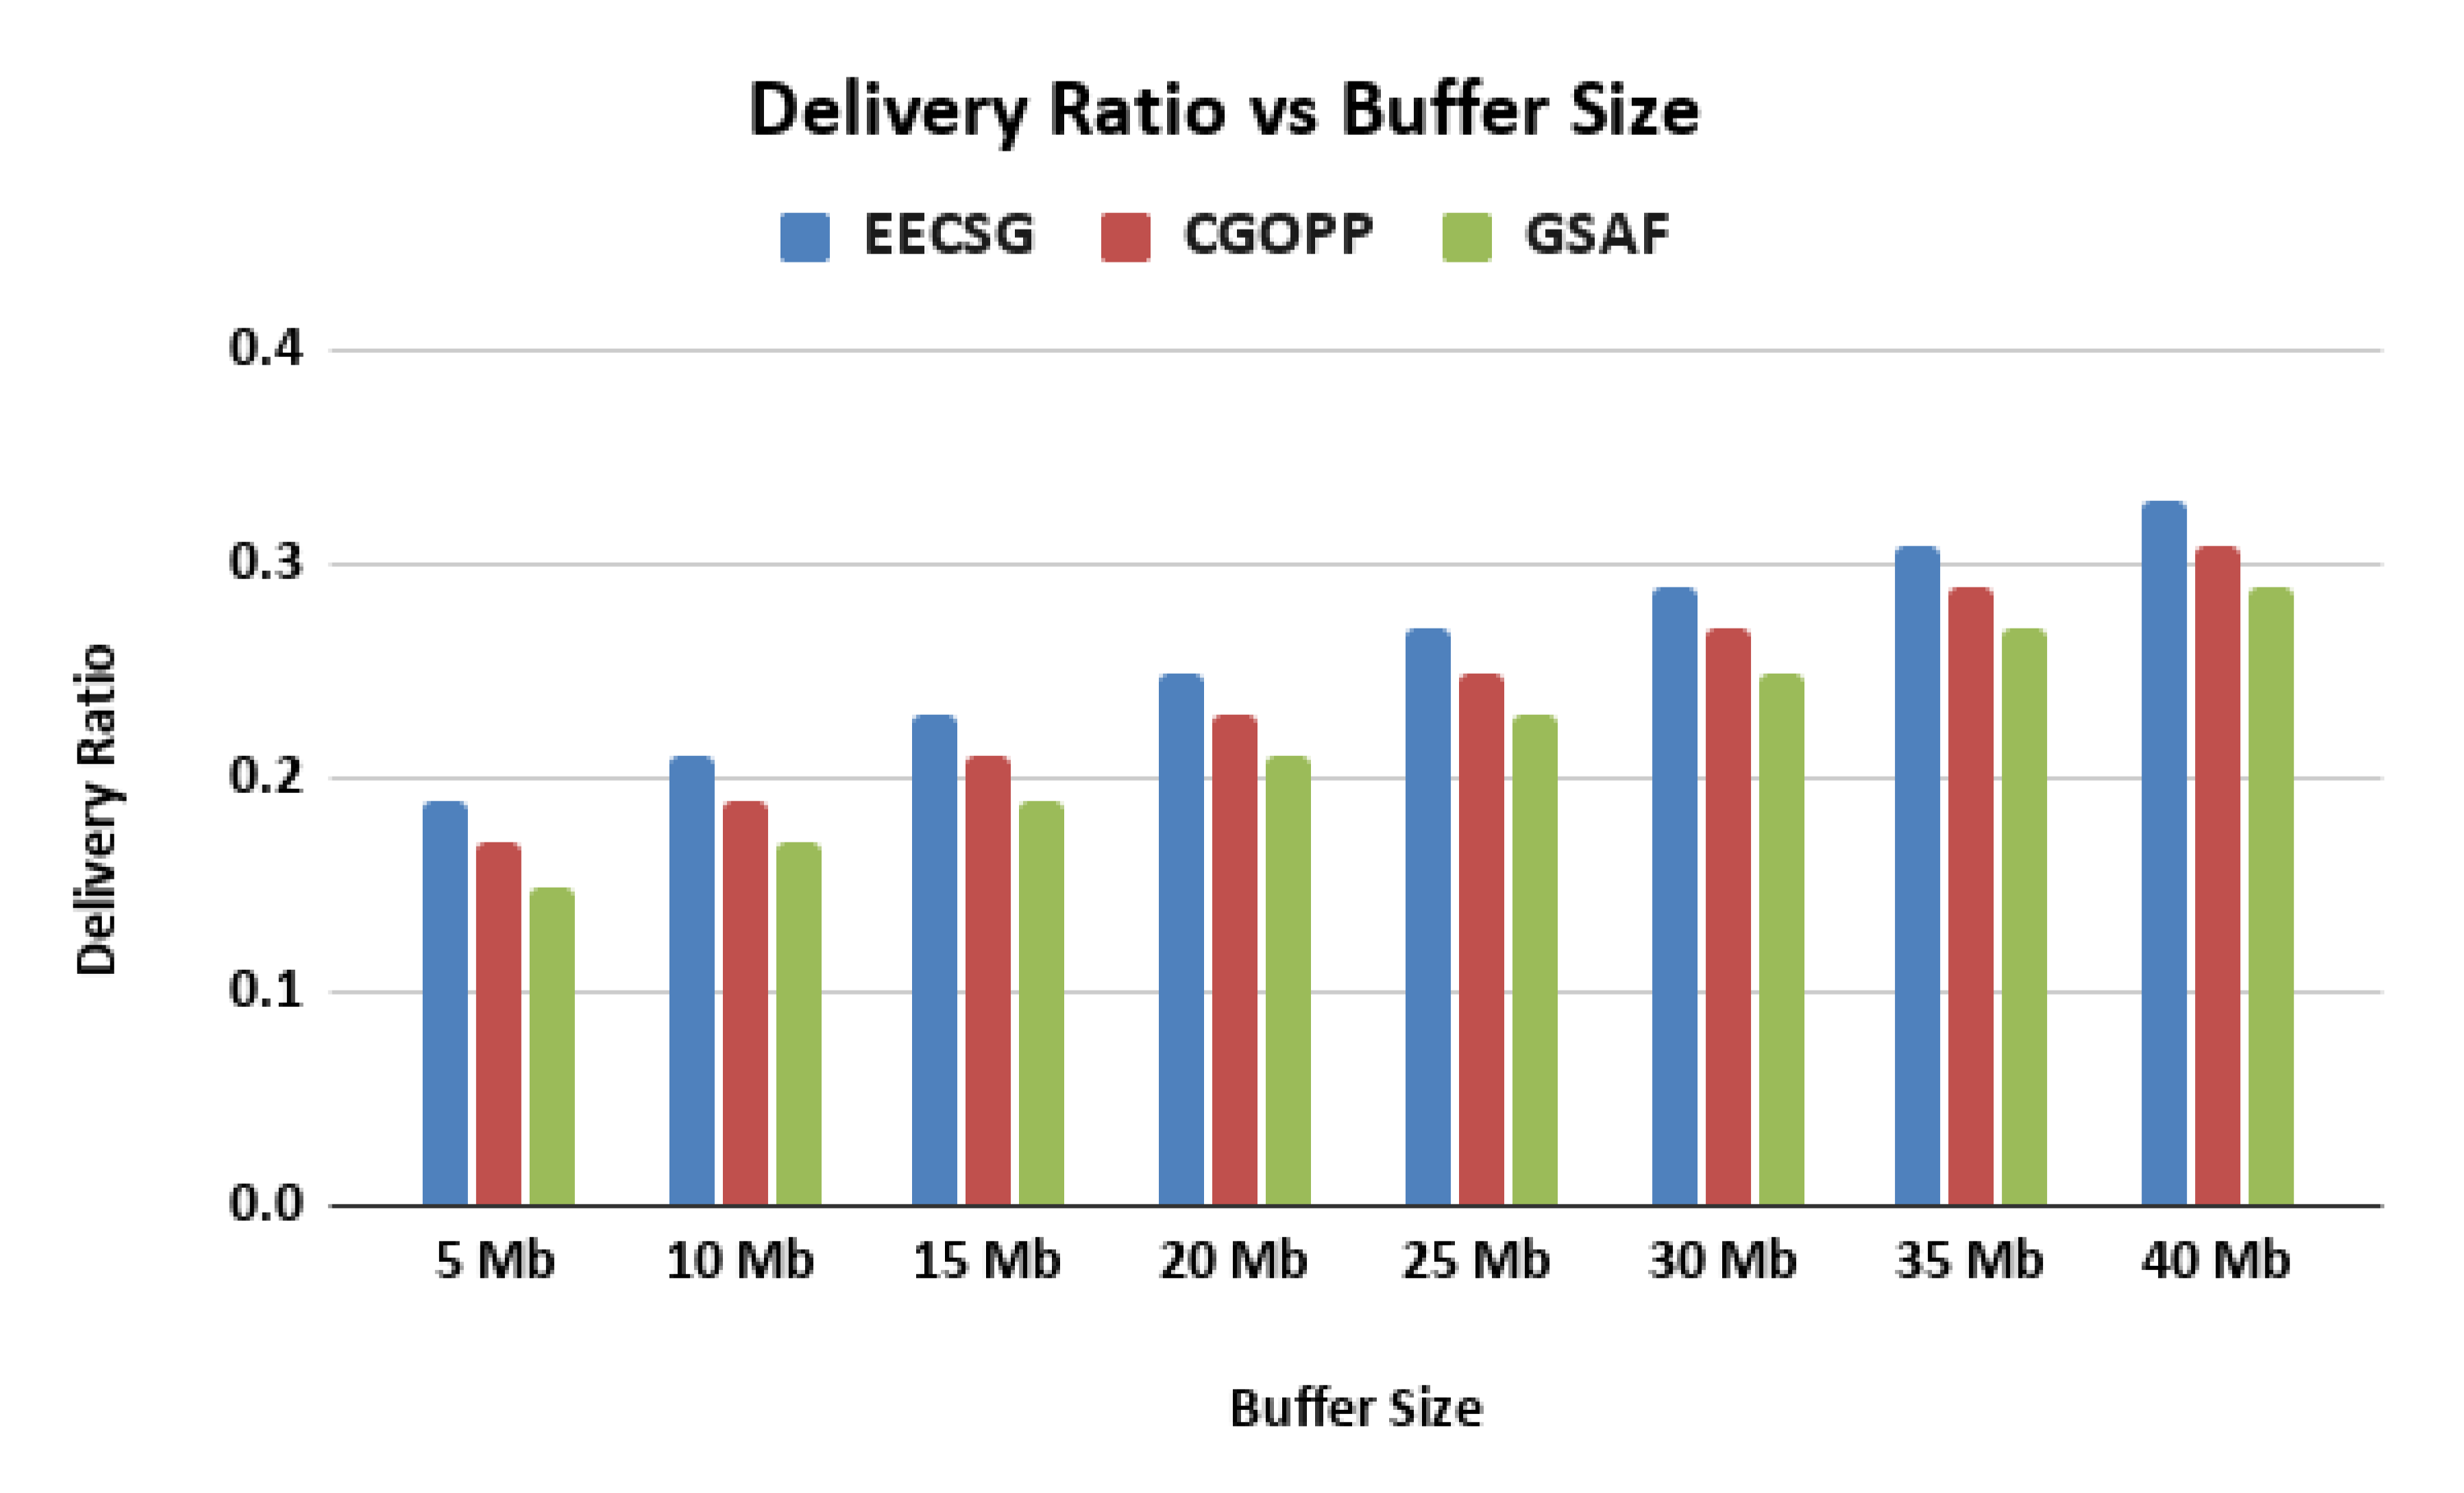
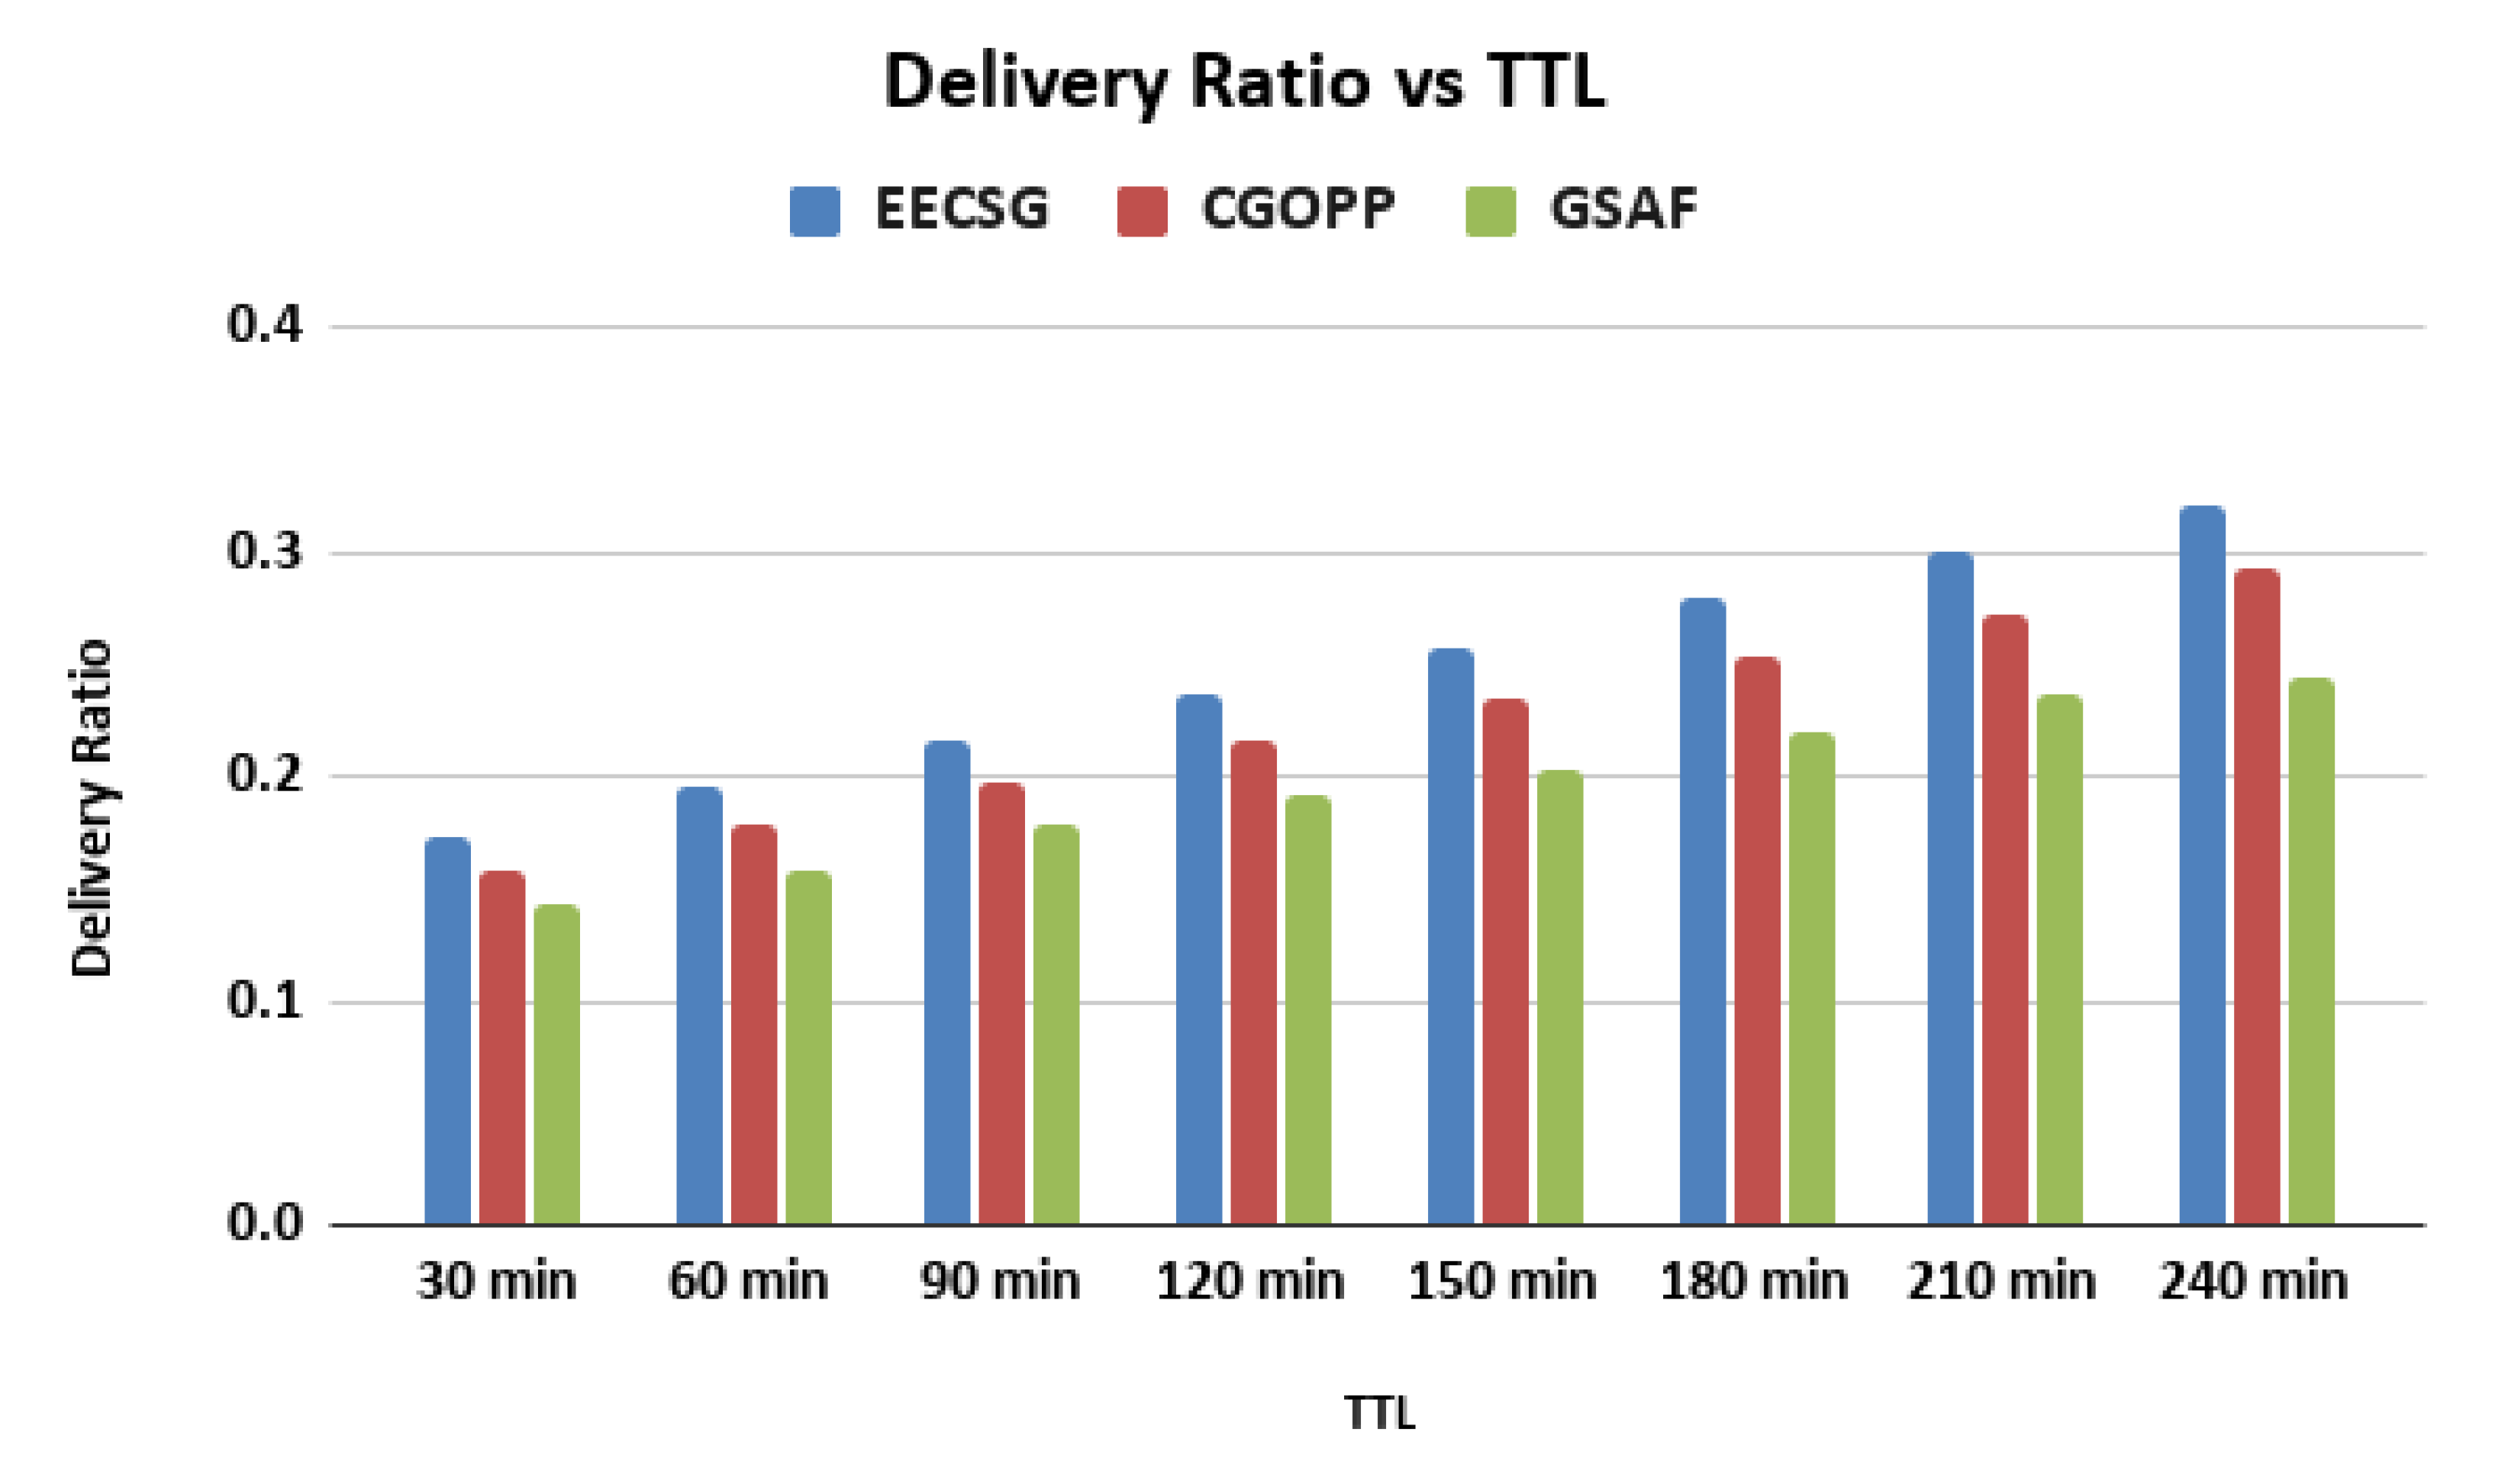
  • Delivery ratio: this is the ratio of messages successfully delivered to the destination at the end of the simulations vs. the total number of messages generated in the network.
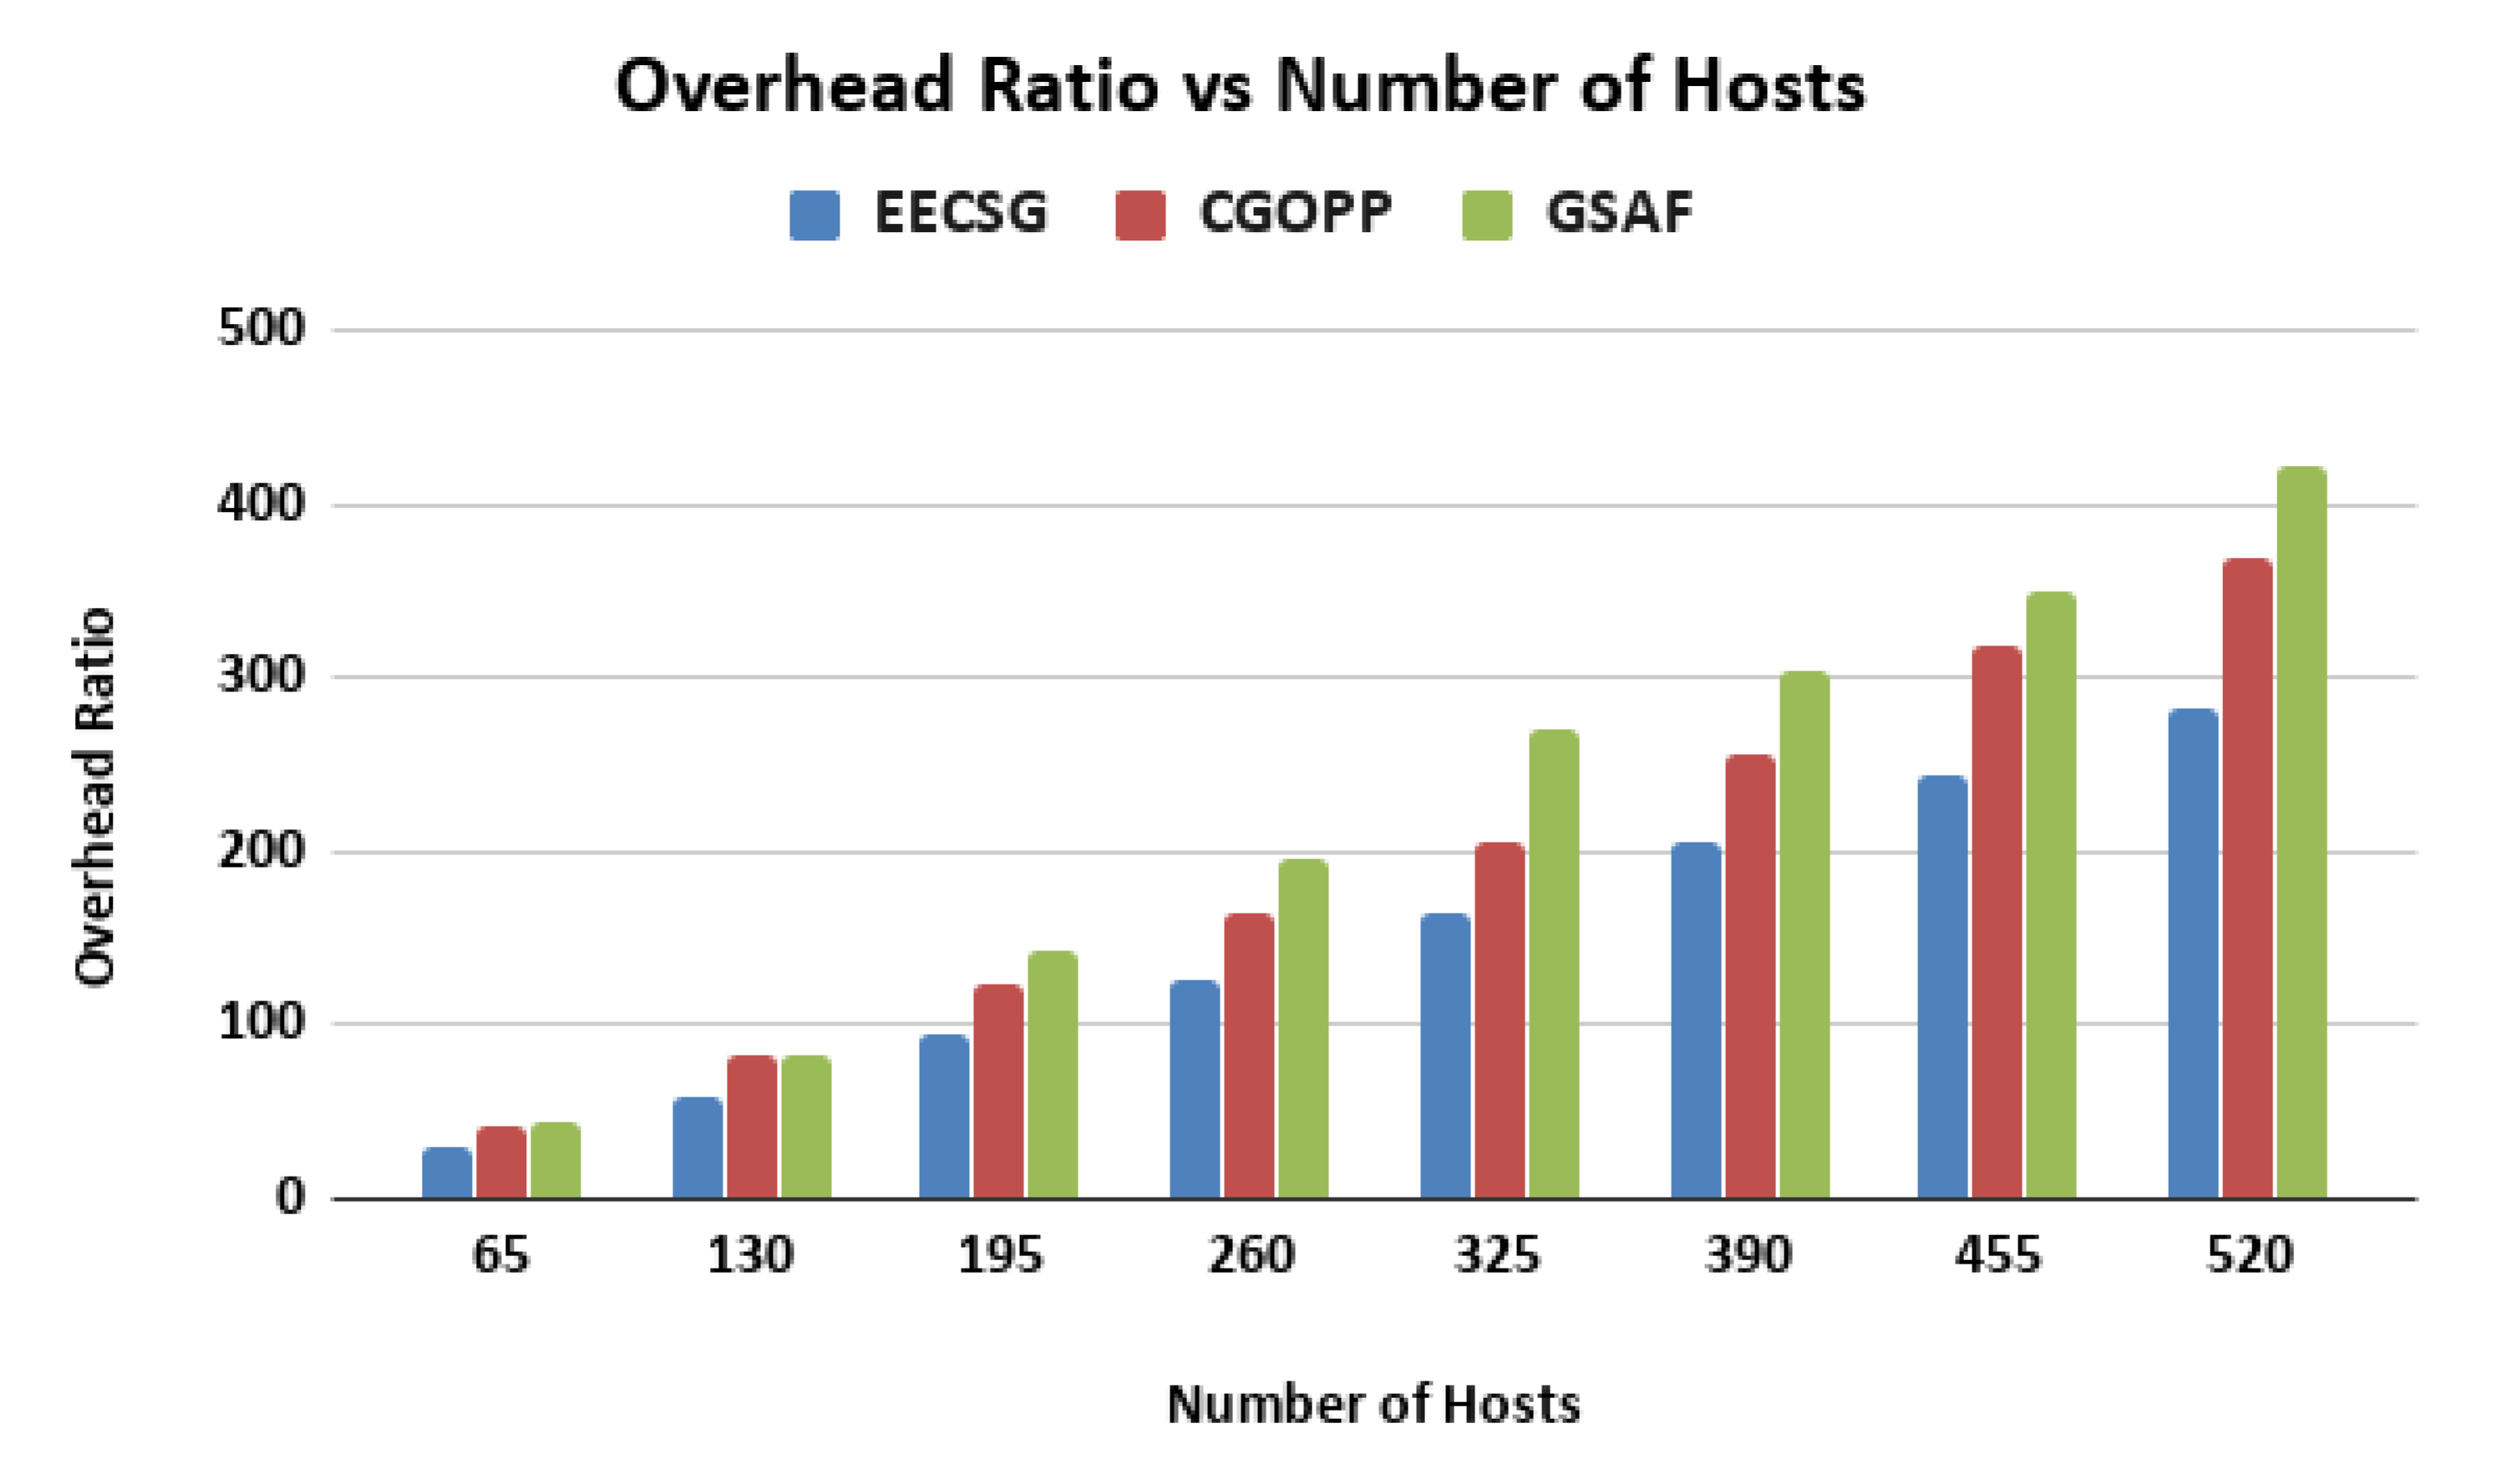
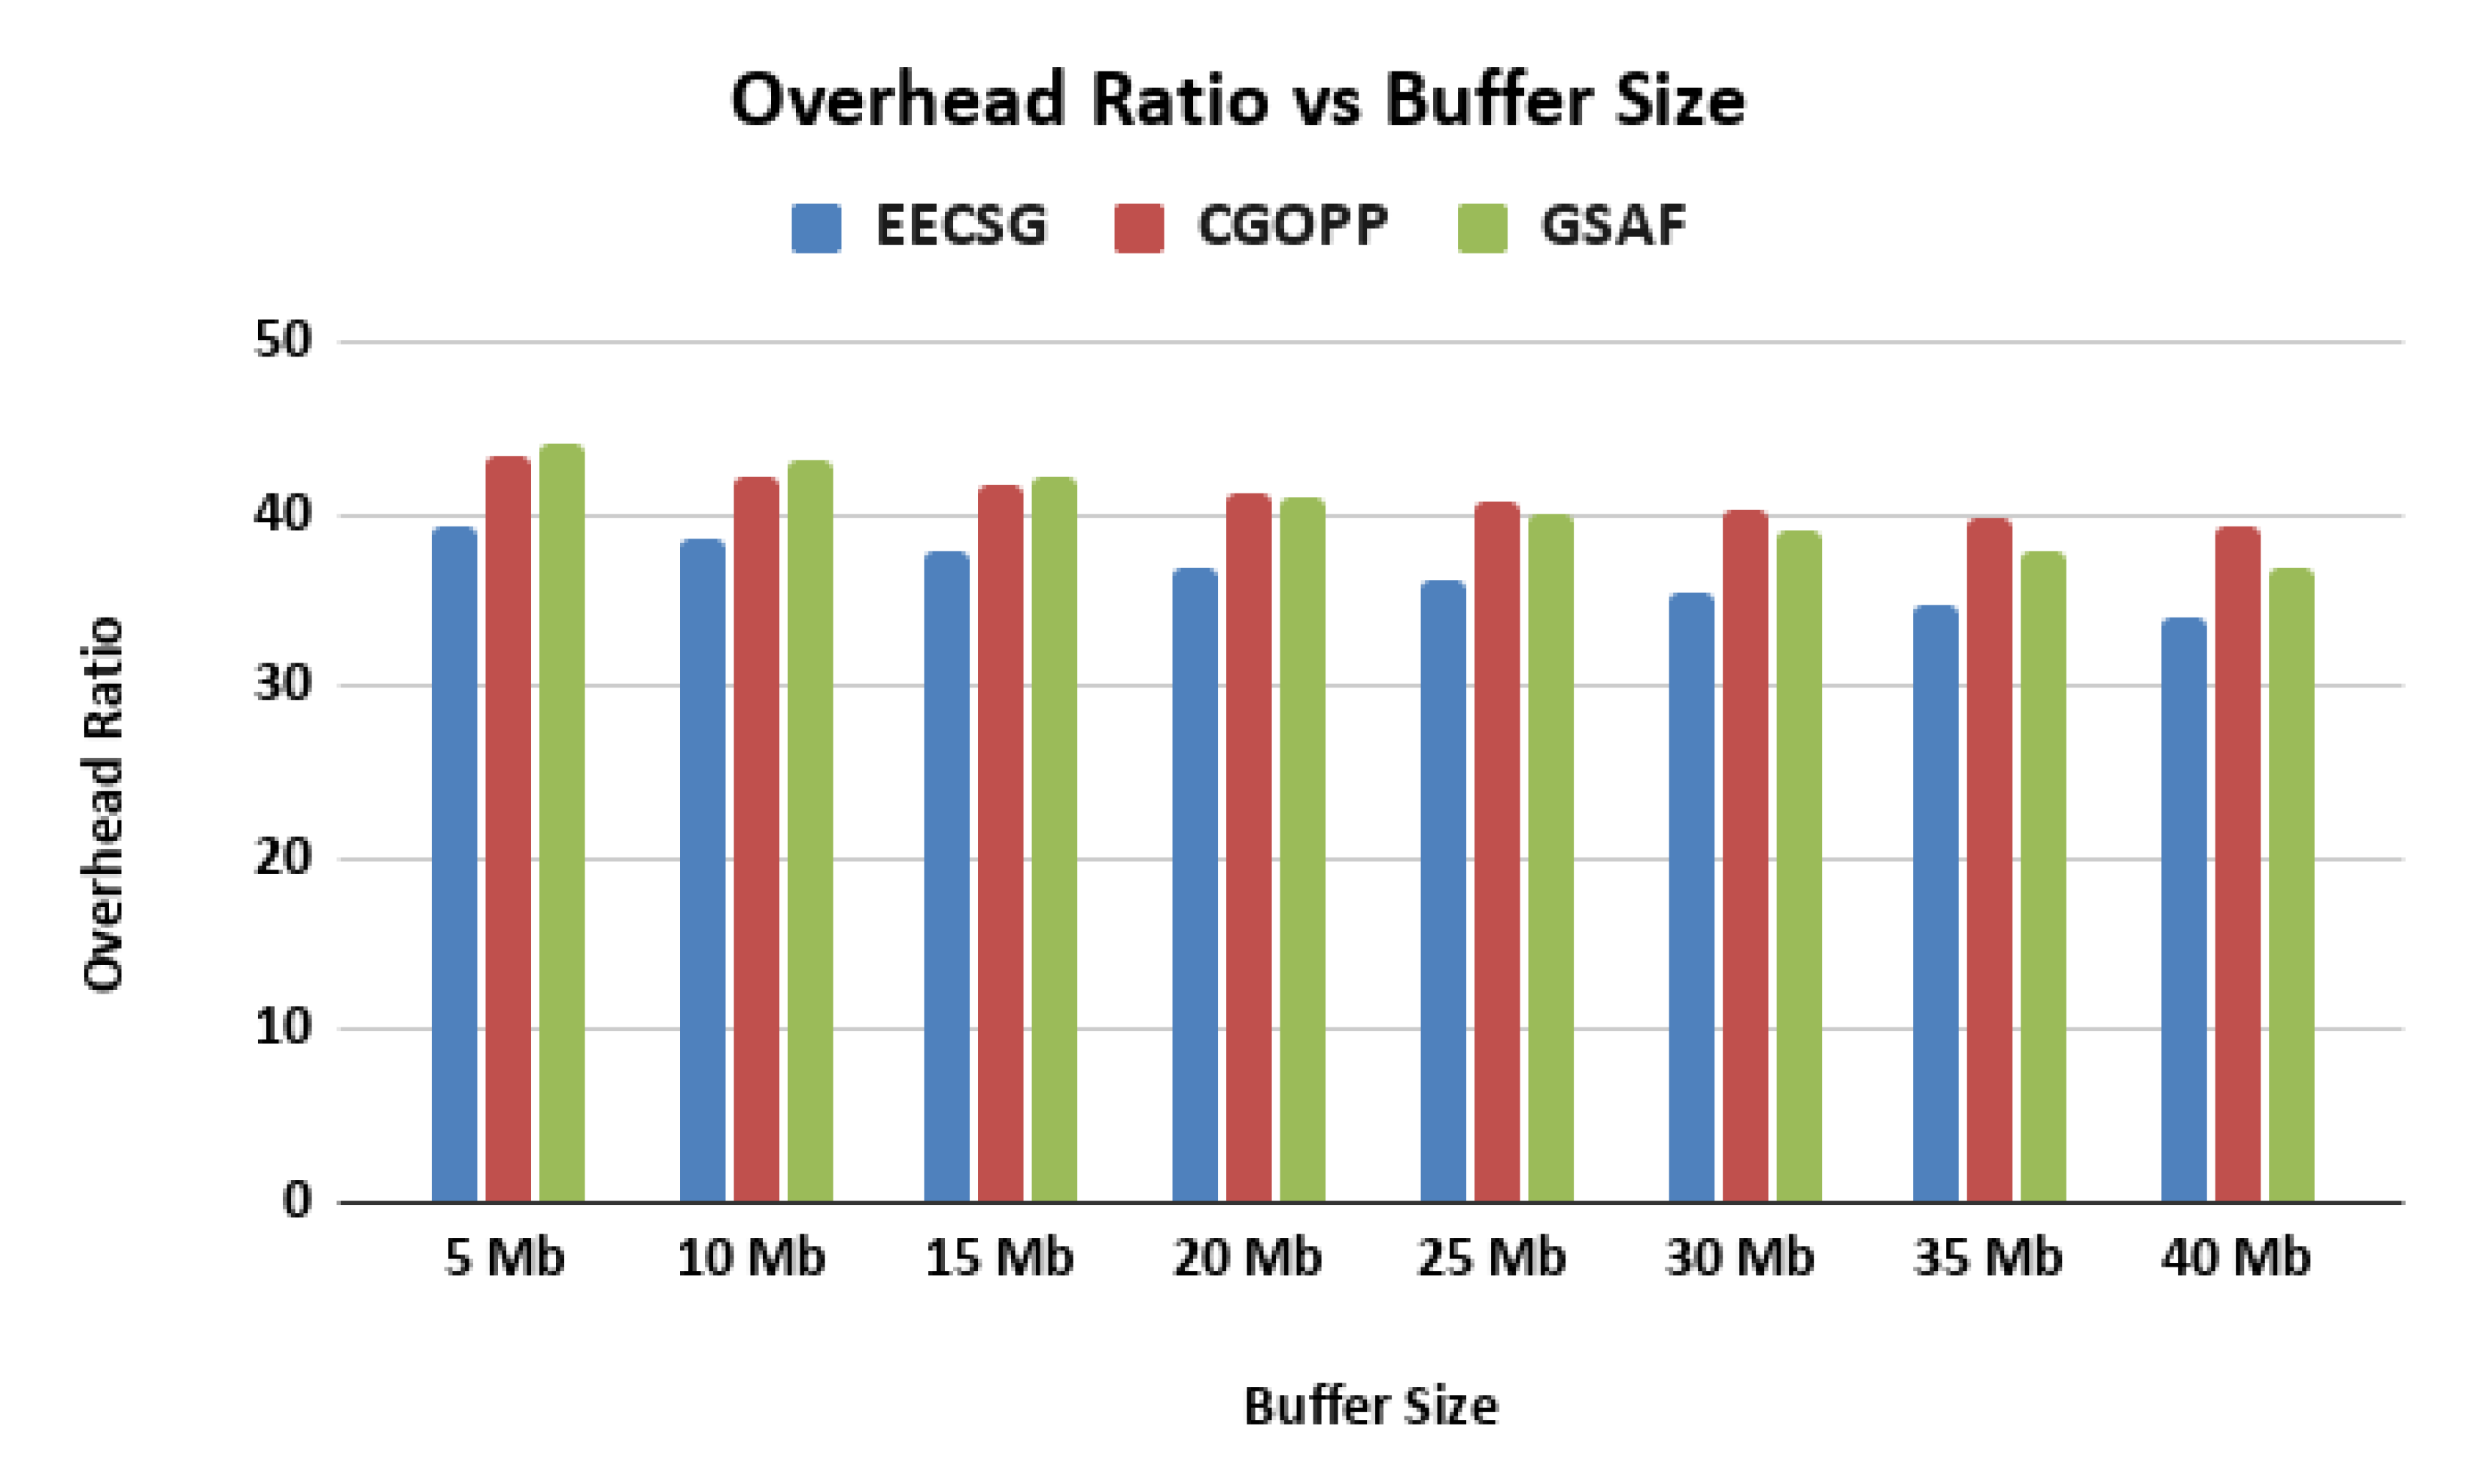
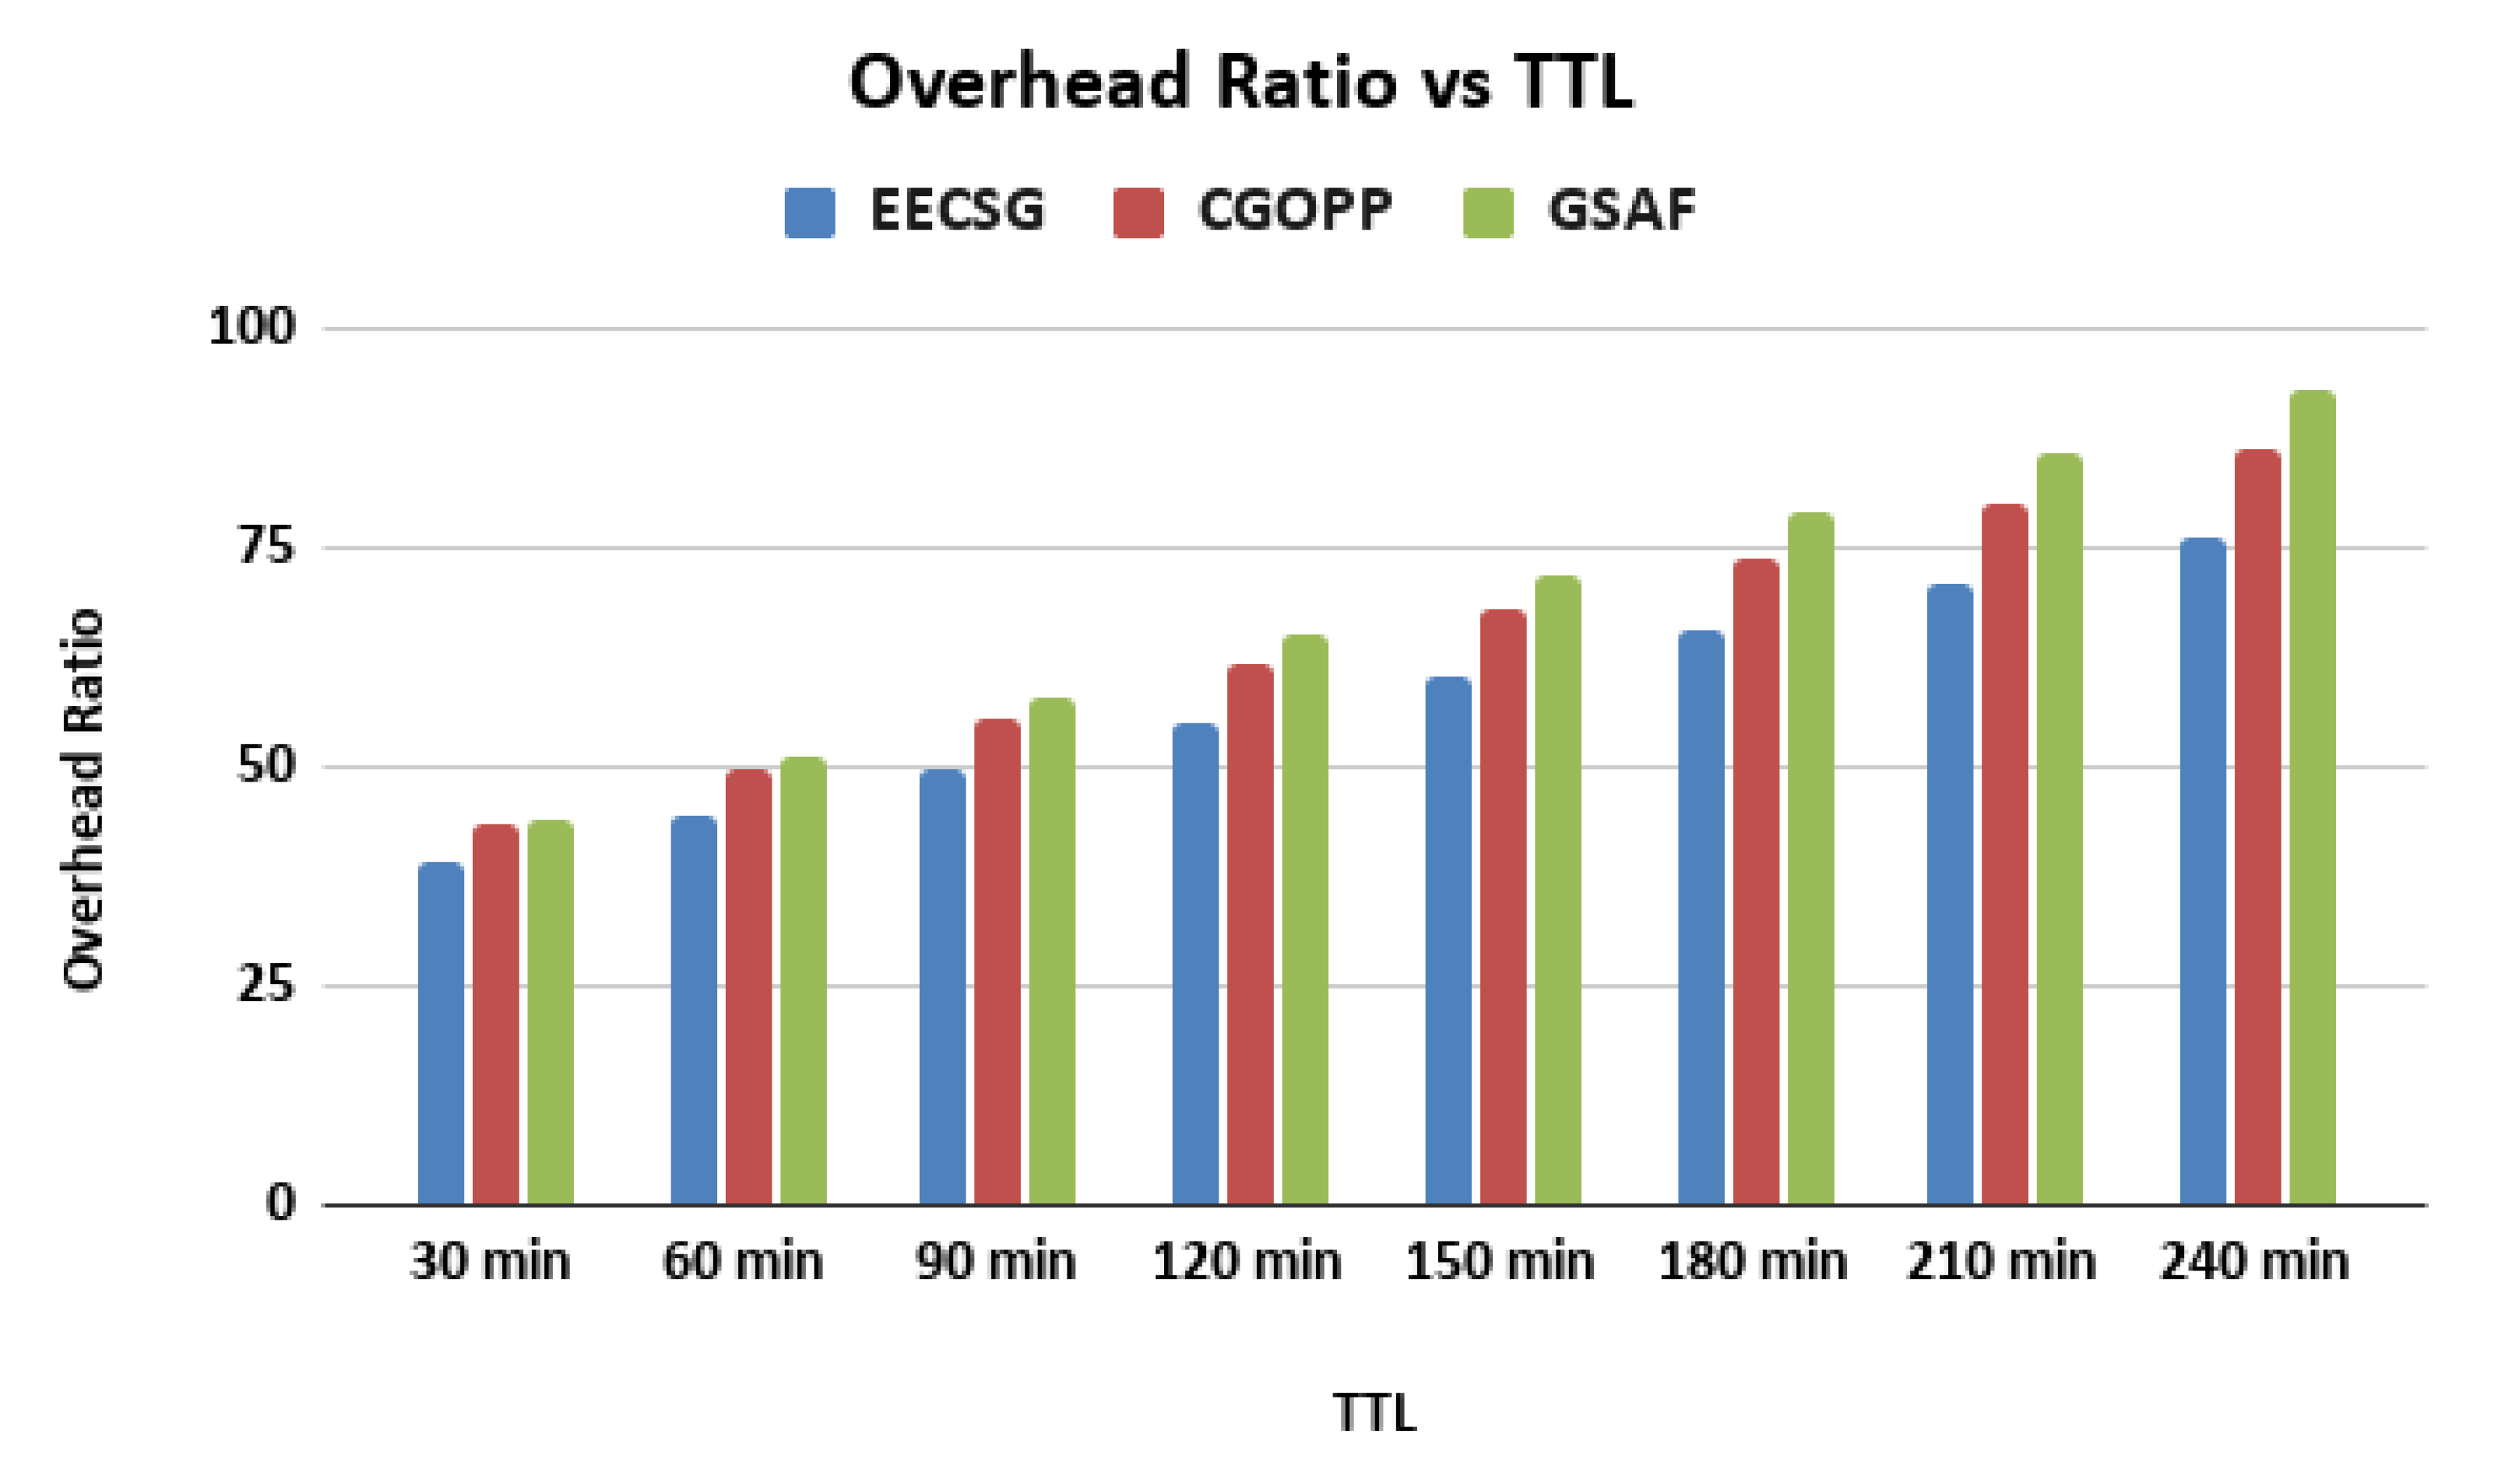
  • Overhead ratio: this is a measure of the bandwidth efficiency, calculated as:
    relayed messages delivered messages / delivered messages .
The nodes belong to six different groups of moving elements, which are pedestrian, electric motor cars, vehicles, bicycles, office workers, and tram. The map-based mobility models are used for the movements of these groups. The operations of the studied routing protocols were simulated by considering the Helsinki city map with region 4500 m × 3400 m. For evaluation purposes only, we created 16 casts on that map. We simulated our protocols using two wireless interfaces: Wi-Fi 802.11ac with a transmission speed of 433 Mbps and a range of 20 m and Bluetooth 802.16 v4.0 with transmission speed of 2 Mbps and range of 10 m. We also used eight levels of host density (65, 130, 195, 260, 325, 390, 455, 520), 195 as default number of hosts, different sizes of device buffers (5, 10, 15, 20, 25, 30, 35, 40), where 10 Mb is the default buffer size, different message lifetimes (30, 60, 90, 120, 150, 180, 210 and 240 min) (the default being 120 min).
All simulations ran for 16 h; and the warm-up and cool-down periods for each simulation were 2 h. Every simulation was repeated 5 times using different seeds for the synthetic mobility models. The messages were scheduled as follows: A sender and a destination cast were selected uniformly and at random from the set of nodes and the set of predefined casts. The message payload was set to 500 KB and a new message was scheduled every 25 to 35 s. The considered buffer scheduling policy were respectively random—meaning that the messages were randomly selected from the node’s buffer when a node encounters another one, FIFO, LIFO, HTFO and LTFO, the default being the random scheduling policy.

5. Results Analysis Using Synthetic Models

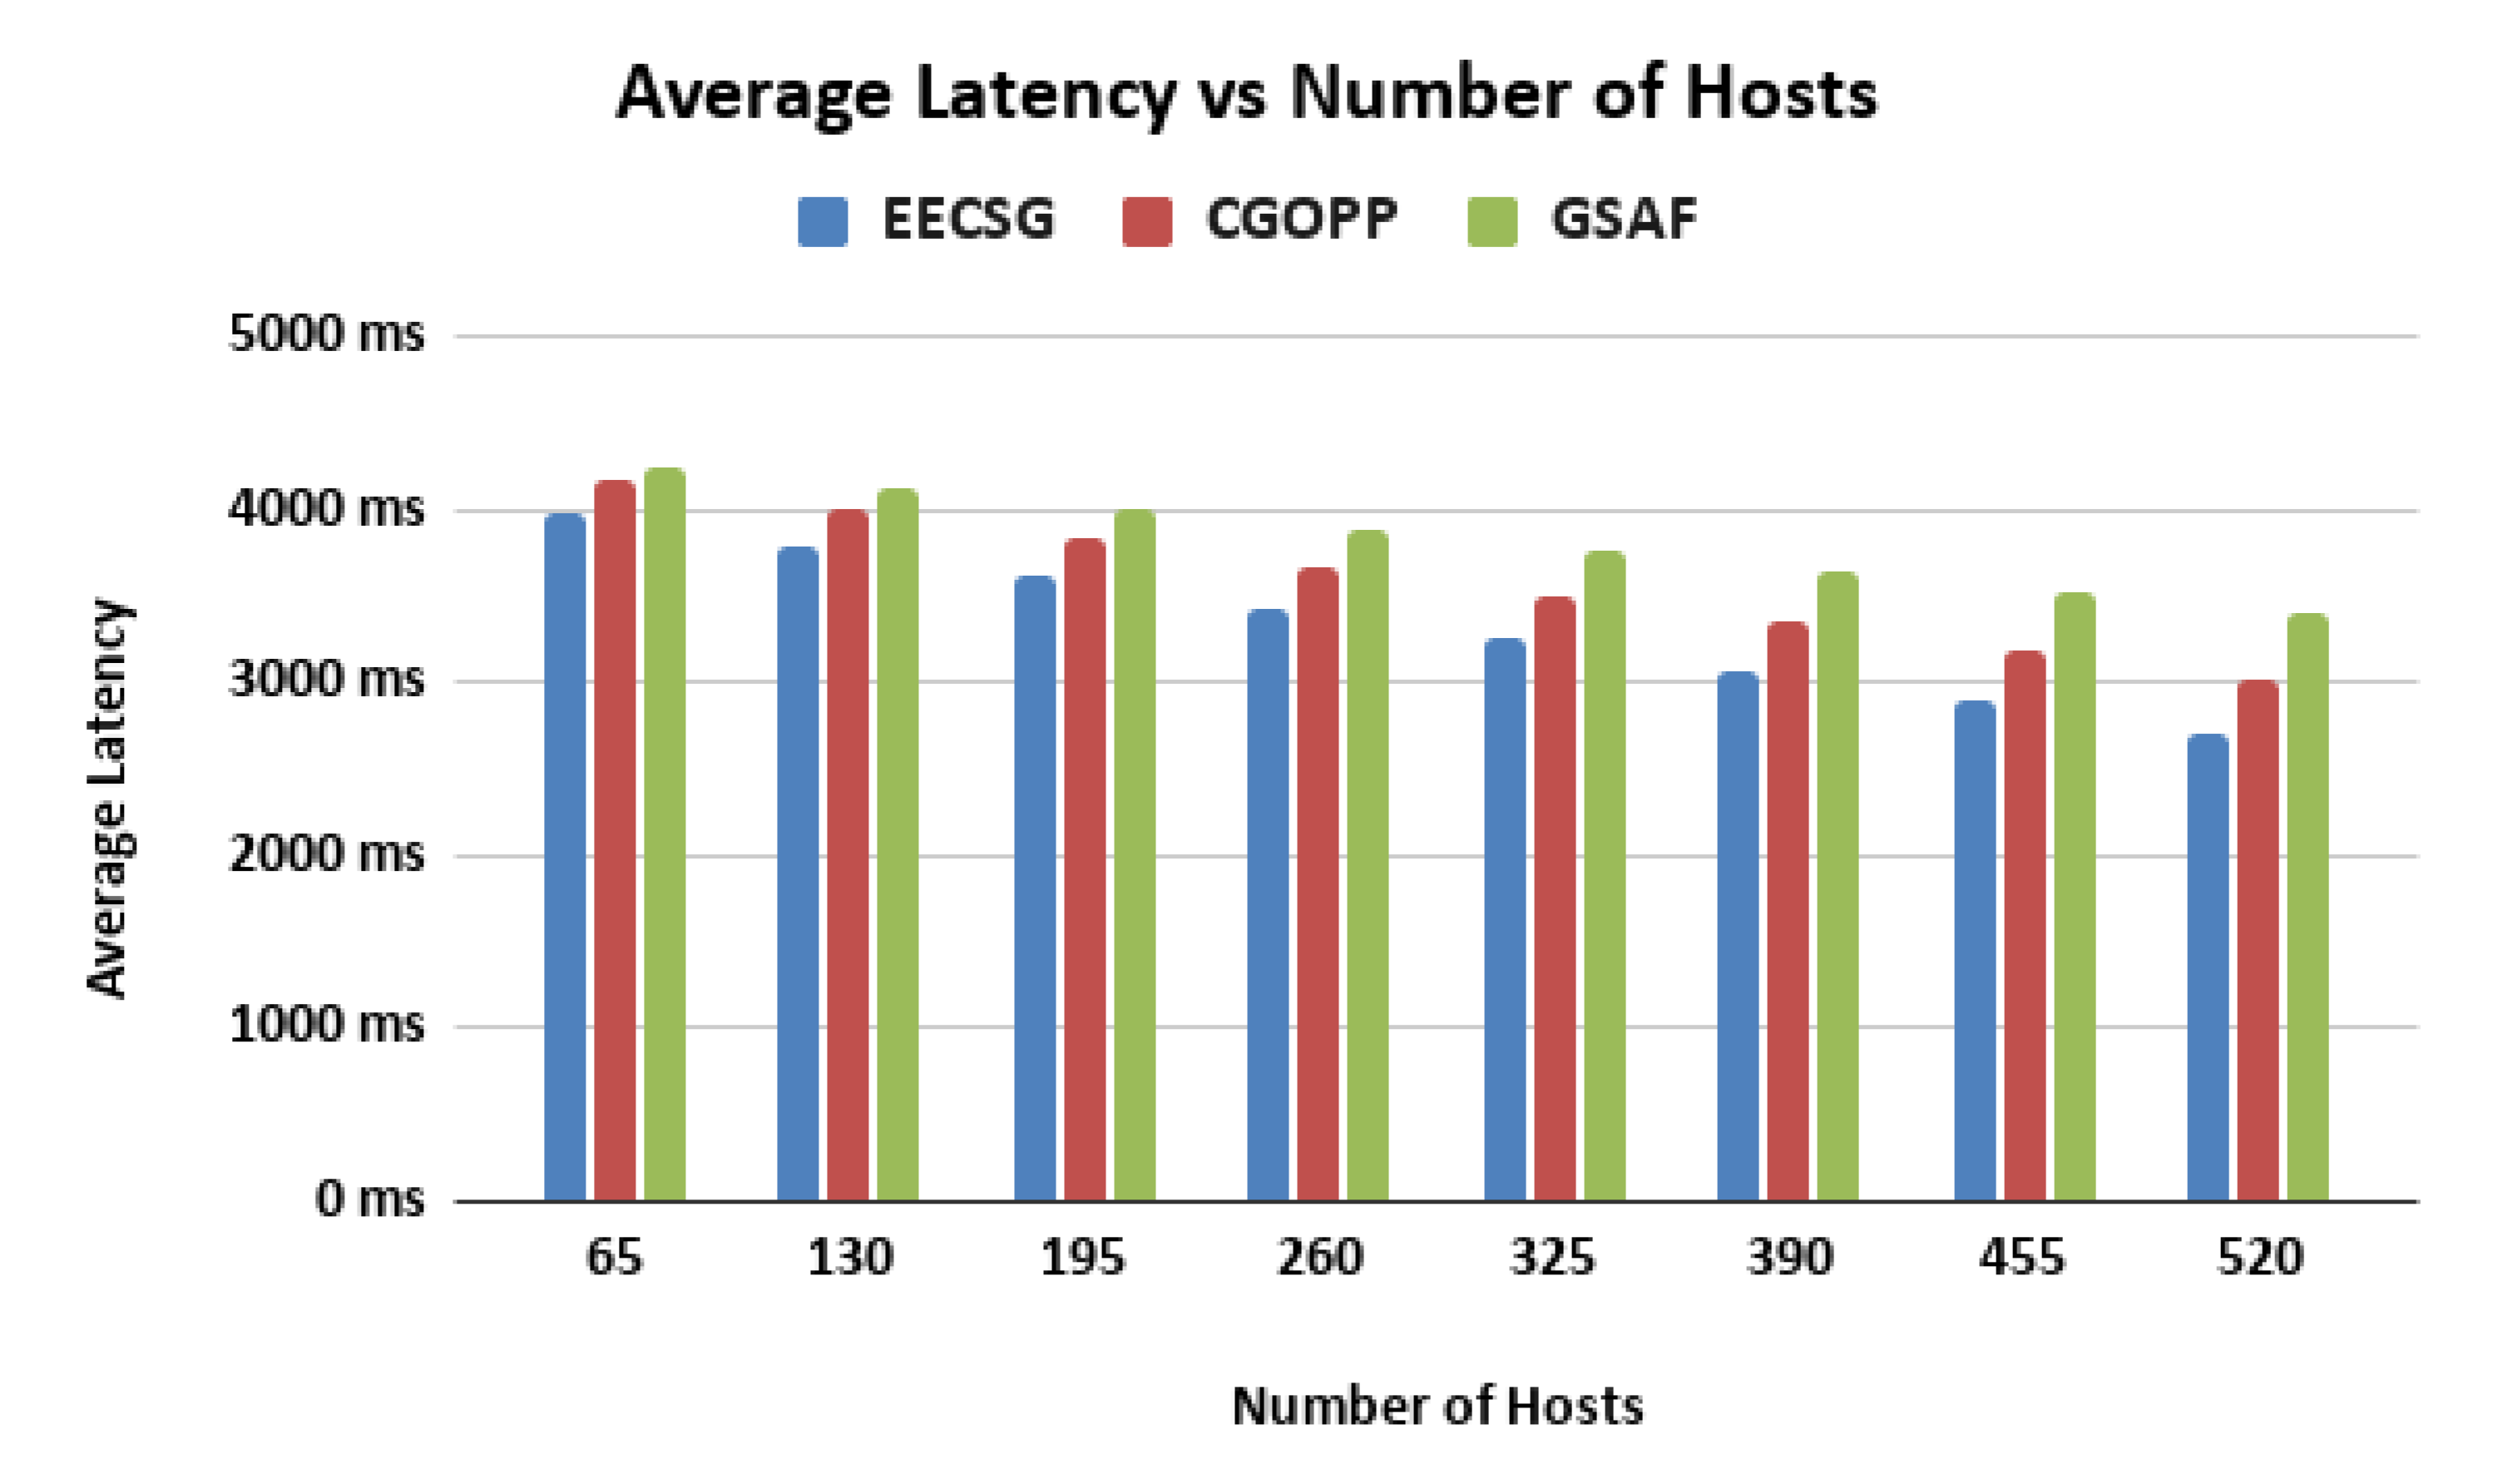
5.1. Varying the Number of Hosts

The buffer size was fixed at 10 MB and message lifetime was set to 120 min. The number of hosts was varied and the effect of this variation on the message delivery ratio, average latency, number of dead nodes, and overhead ratio, were investigated. The results are given in Figure 2, Figure 3, Figure 4 and Figure 5 respectively.
In Figure 2. It is observed that as the number of hosts increases, the delivery ratio increases. This is due to the fact that the more hosts available in the network, the better the chance of message delivery. The results also show that in terms of delivery ratio performance, our proposed EECSG scheme is about 11% better than CGOPP and 14% better than GSAF.
In Figure 3, it is observed that the average latency decreases as the number of hosts increases. This is due to the fact that, as the number of node increases, the movement and density of the nodes increases the chance of faster delivery. Increases in the number of deliveries ensure that the average latency decreases. It is also observed that in terms of average latency, EECSG outperforms both CGOPP and GSAF.
In Figure 4, it can be observed that the number of dead nodes increases as the number of hosts increases. EECSG produced the lowest number of dead nodes compared to CGOPP and GSAF. This is due to the fact that a node consumes its energy in three ways (sending, receiving, and scanning neighbors). As the number of nodes increases, their process of scanning, sending, and receiving increases automatically, which yields more dead nodes.
In Figure 5, it can be observed that the overhead ratio increases as the number of hosts increases and EECSG yields the lowest overhead ratio compared to CGOPP and GSAF. This might be due to the intrinsic Check-and-Spray mechanism used in EECSG to control the flooding of the messages within the geocast region.

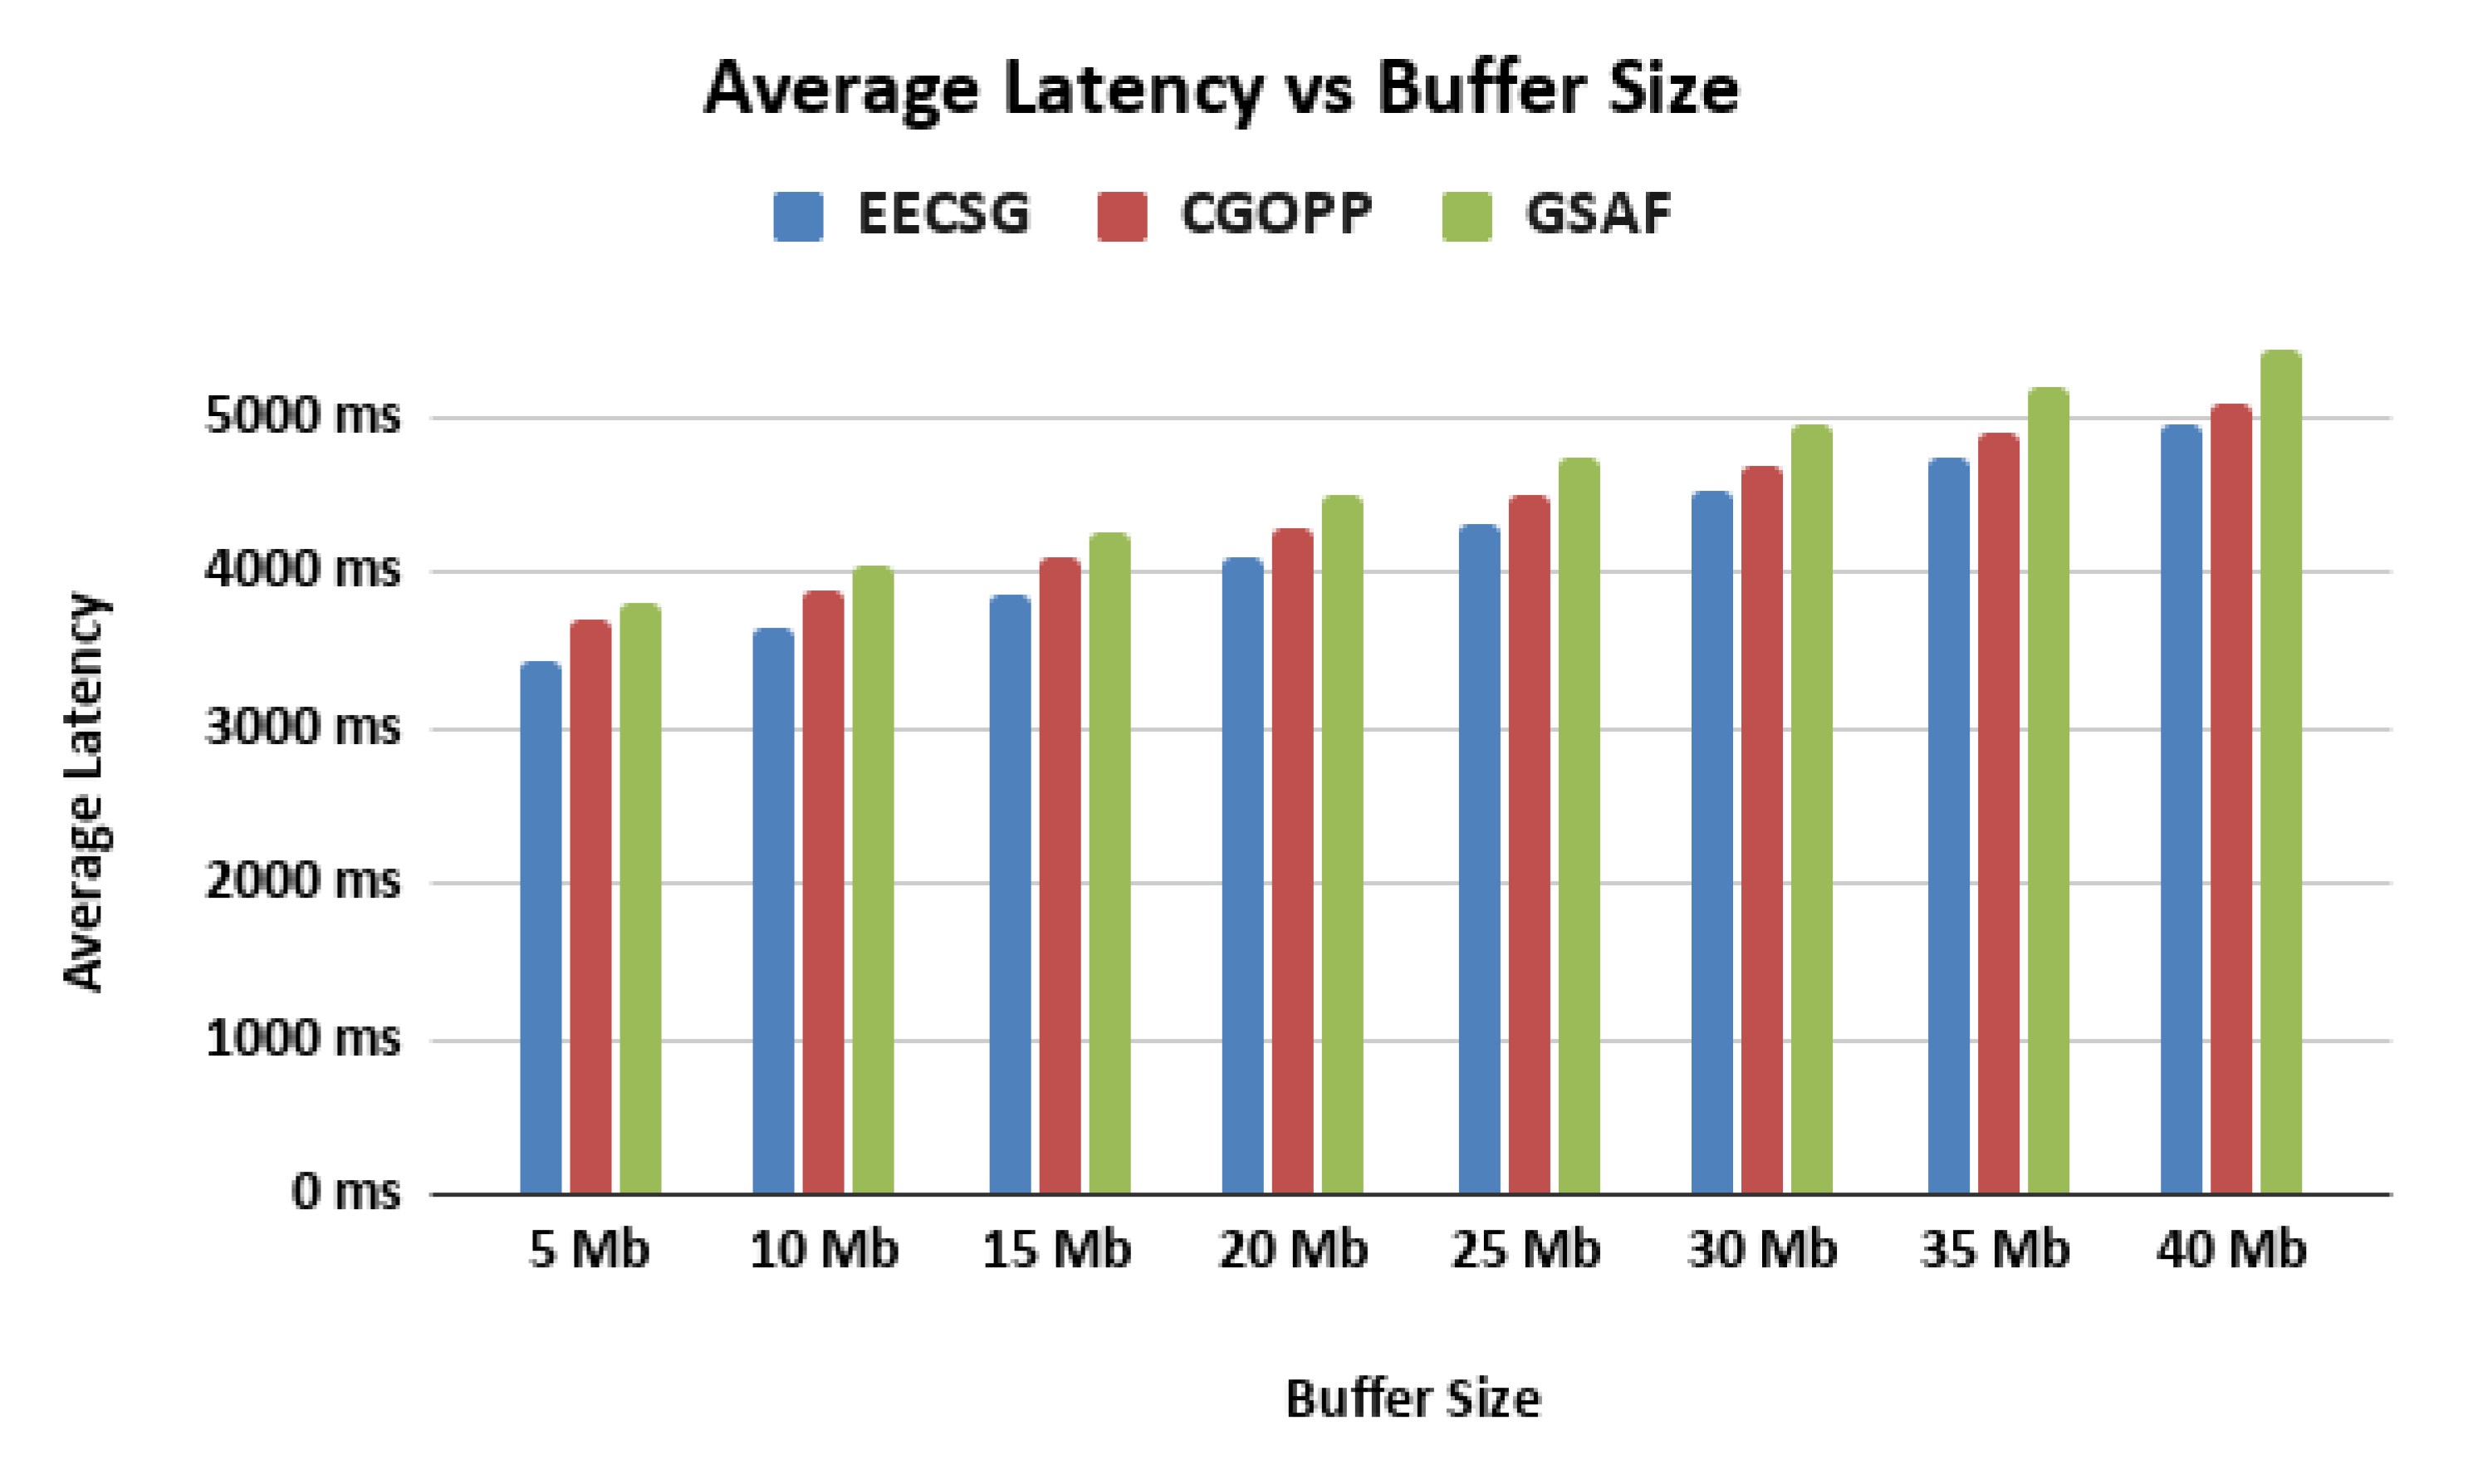
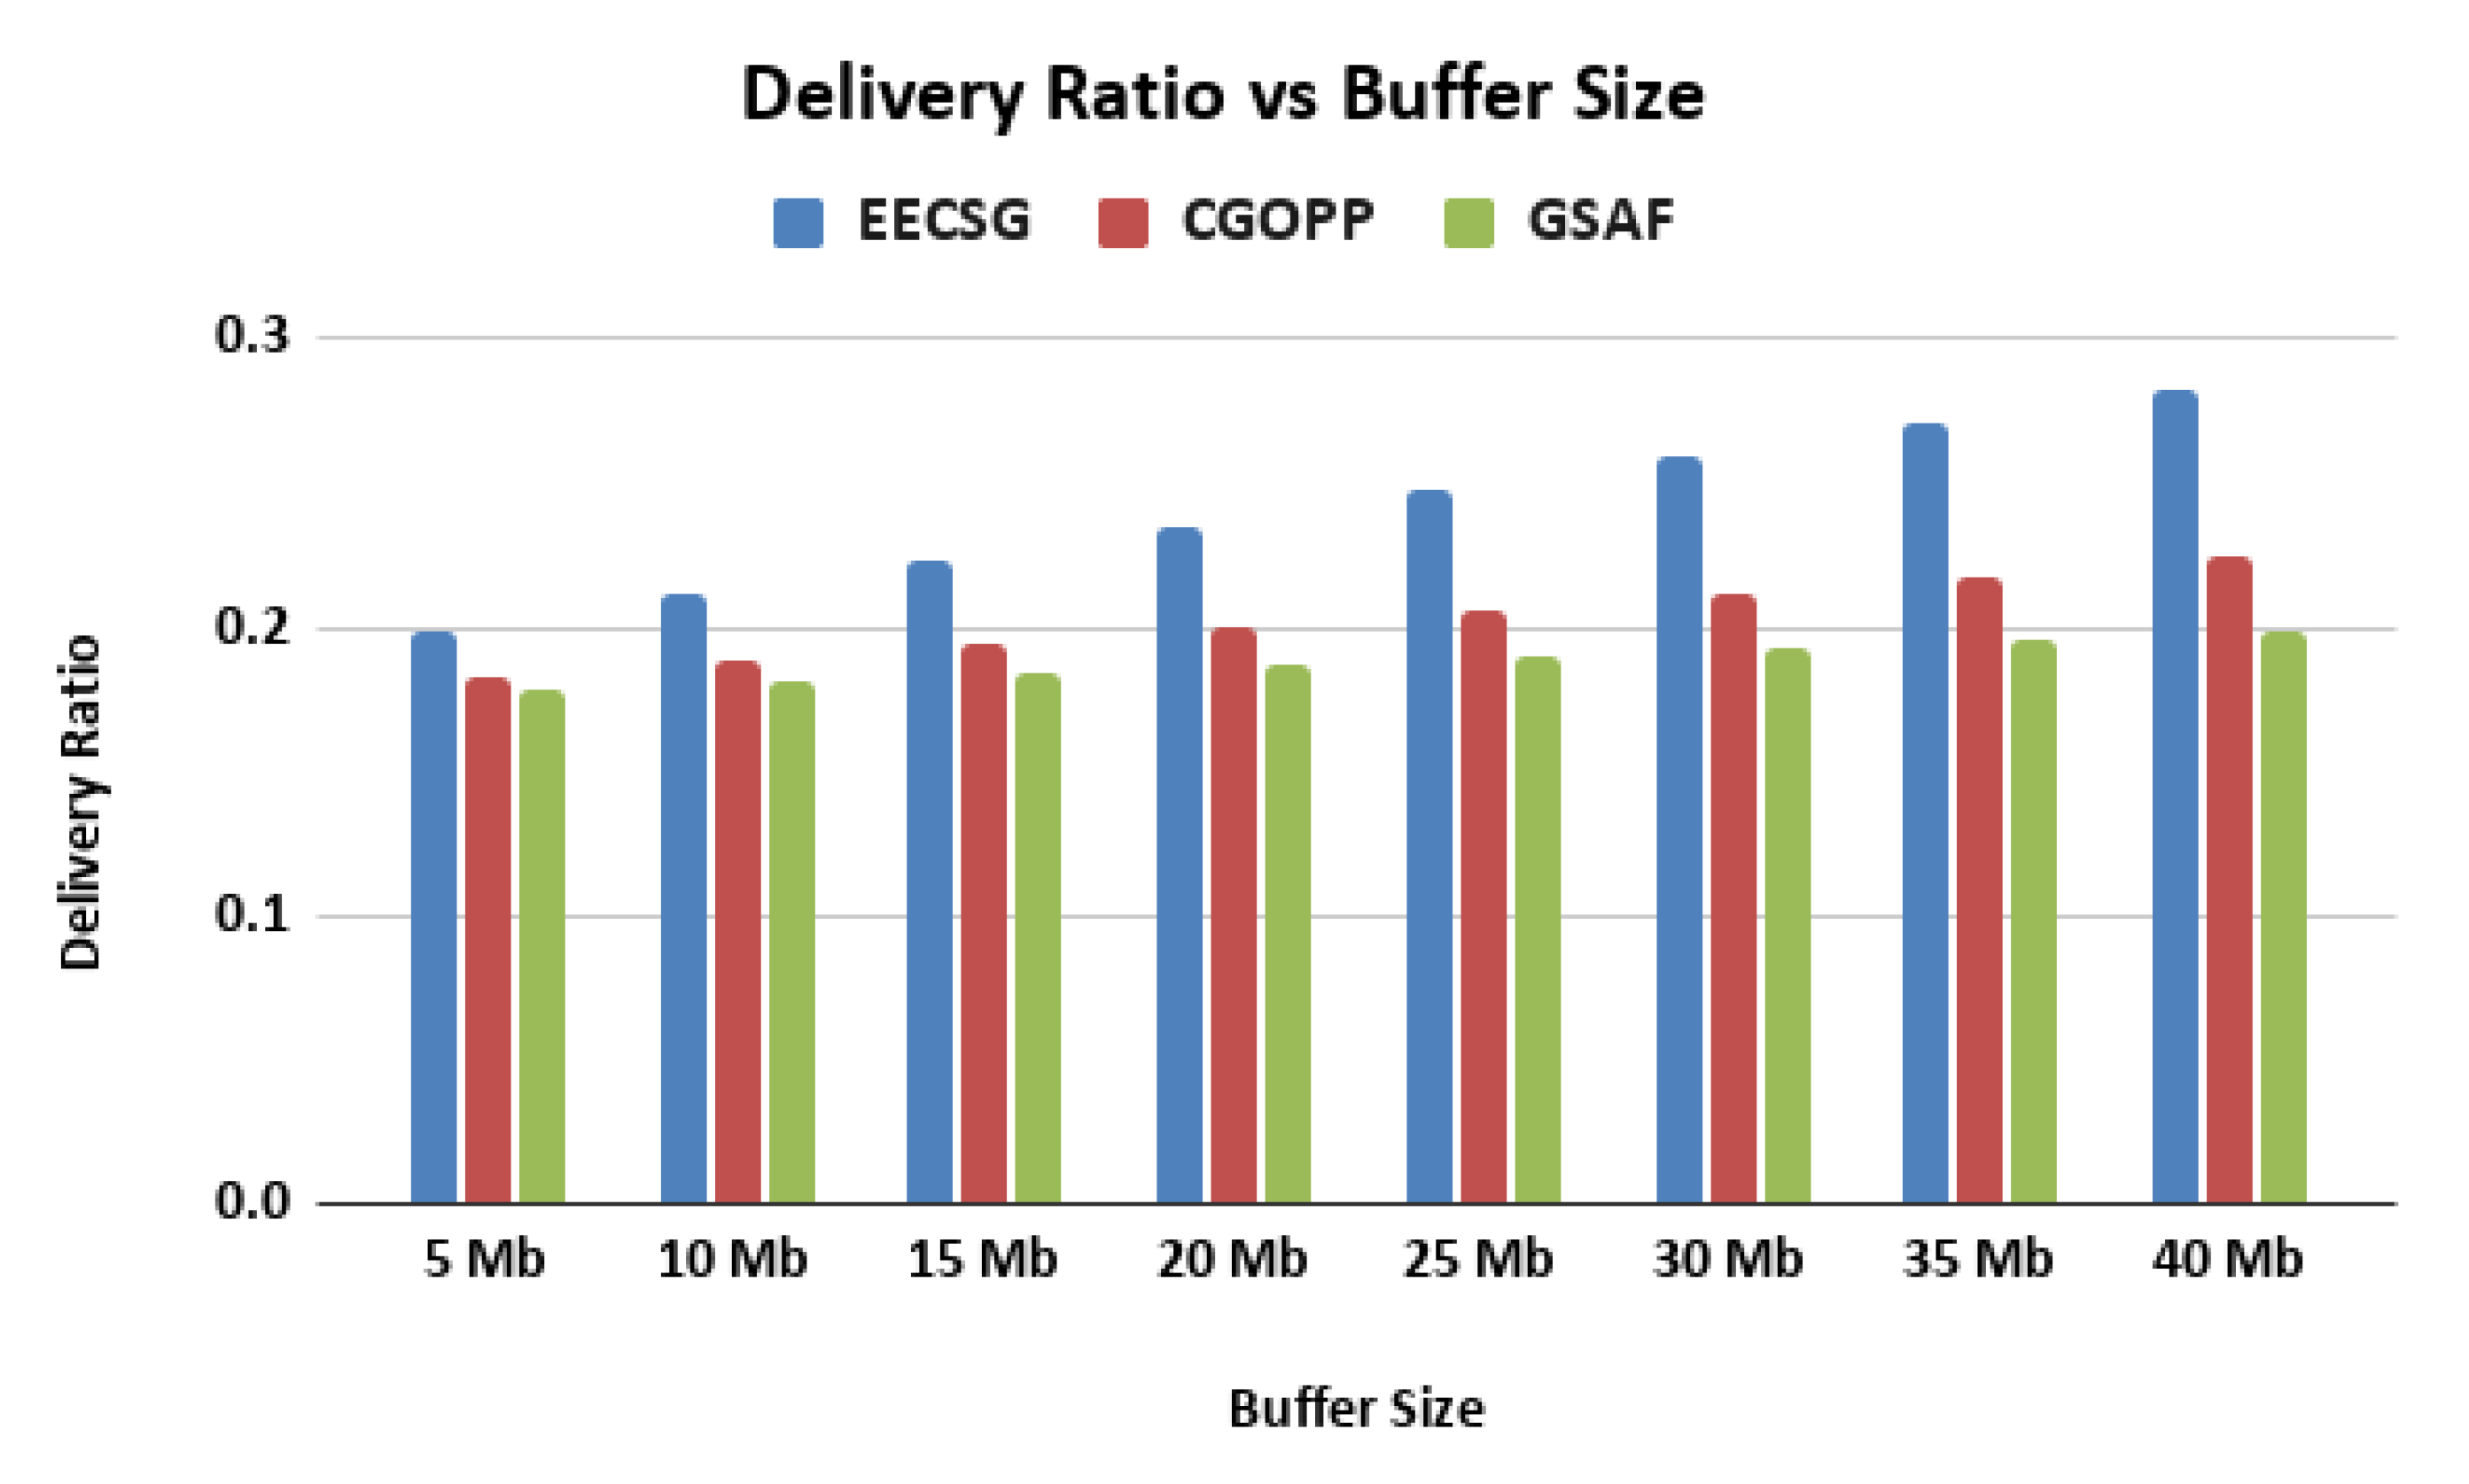
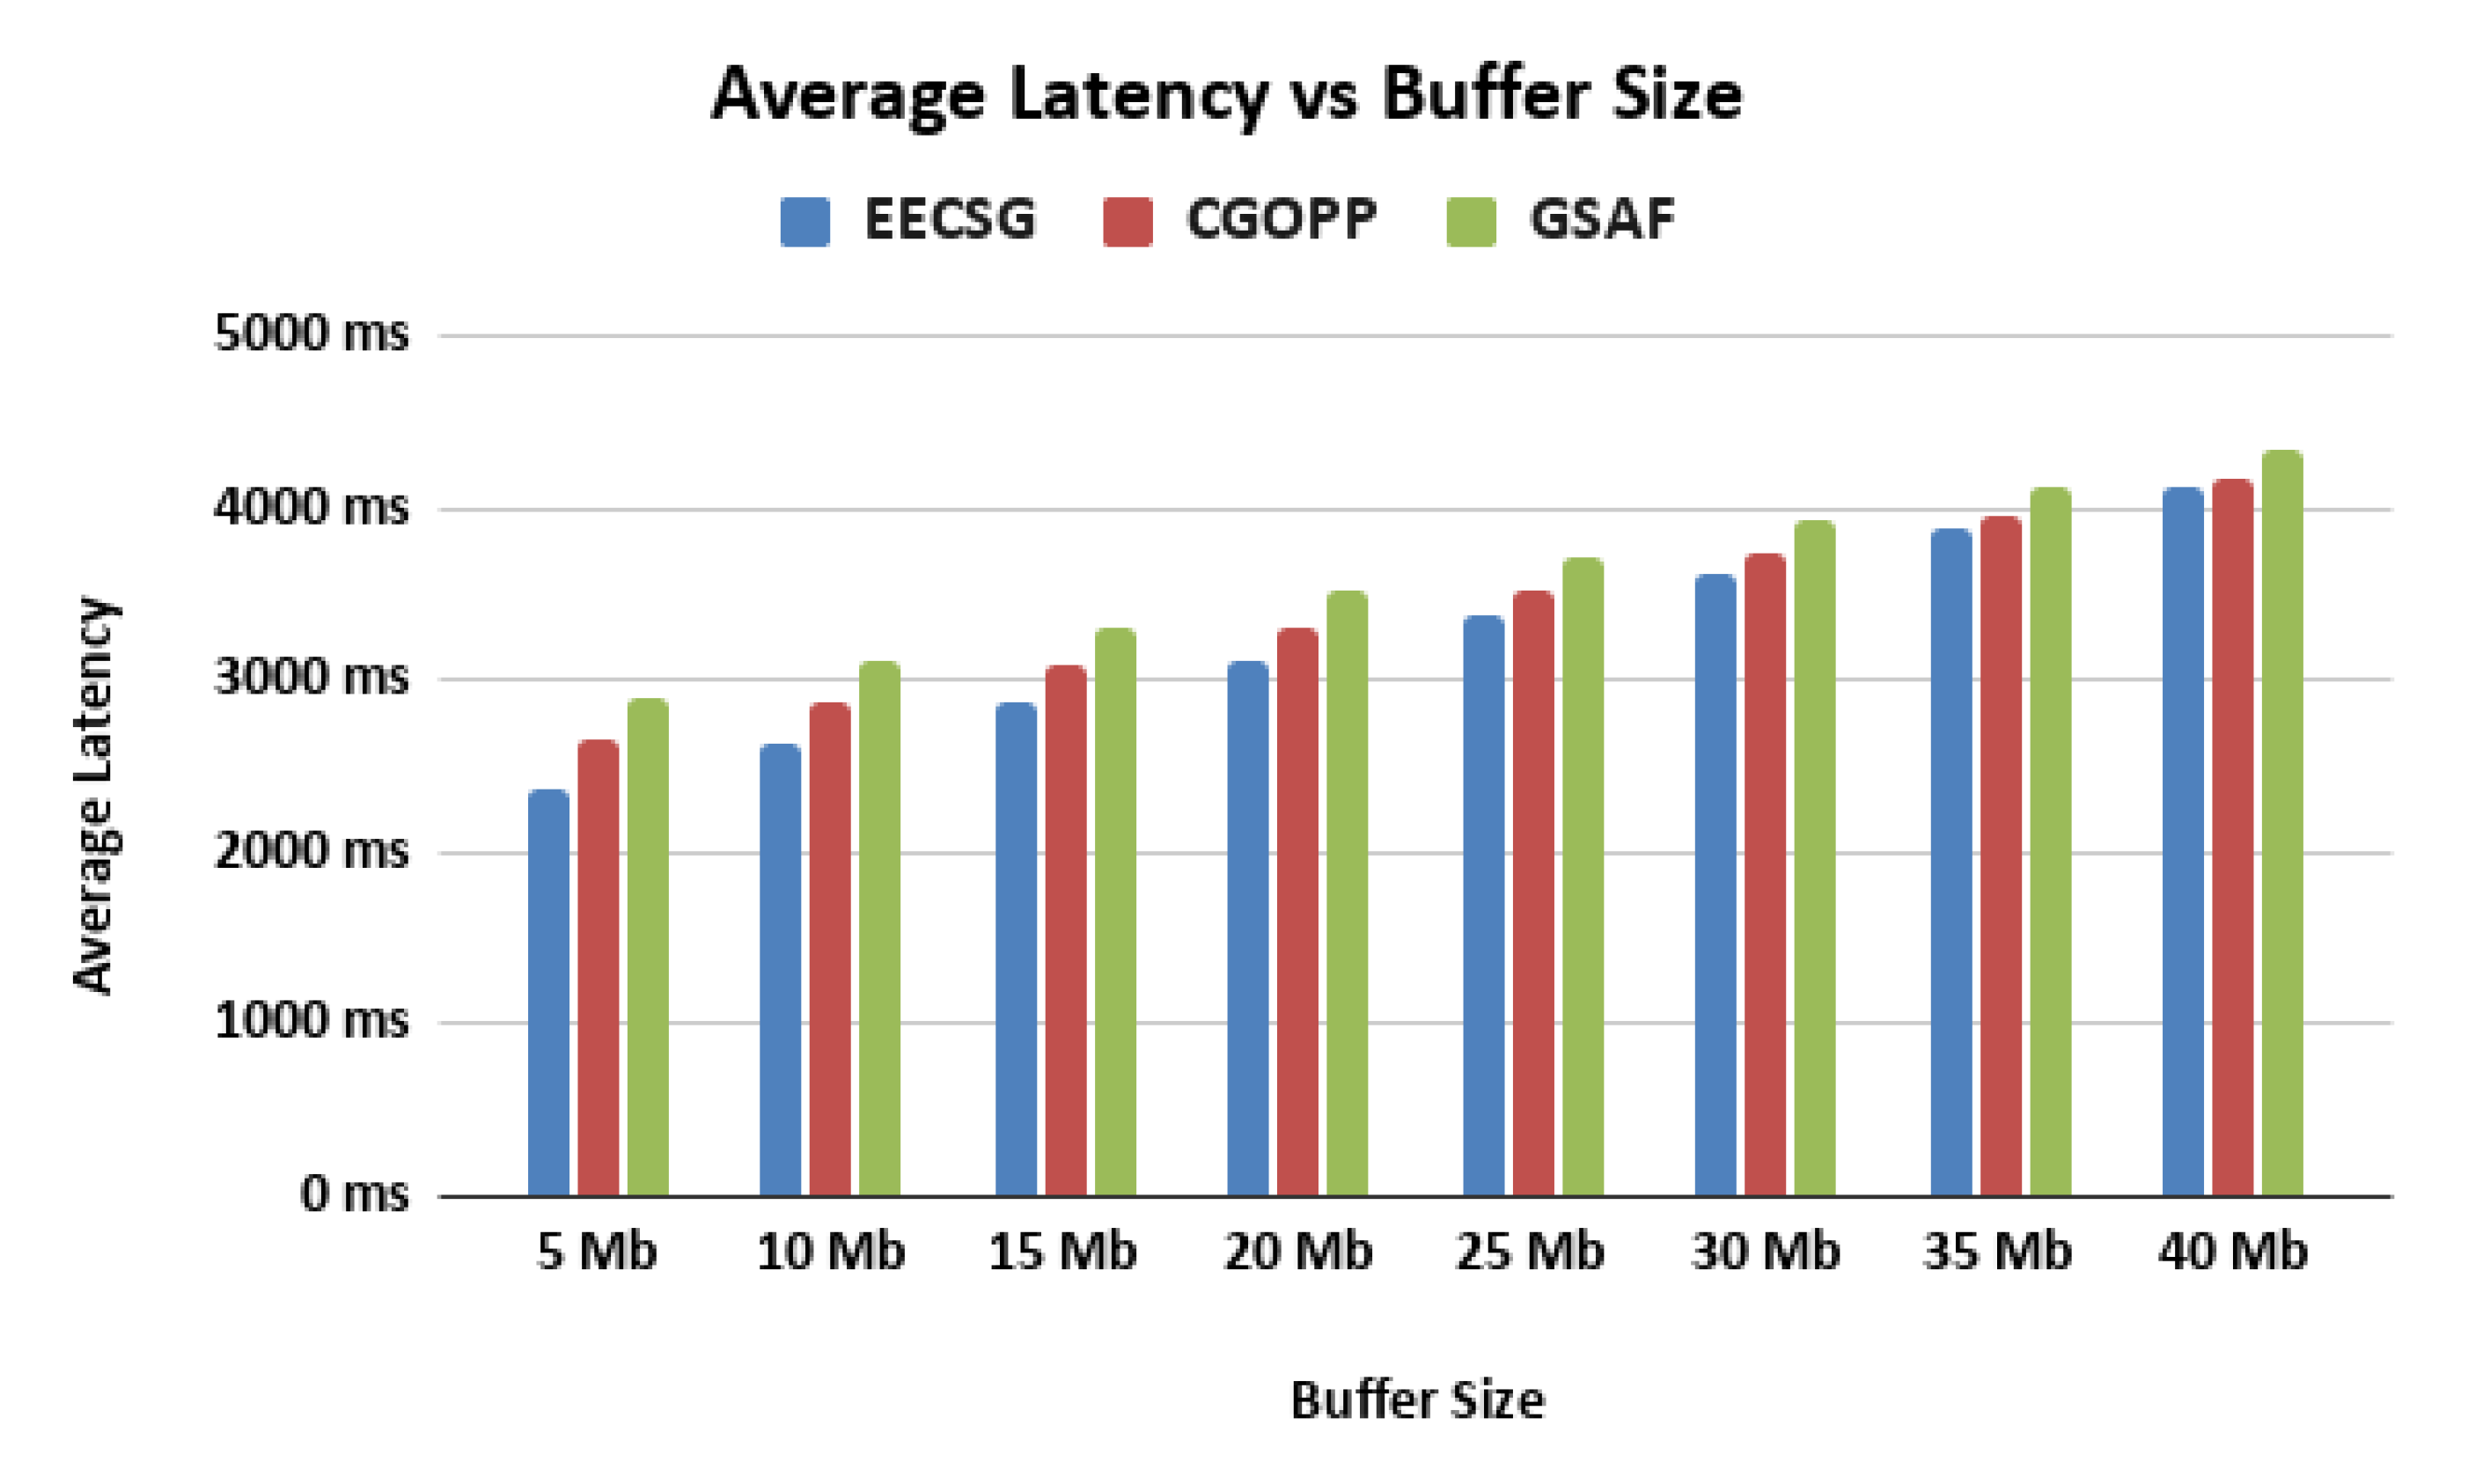
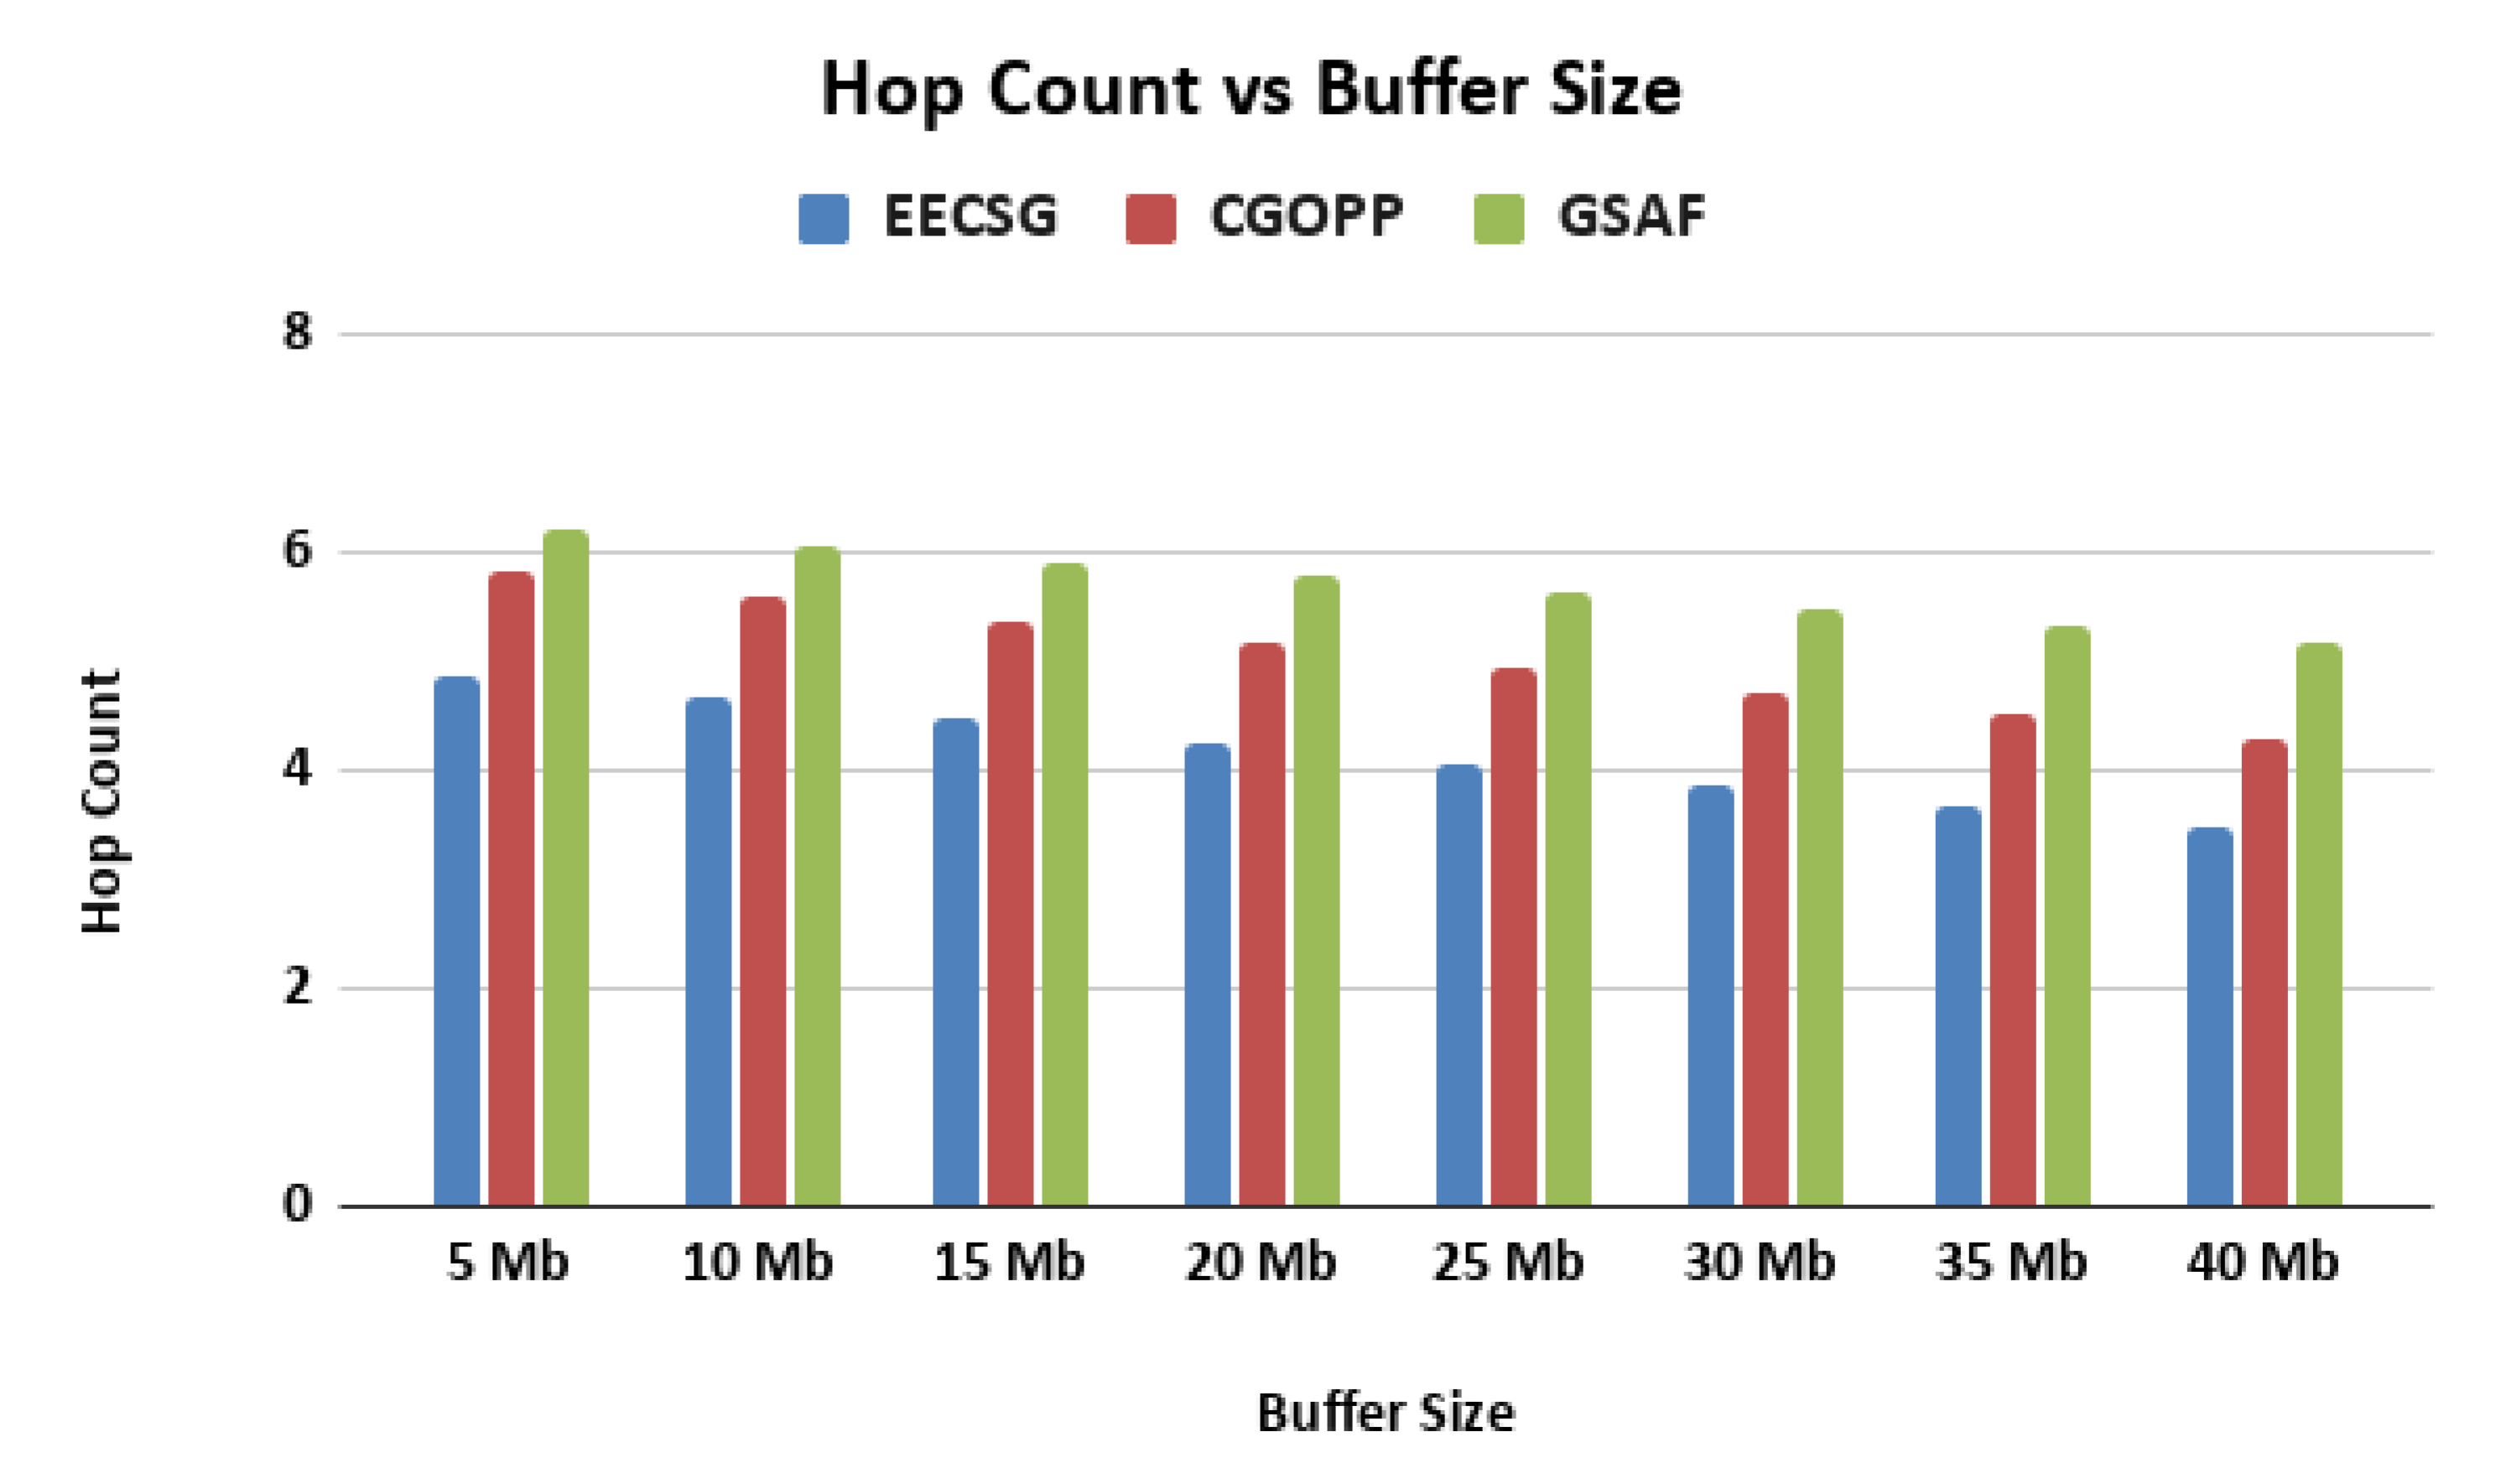
5.2. Varying the Buffer Size

The number of hosts is fixed at 195 and TTL is set to 120 min. The buffer size is increased from 65 to 520 Mb and the impact of this variation on the message delivery ratio and average latency are investigated. The results are given in Figure 6 and Figure 7 respectively.
In Figure 6, It can be observed that all three protocols performed well when the buffer resources are sufficient. The delivery ratio increased when the buffer size increased. It is also observed that in terms of delivery ratio performance, EECSG is about 7.3% better than CGOPP and 15.8% better than GSAF. This is due to the fact that when the buffer size is increased, more messages are stored in a node, which leads to a better delivery ratio of messages to their final destinations.
In Figure 7, it is observed that when the buffer size is increased, the average latency also increases, and in terms of latency performance, EECSG is about 5.6% better than CGOPP and 16% better than GSAF. This is due to the fact that a bigger buffer size stores more messages. This causes the messages to stay longer than usual and hence leads to an increase in average latency.

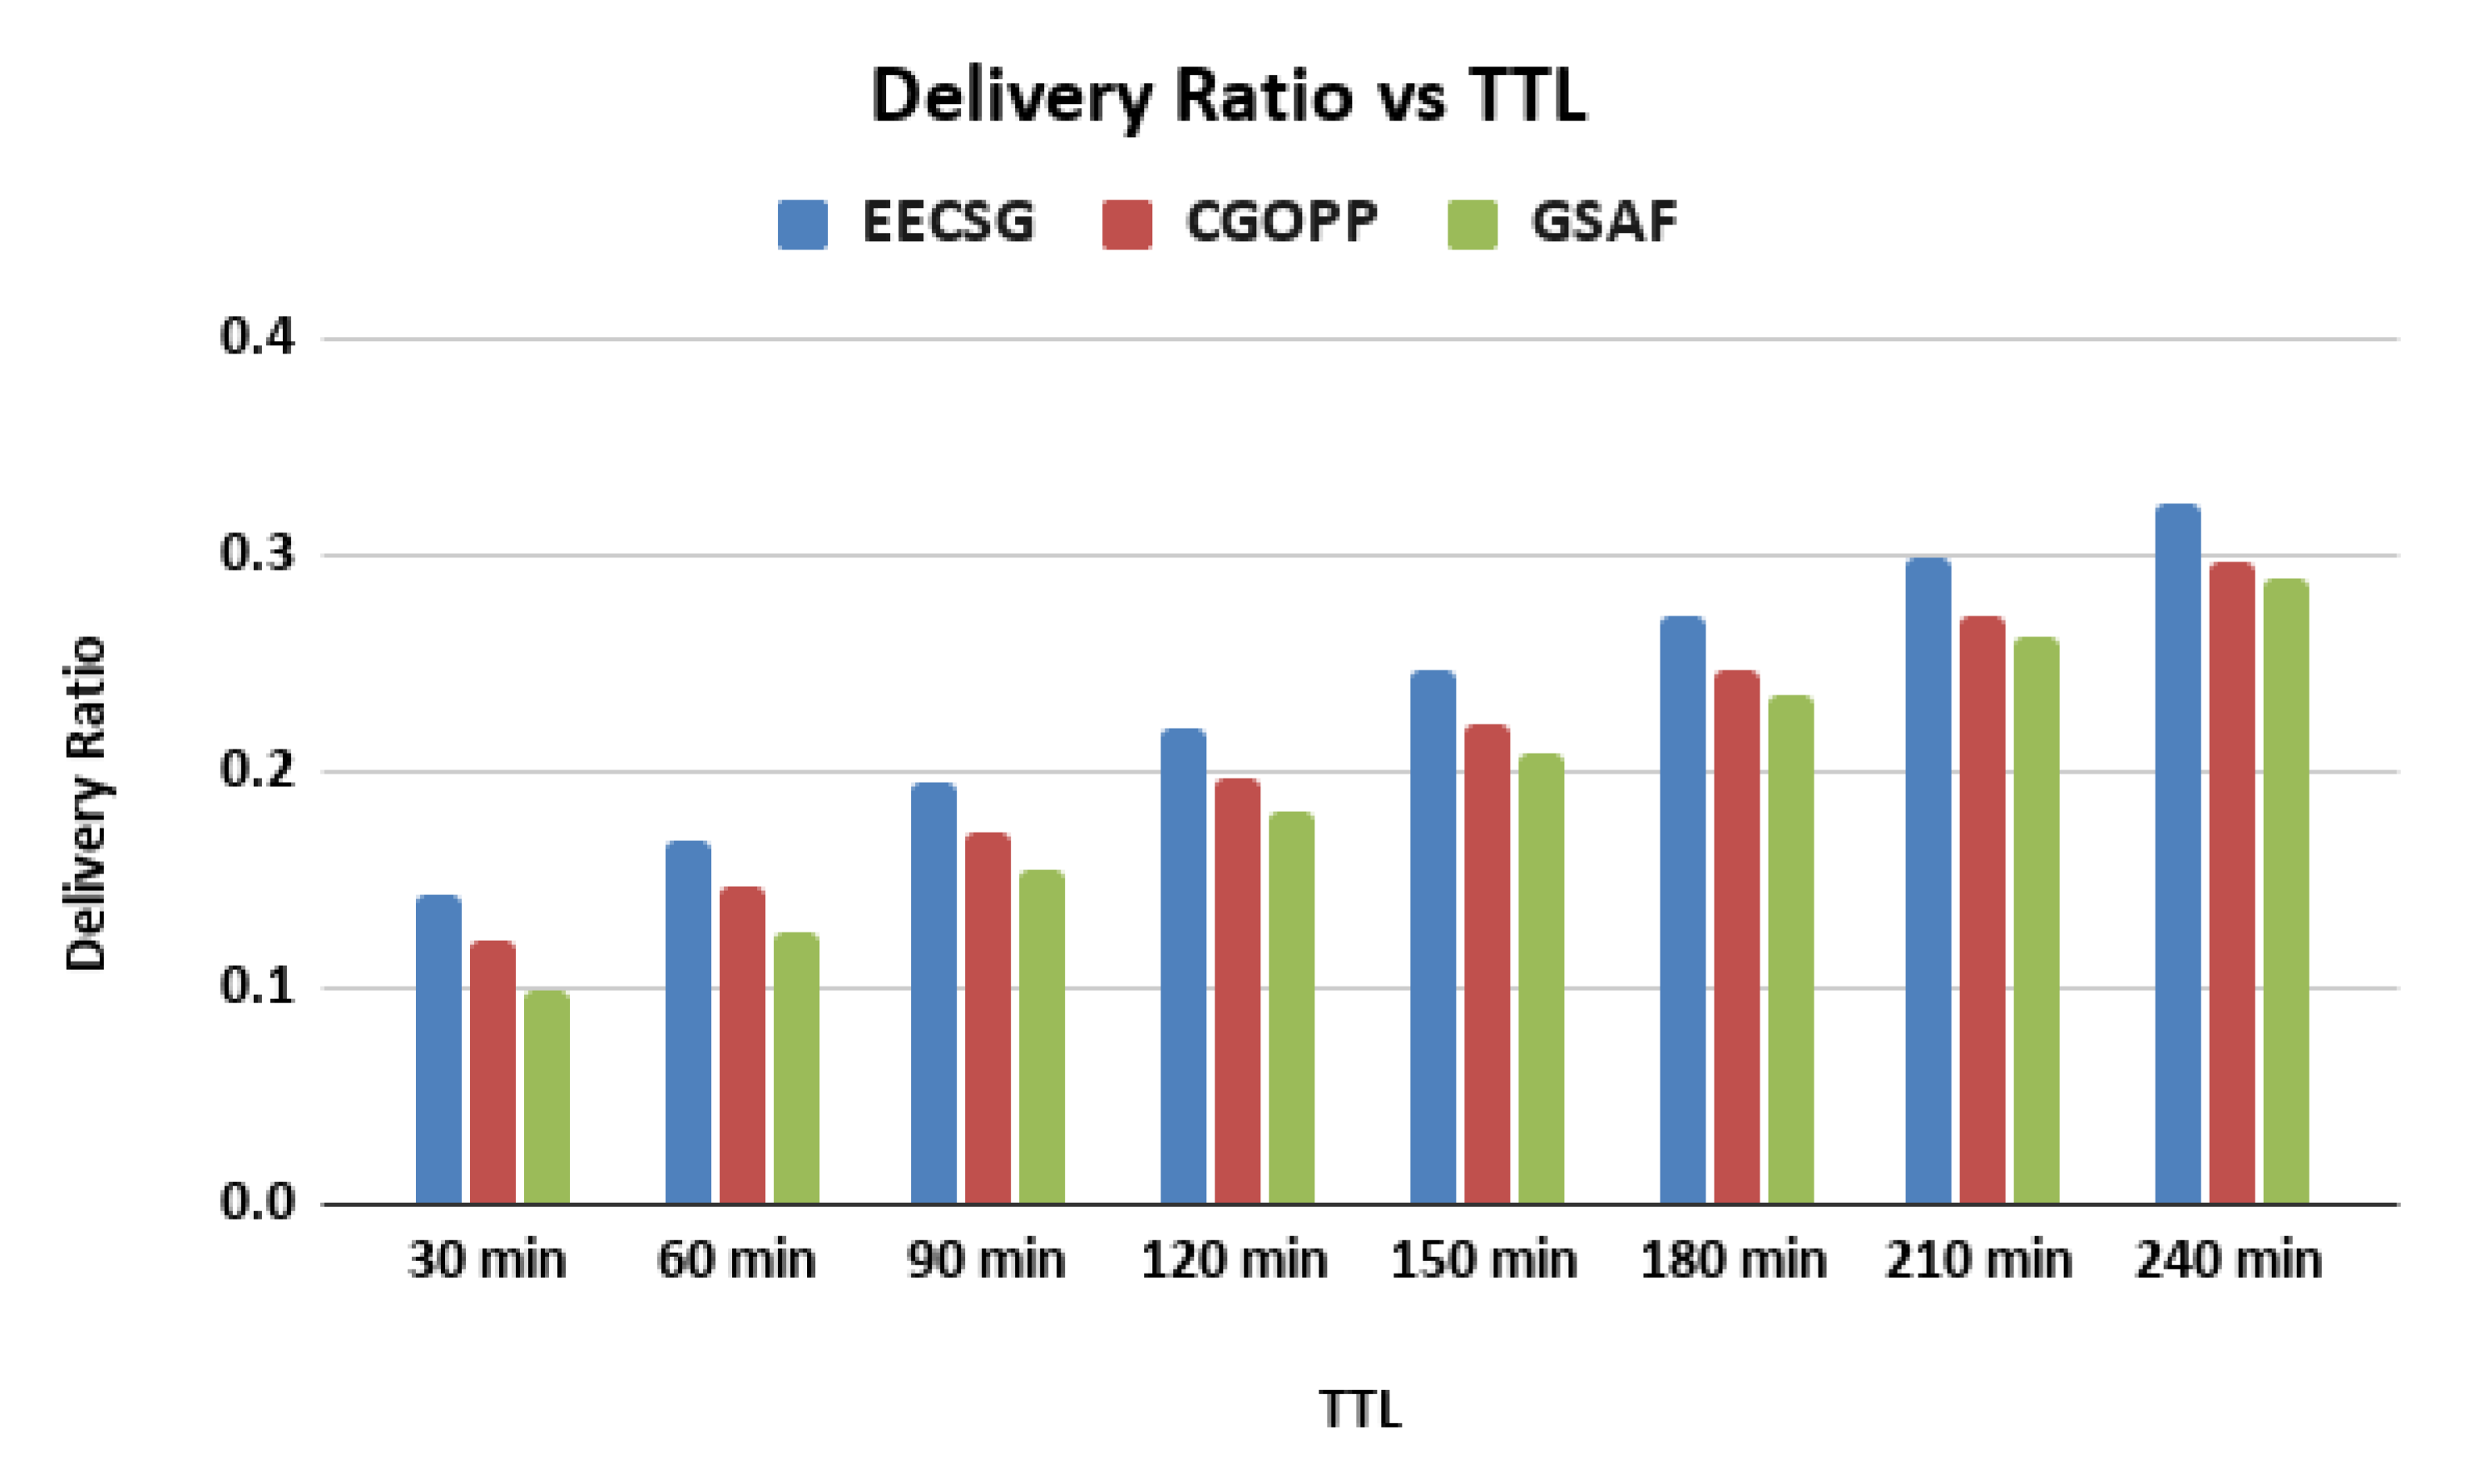
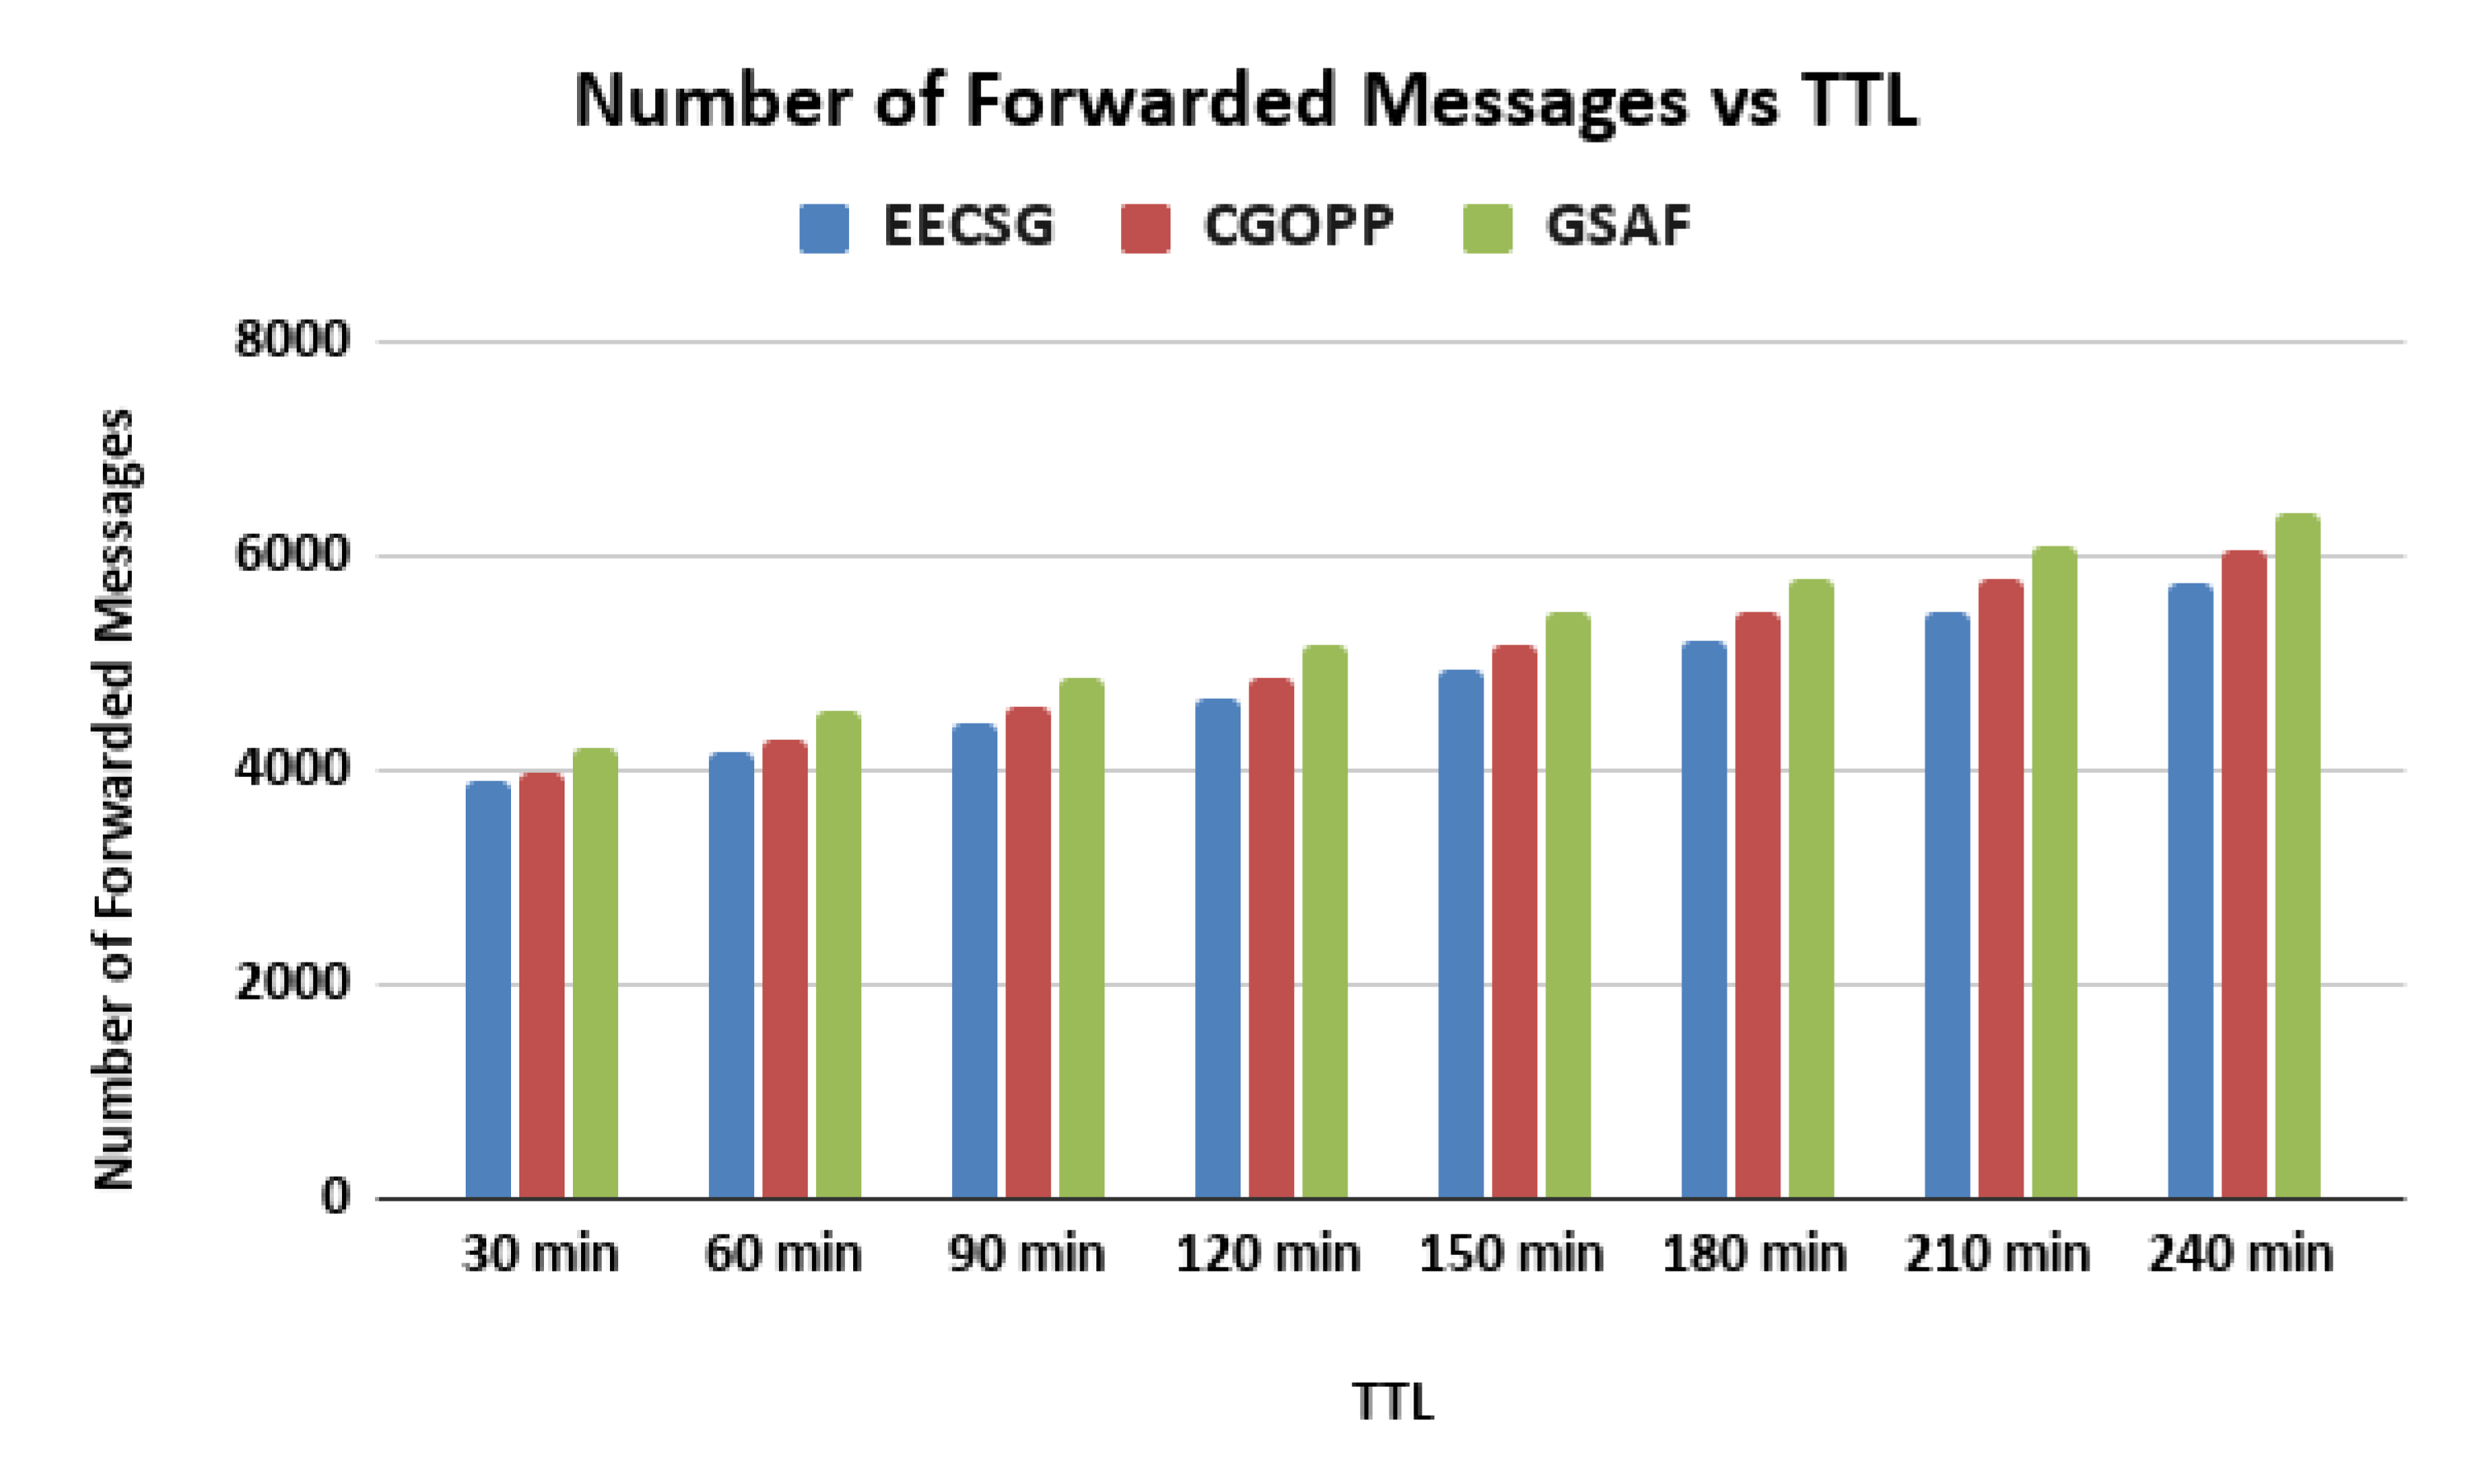
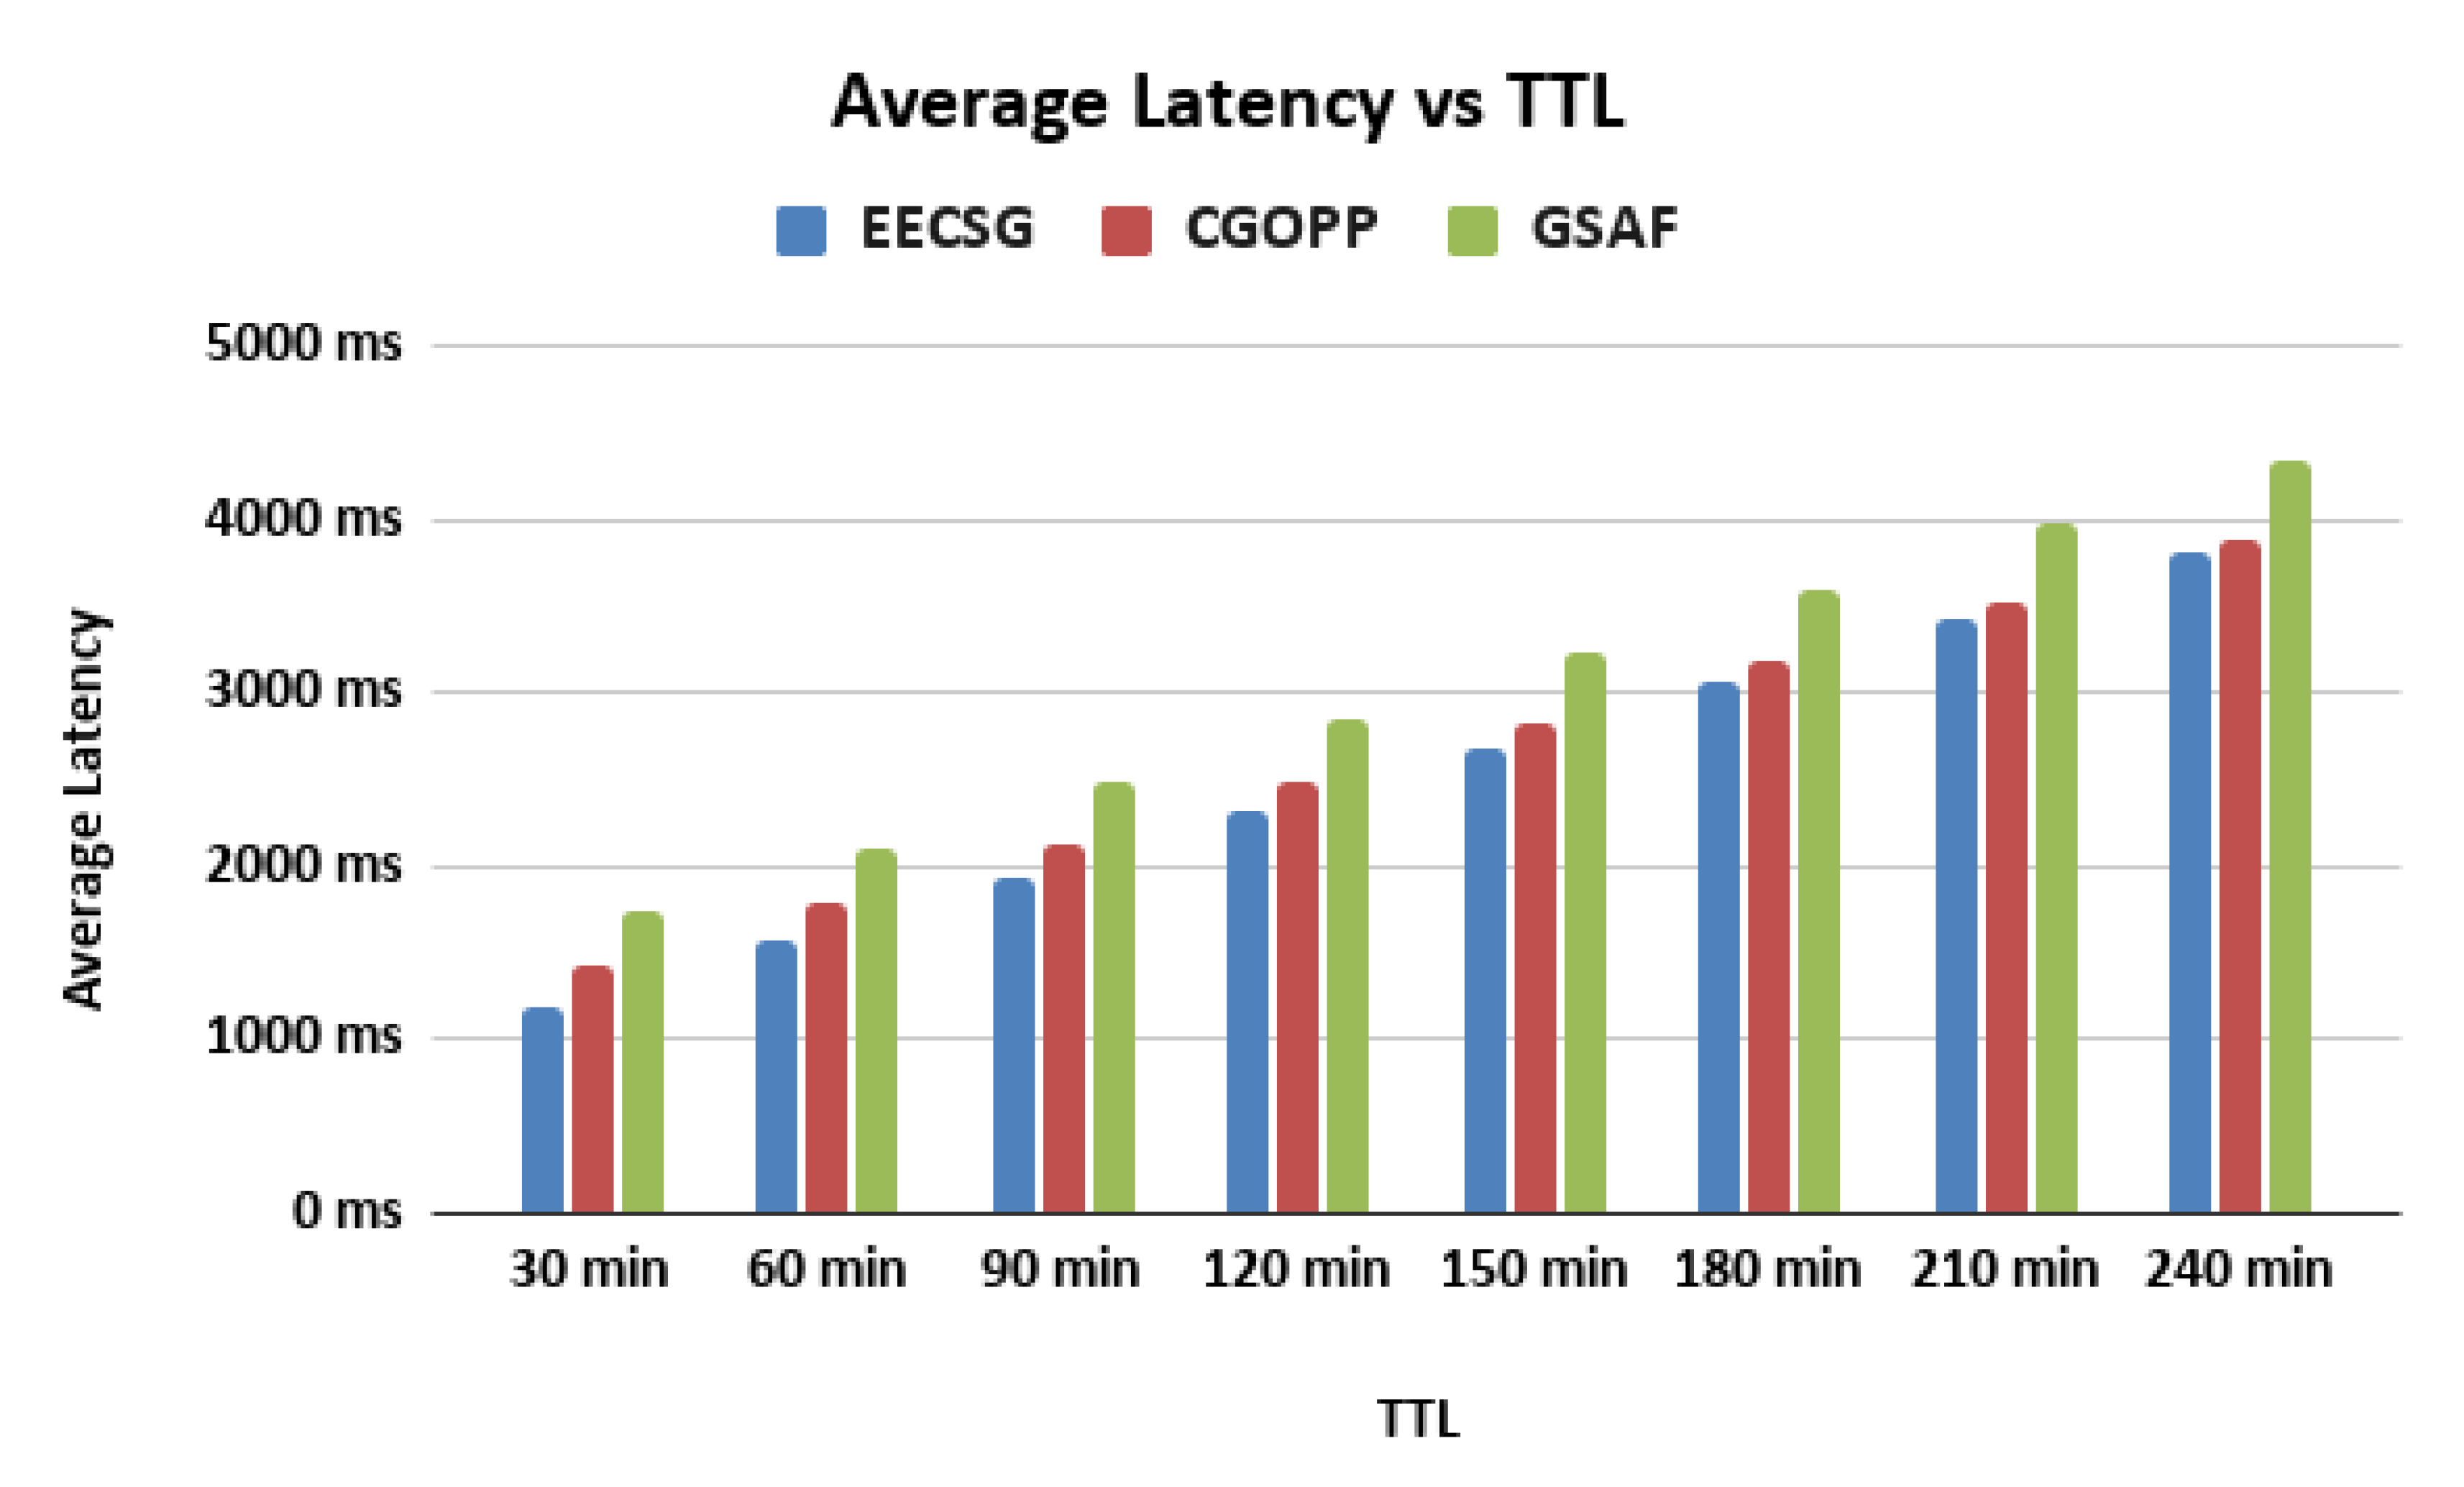
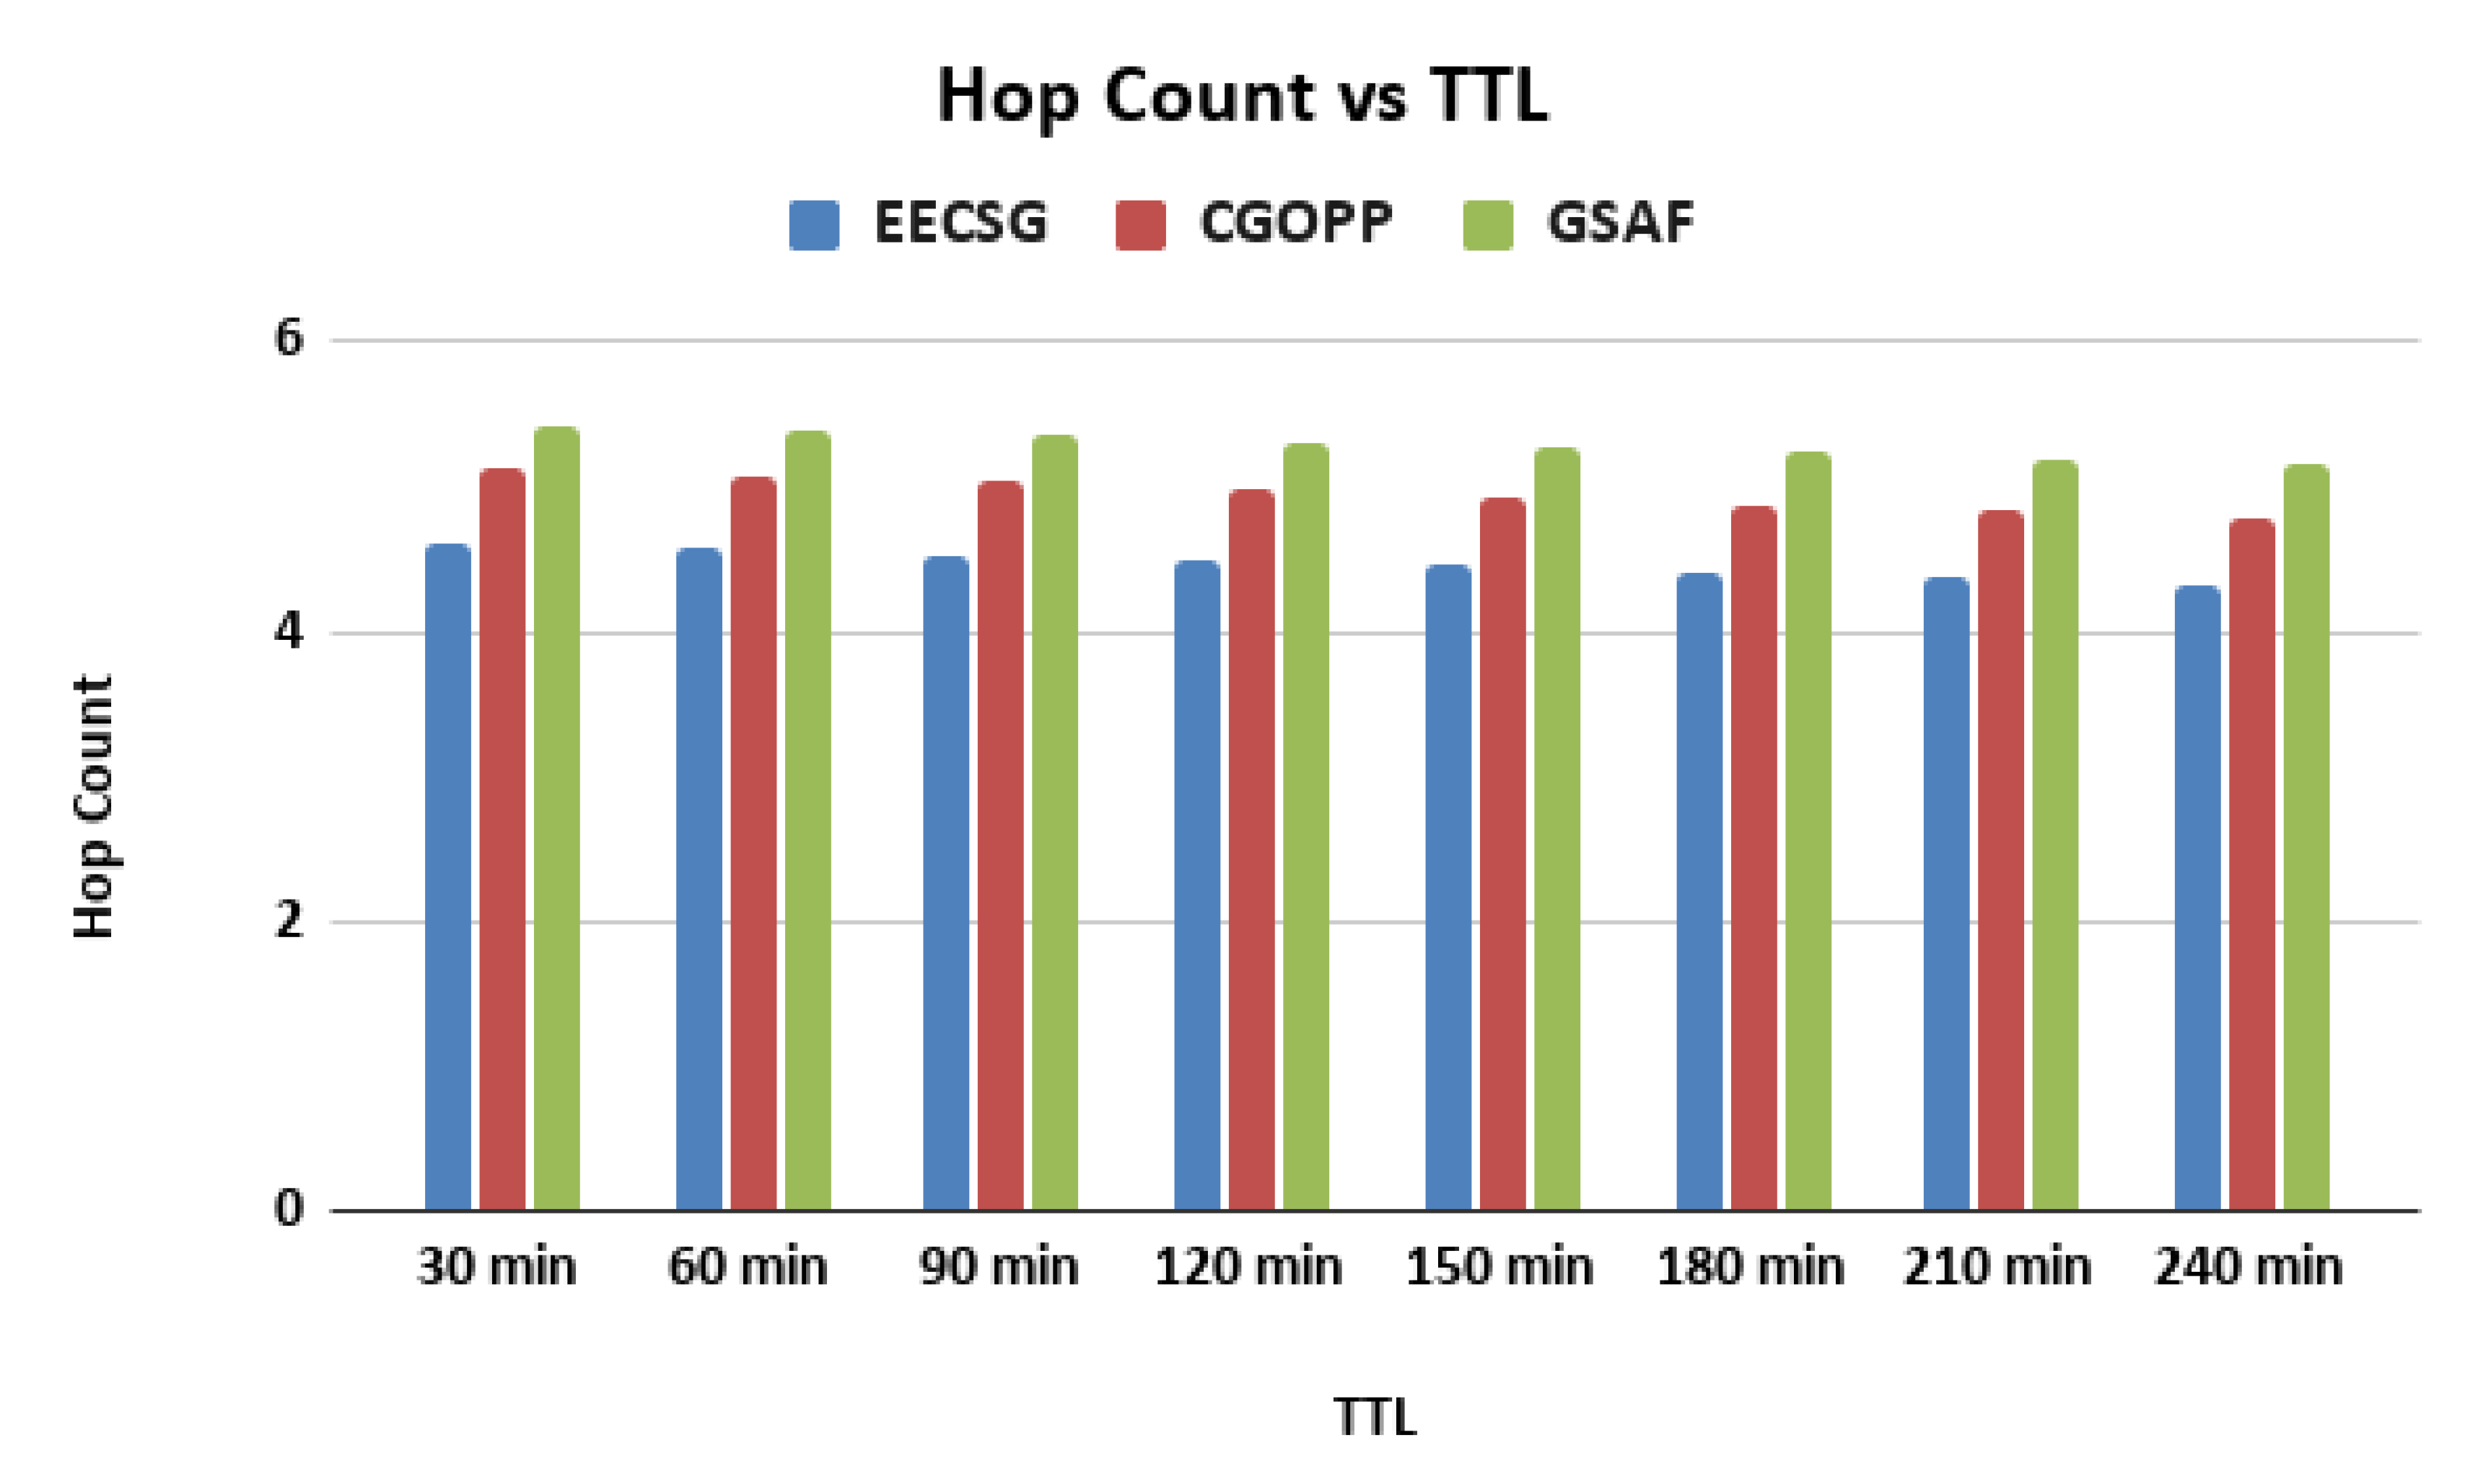
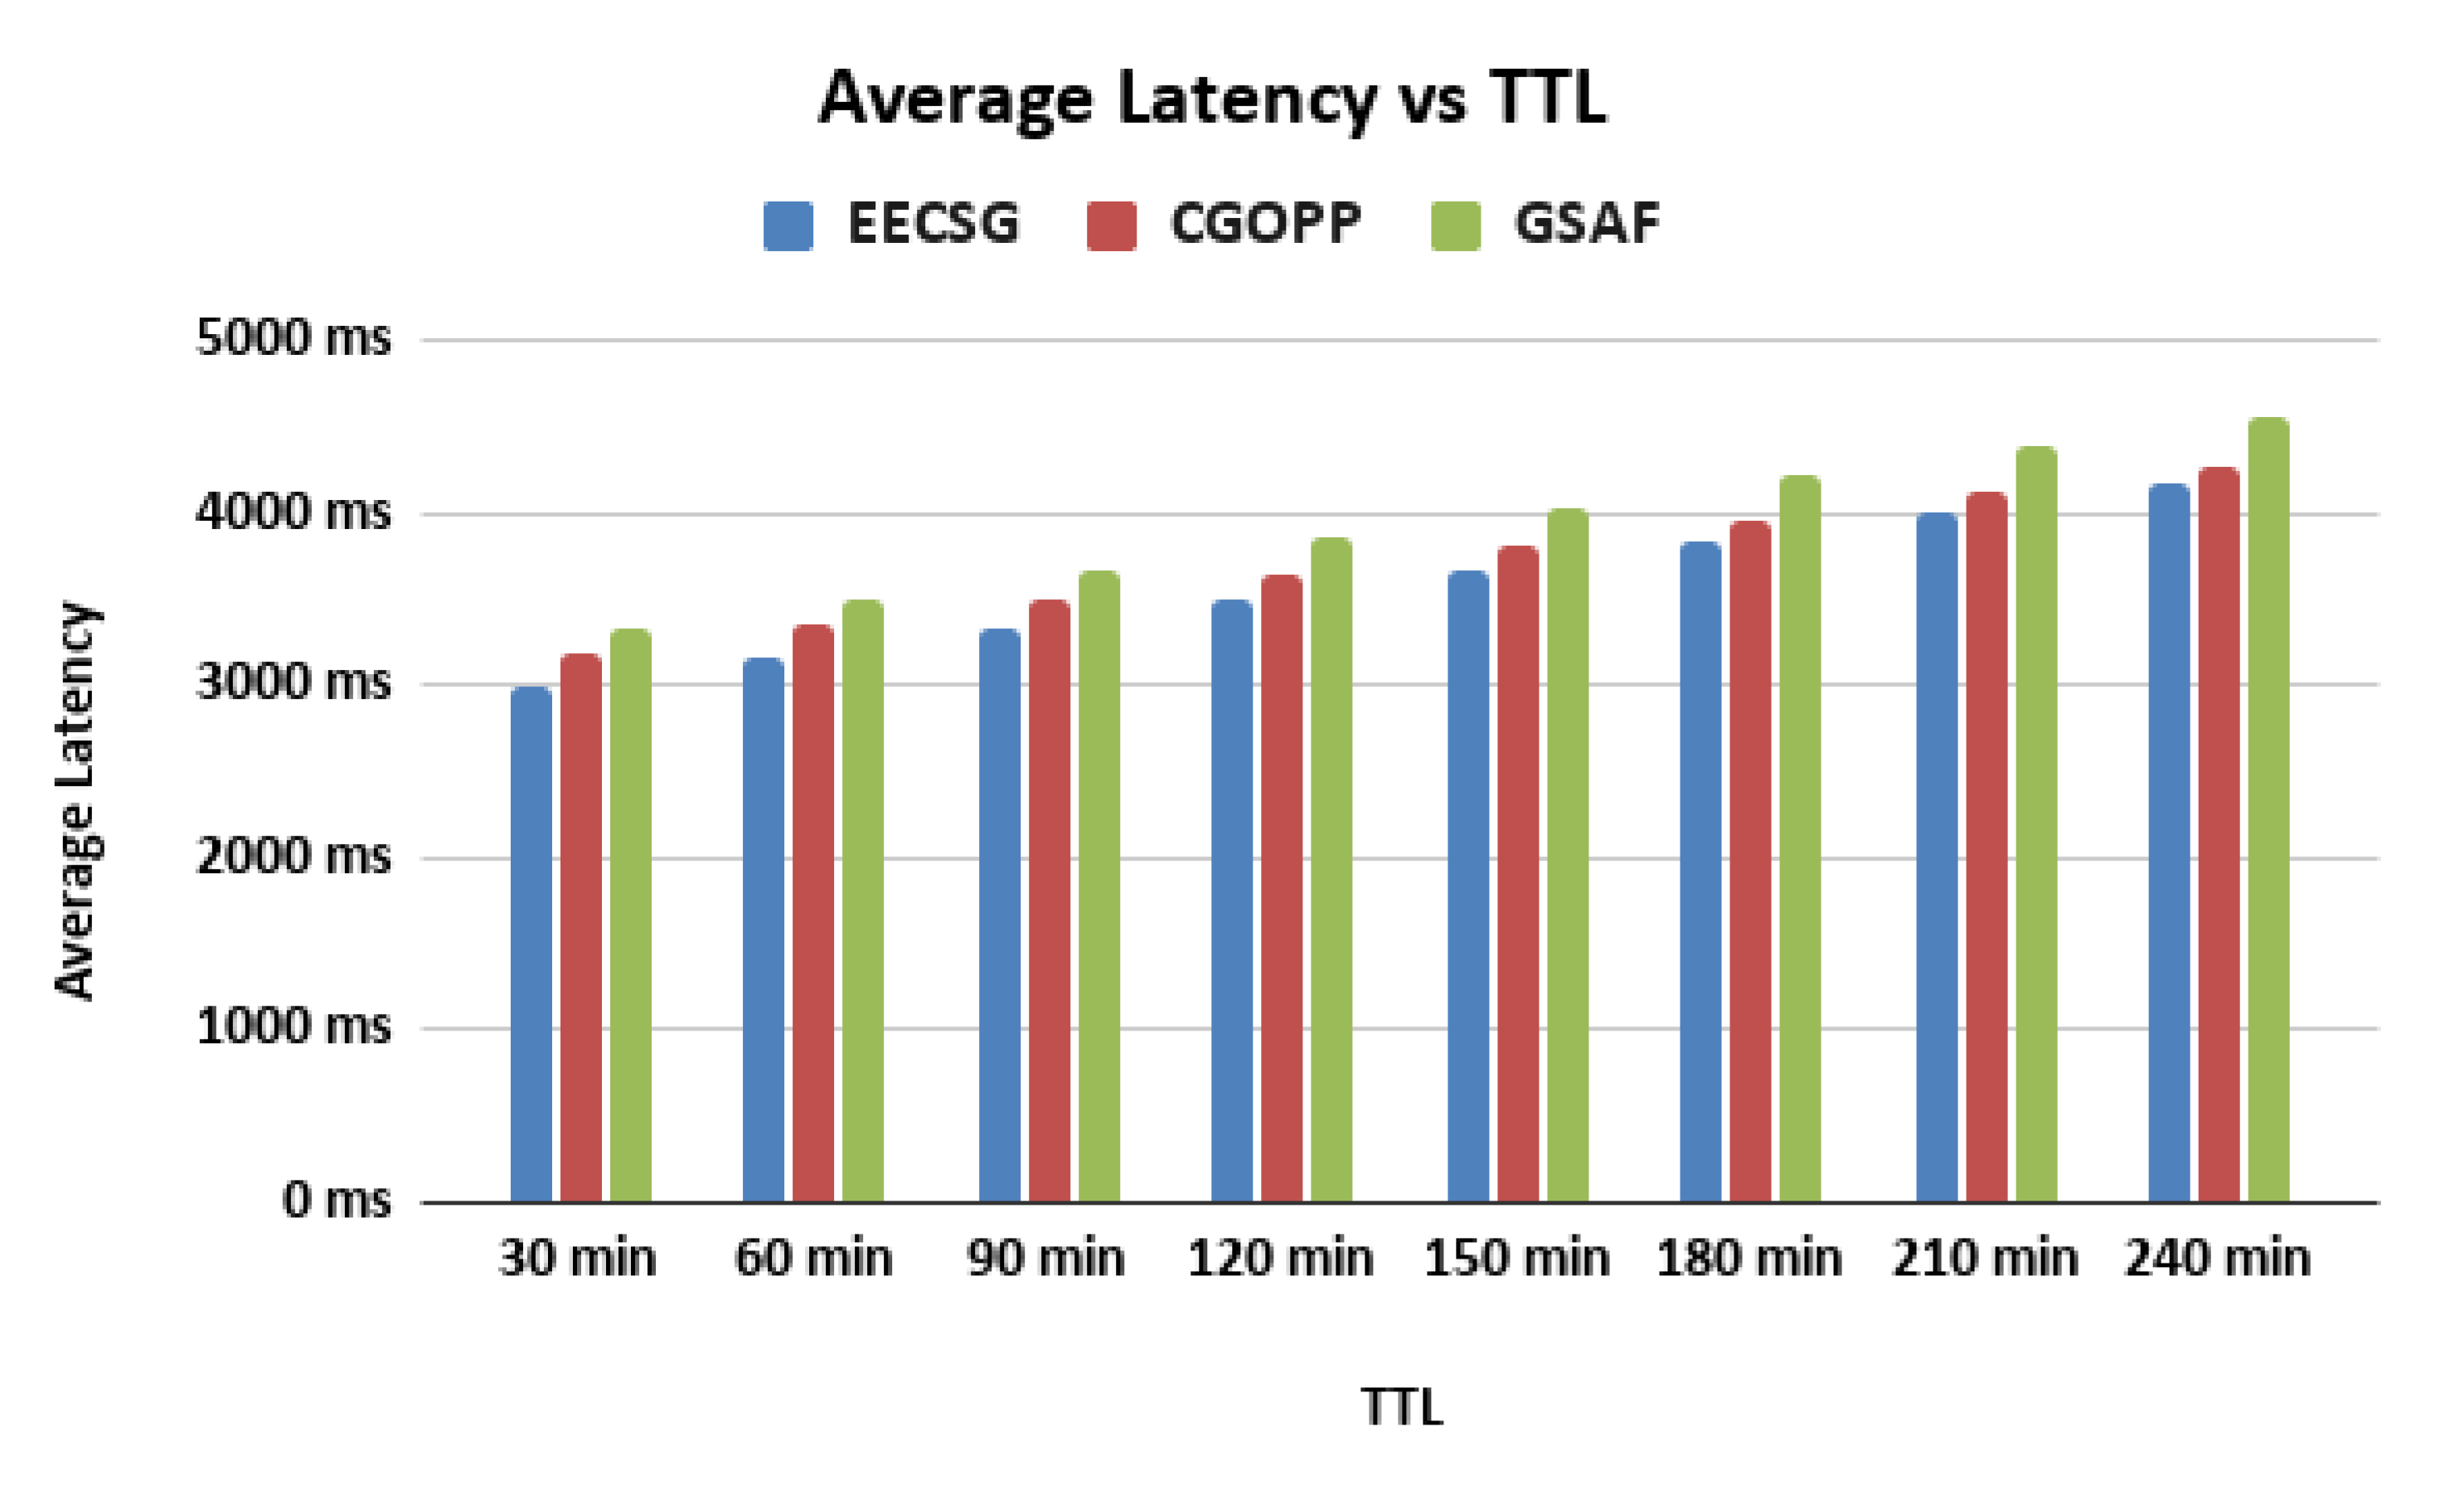
5.3. Varying the TTL

The number of hosts was set to 195 and the buffer size was fixed at 10 Mb. The TTL is varied from 30 to 240 min; and the impact of this variation on the message delivery ratio, average latency, and number of forwarded messages, were studied. The results are given in Figure 8, Figure 9 and Figure 10.
In Figure 8, it can be observed that the delivery ratio increases as the TTL of messages is increased and the pace of increase for the EECSG scheme is more pronounced. This is due to the fact that in the EECSG design, a node gets more time to find a suitable relay node to forward the message. In terms of delivery ratio performance, it is found that EECSG is about 9.28% better than CGOPP and 28.59% better than GSAF.
In Figure 9, it can be observed that as the TTL of messages is increased, the average latency increases as well, and this increase is less pronounced for the EECSG protocol. It is also observed that in terms of latency performance, EECSG is about 7.21% better than CGOPP and 18.83% better than GSAF. Furthermore, the average latency decreases as the delivery ratio increases and from Figure 8 it can be observed that when the TTL increases the delivery ratio increases.
In Figure 10, as the TTL of messages is increased, the number of forwarded messages increases. This is due to the fact that the more the TTL time for a message is, the longer the time it takes to find a suitable relay node to forward the message. It is also observed that in terms of performance w.r.t. the number of forwarded messages, EECSG is about 4% better than CGOPP and 9.16% better than GSAF.

6. Simulation Results Using Real Data Mobility Traces

We have used the INFOCOM 2006 dataset [14], which is made of real traces created with 98 nodes of bluetooth sightings by a group of users carrying small devices (iMotes) for a number of days.
The number of hosts and TTL are fixed and the buffer size is increased from 5 to 40 Mb. The impact of this variation on the message delivery ratio, average latency, hop count, and overhead ratio, are studied. The results are given in Figure 11, Figure 12, Figure 13 and Figure 14 respectively.
In Figure 11, it is observed that the delivery ratio increases when the buffer size is increased. It is also observed that in terms of delivery ratio performance, EECSG was about 15.76 % better than CGOPP and 21.78% better than GSAF. This is attributed to the fact that when the buffer size is increased, more messages are stored in node, which results in a higher chance of message delivery.
In Figure 12, it is observed that the average latency increases as the buffer size increased. The reason is that when the size of the buffer increases, more messages stay in the buffer and fewer messages are dropped during buffer management causing the average latency to increase. In terms of latency performance, it is observed that EECSG ws about 4.91% better than CGOPP and 11.35% better than GSAF.
In Figure 13, it is observed that the hop count decreases as the buffer size is increased. This is due to the fact that, the more space the buffer size has, the more time the messages can reside in a relay node and in this case, the hop count decreases. In terms of hop count performance, it is observed that EECSG was about 21.34% better than CGOPP and 36.81% better than GSAF.
In Figure 14, it is observed that as the buffer size is increased, the overhead ratio decreases, and this decrease is more pronounced for EECSG compared to CGOPP and GSAF. This is due to the intrinsic Check-and-Spray mechanism used in EECSG to control the flooding of the messages within the geocast area. In terms of overhead ratio performance, it is observed that EECSG is about 12.15% better than CGOPP and 10.59% better than GSAF. This is attributed to the fact that the greater the buffer size is, the more the messages get stored in it, which leads to less loss of messages in the network, thereby, the overhead is reduced.
In Figure 15, it is observed that the delivery ratio increases as the TTL is increased. In terms of delivery ratio performance, it is observed that EECSG iswas about 8.88% better than CGOPP and 20.45% better than GSAF. This is attributed to the fact that in the EECSG design, a node gets more time to find a suitable relay node to forward the message. Similar results are observed for the average latency, hop count, and average ratio metrics as depicted in Figure 16, Figure 17 and Figure 18.

7. Conclusions and Future Works

We have proposed a novel geocasting routing protocol for OppNets called EECSG, in which an effective way of message distribution in the geocasting region to all residing nodes is introduced, which has led to energy consumption savings by restricting the unnecessary packet transmission in that region. Simulations have shown that our proposed EECSG protocol outperforms the Efficient and GSAF and the CGOPP routing protocols with respect to delivery ratio, average latency, number of dead nodes, hop count, and overhead ratio. In future, we plan to design a security-aware version of the proposed EECSG scheme against network attacks such as wormhole, sybil, and blackhole attacks.

Author Contributions

Design of the protocol, K.K. and J.S.; methodology, I.W., S.K.D., and J.J.P.C.R.; algorithm implementation, K.K. and J.S.; simulations and validation, K.K.; analysis, I.W. and J.J.P.C.R.; writing—review and editing, all the authors. All authors have read and agreed to the published version of the manuscript.

Funding

This work is supported in part by a grant from the National Science and Engineering Research Council of Canada (NSERC), REF#: RGPIN 2017 04423, held by the second author. It is also partially funded by FCT/MCTES through national funds and when applicable co-funded EU funds under the Project UIDB/50008/2020; and by Brazilian National Council for Scientific and Technological Development—CNPq—via Grant No. 309335/2017-5, held by the 5th author.

Conflicts of Interest

The authors declare no conflict of interest.

Abbreviations

The following abbreviations are used in this manuscript:
EECSGEnergy Efficient Check-and-Spray Geocasting
OppNetsOpportunistic Networks
GSAFEfficient and flexible Geocasting for opportunistic networks
CGOPPCentrality-Based Geocasting for OPPortunistic networks
TTLTime-to-Live

References

  1. Lilien, L.; Kamal, Z.H.; Bhuse, V.; Gupta, A. Opportunistic networks: The concept and research. In Challenges in Privacy and Security. In Proceedings of the Workshop on Research Challenges in Security and Privacy for Mobile and Wireless Networks (WSPWN 2006), Miami, FL, USA, 15–16 March 2006. [Google Scholar]
  2. Jacqueline, H.; Lauren, G.; Yang, S. A survey of social-based routing protocols in Delay Tolerant Networks. In Proceedings of the International Conference on Computing, Networking and Communications (ICNC), Silicon Valley, CA, USA, 26–29 January 2017; pp. 788–792. [Google Scholar]
  3. Abali, A.M.; Ithnin, N.B.; Ebibio, T.A.; Dawood, M.; Gadzama, W.A. A Survey of Geocast Routing Protocols in Opportunistic Networks. In Proceedings of the International Conference of Reliable Information and Communication Technology, Johor, Malaysia, 22–23 September 2019; pp. 683–694. [Google Scholar]
  4. Wakeman, I.; Naicken, S.; Rimmer, J.; Chalmers, D.; Fisher, C. The fans united will always be connected: Building a practical DTN in a football stadium. In Proceedings of the International Conference on Ad Hoc Networks, San Remo, Italy, 1–2 September 2013; pp. 162–177. [Google Scholar]
  5. Lu, S.; Liu, Y. Geoopp: Geocasting for opportunistic networks. In Proceedings of the 2014 IEEE Wireless Communications and Networking Conference (WCNC), Istanbul, Turkey, 6–9 April 2014; pp. 2582–2587. [Google Scholar]
  6. Lu, S.; Liu, Y.; Liu, Y.; Kumar, M. Loop: A location based routing scheme for opportunistic networks. In Proceedings of the 2012 IEEE 9th International Conference on Mobile Ad-Hoc and Sensor Systems (MASS 2012), Las Vegas, NV, USA, 8–11 October 2012; pp. 118–126. [Google Scholar]
  7. Ott, J.; Hyytiä, E.; Lassila, P.; Vaegs, T.; Kangasharju, J. Floating content: Information sharing in urban areas. In Proceedings of the 2011 IEEE International Conference on Pervasive Computing and Communications (PerCom), Washington, DC, USA, 21–25 March 2011; pp. 136–146. [Google Scholar]
  8. Ma, Y.; Jamalipour, A. Opportunistic geocast in disruption-tolerant networks. In Proceedings of the 2011 IEEE Global Telecommunications Conference-GLOBECOM 2011, Houston, TX, USA, 5–9 December 2011; pp. 1–5. [Google Scholar]
  9. Rajaei, A.; Chalmers, D.; Wakeman, I.; Parisis, G. GSAF: Efficient and flexible geocasting for opportunistic networks. In Proceedings of the 2016 IEEE 17th International Symposium on A World of Wireless, Mobile and Multimedia Networks (WoWMoM), Coimbra, Portugal, 21–24 June 2016; pp. 1–9. [Google Scholar]
  10. Singh, J.; Dhurandher, S.K.; Woungang, I.; Takizawa, M. Centrality Based Geocasting for Opportunistic Networks. In Proceedings of the International Conference on Advanced Information Networking and Applications, Matsue, Japan, 27–29 March 2019; pp. 702–712. [Google Scholar]
  11. Dhurandher, S.K.; Singh, J.; Woungang, I.; Takizawa, M.; Gupta, G.; Kumar, R. Fuzzy Geocasting in Opportunistic Networks. In Proceedings of the International Conference on Broadband and Wireless Computing, Communication and Applications, Antwerp, Belgium, 7–9 November 2019; pp. 279–292. [Google Scholar]
  12. Haines, E. Point in Polygon Strategies. In Graphics Gems; Academic Press: San Diego, CA, USA, 1994; Volume 4, pp. 24–46. ISBN 978-0-12-336155-4. [Google Scholar]
  13. Keränen, A.; Ott, J.; Kärkkäinen, T. The ONE simulator for DTN protocol evaluation. In Proceedings of the 2nd international Conference on Simulation Tools and Techniques, Rome, Italy, 2–6 March 2009; pp. 1–10. [Google Scholar]
  14. Crawdad Haggle Dataset. Available online: https://crawdad.org/uoi/haggle/20160828/one (accessed on 14 August 2020).
  15. Khalid, K.; Woungang, I.; Dhurandher, S.K.; Barolli, L.; Carvalho, G.H.; Takizawa, M. An energy-efficient routing protocol for infrastructure-less opportunistic networks. In Proceedings of the 2016 10th International Conference on Innovative Mobile and Internet Services in Ubiquitous Computing (IMIS), Fukuoka, Japan, 6–8 July 2016; pp. 237–244. [Google Scholar]
Figure 1. Energy-Efficient Check-and-Spray Geocast Routing (EECSG) pictorial example.
Information 11 00504 g001
Figure 2. Delivery ratio vs. number of hosts.
Information 11 00504 g002
Figure 3. Average latency vs. number of hosts.
Information 11 00504 g003
Figure 4. Number of dead nodes vs. number of hosts.
Information 11 00504 g004
Figure 5. Overhead ratio vs. number of hosts.
Information 11 00504 g005
Figure 6. Delivery ratio vs. buffer size.
Information 11 00504 g006
Figure 7. Average latency vs. buffer size.
Information 11 00504 g007
Figure 8. Delivery ratio vs. Time-to-Live (TTL).
Information 11 00504 g008
Figure 9. Average latency vs. TTL.
Information 11 00504 g009
Figure 10. Number of forwarded messages vs. TTL.
Information 11 00504 g010
Figure 11. Delivery ratio vs. buffer size using real data mobility traces.
Information 11 00504 g011
Figure 12. Average latency vs. buffer size using real data mobility traces.
Information 11 00504 g012
Figure 13. Hop count vs. buffer size using real data mobility traces.
Information 11 00504 g013
Figure 14. Overhead ratio vs. buffer size using real data mobility traces.
Information 11 00504 g014
Figure 15. Delivery ratio vs. TTL using real data mobility traces.
Information 11 00504 g015
Figure 16. Average latency vs. TTL using real data mobility traces.
Information 11 00504 g016
Figure 17. Hop count vs. TTL using real data mobility traces.
Information 11 00504 g017
Figure 18. Overhead ratio vs. TTL using real data mobility traces.
Information 11 00504 g018
Publisher’s Note: MDPI stays neutral with regard to jurisdictional claims in published maps and institutional affiliations.

