Article

Ensemble Classification through Random Projections for Single-Cell RNA-Seq Data

by
Aristidis G. Vrahatis
*,
Sotiris K. Tasoulis
,
Spiros V. Georgakopoulos
and
Vassilis P. Plagianakos
Department of Computer Science and Biomedical Informatics, University of Thessaly, 35131 Lamia, Greece
*
Author to whom correspondence should be addressed.
Information 2020, 11(11), 502; https://doi.org/10.3390/info11110502
Submission received: 21 September 2020 / Revised: 20 October 2020 / Accepted: 23 October 2020 / Published: 28 October 2020
(This article belongs to the Special Issue Big Data Research, Development, and Applications––Big Data 2018)

Abstract

:
Nowadays, biomedical data are generated exponentially, creating datasets for analysis with ultra-high dimensionality and complexity. An indicative example is emerging single-cell RNA-sequencing (scRNA-seq) technology, which isolates and measures individual cells. The analysis of scRNA-seq data consists of a major challenge because of its ultra-high dimensionality and complexity. Towards this direction, we study the generalization of the MRPV, a recently published ensemble classification algorithm, which combines multiple ultra-low dimensional random projected spaces with a voting scheme, while exposing its ability to enhance the performance of base classifiers. We empirically showed that we can design a reliable ensemble classification technique using random projected subspaces in an extremely small fixed number of dimensions, without following the restrictions of the classical random projection method. Therefore, the MPRV acquires the ability to efficiently and rapidly perform classification tasks even for data with extremely high dimensionality. Furthermore, through the experimental analysis in six scRNA-seq data, we provided evidence that the most critical advantage of MRPV is the dramatic reduction in data dimensionality that allows for the utilization of computational demanding classifiers that are considered as non-practical in real-life applications. The scalability, the simplicity, and the capabilities of our proposed framework render it as a tool-guide for single-cell RNA-seq data which are characterized by ultra-high dimensionality. MRPV is available on GitHub in MATLAB implementation.

1. Introduction

Ongoing technological advances in the biomedical research field have increased the amount of the produced data to such an extent that research has shifted to data-driven computational methodologies. This evolution has revolutionized several areas including the biomedical domain [1] along with its important sub-disciplines, such as bioinformatics, clinical informatics, and public health informatics [2]. Regarding the bioinformatics aspect, expression profiles through omics studies (genomics, transcriptomics, proteomics, etc.) consist of an important part of the biomedical data expansion. The main reason is the Human Genome Project, which changed the way we approach the interpretation of complex diseases and biological processes [3]. The technological development of recent decades in this field has created a large pool of ultra-high dimensional datasets. As the DNA sequencing cost significantly drops each year [4], the data volume increments relatively. Therefore the need arises to create new computational methods under the perspective of Machine Learning to uncover data volume and complexity.
Nowadays, we are in the era of emerging single-cell RNA-sequencing (scRNA-seq) technology, which belongs to the family of next-generation sequencing (NGS) technologies. The main difference with traditional methods, which export measurements from a bulk of cells, is that it isolates individual cells offering gene expressions for each one. Through the scRNA-seq data we can achieve a deeper knowledge of the cellular functions opening new roads for the discovery of novel disease biomarkers. From a computation perspective, scRNA-seq studies generate a large amount of data with several cells and tens of thousands of gene measurements. Most scRNA-seq data so far belong to the “small n large p” category, where n is the number of samples (cells) and p is the number of dimensions (genes). Νow, the technological evolution allows us to manage datasets with with hundreds of thousands or even millions of cell samples. In both cases, we have datasets with ultra-high dimensionality, where there is a great risk of falling into the “curse of dimensionality” trap.
Classifying scRNA-seq data is a major computational challenge for this optimized NGS technology, while they explore the cellular differences offered in a higher resolution for the main building blocks of organisms. There is remarkable progress in classification methods of gene expressions data for single-cell RNA-sequencing studies [5,6]; however, this field is in its infancy.
In this work, we studied the generalization of the MRPV (Multiple Random Projections with Voting), a recently published in-house classification algorithm [7] focusing on their high-dimensionality aspect, on its scalability and on its capability to enhance the performance of a given base classifier. The MRPV combines multiple ultra-low dimensional random projected spaces with the predictions of a given base classifier through a voting scheme. It has the true potential to be established as the new default in dealing with biomedical tasks with similar characteristics. Our main aim in this work is so to study its generalization as to highlight its scalability in various single-cell RNA-seq data
In what follows, Section 2 provides details regarding the background material for MRPV. Next, in Section 3, we describe the MRPV algorithmic procedure in every detail, while Section 4 is devoted to the experimental analysis and evaluation. Extensive commenting and discussion regarding the results is presented in Section 5. The paper concludes in Section 6 with remarks and future directions.

2. Background Material

2.1. The Random Projection Method

Dimensionality reduction methods offer the potential to discover the structure of data with high dimensionality. Data projection to a lower dimensional space without loosing its information structure comprises of the most appropriate strategy. The random projection (RP) method [8,9,10], appears to have the upside of great information portrayals with negligible calculation exertion for information measurements in the scope of many thousands or even millions. The corpus of the RP method in a random matrix with unit size columns projects the initial data to a lower dimensional space.
This is based on the Johnson–Lindenstrauss lemma [11], where it has been proven that we can reduce the dimension dramatically and be sure that the pairwise distances will maintain a small error. More specifically, given a group of n sample points in a Euclidean space with a dimensions, it can be transformed onto an r < O ( log n / ε 2 ) dimensional space, such that the distances are not distorted more than a factor of 1 ± ε , for any 0 < ε < 1 . The RP method can efficiently operate with data in extremely high dimensions, since the lower bound on r does not depend on the a dimensions but on the n sample points.
The RP method is an appropriate choice when dealing with millions of dimensions, since its inherent simplicity allows for parallel implementation, a very crucial feature when we have to deal with computational complexity and memory management issues. Studies have shown its similar behavior or superiority over the widely-used Principal Component Analysis (PCA). Indicatively, it has been shown that the random projection method efficiently preserves the pair-wise distances among samples points on a similar level to other dimensionality reduction techniques, such as the PCA; however, with a much shorter execution time [9]. Furthermore, studies have been provided evidence that, in a data clustering process, after the RP method, clusters with more spherical structure are created [11,12]. Comparing RP with PCA, it seems that the first has a better performance on eccentric data, where the latter might fail.
The main computational bottleneck of the RP is the orthonormalization of the random matrix R along with alternative random projection types with specific restrictions and choice. It has been shown that it is not necessary to generate the random matrix from a normal distribution. More efficient schemes have been proposed [8], imposing further computational benefits. Although these strategies may improve the RP method, however, it has been shown that this advantageous feature may be omitted when we perform an ensemble technique using multiple RP spaces [13]. A reasonable explanation is the fact that, in a high-dimensional data space, the random vectors tend to be near to orthogonal [14].

2.2. Random Projections for Ensemble Classification

An ensemble classification technique using random projections is proposed in [15], where the authors reported the reliability and efficiency of the concept, but without considering real high dimensional applications. Recently, a similar classification framework for high-dimensional data was proposed [13], providing evidence that the straightforward aggregation is not always sensible. They claimed that possible bad projections can negatively affect the ensemble classifier; as such, they proposed a methodology that minimizes the test error, closely related to the projection pursuit concept. Although these restrictions allow for the establishment of theoretical guarantees, several considerations arise for very high dimensional tasks with respect to computational complexity. More importantly, while these criteria reduce the data diversity [16], it may also reduce the benefits of an ensemble technique. In other words, the potentially bad projections may positively affect our prediction performance if considered under an ensemble classification strategy.
In this direction, it has been experimentally shown [7] that utilizing random projection ensembles along with a simplistic majority voting scheme on the classification results from all independent data spaces, we can achieve improved classification accuracy when tested on very high dimensional biomedical data, while simultaneously minimizing computational complexity.
Motivated by the promising early results [7] in this paper, we focus on extensively testing the performance of this approach for the task of single cell data classification which, due to its basic characteristics, seems like a best fit challenge, allowing us to expose its usefulness in similar small “n” large “p” tasks. Applying the MRPV framework on high-dimensional scRNA-seq data with high diversity regrading the sample size, we showed the scalability of the MRPV. Furthermore, we achieved reliable classification performance results by setting on the MPRV an extremely small fixed number for the projected dimensions, without following the restrictions of the classical random projection method. Additionally, we improved its accuracy when the MRPV incorporates the LDA classifier, by using a factor that regularizes the LDA operation (more details in the next section).

3. The Multiple Random Projection and Voting Methodology

The multiple random projection and voting (MRPV) framework consists of four main steps: (i) the creation of multiple random projected subspaces, (ii) the training phase of a given classifier for each space, (iii) the prediction of each test sample for the given classifier for each space and (iv) the final prediction of each sample by identifying the dominant class for each one through a majority voting scheme (see Figure 1).
Let A R n × d , be the initial experimental dataset with single-cell RNA-seq expression profiles. Rows (n) and columns (d) represent the cells (samples) and the genes (features or dimensions), respectively. Let A s × d t r a i n denote the s labeled samples data with d gene expressions used for training any classifier and A 1 × d t e s t denote the test sample. Note here, that we can use more than one test sample creating the corresponding matrix.
Initially, the random projected spaces are generated using normally distributed numbers. Let r be the projected dimensions ( r d ) for L independent subspaces. Applying the random projection method, we have to multiply L independent times the initial matrix with the random matrix R d × r . Instead of executing multiple multiplications, the MRPV framework reduces the execution time and the complexity of the required calculations. It calculates a single multiplication that projects the initial data to h dimensions, where h = r × l , while it isolates each r-dimensional space for L times by indexing the projected space. More specifically, the train data are calculated as:
B s × h R P t r a i n = A s × d t r a i n R d × h .
The similar framework is also applied in the test phase, where the projected data are calculated as:
B 1 × h R P t e s t = A 1 × d t e s t R d × h
The random matrix R d × h includes uniformly distributed random numbers in the interval ( 0 , 1 ) . Note here, that the random projection method offers several alternative strategies for the generated random matrix with each having its specific advantages. However, this feature is not included in the MRPV strategy since, as previously mentioned [13,14], it will add further complexity, which is not necessary on an ensemble framework and for initial data with extremely high dimensionality.
The size of the projected space in the random projection method affects the reliability of the projected space. The appropriate size is defined by the equation [17]:
r = 4 ε 2 / 2 ε 3 / 3 1 ln ( n )
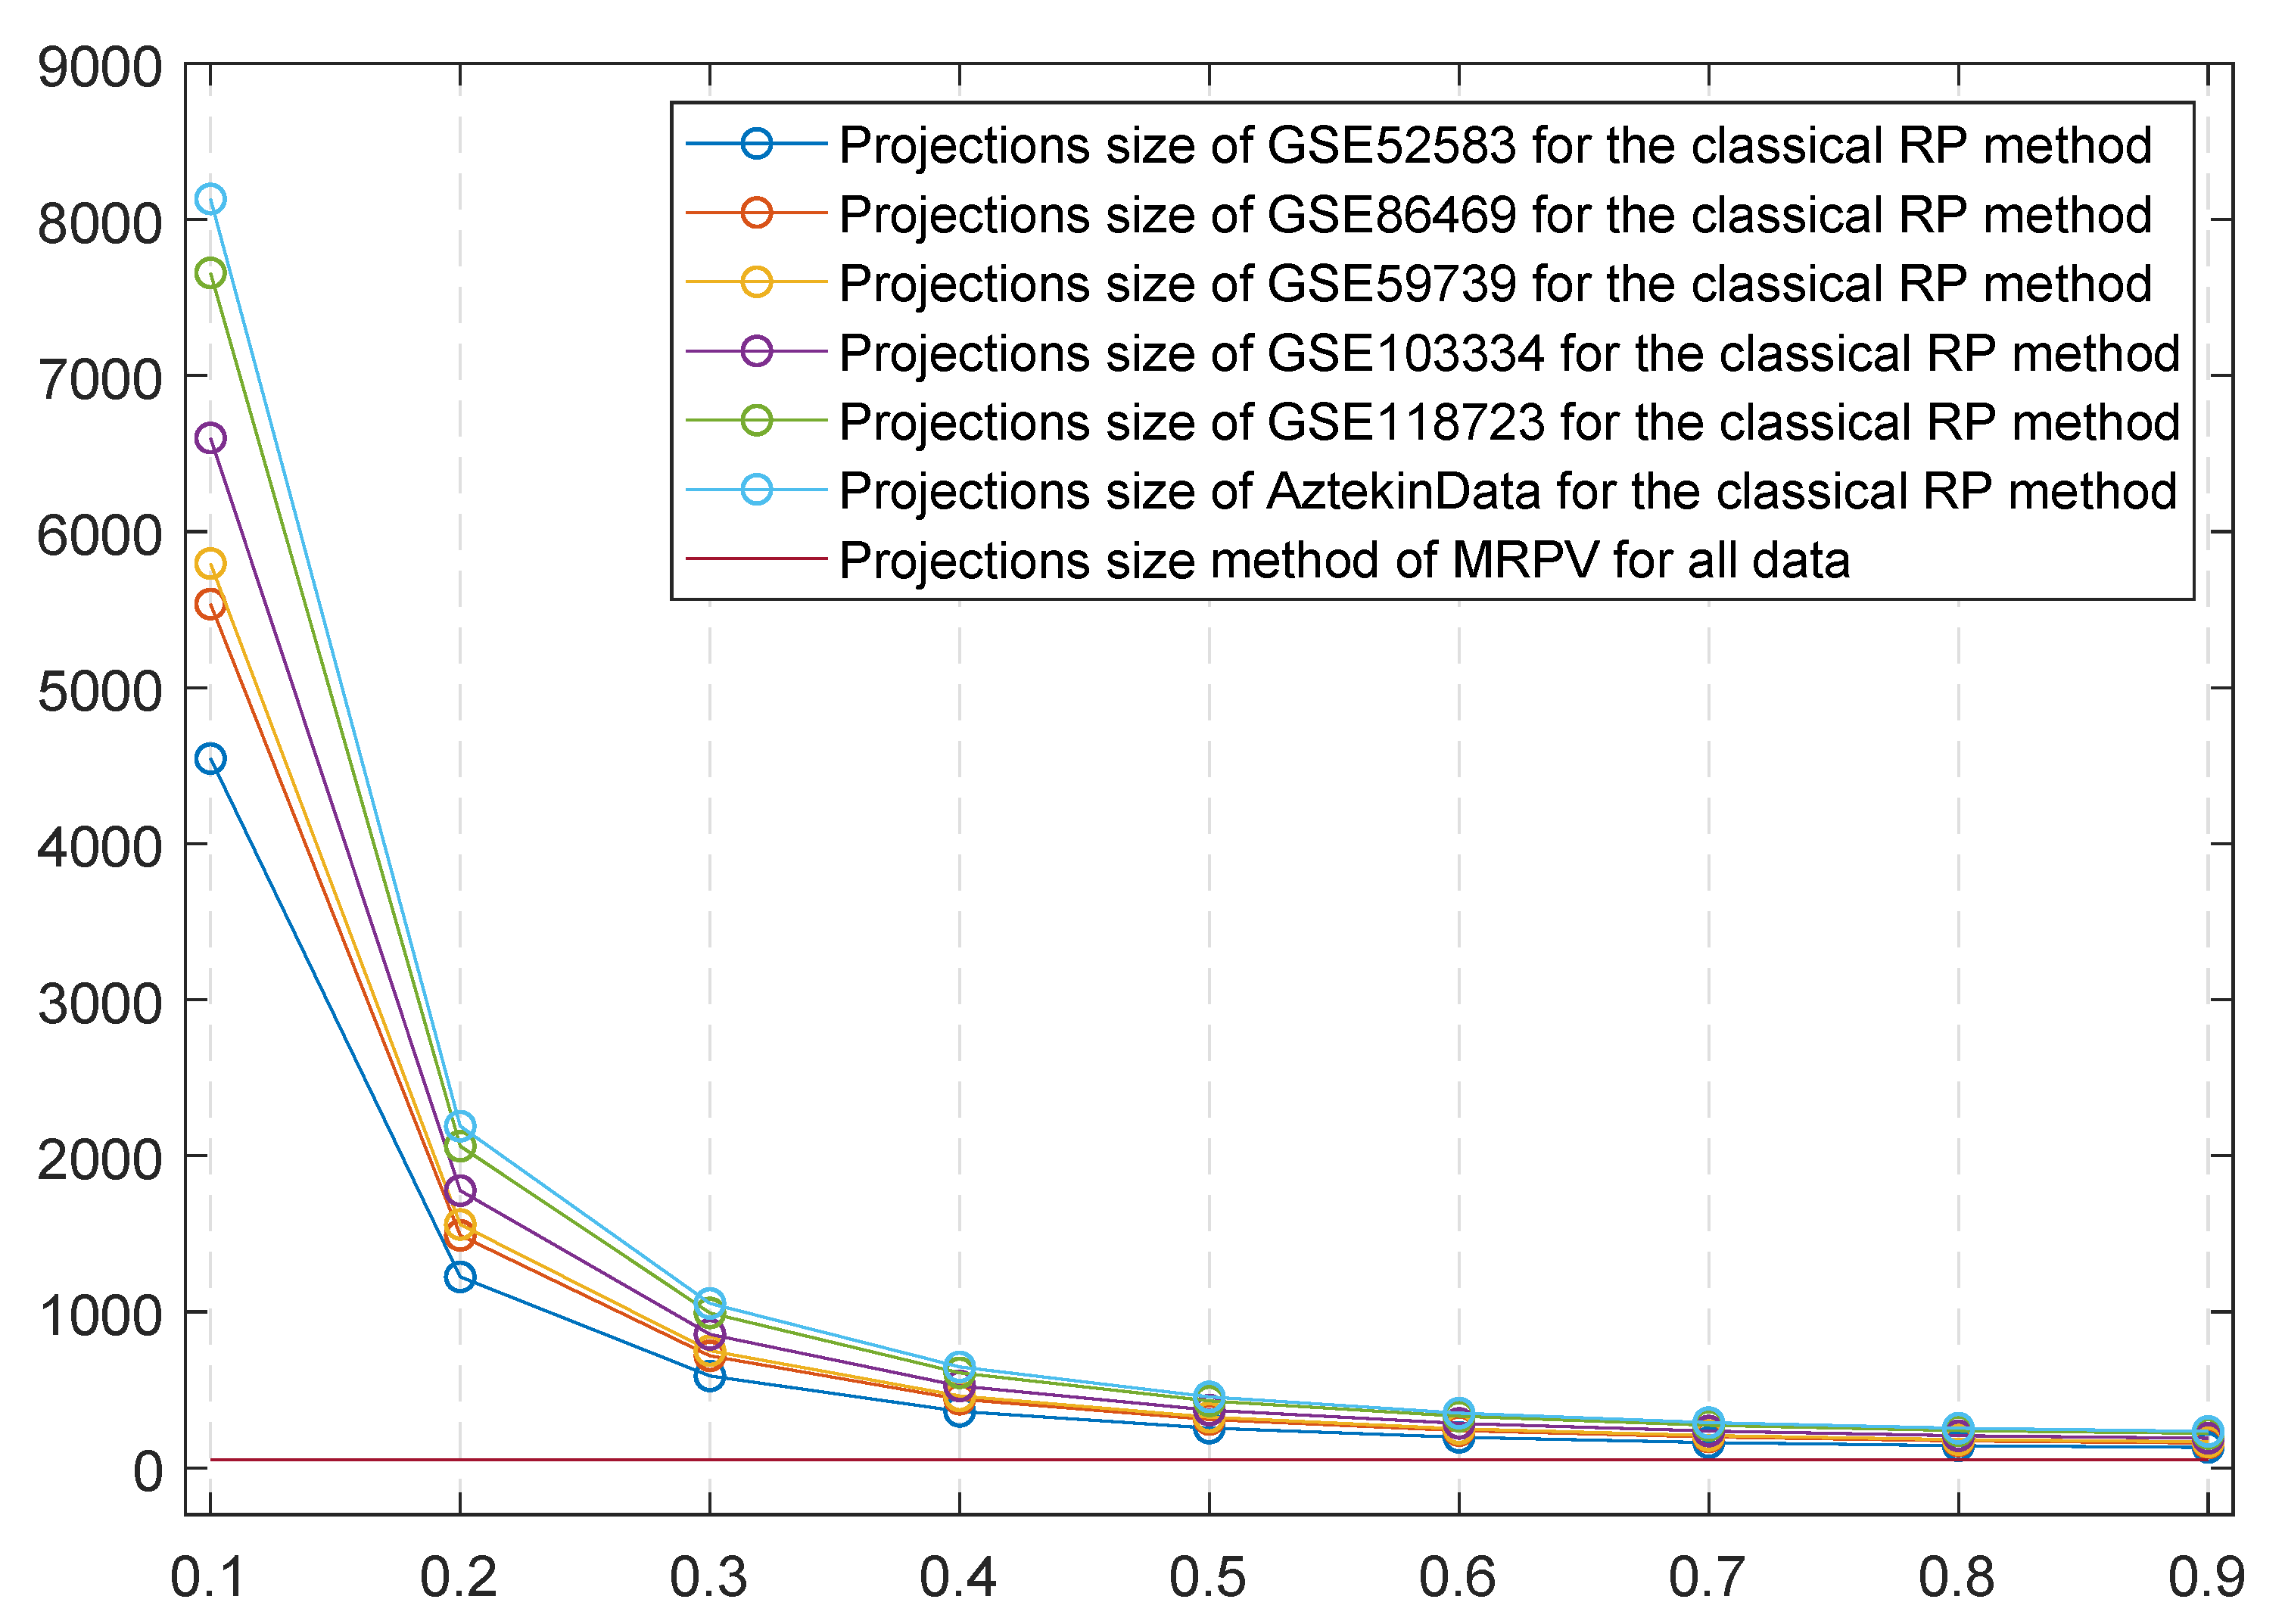
The variable n indicates the sample size while the parameter ε indicates the desired error of the projected space. The ε = 0.2 is an indicative value for simultaneously reliable projected space and rapid calculations. As the error ε increases, the size of the dimensions of the projections decreases (see Figure 2), losing its reliability. In the current study, we show that the MRPV framework can efficiently operate, bypassing the application of the above equation. Setting a fixed small value for the size of the dimensions (e.g., 50 dimensions), the MRPV classification performance has a similar behavior if compared to the MRPV classification performance using the size of the dimensions defined by the appropriate equation. This feature greatly improves the usability and applicability of MRPV, given the fact that, following the appropriate size determination (based on Equation (3)) for the projected subspaces, these remain high as the samples increase (see Figure 2). Through the stable size of the projected dimensions, we showed that using an ensemble technique by aggregating the knowledge from multiple projected spaces, as it is not necessary to follow the restrictions of the error, defined by Equation (3).
The multiple independent random projected spaces are given as inputs in the given base classifiers. We use two well-established classifiers, the kNN (k-nearest neighbors) and the LDA (Linear Discriminant Analysis), while we further add the RLDA (Regularized LDA), an option that allows for LDA implementation using the common full covariance matrix for all data classes, even in data with extremely high dimensionality. The KNN performs the well-known k-nearest-neighbor classification model [18]. For L independent projected spaces, the kNN is applied for all m test samples by exporting the class label of each sample at each space.
The classical LDA, in fact, performs a regularized LDA, where all categories (classes) have the common covariance matrix Σ ^ α = ( 1 α ) Σ ^ + α diag ( Σ ^ ) , with Σ ^ being the covariance matrix and α defining the regularization degree. For LDA in our analysis, we set α = 1 , utilizing a diagonal covariance matrix (the first term of the above equation zero), taking the diagonal elements of Σ ^ . Hence, all categories (classes) utilize the common diagonal covariance matrix Σ ^ 1 = diag ( Σ ^ ) .
This parameter is defined to achieve an applicable implementation in quite high dimensional data since the entire covariance matrix requires extra heavy computing resources. For this reason, we proposed the utilization of a regularized LDA version (RLDA) with α = 0 , which would otherwise be prohibitive for any mainstream powerful system. The MRPV capabilities allow for the application of the RLDA, in which all categories (classes) have the common pooled covariance matrix Σ ^ 0 = Σ ^ . The very low dimensional projections within the MRPV approach allows for the utilization of this strategy, even in data with extremely high dimensionality. For more details, see the MRPV pseudocode below (Algorithm 1). Also, MRPV is available on GitHub in MATLAB implementation (https://github.com/arisvrahatis/MRPV).
Algorithm 1 MRPV Pseudocode
Input: Data (A), RP spaces number (L), RP spaces dimensions (r), Classifier selection
Output: The class assignment V for each test point
1:
functionMRPV( A < s × d > t r a i n , A < s × d > t e s t , l a b e l s < s > , L , r )
2:
  Generate R < d × ( r × L ) >
3:
   B < s × ( r × L ) > t r a i n = A < s × d > t r a i n × R < d × ( r × L ) >
4:
   B < s × ( r × L ) > t e s t = A < s × d > t e s t × R < d × ( r × L ) >
5:
  for i i n 1 : L do
6:
    for j i n 1 : s do
7:
      C i , j = c l a s s i f i e r ( B i t r a i n , B i , j t e s t ) % (KNN, LDA, RLDA)
8:
      S i , j = l a b e l s P r o b a b i l i t y ( C i , j , l a b e l s )
9:
    end for
10:
  end for
11:
  for j i n 1 : s do
12:
     V j = P r e d o m i n a n t C l a s s ( S j )
13:
  end for
14:
  return V
15:
end function

4. Experimental Analysis

4.1. Dataset Description

For evaluation, we utilize six real transcriptomics datasets from single-cell RNA-seq studies (Table 1). Datasets were obtained from Gene Expression Omnibus (GEO), the widely-used database repository for high throughput gene expression data, except for the Aztekin dataset (hereafter referred to as AztekinData) obtained from the ‘’scrna” R Bioconductor package [19]. More specifically, the first dataset (accession number: GSE103334) has transcriptomic experimental data profiles for 23,951 genes from 2208 cells, separating in four different time periods [20]. Data came from time-point samples of the Mus musculus (mmu) organism, during the progression of neurodegeneration, (i) before p25 induction (0 weeks), (ii) 1 week, (iii) 2 weeks, and (iv) 6 weeks after p25 induction. The first three categories had 576 cell samples and the latter 480. The main scope of the analysis of these expression profiles by throughput sequencing at single-cell level was the temporal record of microglia activation in neurodegeneration.
The single-cell RNA seq data with accession number GSE86469, include gene expressions of 26,616 genes for 638 cell samples. These are samples from human pancreatic islets obtained from non-diabetic (ND) and type 2 diabetic (T2D) cadaveric organ donors. Here, the scope is to achieve the discrimination of ND and T2D cell types. The single-cell RNA seq data with accession numbers GSE59739 [22] and GSE52583 [23], contain single-cell RNA seq measurements for 25,333 and 23,228 genes, respectively. The measurements are on 854 and 201 samples, separated at 3 and 4 classes, respectively. Both sets of data are from mouse models (Mus musculus) as well as coming from lumbar dorsal root ganglion and distal lung epithelium cells, respectively. Furthermore, we add two large-scale datasets regarding their sample size to examine the MRPV performance in larger datasets with a high number of sample sizes. We selected the GSE118723 dataset [24], which measures 20,151 genes for 7584 cell samples to examine the variance QTLs in human-induced pluripotent stem cells. The AztekinData is the largest database in our analysis and contained 31,535 gene measurements for 13,199 cell samples of Xenopus tail organism. Both sets of data have multiclass cells samples with 6 and 5, respectively.

4.2. MRPV Performance Evaluation

The performance of the MRPV framework was evaluated against ten classification methods. We elected to employ popular and well-established tools for classification along with the utilized base classifiers either combined with regular dimensionality reduction through RP or not. Additionally, we used two cutting-edge classifiers tailored for scRNA-seq data. Τhe rationale behind the optimal selection of algorithms was to cover the entire range of various categorization types as well as to have a fair comparison that can expose whether there are any true benefits in utilizing MRPV against the basic RP method. In detail, we select the two basic classifiers utilized within MRPV (LDA and KNN), using the random projection method, a deep learning approach, a bootstrap aggregating (bagging), a tree-based classifier, and two cutting-edge classifiers tailored for single-cell RNA-seq data. We also include the traditional KNN and linear discriminant analysis classifiers.
Following this, we provide a brief description of each method along with their parameter selection. The KNN performs k-nearest-neighbor classification model [18] using the default parameters with Euclidean as distance measures, as well as the kdtree option as a search method for N = 5 nearest neighbors. For the classical LDA we apply the strategy which utilizes the common diagonal covariance matrix for all classes by setting α = 1 , while for the LDA, the parameter α was set to zero since we utilized the common full covariance matrix for all classes. Note here, that the classical LDA was not applied in the initial original data due to the huge computing resources demands exceeding a conventional computer infrastructure.
We compared our framework with RP-LDA, RP-KNN and RP-RLDA which perform LDA, KNN, and RLDA, respectively, on a single projected space, resulting by applying the standard random projection method. The size of the projected space is defined by Equation (3), using the parameter ε = 0.2 , to obtain a reliable error. Deep Neural Networks are utilized with four neural layers of 100 neurons each, one due to the high-dimensionality of the datasets. DNN was applied with hyperbolic tangent activation functions for each layer, while the softmax functions utilized the output layer. The training of the model was based on the ADAM [26] learning algorithm, using the value 0.001 for both β 1 and β 2 learning rate parameters.
The bagging approach performs an ensemble learning method for classification, using a bagging approach, which stands for bootstrap aggregation [27]. We selected a bagging technique without the random selections, which utilizes tree learners. The opposite strategy with random predictor selections at each split is performed by the Random Forests [28]. The Random Forests classification model was applied using 100 trees and the parameter m-try was set as the square root of the feature (gene) number for each set of data. We also applied the scReClassify [29] and scPred [30] with the default parameters defined by the authors.
Overall, the comparisons were made with: (a) LDA with the random projection method (RP-LDA), (b) KNN with the random projection method (RP-ΚNN), (c) RLDA with the random projection method (RP-RLDA), (d) KNN, (e) RLDA, (f) BAGGING, (g) RANDOM-FORESTS, (h) Deep Neural Network (DeepNN), (i) scReClassify, and (j) scPred.
Performance was assessed by measuring three indicative classification measures—namely, accuracy, specificity and F1-score—in order to have a clear view of the strengths and weaknesses of each method. All executions were made using the 10-fold cross validation process in 100 independent trials. Parameter setting for all methods besides MRPV was chosen based on a fitting procedure in order to optimize their performance. Minor variations for the selected values do not affect the results significantly and thus an extensive analysis is excluded. All algorithms were run with the corresponding default parameters. However, all algorithms, were rerun with different parameters, though no significant improvement was detected (Wilcoxon signed-rank test, p-value < 0.05).
Boxplots (see Figure 3, Figure 4 and Figure 5) depict the comparative results for all methods in all six datasets (scReClassify and scPred were not applicable to AztekinData, due to the high computational demands). The results were examined regarding the statistically significant difference among the MRPV approaches and all other algorithms. We applied the one-sample Kolmogorov–Smirnov test with p-value < 0.05 since the median differences between pairs of observations between MRPV frameworks, and each algorithm under investigation, follow non-normal distribution. The MRPV framework performed better in almost all cases and the difference was statistically significant in most cases (see Section 5).

5. Results and Discussion

We observe that all variations of MRPV are competitive against other methods for all datasets, while all the three MRPV-based algorithms suggest an improvement over the straightforward application of LDA, KNN, and RLDA in most cases. We interestingly observe that the proposed ensemble scheme suggests a more valuable integration of Random Projections than that of the basic RP method.
More specifically, for all three measures (Accuracy, Specificity, and F1-score), the MRPV-KNN had the best performance on GSE103334 with MRPV-LDA and MRPV-RLDA, overcoming their relevant methods (RP-LDA and RP-RLDA, respectively) in almost all cases. In all other datasets, the MRPV-RLDA outperforms all comparative methods with MRPV-LDA and MRPV-RLDA, having similar behavior as previously noted. In a few cases, we identify differences with no statistical significance (one-sample Kolmogorov–Smirnov test with p-value < 0.05), such as (i) MRPV-LDA vs. RP-LDA F1-score, MRPV-RLDA vs. RP-RLDA F1-score on GSE103334, (ii) MRPV-KNN vs. RP-KNN Accuracy and MRPV-KNN vs. KNN accuracy, specificity values for all MRPV frameworks vs. RP-based frameworks on GSE86469, (iii) MRPV-LDA vs. RP-LDA Accuracy, MRPV-KNN vs. RP-KNN Accuracy, MRPV-LDA vs. RP-LDA specificity and F1-score on GSE52583 dataset.
Note here that the MRPV framework creates projected spaces with only 50 dimensions where the original datasets have tens of thousands of dimensions, confirming the original hypothesis that high performance can be achieved even when significantly reducing the original dimensionality. We shown empirically that the MRPV framework applied with various random projection sizes starting in ascending order, its accuracy has an upward trajectory from one point onwards (approximately from 50 to 100 dimensions) the accuracy either falls or stabilizes (see Figure 6).
When comparing to the performance of the three well-established classifiers (Bagging, Random Forests, and Deep Neural Network) coming from diverse backgrounds, we conclude that the proposed approach still performs better, enhancing its reliability. Additionally, our MRPV-RLDA framework over-performs the two cutting-edge scRNA-seq-based tools (scReClassify, scPred) in almost all cases. The stability of the proposed methods is also a matter of interest when comparing to the other methods that present a wide dispersion.
An important feature of the MRPV framework is its significantly faster execution time compared to other tools (Table 2). Their execution (MRPV-LDA, MRPV-KNN, MRPV-RLDA) time is of the order of a few seconds, while the execution times of the Random Forests and Deep Neural Networks are 80 to 100 times longer. The MRPV framework is also 5 to 30 times faster in most cases, as compared to the RP-based (RP-LDA, RP-KNN, RP-RLDA) and the traditional (LDA, KNN, RLDA) tools. A significant difference also exists regarding the scReClassify and scPred methods. Τhis confirms the simplicity and the low computational effort required in random projections. Although in the RP-based algorithms one random projection is applied, our model is faster since, based on our assumptions, we perform projections in extremely small dimensions, where the simple random projection method cannot guarantee its reliability.
Considering the aforementioned results, we can clearly state that the proposed framework offers a promising approach in high dimensional data classification, while also suggesting great potential in minimizing computational complexity for many different classification approaches. Τhe results show that MRPV is a reliable framework that can efficiently tackle the “curse of dimensionality” aspect appearing in single-cell RNA-seq.
Furthermore, through the experimental analysis in six scRNA-seq data, we provided evidence that the most critical advantage of MRPV is the dramatic reduction in data dimensionality that allows for the utilization of computational demanding classifiers that are considered as non-practical in real-life applications. Note here that the MRPV framework also allows for the application of classification methods in ultra-high dimensional data, which otherwise would be prohibited (mainly due to memory limitations). On top of the previous findings [7,13] in this work, we justify the utilization of the random projection ensembles for the classification framework for biomedical applications, exposing its advantages over other very popular methods.

6. Conclusions

We dealt with the task of classifying single-cell RNA-seq data, which are characterized by ultra high dimensionality and, until now, are described by the “small n-large p” terminology. The main properties of MRPV are its simplicity, its computational speed, its scalability, and its accuracy, even on ultra-high dimensional data, rendering it as a reliable and robust tool. More specifically, we showed that the MRPV framework, based on multiple random projections in a lower-dimensional space and on ensemble approaches that aim to exploit the different data structures obtained by each random projected space enhance significantly the classification performance while simultaneously reducing the computational cost. The diversity imposed by projecting the original high dimensional data in a very low dimensional random space exposed the potential of improving the performance of several classifiers while allowing their applicability in otherwise prohibitive tasks. The performance of the MRPV framework was evaluated in six public real experimental high-throughput single-cell RNA-seq data with gene expression profiles. The classification results showed the superiority of the method against other similar or well-known tools. Additionally, we highlighted its scalability, since it efficiently operates in ultra-low dimensions regardless of the dimension length of the initial data.
Concluding, the behavior of MRPV imposes further theoretical developments towards this direction, but also practical solutions for classification that can take advantage of its parallel fashion. In addition, the increasing evolution of single-cell sequencing technologies is constantly creating large-scale data, thus adapting the MRPV framework to High-Performance Computing implementations which could offer even more promising results.

Author Contributions

A.G.V. conceived of the study, designed the classification methodological framework, implemented the experimental analysis of the classification framework and drafted the manuscript. S.K.T. designed and implemented the visualization methodological framework, contributed in the interpretation of the results and the manuscript draft. S.V.G. contributed in the design and implementation of figures and contributed in the interpretation of the results. All the above actions were supervised by V.P.P. All authors read and approved the final manuscript.

Funding

This research has been financially supported by the National Strategic Reference Framework (NSRF) Program with title: “Researcher Support with Emphasis on New Researches”, co-financed by Greece and the European Union—European Social Fund.

Conflicts of Interest

The authors declare no conflict of interest.

References

  1. Chen, X.W.; Lin, X. Big data deep learning: Challenges and perspectives. IEEE Access 2014, 2, 514–525. [Google Scholar] [CrossRef]
  2. Luo, J.; Wu, M.; Gopukumar, D.; Zhao, Y. Big data application in biomedical research and health care: A literature review. Biomed. Inform. Insights 2016, 8, BII-S31559. [Google Scholar] [CrossRef] [PubMed] [Green Version]
  3. Reuter, J.A.; Spacek, D.V.; Snyder, M.P. High-throughput sequencing technologies. Mol. Cell 2015, 58, 586–597. [Google Scholar] [CrossRef] [PubMed] [Green Version]
  4. Wetterstrand, K. DNA Sequencing Costs: Data-National Human Genome Research Institute (NHGRI). Available online: https://www.genome.gov/about-genomics/fact-sheets/DNA-Sequencing-Costs-Data (accessed on 27 October 2020).
  5. Tan, Y.; Cahan, P. SingleCellNet: A computational tool to classify single cell RNA-Seq data across platforms and across species. Cell Syst. 2019, 9, 207–213. [Google Scholar] [CrossRef]
  6. Vrahatis, A.G.; Tasoulis, S.K.; Maglogiannis, I.; Plagianakos, V.P. Recent Machine Learning Approaches for Single-Cell RNA-seq Data Analysis. In Advanced Computational Intelligence in Healthcare-7; Springer: Berlin/Heidelberg, Germany, 2020; pp. 65–79. [Google Scholar]
  7. Tasoulis, S.K.; Vrahatis, A.G.; Georgakopoulos, S.V.; Plagianakos, V.P. Biomedical Data Ensemble Classification using Random Projections. In Proceedings of the 2018 IEEE International Conference on Big Data (Big Data), Seattle, WA, USA, 10–13 December 2018; pp. 166–172. [Google Scholar]
  8. Achlioptas, D. Database-friendly random projections. In Proceedings of the Twentieth ACM Symposium on Principles of Database Systems, New York, NY, USA, 21–23 May 2001; pp. 274–281. [Google Scholar]
  9. Bingham, E.; Mannila, H. Random projection in dimensionality reduction: Applications to image and text data. In Proceedings of the Seventh ACM SIGKDD International Conference on Knowledge Discovery and Data Mining, New York, NY, USA, 26–29 August 2001; pp. 245–250. [Google Scholar]
  10. Papadimitriou, C.H.; Raghavan, P.; Tamaki, H.; Vempala, S. Latent semantic indexing: A probabilistic analysis. In Proceedings of the 17th ACM Symp. on the Principles of Database Systems, Seattle, WA, USA, 1–3 June 1998; pp. 159–168. [Google Scholar]
  11. Dasgupta, S. Learning Mixtures of Gaussians. Found. Comput. Sci. Annu. IEEE Symp. 1999, 634. [Google Scholar] [CrossRef]
  12. Dasgupta, S. Experiments with Random Projection. In Proceedings of the 16th Conference on Uncertainty in Artificial Intelligence, San Francisco, CA, USA, 30 June–3 July 2000; pp. 143–151. [Google Scholar]
  13. Cannings, T.I.; Samworth, R.J. Random-projection ensemble classification. J. R. Stat. Soc. Ser. B Stat. Methodol. 2017, 79, 959–1035. [Google Scholar] [CrossRef]
  14. Hecht-Nielsen, R. Context vectors: General purpose approximate meaning representations self-organized from raw data. Comput. Intell. Imitating Life 1994, 3, 43–56. [Google Scholar]
  15. Schclar, A.; Rokach, L. Random projection ensemble classifiers. In International Conference on Enterprise Information Systems; Springer: Berlin/Heidelberg, Germany, 2009; pp. 309–316. [Google Scholar]
  16. Kuncheva, L.I. Diversity in multiple classifier systems. Inf. Fusion 2005, 6, 3–4. [Google Scholar] [CrossRef]
  17. Dasgupta, S.; Gupta, A. An elementary proof of a theorem of Johnson and Lindenstrauss. Random Struct. Algor. 2003, 22, 60–65. [Google Scholar] [CrossRef]
  18. Altman, N.S. An introduction to kernel and nearest-neighbor nonparametric regression. Am. Stat. 1992, 46, 175–185. [Google Scholar]
  19. Risso, D.; Cole, M.; Risso, M.D. BiocStyle; biocViews ExperimentData; SequencingData. Package ‘scRNAseq’ 2020. Available online: https://bioconductor.riken.jp/packages/devel/data/experiment/manuals/scRNAseq/man/scRNAseq.pdf (accessed on 27 October 2020).
  20. Mathys, H.; Adaikkan, C.; Gao, F.; Young, J.Z.; Manet, E.; Hemberg, M.; De Jager, P.L.; Ransohoff, R.M.; Regev, A.; Tsai, L.H. Temporal tracking of microglia activation in neurodegeneration at single-cell resolution. Cell Rep. 2017, 21, 366–380. [Google Scholar] [CrossRef] [Green Version]
  21. Lawlor, N.; George, J.; Bolisetty, M.; Kursawe, R.; Sun, L.; Sivakamasundari, V.; Kycia, I.; Robson, P.; Stitzel, M.L. Single-cell transcriptomes identify human islet cell signatures and reveal cell-type–specific expression changes in type 2 diabetes. Genome Res. 2017, 27, 208–222. [Google Scholar] [CrossRef] [PubMed]
  22. Usoskin, D.; Furlan, A.; Islam, S.; Abdo, H.; Lönnerberg, P.; Lou, D.; Hjerling-Leffler, J.; Haeggström, J.; Kharchenko, O.; Kharchenko, P.V.; et al. Unbiased classification of sensory neuron types by large-scale single-cell RNA sequencing. Nat. Neurosci. 2015, 18, 145. [Google Scholar] [CrossRef] [PubMed]
  23. Treutlein, B.; Brownfield, D.G.; Wu, A.R.; Neff, N.F.; Mantalas, G.L.; Espinoza, F.H.; Desai, T.J.; Krasnow, M.A.; Quake, S.R. Reconstructing lineage hierarchies of the distal lung epithelium using single-cell RNA-seq. Nature 2014, 509, 371. [Google Scholar] [CrossRef] [PubMed] [Green Version]
  24. Sarkar, A.K.; Tung, P.Y.; Blischak, J.D.; Burnett, J.E.; Li, Y.I.; Stephens, M.; Gilad, Y. Discovery and characterization of variance QTLs in human induced pluripotent stem cells. PLoS Genet. 2019, 15, e1008045. [Google Scholar] [CrossRef] [Green Version]
  25. Aztekin, C.; Hiscock, T.; Marioni, J.; Gurdon, J.; Simons, B.; Jullien, J. Identification of a regeneration-organizing cell in the Xenopus tail. Science 2019, 364, 653–658. [Google Scholar] [CrossRef]
  26. Kingma, D.P.; Ba, J. Adam: A method for stochastic optimization. arXiv 2014, arXiv:1412.6980. [Google Scholar]
  27. Breiman, L. Bagging Predictors. Mach. Learn. 1996, 24, 123–140. [Google Scholar] [CrossRef] [Green Version]
  28. Breiman, L. Random forests. Mach. Learn. 2001, 45, 5–32. [Google Scholar] [CrossRef] [Green Version]
  29. Kim, T.; Lo, K.; Geddes, T.A.; Kim, H.J.; Yang, J.Y.H.; Yang, P. scReClassify: Post hoc cell type classification of single-cell rNA-seq data. BMC Genom. 2019, 20, 1–10. [Google Scholar] [CrossRef]
  30. Alquicira-Hernandez, J.; Sathe, A.; Ji, H.P.; Nguyen, Q.; Powell, J.E. scPred: Accurate supervised method for cell-type classification from single-cell RNA-seq data. Genome Biol. 2019, 20, 1–17. [Google Scholar]
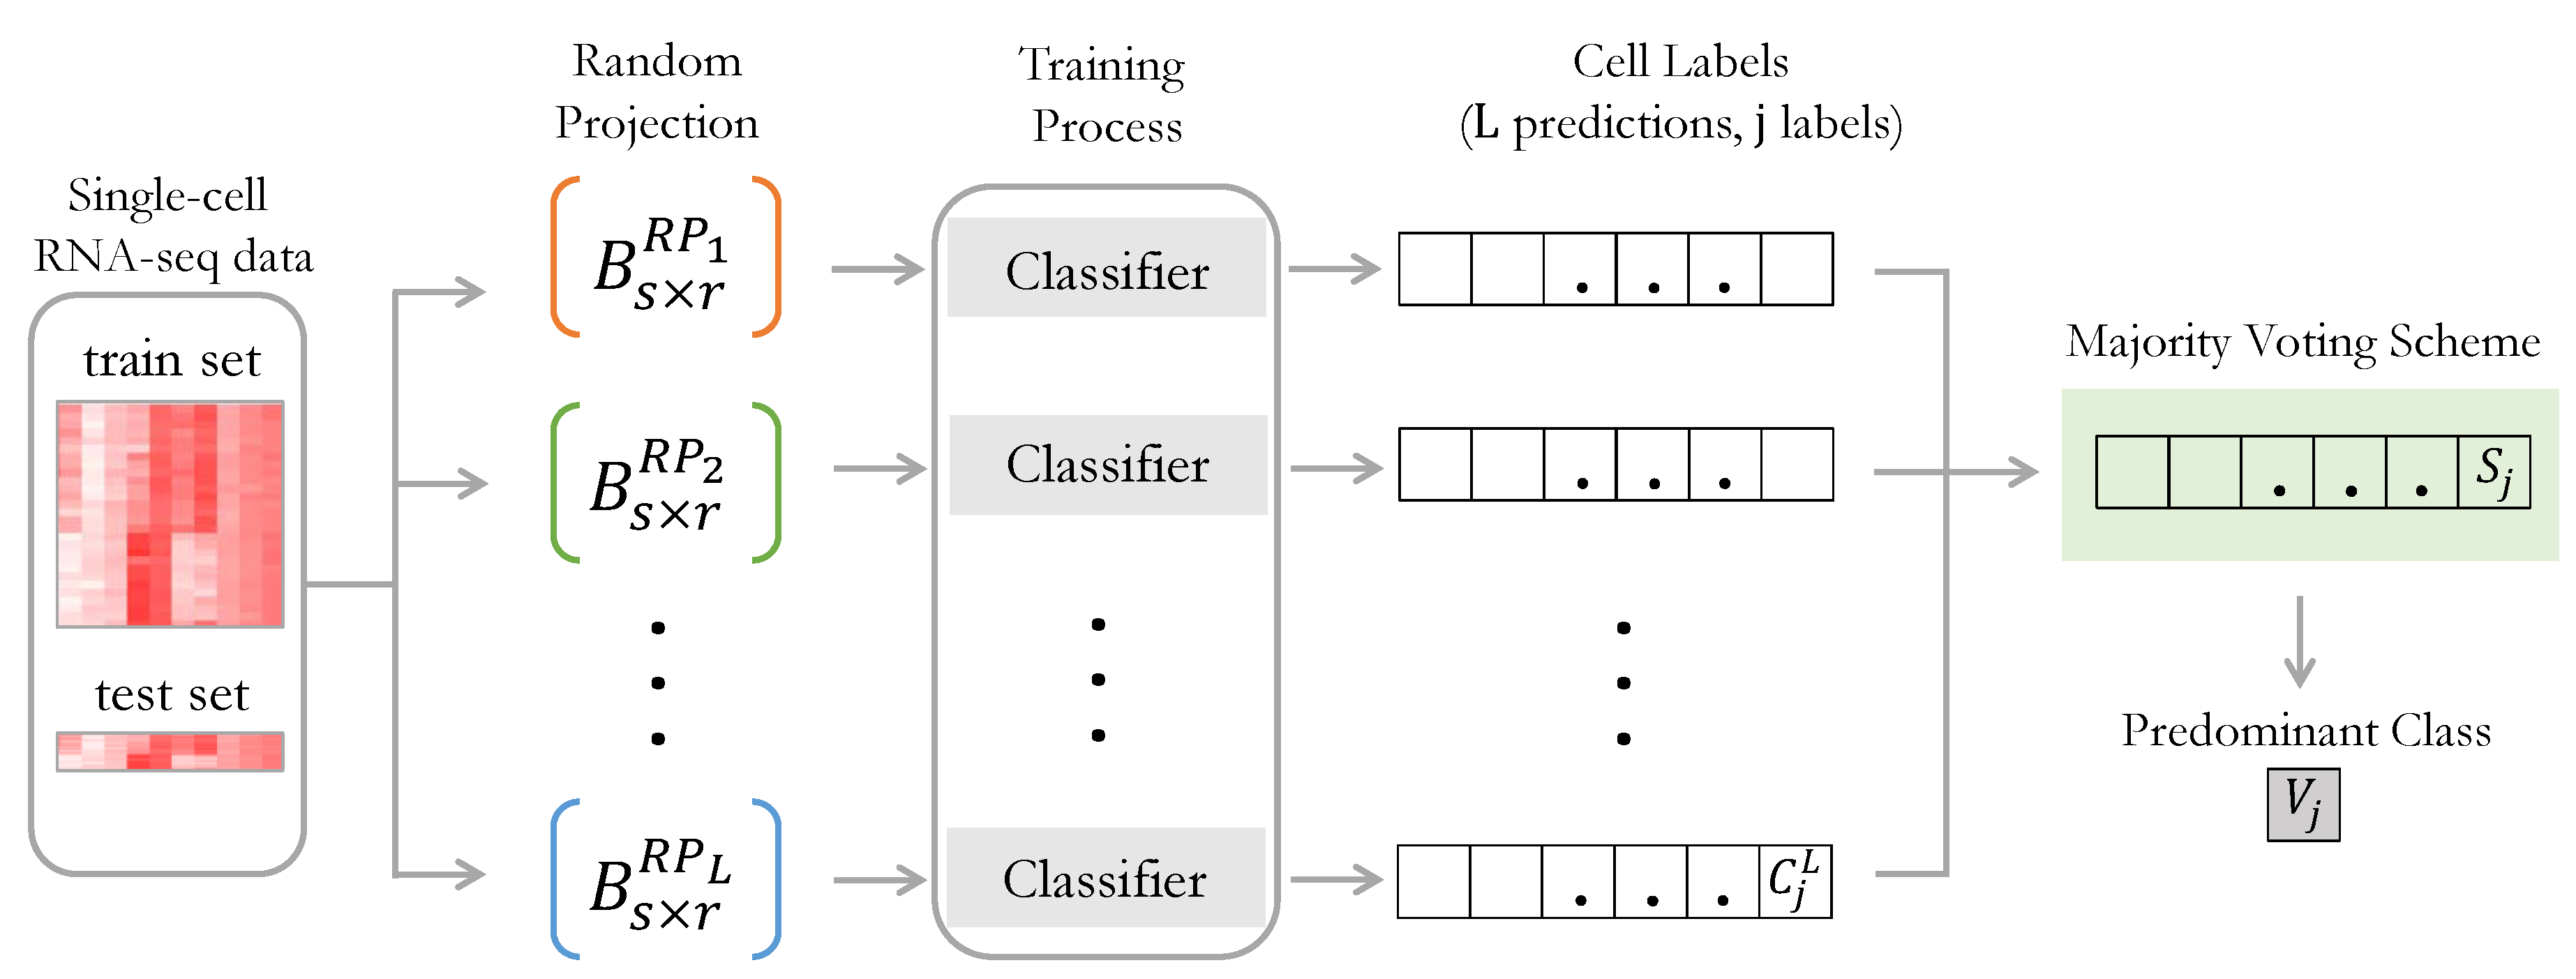
Figure 1. MRPV framework overview.
Information 11 00502 g001
Figure 2. The relation of the appropriate dimensions size for the data projection (y-axis) and the error value ε based on the Equation (3) (x-axis), using the classical Random Projections method. The green line indicates the fixed dimensional size of the MRPV framework (50 dimensions) for all data.
Information 11 00502 g002
Figure 3. Classification performance of the proposed MRPV framework (MRPV-LDA, MRPV-KNN, MRPV-RLDA) compared to other ten classification methods for the dataset GSE103334, GSE86469, GSE59739, GSE52583, GSE118723, and AztekinData. Evaluation testing is made by examining Accuracy. Boxplots imprint the values via 100 independent executions for each dataset.
Information 11 00502 g003
Figure 4. Classification performance of the proposed MRPV framework (MRPV-LDA, MRPV-KNN, MRPV-RLDA) compared to other ten classification methods for the datasets GSE103334, GSE86469, GSE59739, GSE52583, GSE118723, and AztekinData. Evaluation testing is made by examining Specificity. Boxplots imprint the values via 100 independent executions for each dataset.
Information 11 00502 g004
Figure 5. Classification performance of the proposed MRPV framework (MRPV-LDA, MRPV-KNN, MRPV-RLDA) compared to other ten classification methods for the datasets GSE103334, GSE86469, GSE59739, GSE52583, GSE118723, and AztekinData. Evaluation testing is made by examining F1-score. Boxplots imprint the values via 100 independent executions for each dataset.
Information 11 00502 g005
Figure 6. Error bars with the performance evaluation of the three MRPV-based algorithms accuracy (y-axis) in terms of the dimensions number selection (x-axis) of the random projection spaces. Starting from quite a small number of dimensions, we notice that the accuracy performance increases as the dimensions increase and, after one point (about 30 to 50 dimensions), the accuracy performance stabilizes. So, it can be concluded that the MRPV model works well in the small dimensions without having to project the initial data to higher dimensions.
Information 11 00502 g006
Table 1. Attributes of transcriptomics experimental data.
GEO DatasetTypeDimensionsSamplesClassesReferences
GSE103334scRNA-seq23,95122084[20]
GSE86469scRNA-seq26,6166382[21]
GSE59739scRNA-seq25,3338543[22]
GSE52583scRNA-seq23,2282014[23]
GSE118723scRNA-seq20,15175846[24]
AztekinDatascRNA-seq31,53513,1995[25]
Table 2. Mean and standard deviation (STD) values of the computational time performance of MRPV frameworks along with the other ten similar algorithms used as comparative evaluation in the current work. All algorithms have been executed 100 times independently for all six single-cell RNA-seq dataset (scReClassify and scPred were not applicable to AztekinData, due to the high computational demands). It is observed that our framework has the shortest execution times, especially the MRPV-KNN. Τhis confirms the simplicity and the low computational effort required in random projections. Although in the RP-based algorithms one random projection is applied, our model is faster since, based on our assumptions, we perform projections in extremely small dimensions, where the simple random projection method cannot guarantee its reliability.
GSE103334GSE52583GSE59739GSE86469GSE118723AztekinData
MEAN (Sth)MEAN (Sth)MEAN (Sth)MEAN(Sth)MEAN (Sth)MEAN (Sth)
MRPV-LDA1.2 × 10 + 00 (0.47)6.8 × 10 01 (0.01)8.9 × 10 01 (0.02)8.0 × 10 01 (0.01)5.7 × 10 + 00 (1.13)1.1 × 10 + 01 (13.0)
MRPV-KNN1.3 × 10 + 00 (0.13)4.3 × 10 01 (0.01)7.2 × 10 01 (0.00)6.7 × 10 01 (0.02)1.0 × 10 + 01 (1.10)2.9 × 10 + 01 (2.32)
MRPV-RLDA8.3 × 10 01 (0.46)6.5 × 10 01 (0.13)8.1 × 10 01 (0.04)7.7 × 10 01 (0.03)6.1 × 10 + 00 (1.20)1.1 × 10 + 01 (3.18)
RP-LDA3.7 × 10 + 01 (10.1)2.1 × 10 + 00 (0.03)9.1 × 10 + 00 (0.1)6.2 × 10 + 00 (0.05)6.8 × 10 + 01 (5.32)1.1 × 10 + 02 (14.9)
RP-KNN8.3 × 10 + 00 (3.58)1.1 × 10 + 00 (0.02)3.4 × 10 + 00 (0.09)2.8 × 10 + 00 (0.03)4.8 × 10 + 01 (7.12)1.5 × 10 + 02 (12.4)
RP-RLDA3.6 × 10 + 01 (0.48)3.3 × 10 01 (0.30)9.6 × 10 + 00 (0.29)5.6 × 10 + 00 (1.95)7.5 × 10 + 01 (15.2)1.3 × 10 + 02 (22.4)
KNN5.9 × 10 + 01 (17.6)1.0 × 10 + 01 (0.01)1.2 × 10 + 01 (0.03)7.8 × 10 + 01 (0.03)1.0 × 10 + 03 (65.2)2.4 × 10 + 03 (78.9)
LDA4.4 × 10 + 02 (16.2)6.0 × 10 + 01 (0.49)1.9 × 10 + 01 (1.80)1.3 × 10 + 01 (4.68)6.8 × 10 + 02 (45.5)1.7 × 10 + 03 (55.6)
BAGGING3.1 × 10 + 02 (2.18)3.1 × 10 + 01 (0.22)1.2 × 10 + 02 (0.47)9.7 × 10 + 01 (0.19)4.2 × 10 + 02 (39.2)1.5 × 10 + 03 (95.3)
RF9.5 × 10 + 02 (25.2)2.4 × 10 + 01 (0.05)2.2 × 10 + 02 (1.58)1.6 × 10 + 02 (0.43)1.7 × 10 + 03 (95.6)5.4 × 10 + 03 (25.2)
DeepNN9.2 × 10 + 03 (85.5)5.0 × 10 + 02 (40.2)7.6 × 10 + 02 (47.4)6.2 × 10 + 02 (68.8)6.9 × 10 + 02 (34.3)2.2 × 10 + 03 (31.4)
scReClassify1.5 × 10 + 02 (13.5)1.8 × 10 + 00 (0.10)8.1 × 10 + 00 (1.44)4.4 × 10 + 00 (1.18)3.0 × 10 + 02 (51.2)Ν/Α
scPred7.9 × 10 + 01 (5.15)6.1 × 10 + 00 (1.21)1.3 × 10 + 01 (2.30)7.1 × 10 + 00 (1.48)1.8 × 10 + 02 (23.6)Ν/Α
Publisher’s Note: MDPI stays neutral with regard to jurisdictional claims in published maps and institutional affiliations.